Article

Preparation of Soybean Dreg-Based Biochar@TiO2 Composites and the Photocatalytic Degradation of Aflatoxin B1 Exposed to Simulated Sunlight Irradiation

by
Jian Zhang
1,
Zhiwei Ying
2,
He Li
2,3,
Xinqi Liu
2,3,*,
Dongge Ma
4 and
Hailong Yu
5,*
1
Department of Nutrition and Health, China Agricultural University, Beijing 100193, China
2
School of Food and Health, Beijing Technology and Business University, Beijing 100048, China
3
National Soybean Processing Industry Technology Innovation Center, Beijing Technology and Business University, Beijing 100048, China
4
Department of Chemistry, College of Chemistry and Materials Engineering, Beijing Technology and Business University, Beijing 100048, China
5
College of Bioengineering, Beijing Polytechnic, Beijing 100176, China
*
Authors to whom correspondence should be addressed.
Toxins 2024, 16(10), 429; https://doi.org/10.3390/toxins16100429 (registering DOI)
Submission received: 6 September 2024 / Revised: 28 September 2024 / Accepted: 1 October 2024 / Published: 5 October 2024
(This article belongs to the Collection Aflatoxins)

Abstract

:
Aflatoxin B1 (AFB1) is a highly toxic carcinogen severely harmful to humans and animals. This study fabricated SDB-6-K-9@TiO2 composites via the hydrothermal synthesis method to reduce AFB1. The structural characterization results of the photocatalytic composites showed that TiO2 was successfully loaded onto SDB-6-K-9. The different photocatalytic degradation conditions, photocatalyst kinetics, recycling performance, and photocatalytic degradation mechanism were investigated. Photocatalysis with 6 mg of 4%SDB-6-K-9@TiO2 in a 100 μg/mL AFB1 solution presented a reduction of over 95%, exhibiting excellent performance, high stability, and reusability even after five cycles of photocatalytic experiments. Active species trapping experiments confirmed that holes (h+) played the most critical role. After structural analysis and identification of the photocatalytic degradation products, the photodegradation path and photocatalytic oxidation mechanism of 4%SDB-6-K-9@TiO2 were postulated. The results show a new way to improve TiO2’s photocatalytic performance, providing a certain theoretical basis for the effective AFB1 reduction.
Key Contribution: The SDB-6-K-9@TiO2 composites, fabricated via hydrothermal synthesis, demonstrated enhanced AFB1 reduction efficiency, with holes playing a crucial role in the degradation process; the photocatalyst also exhibited excellent performance, high stability, and reusability.

1. Introduction

Mycotoxin contamination is a significant global safety issue. Aflatoxin is a secondary metabolite produced by fungi and a harmful biological pollutant. Due to its high toxicity, teratogenicity, carcinogenicity, and mutagenicity, aflatoxin B1 (AFB1) has been listed as one of the strongest carcinogens by the International Agency for Research on Cancer (IARC) [1]. AFB1 poses a considerable threat to human health and the environment by spreading via the food chain. Therefore, the effective removal of aflatoxin presents a challenge for the development of the food industry. Traditional mycotoxin detoxification strategies are primarily divided into physical, chemical, and biological methods [2]. Although these techniques can remove aflatoxin to a certain extent, they remain limited. Since physical methods like adsorption and ultraviolet irradiation are simple to execute, they have been widely used in practical applications [3,4,5]. However, adsorption methods cannot decompose AFB1 effectively to reduce its impact on the environment and human health, while long-term ultraviolet irradiation may destroy the nutritional composition of food, resulting in safety issues [6]. Moreover, precise quantification and analysis of AFB1 are crucial, with the main detection methods currently including chromatographic techniques, spectrophotometry, and the combination of electrochemical immunosensing with chromatography [7], providing effective means for the detection and analysis of AFB1. Therefore, the increasing awareness of food safety and environmental pollution necessitates the development of efficient, feasible aflatoxin degradation technology.
Studies have demonstrated the efficacy of photocatalysis in removing organic pollutants due to its strong operational feasibility, the absence of secondary pollution, environmental friendliness, and cost efficiency. Consequently, it shows potential as an effective alternative for AFB1 degradation [8,9]. However, the disadvantages of low photocatalytic efficiency and an unclear mechanism significantly limit the extensive application of photocatalytic technology. As a typical semiconductor material, titanium dioxide (TiO2) plays an important role in the photocatalytic degradation of organic pollutants due to its strong oxidation ability, high chemical stability, and low cost [10]. However, the wide gap of TiO2 (rutile type = 3.0 eV, anatase type = 3.2 eV), fast electron-hole (h+) recombination, poor absorbability, and low visible light utilization limit its practical application [11]. Since sunlight contains only about 5% ultraviolet light, TiO2 is incapable of photocatalytic activity in sunlight energy exceeding 95% [12].
Extensive research has investigated new photocatalytic composites to resolve these problems, combining two or more materials to reduce the photoexcitation energy and improve photocatalytic performance. The immobilization of TiO2 on porous materials such as magnetic materials, zeolites, and clay can overcome some of the above shortcomings [13]. The effective loading of metal oxides on the surfaces of TiO2 particles can reduce the band gap [14], while non-metallic C and N element loading can change the energy level structure and the formation of new doped energy levels [15,16,17]. C loading is more successful in reducing the band gap and increasing the safety of most porous composite materials than metal oxide and N loading.
TiO2 composites with carbon-based materials (active carbon (AC), graphene, graphene oxide (GO), reduced graphene oxide (rGO), and multi-walled carbon nanotubes (MWCNT)) can stimulate electron transfer and exhibit better photocatalytic degradation activity [18,19,20,21]. Zhang et al. synthesized TiO2/pBC supported on a reed straw biochar (acid pretreated) using a sol–gel method and demonstrated, in heterogeneous photocatalysis towards sulfamethoxazole (SMX), stable photocatalytic activity [22]. Peñas-Garzón et al. investigated the degradation of three emerging pollutants (acetaminophen, ibuprofen, and antipyrine) in water using different catalysts with TiO2/AC heterostructures in simulated sunlight. The results showed that ibuprofen was the easiest to remove and disappeared completely within 3 h [23]. Zhu et al. prepared three different photocatalysts, indicating that Congo red displayed the best removal performance in simulated sunlight and visible light irradiation [13]. Sun et al. synthesized magnetic GO/TiO2 (MGO/TiO2) nanocomposites to reduce AFB1 in corn oil, which reached 96.4% after UV-vis irradiation for 120 min [21]. Compared with other carbon-based materials, the weak conductivity of AC may affect photoelectron transfer efficiency. However, its extensive specific surface area, excellent pore structure, and abundant organic functional groups on the surface effectively promote organic pollutant absorption and stimulate photocatalytic oxidation [24]. Biochar is an excellent adsorbent and catalyst carrier for removing organic pollutants because of its excellent properties similar to AC [25]. It effectively improves electron transport via dense carbon layers, oxidative and reductive groups for electron storage, charge separation, and active surface group sites, promoting the synergistic effect of adsorption and photocatalysis. The important applications of biochar as an electrochemical enhancer and anchoring system in immunosensors also suggest that its structural characteristics, conductivity, and electron transfer capabilities hold potential for environmental remediation and the removal of organic pollutants [26,27]. Biochar can be prepared from almost any biomass, including organic raw materials or waste, providing an effective method for extensive organic matter utilization.
This study used the prepared SDB-6-K-9 as a carrier to synthesize SDB-6-K-9@TiO2 composites via hydrothermal synthesis. The morphological, structural, and optical properties of the SDB-6-K-9@TiO2 composites were examined. This research also investigated the effect of different SDB-6-K-9@TiO2 composites, photocatalytic dosage, initial AFB1 concentration, and irradiation time on the photocatalytic impact of AFB1. The photocatalytic degradation kinetics and products were analyzed, and the photocatalytic degradation pathway and AFB1 mechanism were postulated.

2. Results and Discussion

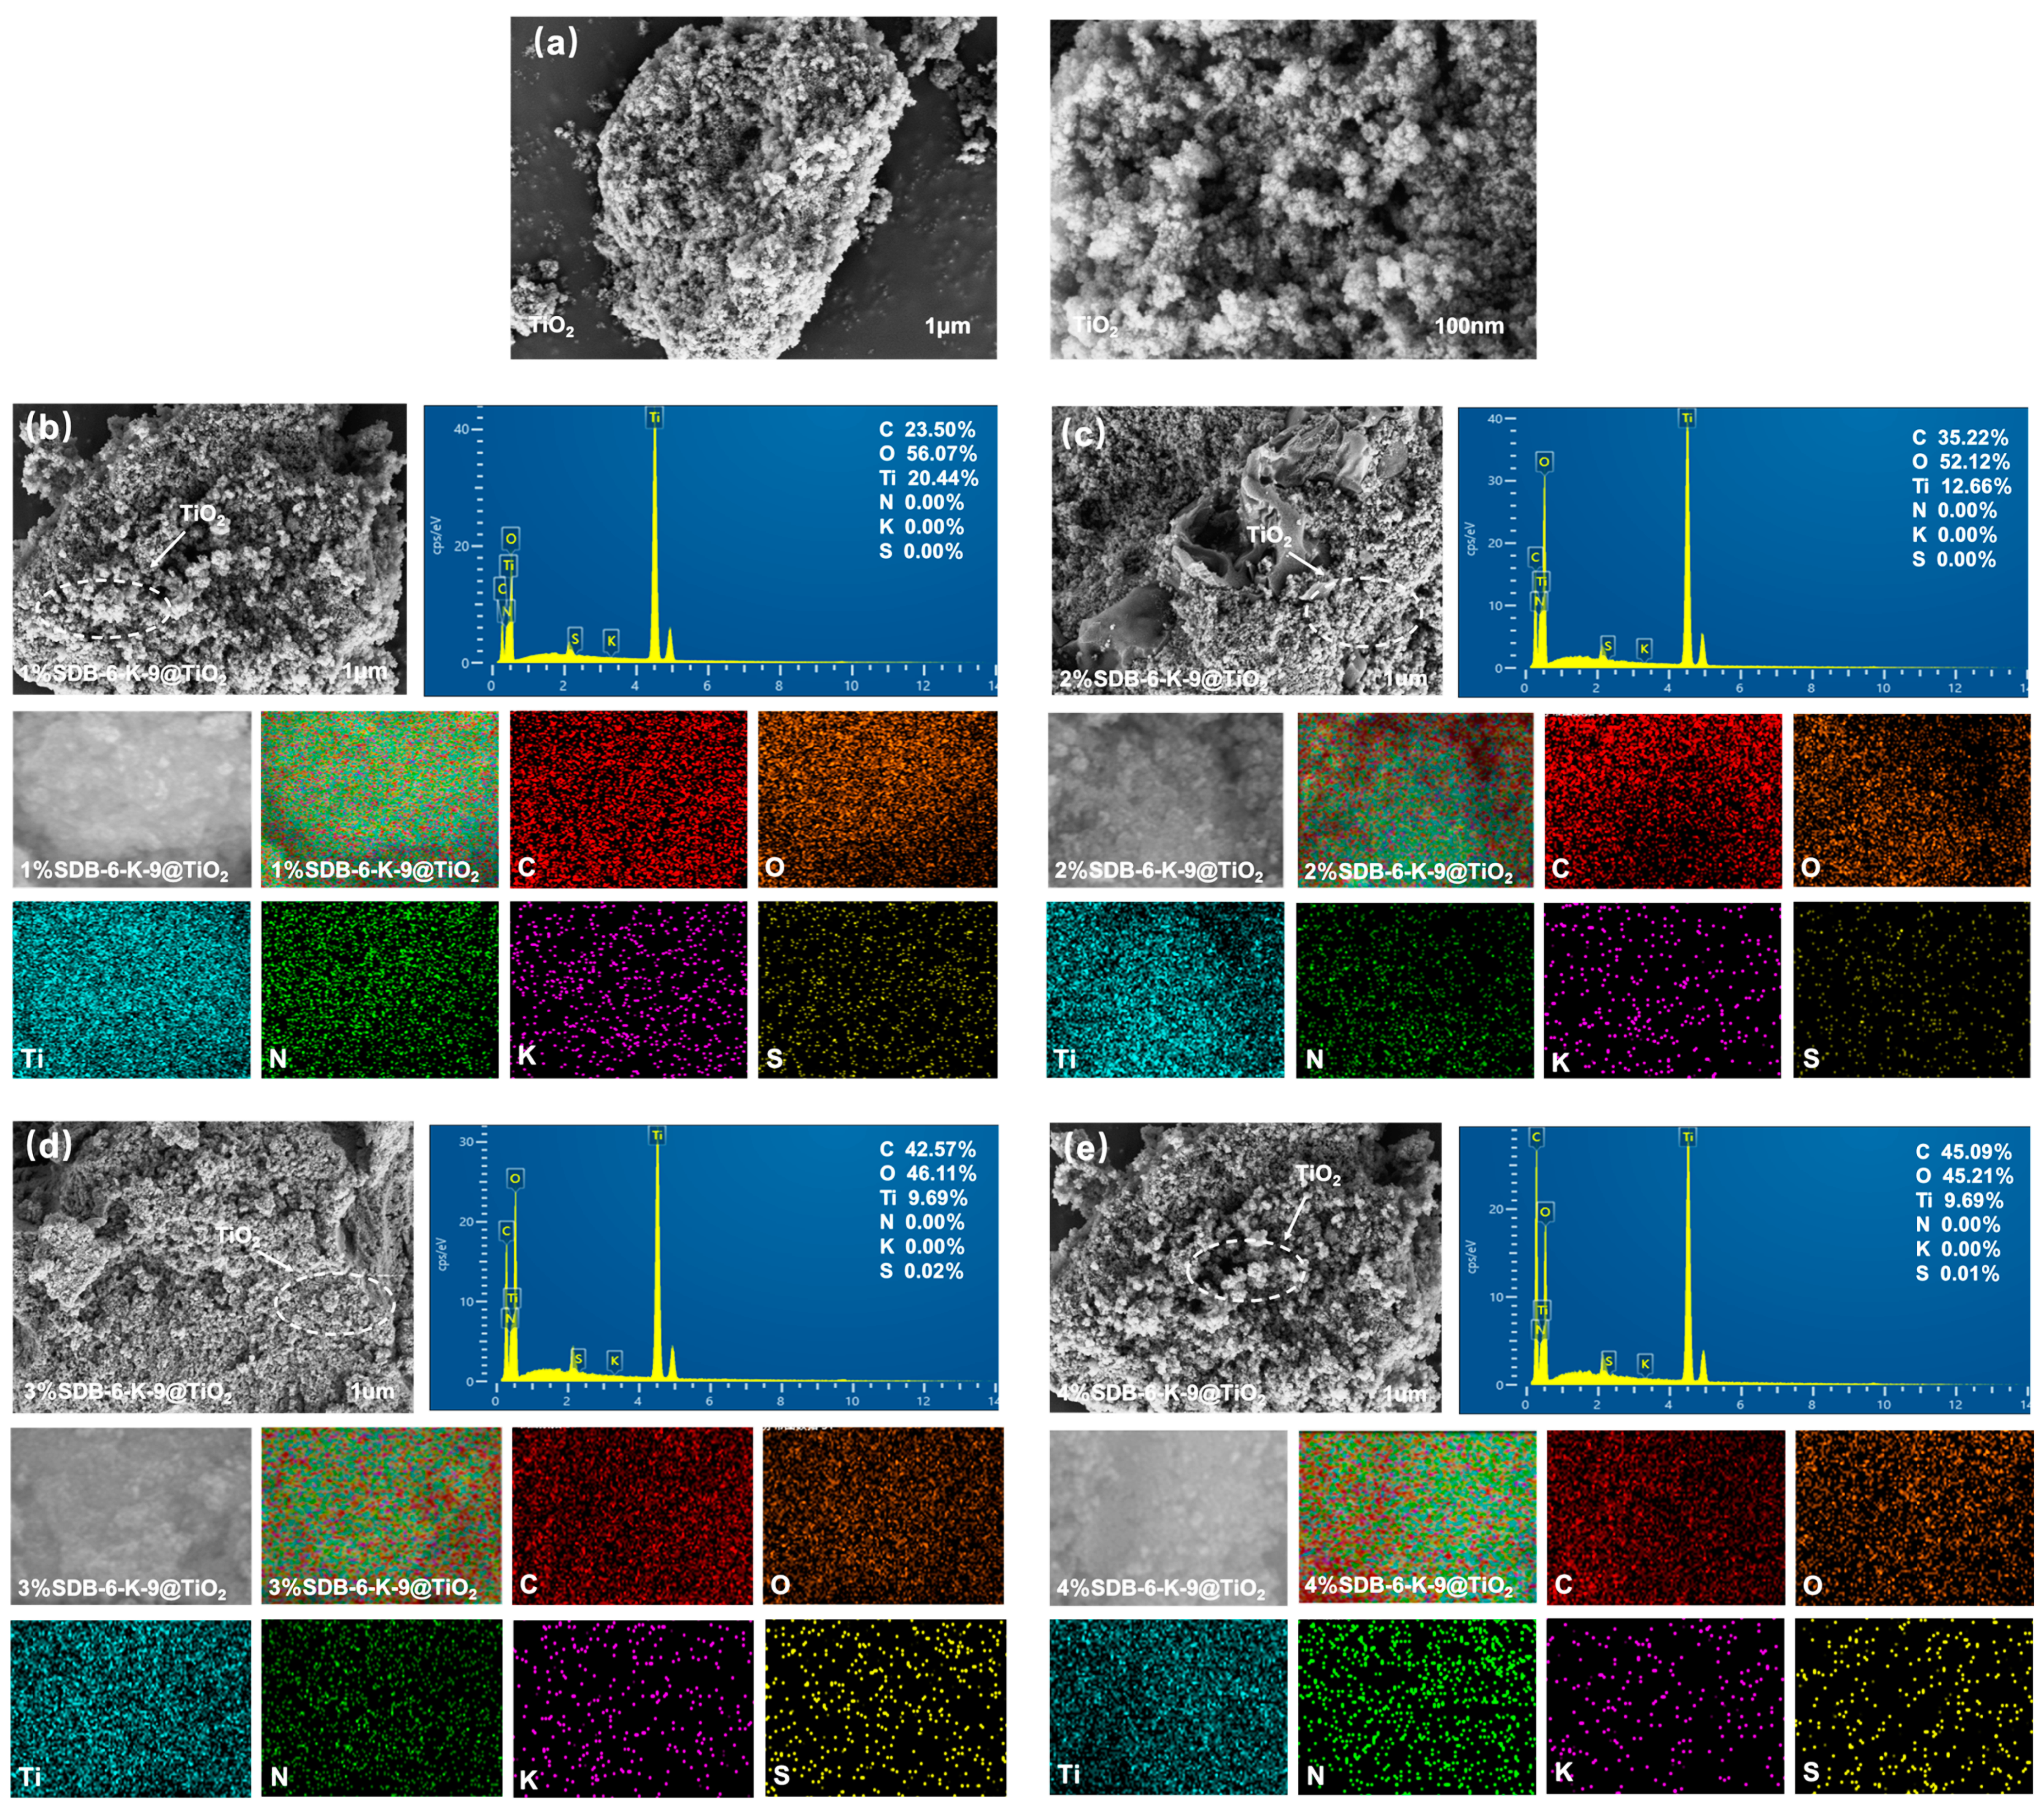
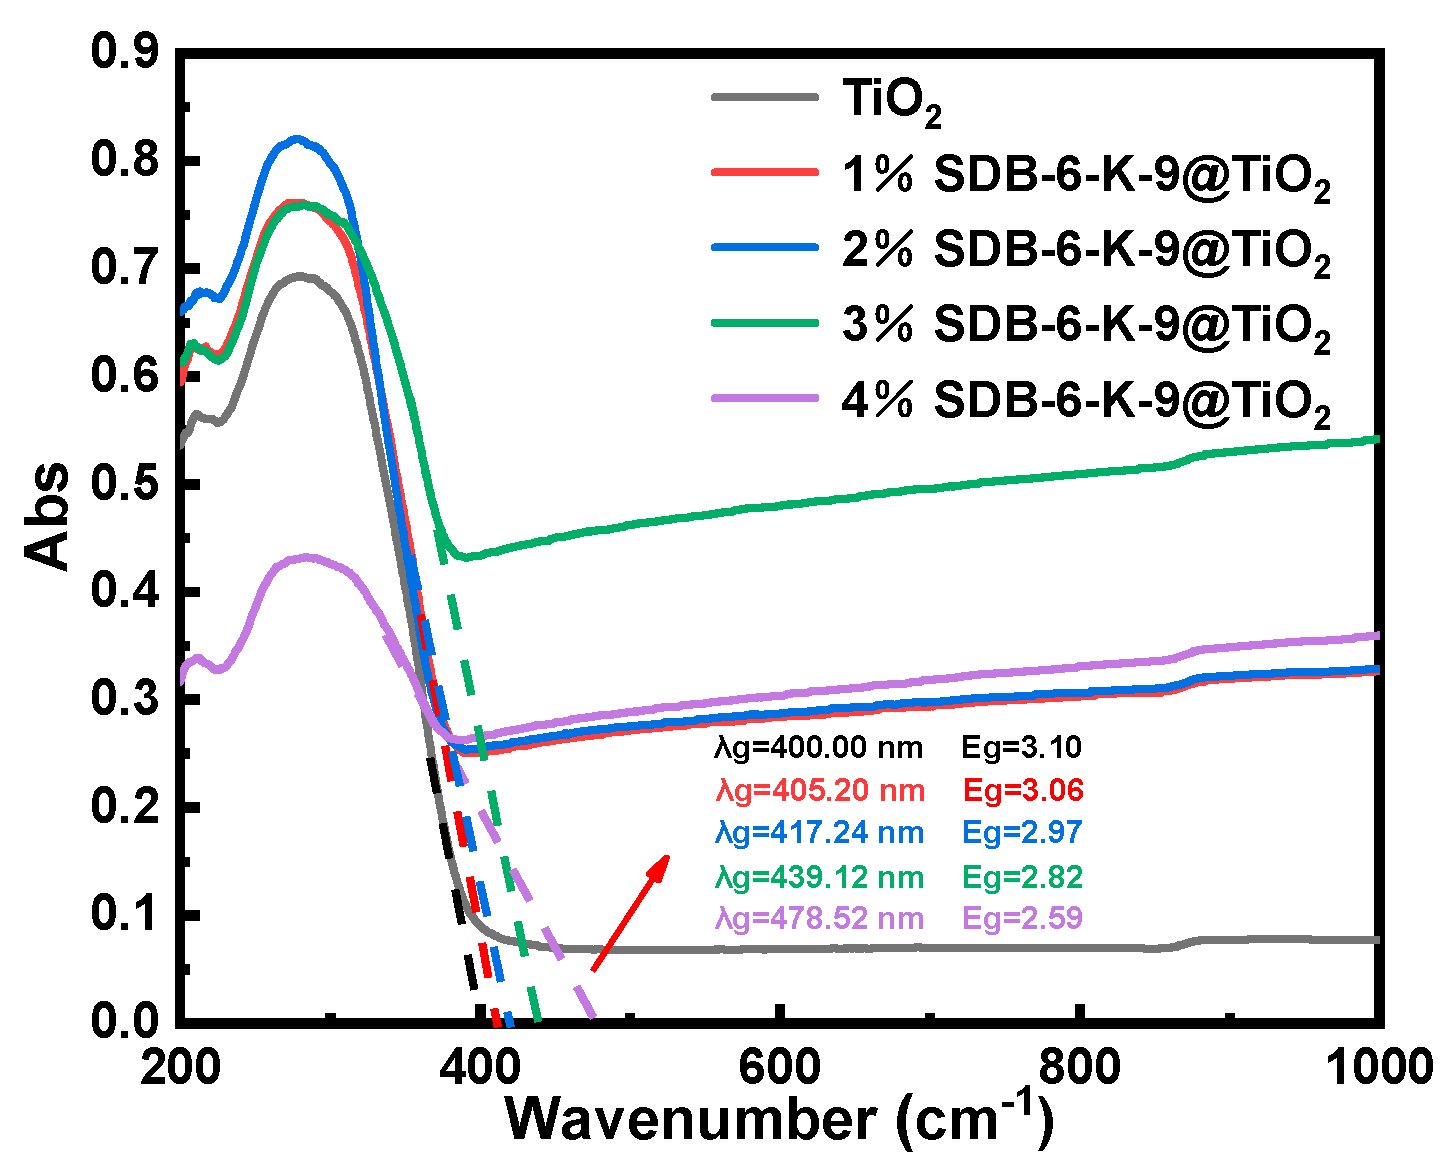
2.1. The Photocatalytic Characteristics

The N2 adsorption–desorption isotherms of the TiO2 and SDB-6-K-9@TiO2 composites are shown in Figure 1a. From the shape, it can be concluded that the TiO2 and SDB-6-K-9@TiO2 composites present type IV isotherms and H1 hysteresis loops. A distinct hysteresis curve was evident at a relative pressure of 0.5 < P/P0 < 1.0, indicating the presence of mesopores. Furthermore, 4%SDB-6-K-9@TiO2 displayed the highest nitrogen adsorption and desorption capacity, indicating that it had the largest specific surface area. As shown in Figure 1b, the pore size distribution of the TiO2 and SDB-6-K-9@TiO2 composites were mainly concentrated in a range of 1 nm–10 nm, which was consistent with the isothermal adsorption and desorption curve analysis results, indicating the presence of microporous and mesoporous structures.
The parameter values of the specific surface area, pore volume, and average pore size are listed in Table 1. TiO2 had a specific surface area of 174.909 m2/g, a pore volume of 0.5812 cm3/g, and an average pore size of 1.329 nm, indicating an excellent pore structure. At a higher SDB-6-K-9 percentage, the surface area and pore volume also increased, but decreased at a higher TiO2 percentage. This was consistent with the decline previously observed in other biocomposites [28,29]. The specific surface area increased from 294.568 m2/g to 642.644 m2/g, while the pore volume increased from 0.5313 cm3/g to 0.7799 cm3/g. Moreover, the average pore size of the SDB-6-K-9@TiO2 composite was large enough to absorb AFB1 molecules (the molecular size of AFB1: length of the three sides, 1.2620 nm, 1.0968 nm, and 0.5891 nm) [30,31]. The results show that effectively combining SDB-6-K-9 and TiO2 promoted pore structure development without changing the original multistage pore structure.
The apparent structural morphology of the TiO2 and SDB-6-K-9@TiO2 composite is shown in Figure 2. As shown in Figure 2a, the TiO2 prepared via hydrothermal synthesis presented an irregular spherical granular shape. Figure 2b–e indicates that TiO2 was uniformly supported on the surface of SDB-6-K-9. TiO2 particles displayed good dispersibility and particle shape retention. However, local TiO2 particle aggregation was also observed to some extent [32]. The elemental composition of the SDB-6-K-9@TiO2 composites was analyzed via EDS, and it confirmed the presence of primarily C, O, and Ti. Compared with the different addition SDB-6-K-9 amounts, the relative C content in the EDS spectra of the SDB-6-K-9@TiO2 composites increased. The dominant elements in TiO2 were Ti and O, indicating that TiO2 was successfully loaded onto the SDB-6-K-9 surface. The presence of C, O, and Ti during EDS mapping corresponded with the uniform distribution on the SDB-6-K-9@TiO2 composite surfaces.
The XRD patterns of the TiO2 and SDB-6-K-9@TiO2 composites are shown in Figure 1c. Prominent diffraction peaks were observed at 25.3°, 38.0°, 48.0°, 54.6°, 62.9°, 69.1°, and 75.0°, which could be indexed to the (101), (004), (200), (105), (213), (116), and (215) crystal planes, respectively, of the anatase-type TiO2 [33]. Compared with the anatase TiO2 standard card (JCPDS No.21-1272), the diffraction peaks were smooth and sharp with high peaks. It showed that anatase TiO2 prepared via hydrothermal synthesis displayed a higher purity and degree of crystallization [34]. Of the existing TiO2 crystalline structures (anatase, brookite, and rutile), the anatase phase exhibited the highest catalytic activity [35]. Anatase TiO2 diffraction peaks were evident in the SDB-6-K-9@TiO2 composites, indicating that the TiO2 was successfully loaded onto the surface of SDB-6-K-9, which was consistent with the SEM and EDS analysis results.
The FTIR spectra revealed the functional groups on the TiO2 and SDB-6-K-9@TiO2 composite surfaces. As shown in Figure 1d, compared with the FTIR spectra of SDB-6-K-9 in the previous study [36], except for the four characteristic absorption peaks of -OH, C-H, C=O, and C-O in SDB-6-K-9, a new broad absorption peak appeared at 500 cm−1 in the spectra of TiO2 and SDB-6-K-9@TiO2 composites had been identified, which could be attributed to the characteristic absorption peak of Ti-O-Ti tensile vibration [37]. To a certain extent, these results verified the successful loading of TiO2 onto the SDB-6-K-9 surface during the SDB-6-K-9@TiO2 composite preparation to form a new titanium-containing functional group, which was consistent with the XRD analysis.
XPS was used to characterize the surface elements and states of the SDB-6-K-9@TiO2 composites. The C 1s peak, Ti 2p peak, and O 1s peaks of the SDB-6-K-9@TiO2 composites were distinctly evident in the full survey spectra in Figure S1a,e,i,m. The primary elements, C, O, Ti, and a trace amount of the N element, were present in the samples. With the additional SDB-6-K-9 amount increasing from 1% to 4%, the C content increased from 28.13% to 56.07%, while O and Ti levels decreased from 46.82% to 29.05% and from 23.95% to 14.00%, respectively, which was consistent with the EDS elemental analysis results. The high-resolution XPS spectra of C1s in Figure S1b,f,j,n shows that the C1s curve displayed four absorption peaks around 283.8 eV, 284.9 eV, 286.3 eV, and 288.7 eV, corresponding to Csp2, Csp3, C-O, O-C=O, respectively. In Figure S1c,g,k,o, the O1s high-resolution XPS spectra exhibited two peaks at 530.0 eV and 531.6 eV, corresponding to Ti-O and -OH, respectively. The Ti2p high-resolution XPS spectra are shown in Figure S1d,h,l,p. The Ti2p curve peaks at 710.0 eV and 458.7 eV, corresponded to Ti4+ [38]. The existing form variation could be ascribed to specific differences in the added SDB-6-K-9 amount. However, TiO2 was successfully supported on the surface of SDB-6-K-9, which was consistent with the SEM-EDS, FTIR, and XRD analysis results.
The optical properties of the TiO2 and SDB-6-K-9@TiO2 composites were examined via UV-vis spectroscopy. According to the spectral data, the absorption wavelength threshold λg was obtained using the transect method, while the excitation energy (Eg) was calculated via the formula Eg = 1240/λg (eV). As shown in Figure 3, the absorption wavelength threshold of the TiO2 prepared via hydrothermal synthesis was 400 nm, and the Eg value was 3.10 eV. No absorbance was evident when the wavelength exceeded 400 nm. Compared with pure TiO2, the absorption edge of the SDB-6-K-9@TiO2 composites displayed an absorbance ranging from 400 nm to 1000 nm and an obvious redshift. The Eg of the 1%SDB-6-K-9@TiO2, 2%SDB-6-K-9@TiO2, 3%SDB-6-K-9@TiO2, and 4%SDB-6-K-9@TiO2 was 3.06 eV, 2.97 eV, 2.82 eV, and 2.59 eV, respectively. Therefore, all of the SDB-6-K-9@TiO2 composites displayed photoexcitation under visible light irradiation due to the presence of SDB-6-K-9, while 4%SDB-6-K-9@TiO2 was the most efficient. The results indicated that the excitation energy of TiO2 loaded with SDB-6-K-9 was effectively reduced while enhancing visible light absorption and utilization and improving photocatalytic activity [39].

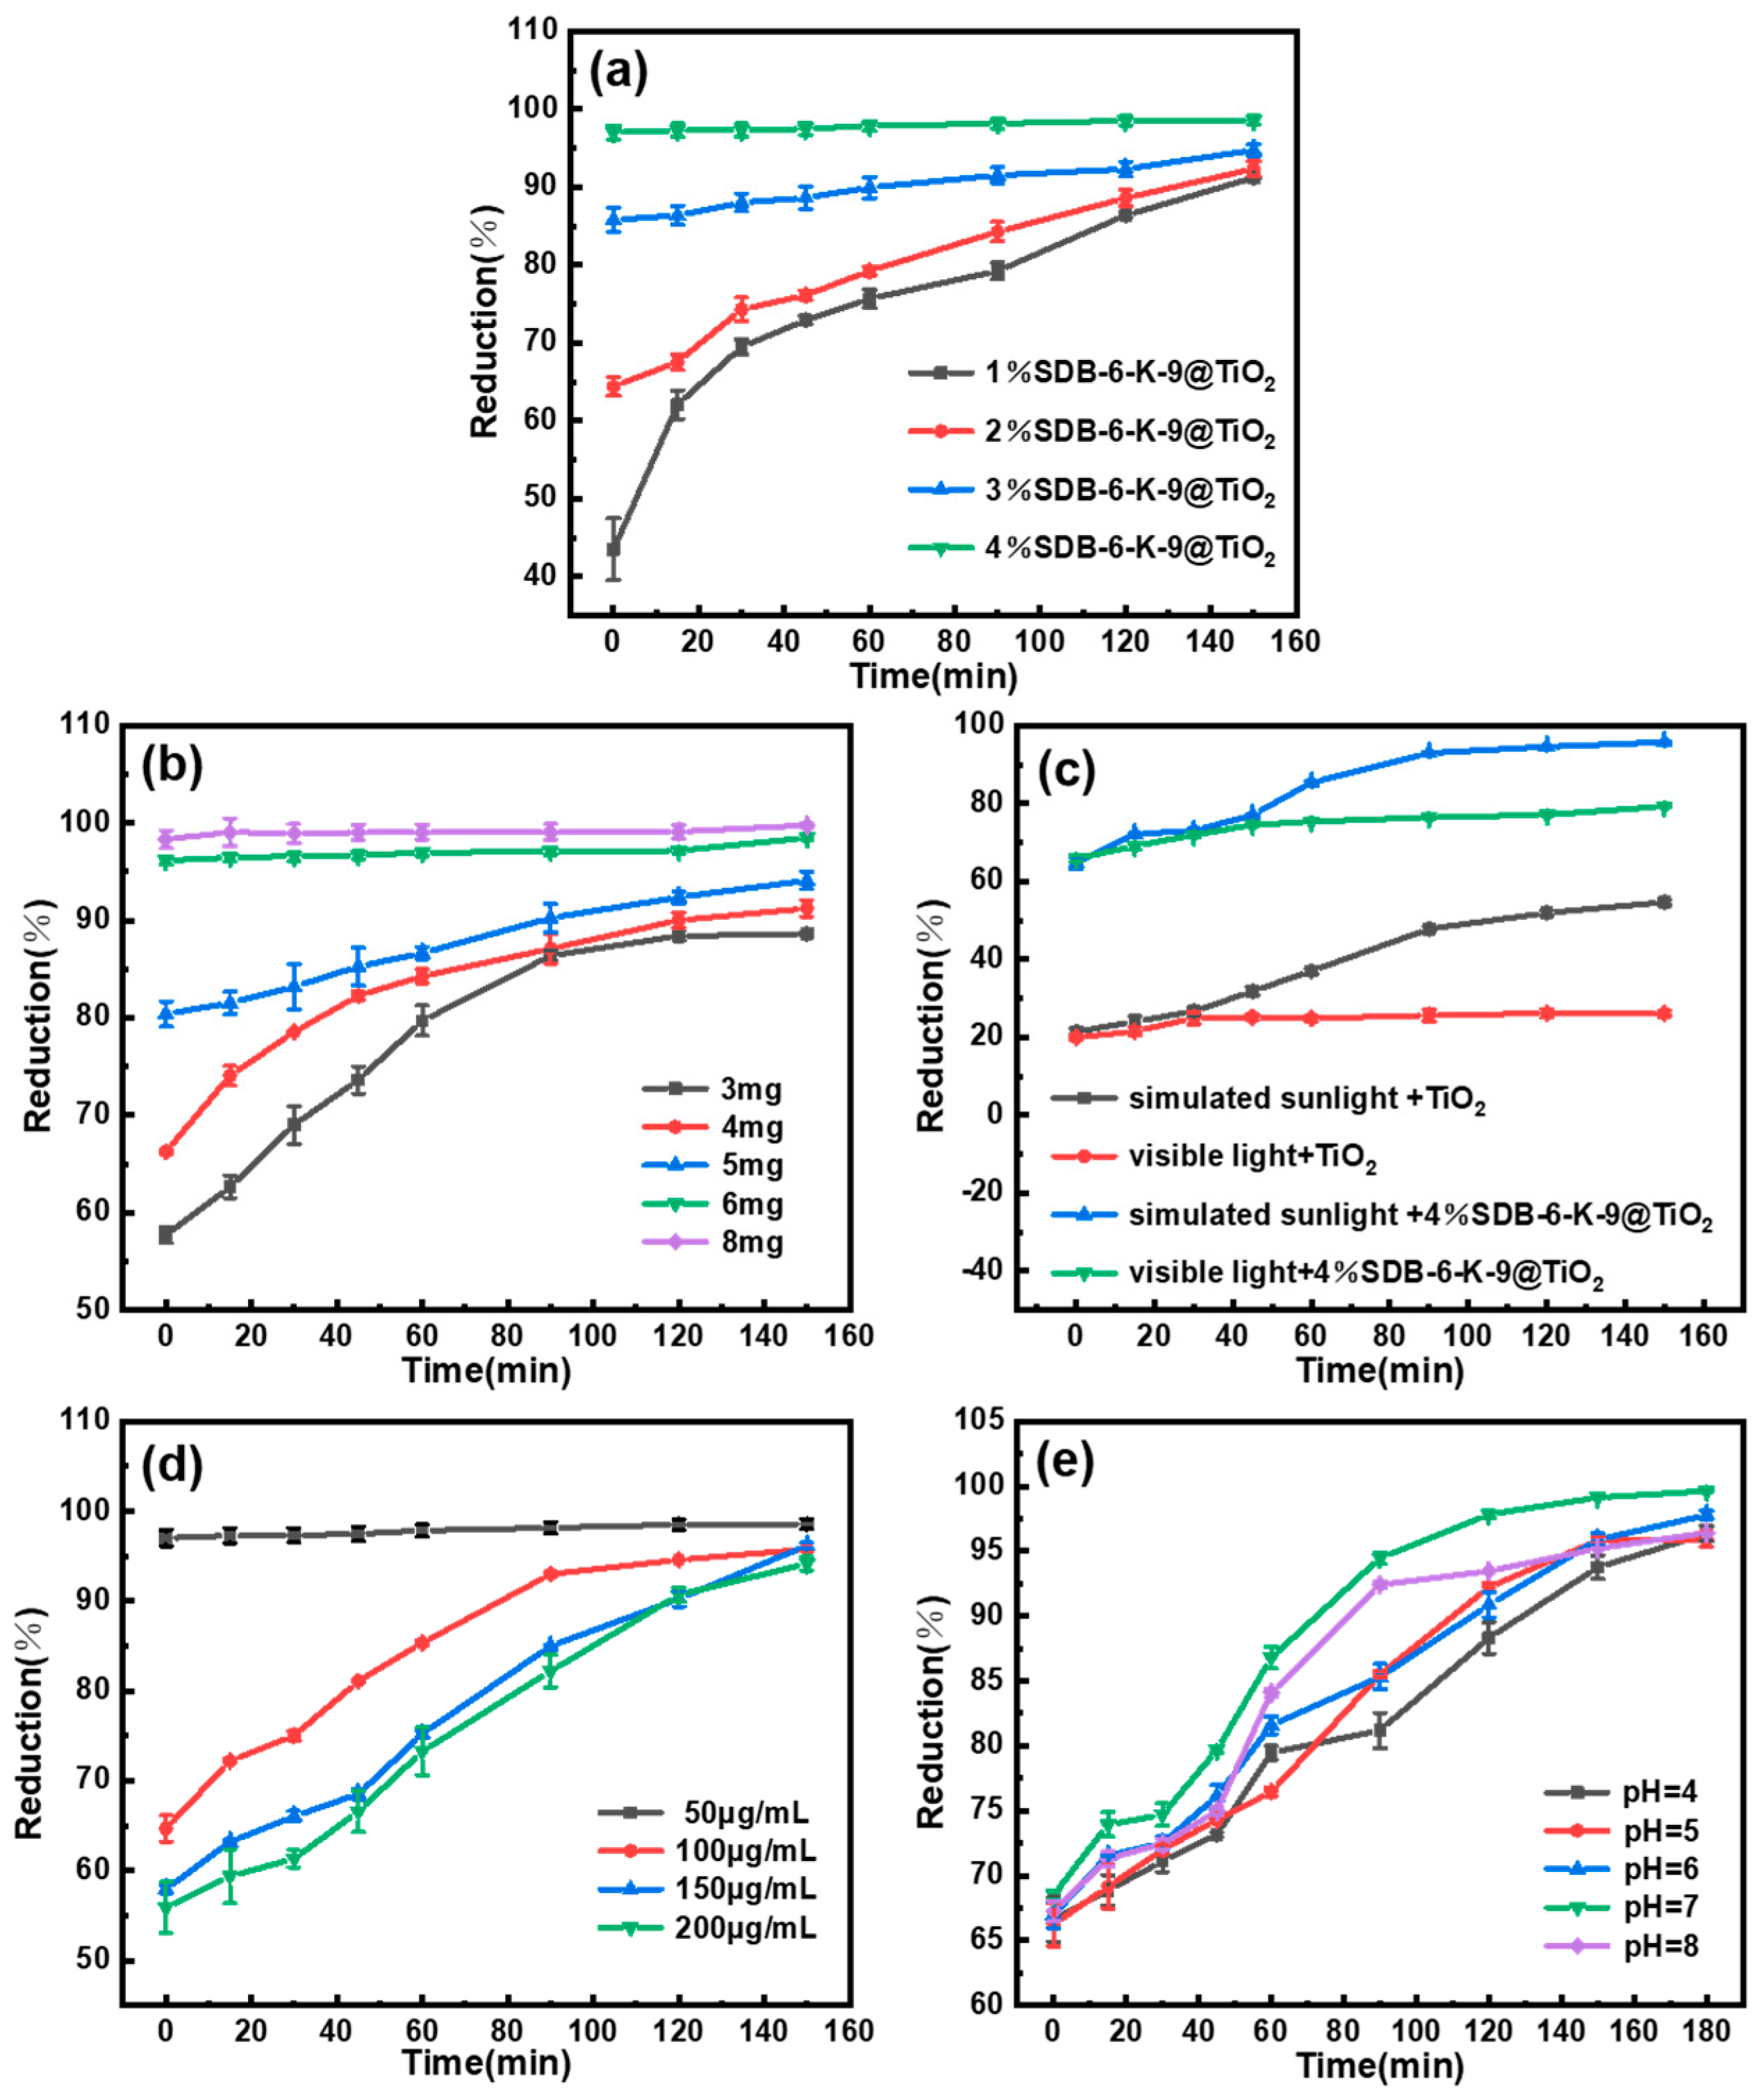
2.2. Degradation Studies

The AFB1 degradation by the SDB-6-K-9@TiO2 composites in different treatment conditions is presented in Figure 4. Figure 4a shows the effect of the photocatalysts prepared by adding different amounts of SDB-6-K-9 to the SDB-6-K-9@TiO2 composites on the photocatalytic activity. Throughout the degradation process, all time points demonstrated that higher dosages of SDB-6-K-9 led to greater AFB1 reduction by the SDB-6-K-9@TiO2 composites. Therefore, the photocatalytic efficacy of the @TiO2 composite composites increased at a higher SDB-6-K-9 addition amount. The photocatalytic effect of the @TiO2 composites increased at a higher SDB-6-K-9 addition amount. This may be because doping SDB-6-K-9 with a high specific surface area and porosity increased the specific surface area of the SDB-6-K-9@TiO2 composites, providing more active sites on the surface and allowing for rapid AFB1 adsorption to the photocatalytic surface. The SDB-6-K-9@TiO2 composites, with TiO2 as the main active substance for photocatalysis, showed an excellent removal ability for AFB1 solution concentrations, with a highest removal rate of 98.57%. Therefore, 4%SDB-6-K-9@TiO2 was determined as the optimal photocatalyst and was selected for further photocatalytic performance tests.
The photocatalytic amount is a crucial factor affecting photocatalysis. As shown in Figure 4b, at a 4%SDB-6-K-9@TiO2 dose of 3 mg–8 mg, adsorption differences were evident in dark conditions. The adsorption increased at higher photocatalytic doses, probably because the abundant active sites on the surface increased at a higher 4%SDB-6-K-9@TiO2 dosage, promoting its adsorption effect. In the same irradiation conditions, the reduction ranged from 88.62% to 98.49% when the photocatalytic dosage increased from 3 mg to 6 mg. However, an excessive photocatalytic quantity caused TiO2 aggregation on the SDB-6-K-9 surface, affecting the porosity and reducing the photocatalytic activity. Therefore, 6 mg 4%SDB-6-K-9@TiO2 was determined as the optimal photocatalytic amount and selected for further photocatalytic performance tests.
To investigate the impact of a light source on the photocatalytic effect, TiO2 and 4%SDB-6-K-9@TiO2 were examined in simulated sunlight (300–1000 nm) and visible light (420–800 nm), respectively. The results are shown in Figure 4c. After adsorption in the dark for the first 2 h, the 4%SDB-6-K-9@TiO2 showed a good adsorption effect, with adsorption rates exceeding 60%, while the adsorption removal rate was only about 20% due to the pore structure of TiO2. With the extension of irradiation time, 4%SDB-6-K-9@TiO2 and TiO2 both exhibited good photocatalytic activity in simulated sunlight conditions with a reduction of 95.77% and 54.70%, respectively. Conversely, in visible light conditions, the reduction of 4%SDB-6-K-9@TiO2 and TiO2 only reached 79.04% and 25.57%, respectively. The results indicate that the visible light utilization and photocatalytic activity could be improved by SDB-6-K-9 loading onto the TiO2 surface, which was consistent with the UV-vis analysis results. Therefore, simulated daylight was determined as the optimal light source and selected for further photocatalytic performance tests.
The effect of the initial AFB1 concentration on the photocatalytic effect was analyzed in optimal photocatalytic conditions. As shown in Figure 4d, the reduction decreased with the initial AFB1 concentration from 50 μg/mL to 200 μg/mL, possibly since the increased AFB1 concentration occupied the effective active site on the surface. The reduction exceeded 95% with extended irradiation time. Therefore, 100 μg/mL was determined as the optimal initial AFB1 concentration for practical applications and selected for further photocatalytic performance tests.
The impact of pH on the photocatalytic effect was discussed according to the AFB1 properties, the associated charges on the surfaces of the catalyst and degraded substances, and the AFB1 adsorption on the photocatalytic surface. The results are shown in Figure 4e. During the degradation process, all time points indicated that the 4% SDB-6-K-9@TiO2 at pH = 7 achieved higher AFB1 reduction rates compared to acidic or alkaline conditions. Furthermore, with prolonged exposure time, the AFB1 reduction consistently exceeded 95%. Therefore, the 4%SDB-6-K-9@TiO2 photocatalyst exhibited excellent adsorption and photocatalytic degradation ability at different pH values. The absorption and degradation capacity in neutral solutions were slightly higher than in weakly acidic solutions, which was consistent with a previous report [40]. The strong AFB1 adsorption on the surface of the photocatalyst may be responsible for the enhanced degradation efficiency, which is probably related to the surface charge properties of the catalyst and substrate. At a pH level below 5, both the catalyst and AFB1 were positively charged, since the zero charge points of the TiO2 (pH = 6.5) and AFB1 (pH = 5) were higher than the pH value of the solution, leading to a certain repulsive force between the catalyst and AFB1 and relatively low AFB1 adsorption at the active catalytic site [40,41].

2.3. Photocatalytic Kinetics

To gain insight into the photocatalytic degradation of 100 μg/mL AFB1 by 4%SDB-6-K-9@TiO2, the Langmuir–Hinshelwood (L-H) kinetic model (ln(C0/Ct) = kt, where C0 is the initial concentration, Ct is the concentration at time t, k is the reaction rate constant, respectively, was used to fit the experimental data. As shown in Figure S2, the photocatalytic AFB1 degradation fits the pseudo-first-order kinetic model with R2 values between 0.9469 and k of 0.01586.

2.4. Recycling Performance

Photocatalysts are difficult to separate and recycle in practical applications. To evaluate the stability and reusability of the 4%SDB-6-K-9@TiO2 photocatalyst, five cycles of AFB1 photocatalytic degradation experiments were performed in optimal conditions. Figure S3 shows the AFB1 degradation efficiency during various cycles. Although the photocatalytic activity of 4%SDB-6-K-9@TiO2 marginally decreased after multiple photocatalytic tests, the reduction remained higher than 85% after five cycles, indicating that the prepared photocatalyst displayed excellent reusability. The cause of the lower reduction rate may be related to the loss during the recovery and washing of the photocatalyst or a decline in the photocatalytic degradation rate.

2.5. The Photocatalytic Degradation Mechanism

The AFB1 photocatalytic degradation mechanism was examined via a free radical trapping experiment. In optimal photocatalytic conditions, h+ scavenger EDTA, hydroxyl radical (•OH) scavenger TBA, and O2•− scavenger BQ were added to the AFB1 solution for the photocatalytic degradation test. As shown in Figure S4, the addition of the h+ scavenger EDTA significantly reduced the photocatalytic efficiency of AFB1 compared to the contrast group. In contrast, the inclusion of the O2•− scavenger BQ and •OH scavenger TBA had a minimal impact on the photocatalytic efficiency of AFB1, indicating that they are not the primary factors influencing the degradation process. According to the findings, h+ played the most important role in the photocatalytic degradation process, followed by •OH, while O2•− had a negligible impact [41].
Additionally, based on the photocatalytic degradation of AFB1 by 4% SDB-6-K-9@TiO2 under pH = 7 conditions over a time course of 0 to 150 min, as shown in Figure 4e, the degradation products of AFB1 post-photocatalysis were further evaluated using UHPLC-Q-TOF-MS. As shown in Figure 5a–c, the AFB1 absorption peak (m/z 313.0713) at 4.839 min progressively diminished with the extension of light time, while new peaks developed at 1.750 min (m/z 331.0825) and 1.085 min (m/z 303.0495) and their concentrations steadily increased.
As shown in Figure 5d–f, the molecular weights of the three substances are AFB1 (m/z 313), P1 (m/z 331), and P2 (m/z 303). The measured molecular core of AFB1 is consistent with its actual molecular weight, confirming that the two newly generated degradation products are P1, with a molecular weight of 331, and P2, with a molecular weight of 303. To further identify the structures of these degradation products, AFB1 and the two degradation products were analyzed using UHPLC-Q-TOF-MS. The molecular nuclear ratio of the three substances were selected as the precursor ions, and secondary mass spectrometry was performed with appropriate collision energies. The MassLynx Version 4.1 software calculated the precision molecular nuclear ratio, the molecular formula with the highest match, the error, the double bond equivalents (DBE), and the i-FIT (Norm) match factor. The results show that the differences between the exact molecular masses of the three substances and their theoretical values were 0.3, 2.1, and −0.3 ppm, respectively, all within the internationally accepted standard of 5 ppm. The DBE values were 10.5, 12, and 11, with an i-FIT (Norm) value of 0 for all substances. Additionally, the molecular weight of AFB1 (313.0713) and its molecular formula (C17H13O6) as calculated by the software were consistent with its actual molecular weight (313.0712) and molecular formula (C17H13O6). Similarly, for P1, the molecular weight (331.0825) and molecular formula (C17H15O7) calculated by the software closely matched the actual values (331.0818 and C17H15O7). For P2, the molecular weight (303.0495) and molecular formula (C16H15O6) were also consistent with the actual values (303.0496 and C16H15O6). These results provide strong evidence for the high reliability of the molecular weights and formulas determined by the instrument.
Figure 5d–f presents the secondary mass spectra of AFB1 and its two degradation products (P1 and P2), along with the corresponding structural fragment information for each substance. In the structural formulas, the red dotted line indicates the reaction cleavage site. Based on the analysis using the MassFragment tool in the MassLynx software, combined with the molecular formula information provided by the instrument, the secondary mass spectra of the three substances, and the ‘soft points’ in the AFB1 structure, the structures of the two degradation products were deduced.
A possible AFB1 degradation pathway was postulated according to the above-mentioned mass spectrometry structural analysis and identification. The results are displayed in Figure S5. AFB1 might first undergo a water-induced photoaddition reaction to generate photodegradation product P1, which then experienced photoreduction and photoelimination reactions, resulting in photodegradation product P2. This speculation was consistent with a photochemical reaction and the potential degradation pathway of AFB1 proposed in the previous paper [42]. To enhance the accuracy of our findings, future research will integrate nuclear magnetic resonance characterization to further confirm the chemical structures of P1 and P2. Additionally, an investigation into their toxicity will be conducted to provide a more comprehensive understanding of their properties and interactions.
The potential photocatalytic oxidation mechanism of AFB1 via 4%SDB-6-K-9@TiO2 in simulated sunlight was postulated in Figure 6 in accordance with the results of the tests. The excited electrons produced conduction band electrons (e) and valence band h+ when the 4%SDB-6-K-9@TiO2 was exposed to light. The photogenerated electrons reacted with O2 to generate O2•− and •OH, while the h+ on the surface of the 4%SDB-6-K-9@TiO2 interacted with hydroxyl ions (OH) to directly generate •OH. Some of the h+ and •OH oxidized the AFB1 adsorbed on the catalyst surface, which was consistent with previous reports [41,43,44].

3. Conclusions

An SDB-6-K-9@TiO2 composite photocatalyst is successfully prepared via hydrothermal synthesis and applied to the photocatalytic degradation of AFB1 in the solutions. The BET, SEM-EDS, XRD, FTIR, XPS, and UV-vis analyses show that the photocatalyst presents a high specific surface area, large pore size, and rich organic functional groups. The photocatalyst significantly improves TiO2 utilization for visible light. The proposed 4%SDB-6-K-9@TiO2 pathway and mechanism of photocatalytic AFB1 degradation indicate that h+ plays the most critical role in forming two new products after deterioration. These results show that SDB-6-K-9@TiO2 photocatalysis is effective and practical for degrading AFB1, showing potential for improving future photocatalytic treatment and promoting large-scale practical application for AFB1 removal.

4. Materials and Methods

4.1. Materials

The biochar SDB-6-K-9 was synthesized using soybean dreg as a carbon source. The standard AFB1 sample was purchased from Pribolab Biological Engineering Co., Ltd. (Qingdao, China) and stored in the dark at 4 °C. The potassium bromide, butyl titanate, hydrochloric acid, ethylene diamine tetraacetic acid, tertbutyl alcohol, p-benzoquinone, sodium hypochlorite, and chromatographic-grade barium sulfate were purchased from Sinopharm Chemical Reagent Co., Ltd. (Shanghai, China). The isopropyl alcohol was obtained from Shanghai Aladdin Biochemical Technology Co., Ltd. (Shanghai, China), while Tianjin Fuchen Chemical Reagent Co., Ltd. (Tianjin, China) provided the Tween-20 and ethanol. The chromatographic grade formic acid and isopropyl alcohol were obtained from Beijing Minrida Technology Co., Ltd. (Beijing, China), while the mass spectrometry grade acetonitrile and methanol were purchased from Fisher Co., Ltd. (Oskaloosa, IA, USA). The water used in this paper was purified using a Milli-Q system from Millipore (Billerica, MA, USA). All other chemicals and solvents were analytically pure and used as received without further purification.

4.2. The Preparation and Characterization of the SDB-6-K-9@TiO2 Composites

The simple hydrothermal synthesis method used to prepare the SDB-6-K-9@TiO2 composites was adapted from the available literature [21]. Here, 2 mL of a butyl titanate solution was added dropwise into 22 mL of isopropyl alcohol while magnetically stirring for 30 min. Then, 10 mL of distilled water was added to form a white suspension, which was magnetically stirred for 10 min, after which the prepared SDB-6-K-9 with different mass ratios were added under ultrasonic exposure. The homogeneous solution was transferred to a hydrothermal reactor and maintained at 180 °C for 18 h in an oven. After the reaction, the precipitated product was rinsed several times with ethanol and deionized water until the filtrate was near neutral, after which it was dried at 105 °C for 24 h and ground through a 120-mesh sieve for later use. The subsequent SDB-6-K-9@TiO2 composites were collected and marked as XSDB-6-K-9@TiO2, where X denotes the additional SDB-6-K-9 amount (1%, 2%, 3%, and 4%).
The specific surface areas and pore size distributions of the prepared SDB-6-K-9@TiO2 composites were obtained via the automatic specific surface of a porosity analyzer at 77 K with a relative pressure (P/P0) ranging from 0 to 0.99 (BET, Quantachrome, Autosorb-iQ, Boca Raton, FL, USA). The morphology and elementary composition of the samples were verified via scanning electron microscopy (SEM, ZEISS, Gemini 300, Jena, Germany) equipped with energy dispersive spectroscopy (EDS, Oxford, Xplore 30, Abingdon, UK). The X-ray diffraction (XRD) analyses were conducted via an X-ray instrument (XRD, Rigaku, Ultima IV, Tokyo, Japan) at 40 kV using Cu Kα radiation, while scanning occurred in a range of 10–80°, at a rate of 2° min−1. The Fourier transform infrared (FTIR) spectra of the samples were obtained using an FTIR spectrometer (FTIR, Shimadzu, Type 2000, Tokyo, Japan) in a range from 4000 cm−1 to 400 cm−1 at a resolution of 4 cm−1, using KBr pellets for sample preparation. The surface properties of the samples were acquired using X-ray photoelectron spectroscopy (XPS, Thermo Fisher Scientific, Escalab 250Xi, Waltham, MA, USA) with monochromatic Al Kα radiation. The UV-vis diffuse reflectance spectra (DRS) were recorded with a Model Shimadzu UV-2550 spectrometer (UV-vis, Agilent, Cary 60, Santa Clara, CA, USA).

4.3. The Photocatalytic Degradation Tests

The photocatalytic tests of the SDB-6-K-9@TiO2 composites were conducted in a photochemical reactor (Zhongjiao Keyuan, CEL-LB70, Beijing, China) [41] with a 10 cm distance between the light source and the reactor. The test procedure was as follows: 6 mg of the SDB-6-K-9@TiO2 composite was added to a 20 mL AFB1 solution at a concentration of 50 μg/mL and magnetically stirred for 120 min in a dark chamber until reaching the adsorption–analytical equilibrium. Then, the light source was turned on to initiate the photocatalytic reaction, while all of the solutions were constantly stirred during irradiation incidence. At a preset time, 1 mL of the degradation solution was centrifuged at 6000 rpm for 10 min to remove the photocatalyst and then passed through a 0.22 μm filter membrane into a brown liquid vial.
The photocatalytic tests mainly investigated the impact of different light sources (simulated daylight: 300–1100 nm and visible light: 420–800 nm), different photocatalysts (SDB-6-K-9 addition amount: 1–4%), photocatalyst dosage (3–8 mg), initial AFB1 concentration (50–200 μg/mL), and pH value (4–8) on the removal efficiency. All experiments were repeated three times.
The AFB1 reduction (Re) was calculated using the following equation:
R e % = C 0 C t C 0 × 100 %
where C0 (μg/mL) is the initial AFB1 solution concentration, and Ct (μg/mL) is the AFB1 concentration at different time points.

4.4. The Examination of the Photocatalytic Mechanism

Degradation experiments involving radical scavengers were conducted to examine the deterioration mechanism. Here, 1 mmol of the h+ (EDTA), hydroxyl radical (TBA), and superoxide radical (O2•−) scavengers (BQ) were added to the AFB1 solution to assess the photocatalytic degradation. All experiments were repeated three times. Furthermore, the photocatalytic reaction mechanism was explored by measuring the photocatalytic degradation products [21,41].

4.5. SDB-6-K-9@TiO2 Photocatalytic Recycling

Cyclic experiments were conducted to assess the reusability and stability of the SDB-6-K-9@TiO2 composite exhibiting the best degradation results. After the first photocatalytic AFB1 degradation process was completed in optimal photocatalytic conditions, the photocatalyst was recovered via centrifugation, washed several times with deionized water, filtered, and dried for the subsequent cycle in the same conditions. In total, five cycles were performed.

4.6. The Determination of the AFB1 and Photocatalytic Degradation Products

The AFB1 concentration and degradation products in the solution were determined using an Agilent-1290 UHPLC system (Agilent Technologies Inc., Santa Clara, CA, USA) with a quadrupole time-of-flight (Q-TOF) component model G6530 system (Agilent Technologies Inc., Santa Clara, CA, USA). The sample was separated using a ZORBAX Eclipse XDB C18 analytical column (50 mm × 2.1 mm, 1.8 μm) (Agilent, Santa Clara, CA, USA). The mobile phase consisted of an isometric elution of methanol/acetonitrile/0.1% formic acid in water (17.5:17.5:65, V/V/V) at a flow rate of 0.25 mL/min, a column temperature of 30 °C, and a sample injection volume of 10 μL, while the AFB1 concentration in the sample was quantitatively analyzed via the peak areas.
The TOF conditions consisted of an ESI positive detection mode, a capillary voltage of 3000 V, an atomizer pressure of 50 psi, a gas temperature of 300 °C, a drying gas flow rate of 10 L/min, a fragmentation voltage of 100 V, a cone h+ body voltage of 35 V, a scanning range of m/z 100–1000, and a scanning speed of 1 cycle/SEC. Purine (m/z 121.0508) and HP-921 (m/z 922.0097) were used as the reference solutions.
The target MS/MS mode consisted of a first-stage mass spectrometry scanning range of m/z 100–1000, with a scanning speed of 1 spectra/s, and a two-stage mass spectrometry scanning range of m/z 100–1000, with a scanning speed of 1 spectra/s. The data acquisition mode was composed of contour and bar diagrams. The degradation mechanism was inferred by comparing the obtained m/z values with the molecular weight of standard AFB1 and its possible conversion products.

4.7. Statistical Analysis

All of the measurements were conducted in triplicate, and the results are expressed as the mean ± standard deviation. ANOVA and Duncan’s multiple comparison were performed by using the SPSS 23.0 to determine the significant differences between groups. p < 0.05 was considered to be significant.

Supplementary Materials

The following supporting information can be downloaded at: https://www.mdpi.com/article/10.3390/toxins16100429/s1, Figure S1: (a, e, i, m) Full spectrums; (b, f, j, n) High-resolution of C1s; (c, g, k, o) High-resolution of O1s; (d, h, l, p) High-resolution of Fe2p XPS spectras of 1%SDB-6-K-9@TiO2, 2%SDB-6-K-9@TiO2, 3%SDB-6-K-9@TiO2, 4%SDB-6-K-9@TiO2, respectively; Figure S2: The kinetic analysis for photocatalytic degradation of AFB1 by 4%SDB-6-K-9@TiO2; Figure S3: The reusability of 4%SDB-6-K-9@TiO2 photocatalyst for degradation of AFB1; Figure S4: The possible AFB1 photodegradation pathway; Figure S5: The possible AFB1 photodegradation pathway.

Author Contributions

Conceptualization, H.Y.; data curation, J.Z. and Z.Y.; writing—original draft preparation, J.Z.; methodology, Z.Y.; software, H.Y.; writing—review and editing, H.L. and H.Y.; validation, H.Y.; project administration, X.L.; supervision, X.L.; formal analysis, D.M. All authors have read and agreed to the published version of the manuscript.

Funding

This work was supported by the National Key Research and Development Program of China (2021YFD2100402).

Institutional Review Board Statement

Not applicable.

Informed Consent Statement

Not applicable.

Data Availability Statement

The data presented in this study are available on request from the corresponding author.

Conflicts of Interest

The authors declare no conflicts of interest.

References

  1. Li, S.; Luo, J.; Fan, J.; Chen, X.; Wan, Y. Aflatoxin B1 removal by multifunctional membrane based on polydopamine intermediate layer. Sep. Purif. Technol. 2018, 199, 311–319. [Google Scholar] [CrossRef]
  2. Pankaj, S.K.; Shi, H.; Keener, K.M. A review of novel physical and chemical decontamination technologies for aflatoxin in food. Trends Food Sci. Technol. 2018, 71, 73–83. [Google Scholar] [CrossRef]
  3. Li, P.; Wang, S.; Lv, B.; Zhang, M.; Xing, C.; Sun, X.; Fang, Y. Magnetic rice husk-based biochar for removal of aflatoxin B1 from peanut oil. Food Control 2023, 152, 109883. [Google Scholar] [CrossRef]
  4. Ying, Z.; Zhang, T.; Li, H.; Liu, X. Adsorptive removal of aflatoxin B1 from contaminated peanut oil via magnetic porous biochar from soybean dreg. Food Chem. 2023, 409, 135321. [Google Scholar] [CrossRef]
  5. Zhang, C.; Zhou, H.; Cao, S.; Chen, J.; Qu, C.; Tang, Y.; Wang, M.; Zhu, L.; Liu, X.; Zhang, J. A magnetic reduced graphene oxide nanocomposite: Synthesis, characterization, and application for high-efficiency detoxification of aflatoxin B1. Toxins 2024, 16, 57. [Google Scholar] [CrossRef]
  6. Mao, J.; He, B.; Zhang, L.; Li, P.; Zhang, Q.; Ding, X.; Zhang, W. A structure identification and toxicity assessment of the degradation products of aflatoxin B1 in peanut oil under UV irradiation. Toxins 2016, 8, 332. [Google Scholar] [CrossRef]
  7. Cancelliere, R.; Di Tinno, A.; Cataldo, A.; Bellucci, S.; Kumbhat, S.; Micheli, L. Nafion-based label-free immunosensor as a reliable warning system: The case of AFB1 detection in cattle feed. Microchem. J. 2023, 191, 108868. [Google Scholar] [CrossRef]
  8. Li, X.; Yu, J.; Jaroniec, M. Hierarchical photocatalysts. Chem. Soc. Rev. 2016, 45, 2603–2636. [Google Scholar] [CrossRef]
  9. Liu, Y.; Xia, L.; Yamdeu, J.H.G.; Gong, Y.Y.; Orfila, C. Adsorption of aflatoxin B1 to corn by-products. Food Chem. 2024, 440, 138212. [Google Scholar] [CrossRef]
  10. Bian, Z.; Zhu, J.; Li, H. Solvothermal alcoholysis synthesis of hierarchical TiO2 with enhanced activity in environmental and energy photocatalysis. J. Photochem. Photobiol. C 2016, 28, 72–86. [Google Scholar] [CrossRef]
  11. Xie, X.; Li, S.; Zhang, H.; Wang, Z.; Huang, H. Promoting charge separation of biochar-based Zn-TiO2/pBC in the presence of ZnO for efficient sulfamethoxazole photodegradation under visible light irradiation. Sci. Total Environ. 2019, 659, 529–539. [Google Scholar] [CrossRef] [PubMed]
  12. Yang, T.; Peng, J.; Zheng, Y.; He, X.; Hou, Y.; Wu, L.; Fu, X. Enhanced photocatalytic ozonation degradation of organic pollutants by ZnO modified TiO2 nanocomposites. Appl. Catal. B 2018, 221, 223–234. [Google Scholar] [CrossRef]
  13. Zhu, L.; Kong, X.; Yang, C.; Ren, B.; Tang, Q. Fabrication and characterization of the magnetic separation photocatalyst C-TiO2@Fe3O4/AC with enhanced photocatalytic performance under visible light irradiation. J. Hazard. Mater. 2020, 381, 120910. [Google Scholar] [CrossRef] [PubMed]
  14. Wan, H.; Yao, W.; Zhu, W.; Tang, Y.; Ge, H.; Shi, X.; Duan, T. Fe-N co-doped SiO2@TiO2 yolk-shell hollow nanospheres with enhanced visible light photocatalytic degradation. Appl. Surf. Sci. 2018, 444, 355–363. [Google Scholar] [CrossRef]
  15. Komatsuda, S.; Asakura, Y.; Vequizo, J.J.M.; Yamakata, A.; Yin, S. Enhanced photocatalytic NO, decomposition of visible-light responsive F-TiO2/(N, C)-TiO2 by charge transfer between F-TiO2 and (N, C)-TiO2 through their doping levels. Appl. Catal. B 2018, 238, 358–364. [Google Scholar] [CrossRef]
  16. Liu, H.; Zhang, S.; Chen, Y.; Zhang, J.; Guo, P.; Liu, M.; Lu, X.; Zhang, J.; Wang, Z. Rational design of TiO2@ nitrogen-doped carbon coaxial nanotubes as anode for advanced lithium ion batteries. Appl. Surf. Sci. 2018, 458, 1018–1025. [Google Scholar] [CrossRef]
  17. Nguyen, C.-C.; Nguyen, D.T.; Do, T.-O. A novel route to synthesize C/Pt/TiO2 phase tunable anatase-Rutile TiO2 for efficient sunlight-driven photocatalytic applications. Appl. Catal. B 2018, 226, 46–52. [Google Scholar] [CrossRef]
  18. Khalid, N.R.; Ahmed, E.; Ahmad, M.; Niaz, N.A.; Ramzan, M.; Shakil, M.; Iqbal, T.; Majid, A. Microwave-assisted synthesis of Ag-TiO2/graphene composite for hydrogen production under visible light irradiation. Ceram. Int. 2016, 42, 18257–18263. [Google Scholar] [CrossRef]
  19. Martins, A.C.; Cazetta, A.L.; Pezoti, O.; Souza, J.R.B.; Zhang, T.; Pilau, E.J.; Asefa, T.; Almeida, V.C. Sol-gel synthesis of new TiO2/activated carbon photocatalyst and its application for degradation of tetracycline. Ceram. Int. 2017, 43, 4411–4418. [Google Scholar] [CrossRef]
  20. Gangu, K.K.; Maddila, S.; Jonnalagadda, S.B. A review on novel composites of mwcnts mediated semiconducting materials as photocatalysts in water treatment. Sci. Total Environ. 2019, 646, 1398–1412. [Google Scholar] [CrossRef]
  21. Sun, S.; Zhao, R.; Xie, Y.; Liu, Y. Reduction of aflatoxin B1 by magnetic graphene oxide/TiO2 nanocomposite and its effect on quality of corn oil. Food Chem. 2021, 343, 128521. [Google Scholar] [CrossRef] [PubMed]
  22. Zhang, H.; Wang, Z.; Li, R.; Guo, J.; Li, Y.; Zhu, J.; Xie, X. TiO2 supported on reed straw biochar as an adsorptive and photocatalytic composite for the efficient degradation of sulfamethoxazole in aqueous matrices. Chemosphere 2017, 185, 351–360. [Google Scholar] [CrossRef] [PubMed]
  23. Penas-Garzon, M.; Gomez-Aviles, A.; Belver, C.; Rodriguez, J.J.; Bedia, J. Degradation pathways of emerging contaminants using TiO2-activated carbon heterostructures in aqueous solution under simulated solar light. Chem. Eng. J. 2020, 392, 124867. [Google Scholar] [CrossRef]
  24. Matos, J.; Marino, T.; Molinari, R.; Garcia, H. Hydrogen photoproduction under visible irradiation of Au-TiO2/activated carbon. Appl. Catal. A 2012, 417, 263–272. [Google Scholar] [CrossRef]
  25. Qian, L.; Zhang, W.; Yan, J.; Han, L.; Chen, Y.; Ouyang, D.; Chen, M. Nanoscale zero-valent iron supported by biochars produced at different temperatures: Synthesis mechanism and effect on Cr (VI) removal. Environ. Pollut. 2017, 223, 153–160. [Google Scholar] [CrossRef]
  26. Cancelliere, R.; Cianciaruso, M.; Carbone, K.; Micheli, L. Biochar: A sustainable alternative in the development of electrochemical printed platforms. Chemosensors 2022, 10, 344. [Google Scholar] [CrossRef]
  27. Cancelliere, R.; Cosio, T.; Campione, E.; Corvino, M.; D’Amico, M.P.; Micheli, L.; Signori, E.; Contini, G. Label-free electrochemical immunosensor as a reliable point-of-care device for the detection of interleukin-6 in serum samples from patients with psoriasis. Front. Chem. 2023, 11, 1251360. [Google Scholar] [CrossRef]
  28. Jamil, T.S.; Ghaly, M.Y.; Fathy, N.A.; Abd el-Halim, T.A.; Osterlund, L. Enhancement of TiO2 behavior on photocatalytic oxidation of mo dye using TiO2/AC under visible irradiation and sunlight radiation. Sep. Purif. Technol. 2012, 98, 270–279. [Google Scholar] [CrossRef]
  29. Omri, A.; Benzina, M. Influence of the origin of carbon support on the structure and properties of TiO2 nanoparticles prepared by dip coating method. Arabian J. Chem. 2019, 12, 2926–2936. [Google Scholar] [CrossRef]
  30. Lu, T.; Chen, F. Multiwfn: A multifunctional wavefunction analyzer. J. Comput. Chem. 2012, 33, 580–592. [Google Scholar] [CrossRef]
  31. Lu, T. A comprehensive electron wavefunction analysis toolbox for chemists, multiwfn. J. Chem. Phys. 2024, 161, 082503. [Google Scholar] [CrossRef] [PubMed]
  32. Nadimi, M.; Saravani, A.Z.; Aroon, M.A.; Pirbazari, A.E. Photodegradation of methylene blue by a ternary magnetic TiO2/Fe3O4/graphene oxide nanocomposite under visible light. Mater. Chem. Phys. 2019, 225, 464–474. [Google Scholar] [CrossRef]
  33. Liang, Y.; He, X.; Chen, L.; Zhang, Y. Preparation and characterization of TiO2-Graphene@ Fe3O4 magnetic composite and its application in the removal of trace amounts of microcystin-lr. RSC Adv. 2014, 4, 56883–56891. [Google Scholar] [CrossRef]
  34. Xu, F.; Zhang, J.; Zhu, B.; Yu, J.; Xu, J. CuInS2 sensitized TiO2 hybrid nanofibers for improved photocatalytic CO2 reduction. Appl. Catal. B 2018, 230, 194–202. [Google Scholar] [CrossRef]
  35. Lu, L.; Shan, R.; Shi, Y.; Wang, S.; Yuan, H. A novel TiO2/biochar composite catalysts for photocatalytic degradation of methyl orange. Chemosphere 2019, 222, 391–398. [Google Scholar] [CrossRef]
  36. Ying, Z.; Zhao, D.; Li, H.; Liu, X.; Zhang, J. Efficient adsorption of deoxynivalenol by porous carbon prepared from soybean dreg. Toxins 2021, 13, 500. [Google Scholar] [CrossRef]
  37. Silvestri, S.; Goncalves, M.G.; da Silva Veiga, P.A.; da Silva Matos, T.T.; Peralta-Zamora, P.; Mangrich, A.S. TiO2 supported on Salvinia molesta biochar for heterogeneous photocatalytic degradation of acid orange 7 dye. J. Environ. Chem. Eng. 2019, 7, 102879. [Google Scholar] [CrossRef]
  38. Jia, T.; Fu, F.; Yu, D.; Cao, J.; Sun, G. Facile synthesis and characterization of N-doped TiO2/C nanocomposites with enhanced visible-light photocatalytic performance. Appl. Surf. Sci. 2018, 430, 438–447. [Google Scholar] [CrossRef]
  39. Tayel, A.; Ramadan, A.R.; El Seoud, O.A. Titanium dioxide/graphene and titanium dioxide/graphene oxide nanocomposites: Synthesis, characterization and photocatalytic applications for water decontamination. Catalysts 2018, 8, 491. [Google Scholar] [CrossRef]
  40. Alalm, M.G.; Tawfik, A.; Ookawara, S. Enhancement of photocatalytic activity of TiO2 by immobilization on activated carbon for degradation of pharmaceuticals. J. Environ. Chem. Eng. 2016, 4, 1929–1937. [Google Scholar] [CrossRef]
  41. Sun, S.; Zhao, R.; Xie, Y.; Liu, Y. Photocatalytic degradation of aflatoxin B1 by activated carbon supported TiO2 catalyst. Food Control 2019, 100, 183–188. [Google Scholar] [CrossRef]
  42. Liu, R.; Jin, Q.; Huang, J.; Liu, Y.; Wang, X.; Mao, W.; Wang, S. Photodegradation of aflatoxin B1 in peanut oil. Eur. Food Res. Technol. 2011, 232, 843–849. [Google Scholar] [CrossRef]
  43. Jamil, T.S.; Abbas, H.A.; Nasr, R.A.; El-Kady, A.A.; Ibrahim, M.I.M. Detoxification of aflatoxin B1 using nano-sized Sc-doped SrTi0.7Fe0.3O3 under visible light. J. Photochem. Photobiol. A 2017, 341, 127–135. [Google Scholar] [CrossRef]
  44. Magzoub, R.A.M.; Yassin, A.A.A.; Abdel-Rahim, A.M.; Gubartallah, E.A.; Miskam, M.; Saad, B.; Sabar, S. Photocatalytic detoxification of aflatoxins in sudanese peanut oil using immobilized titanium dioxide. Food Control 2019, 95, 206–214. [Google Scholar] [CrossRef]
Figure 1. (a) The adsorption/desorption isotherms. (b) The pore size distribution maps of the TiO2 and SDB−6−K−9@TiO2 composites. (c) The XRD patterns. (d) The FTIR diagrams of the TiO2 and SDB−6−K−9@TiO2 composites.
Toxins 16 00429 g001
Figure 2. (a) SEM images of TiO2; SEM-EDS and mapping photos of (b) 1%SDB-6-K-9@TiO2; (c) 2%SDB-6-K-9@TiO2; (d) 3%SDB-6-K-9@TiO2; (e) 4%SDB-6-K-9@TiO2.
Toxins 16 00429 g002
Figure 3. The UV-vis DRS of the TiO2 and SDB-6-K-9@TiO2 composites.
Toxins 16 00429 g003
Figure 4. The influence of different conditions on the reduction effect. (a) The different photocatalysts. (b) The photocatalytic dosage. (c) The different light source. (d) The initial AFB1 concentration. (e) pH. The data are expressed as the mean ± standard deviation (n = 3).
Toxins 16 00429 g004
Figure 5. The chromatograms of the AFB1 and the degradation products via 4%SDB-6-K-9@TiO2 at different irradiation times. (a) AFB1. (b) The P1 photocatalytic degradation product. (c) The P2 photocatalytic degradation product. The TOF MS/MS spectra and possible fragmentation of the AFB1 and degradation products via 4%SDB-6-K-9@TiO2. (d) AFB1. ◆ represents the molecular weight of AFB1 (313.0713). (e) The P1 photocatalytic degradation product. ◆ represents the molecular weight of P1 (331.0825). (f) The P2 photocatalytic degradation product. ◆ represents the molecular weight of P2 (303.0495).
Toxins 16 00429 g005
Figure 6. A schematic diagram illustrating the photocatalytic mechanism of AFB1 via the 4%SDB−6−K−9@TiO2 photocatalyst in simulated sunlight.
Toxins 16 00429 g006
Table 1. The specific surface area, pore volume, and average particle size of TiO2 and SDB-6-K-9@TiO2 composites.
SampleSpecific Surface Area (m2/g)Total Pore Volume (cm3/g)Average Particle Size (nm)
TiO2174.91 ± 6.320.5812 ± 0.01121.329 ± 0.039
1%SDB-6-K-9@TiO2294.57 ± 8.610.5313 ± 0.00328.207 ± 0.075
2%SDB-6-K-9@TiO2399.16 ± 4.750.6044 ± 0.01247.561 ± 0.037
3%SDB-6-K-9@TiO2468.28 ± 9.460.6271 ± 0.02894.539 ± 0.029
4%SDB-6-K-9@TiO2642.64 ± 10.530.7799 ± 0.02473.903 ± 0.036
Disclaimer/Publisher’s Note: The statements, opinions and data contained in all publications are solely those of the individual author(s) and contributor(s) and not of MDPI and/or the editor(s). MDPI and/or the editor(s) disclaim responsibility for any injury to people or property resulting from any ideas, methods, instructions or products referred to in the content.

