Abstract
The vegetal alkaloid toxin veratridine (VTD) is a selective voltage-gated Na+ (NaV) channel activator, widely used as a pharmacological tool in vascular physiology. We have previously shown that NaV channels, expressed in arteries, contribute to vascular tone in mouse mesenteric arteries (MAs). Here, we aimed to better characterize the mechanisms of action of VTD using mouse cecocolic arteries (CAs), a model of resistance artery. Using wire myography, we found that VTD induced vasorelaxation in mouse CAs. This VTD-induced relaxation was insensitive to prazosin, an α1-adrenergic receptor antagonist, but abolished by atropine, a muscarinic receptor antagonist. Indeed, VTD–vasorelaxant effect was totally inhibited by the NaV channel blocker tetrodotoxin (0.3 µM), the NO synthase inhibitor L-NNA (20 µM), and low extracellular Na+ concentration (14.9 mM) and was partially blocked by the NCX1 antagonist SEA0400 (45.4% at 1 µM). Thus, we assumed that the VTD-induced vasorelaxation in CAs was due to acetylcholine release by parasympathetic neurons, which induced NO synthase activation mediated by the NCX1-Ca2+ entry mode in endothelial cells (ECs). We demonstrated NCX1 expression in ECs by RT-qPCR and immunohisto- and western immunolabelling. VTD did not induce an increase in intracellular Ca2+ ([Ca2+]i), while SEA0400 partially blocked acetylcholine-triggered [Ca2+]i elevations in Mile Sven 1 ECs. Altogether, these results illustrate that VTD activates NaV channels in parasympathetic neurons and then vasorelaxation in resistance arteries, which could explain arterial hypotension after VTD intoxication.
Keywords:
veratridine; voltage-gated Na+ channel; Na+/Ca2+ exchanger (NCX); mouse mesenteric arteries; myography; mesenteric and endothelial cell lines Key Contribution:
Our results show that veratridine activates the NaV channels of parasympathetic neurons, leading to acetylcholine release, which in turn induces vasorelaxation in resistance arteries, explaining arterial hypotension after VTD intoxication. The vasorelaxant effect of VTD in isolated cecocolic arteries is mediated by acetylcholine, inducing endothelial NO synthase activation mediated by the NCX1-Ca2+ entry mode.
1. Introduction
Veratridine (VTD) is a steroidal alkaloid from the seeds of the Veratrum species, representing one the oldest known selective ligands of voltage-gated Na+ (NaV) channels [1,2,3]. Through binding to NaV channel site 2 within the pore, VTD increases Na+ current duration by inhibiting current inactivation and, thereby, inducing membrane depolarization and, consecutively, extracellular Ca2+ entry [3,4,5]. VTD is responsive to mild intoxication in humans, leading to gastro-intestinal, neurological, cardiac, and vascular symptoms that can be alleviated with the parasympatholytic drug atropine [6,7]. The arterial hypotension caused by VTD has been earlier attributed to the diminution of peripheral vascular resistance, a primary determinant of arterial blood pressure [1,8,9]. Like many plant alkaloids, VTD was used in the past to treat arterial hypertension, but the mechanism by which it decreases arterial blood pressure is still not completely understood [8,10].
Indeed, VTD has been used to investigate the contribution of NaV channels in isolated arteries, in which they are expressed in peripheral nerves, in smooth muscle cells (SMCs) and endothelial cells (ECs) [11,12,13,14]. In conduction arteries, such as aorta and femoral arteries, VTD triggers vasoconstriction mediated by Ca2+ entry in SMCs through the Na+/Ca2+ exchanger (NCX) [12,13,15,16,17]. As for peripheral small arteries, which contribute to peripheral vascular resistance, VTD induces the vasoconstriction of rat mesenteric arteries and human uterine arterioles, also mediated by the NCX Ca2+ entry mode in SMCs [12,17]. In contrast, VTD induces the vasodilation of mouse cremaster and pig retinal arterioles, underlying endothelium contribution [18,19]. However, the mechanisms behind VTD-induced vasorelaxation have not been clearly defined on isolated arteries.
Peripheral vascular resistance is tightly controlled by vascular innervation releasing different neurotransmitters by sensory motors (CGRP, ATP, substance P, neurokinin A, and anadamide) and sympathetic nerves (norepinephrine, ATP, neuropeptide Y, and galanin) (Figure 1a) [20,21]. While norepinephrine (NE), ATP, and neuropeptide Y, released by sympathetic nerves, are vasoconstrictor mediators, CGRP, substance P, and neurokinin, released by sensory neurons, are vasodilators [20,21]. However, the parasympathetic control of resistance arteries is controversial. While cholinergic nerves have been observed in mesenteric arteries, their vasomotor functions are not associated with vascular tone regulation [22]. In isolated arteries, VTD can thus activate NaV channels either in neuronal networks, in ECs, or even in SMCs. Consequently, the resulting contractile responses could be tricky to interpret.
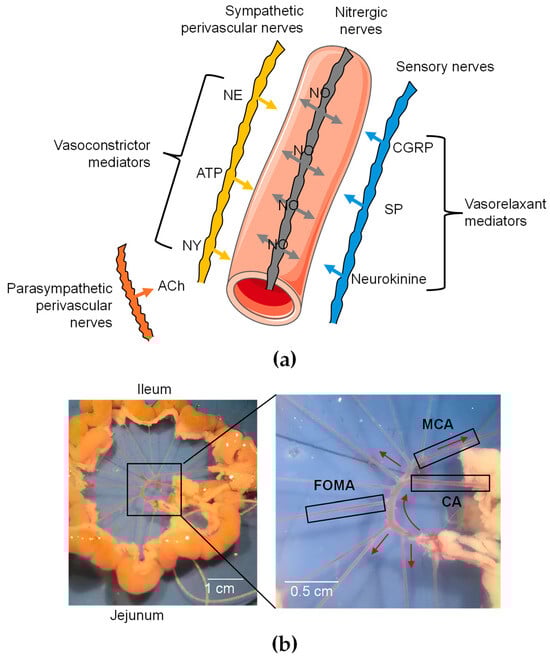
Figure 1.
Functional organization of perivascular innervation of mesenteric arteries. (a) Schematic representation of periarterial innervation. Neurotransmitters are released from varicosities and diffuse to receptors in SMCs and ECs. CGRP = calcitonin gene-related peptide; NE = norepinephrine; NY = neuropeptide Y; SP = substance P. Galanin is not shown since it has not been detected in nerve fibers of mesenteric arteries. (b) Image of mesenteric arterial bed in mice. Three different branches were used: cecocolic artery (CA; diameter = ~200 µm), middle colic artery (MCA; diameter = ~150 µm), and first-order mesenteric artery (FOMA; diameter = ~150 µm). Red arrow illustrates blood flow.
Hence, the present study aimed to better understand the mode of action of VTD on isolated mouse mesenteric arteries (MAs) by using wire myography. We found that VTD induced relaxation in cecocolic arteries (CAs) and middle colic arteries (MCAs), two distinct branches of MAs (Figure 1b). Using a pharmacological approach, we explored the contribution of the vascular innervation in VTD-induced vasorelaxation. Notably, we found that VTD-induced vasorelaxation involves the activation of endothelial NO synthase (eNOS), mediated by the increase in intracellular Ca2+ ([Ca2+]i) through the NCX Ca2+ entry mode in ECs.
2. Results
2.1. VTD Induces Vasorelaxation in CAs and MCAs
To investigate the effects of VTD on the vascular tone of MAs, we used two different arterial branches, CAs and MCAs (Figure 1b), which were stimulated beforehand with an analog of thromboxane A2, U46619, to reach 50% of the maximal contraction (Figure 1b). In the CAs, we observed that VTD triggered two types of responses: a sustained or transient vasorelaxant response that was insensitive to prazosin (PZ) and an α1-adrenergic receptor antagonist (Figure 2a). The analysis of the myographic data indicated that VTD (30 µM) induced a significant decrease in the wall tension with or without 1 µM PZ (p < 0.05; Figure 2b,c). However, the relaxation was significantly higher in the presence of PZ (77.1 ± 3.8%; n = 14) than in its absence (50.7 ± 13.5%; n = 21; p < 0.05; Mann–Whitney test).
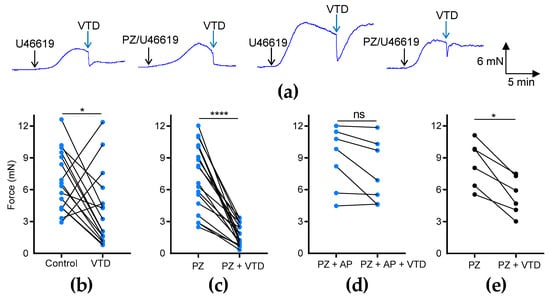
Figure 2.
Effects of VTD on CAs and MCAs. Wall tension generated by CAs and MCAs was measured with and without PZ (1 µM). (a) Examples of myographic traces showing effects of VTD (30 µM) on CAs. (b–e) Graphs illustrating connected scatter plots of individual values of wall tension levels (force, in mN) before and after VTD application for each CA (b–d) and MCA (e). Control: wall tension with U46619 alone; PZ: wall tension with U46619 with PZ; PZ + AP: wall tension with U46619, PZ, and atropine (AP, 100 nM). CAs were isolated from male (n = 9) and female (n = 7) mice (b,c). Only male mice were used in (d) (n = 7) and (e) (n = 6). Significance was evaluated using paired t test: *: p < 0.05; ****: p < 0.0001; ns: non-significant; p = 0.0602.
The addition of the muscarinic receptor antagonist atropine (AP, 100 nM) totally suppressed the VTD-induced relaxation of the CAs from males (p = 0.0602; Figure 2d). In the MCAs, we also found that VTD triggered vasorelaxation in the presence of PZ (p < 0.05; Figure 2e). Therefore, these data show that VTD induced vasorelaxation in the CAs and MCAs. In addition, since the addition of PZ increased the VTD–vasorelaxant effect, while this effect was inhibited by AP, we concluded that VTD induced the release of both NE and ACh from perivascular nerves in the CAs.
The concentration–relaxation relationship of VTD showed a relaxation of the CAs with a maximum effect of 47.9% at 30 µM and a half-maximal effective concentration (EC50) of 5 µM (Figure 3a). As expected, the VTD-induced relaxation responses were suppressed by the NaV channel inhibitor tetrodotoxin (TTX, Figure 3b). Indeed, at 0.3 µM of TTX, the VTD-induced relaxation responses were totally inhibited, and no more inhibition was obtained with 1 µM, indicating that VTD binds to TTX-sensitive NaV channels in CAs (Figure 3b). Since VTD induces permanent extracellular Na+ entry, we also examined the effects of lowering the extracellular Na+ concentration to 14.9 mM instead of 144.9 mM, which suppressed the Na+ concentration gradient. As expected, the VTD-induced vasorelaxation effect was significantly decreased by 5.1 folds (p < 0.05; Figure 3c).
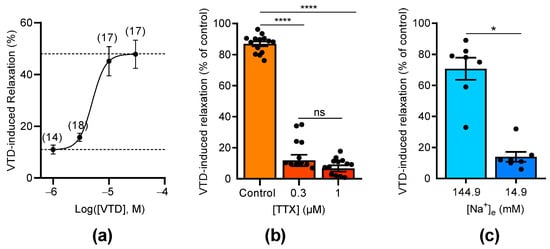
Figure 3.
Concentration-dependent effects of VTD and TTX on CAs. (a) Concentration–relaxation relationship of VTD effect on CAs analyzed using Langmuir equation (EC50 = 5 µM; maximum effect = 47.9%). Numbers in brackets indicate the numbers of animal used. (b) Scatter plots illustrating effect of TTX (0.3 and 1 µM) on VTD-induced relaxation (30 µM). (c) Scatter plots showing effect of low extracellular Na+ concentration ([Na+]e = 14.9 mM) on VTD-induced relaxation (30 µM). All experiments were performed with PZ (1 µM). CAs were isolated from male (n = 10) and female (n = 10) mice (a,b). Only male mice were used in (c) (n = 7). Values are means ± SEM. Significance was analyzed with one-way ANOVA test followed by Dunn’s test (b) for multiple comparisons (ns: non-significant; ****: p < 0.0001) and paired t test (c) (*: p < 0.05).
2.2. VTD-Induced Vasorelaxation in CAs Is Mediated by the NO-Pathway
We assumed that VTD-induced vasorelaxation in CAs is likely due to ACh release by parasympathetic nerves [22]. Since ACh stimulates the production of the vasorelaxant endothelial factor NO, we investigated the effects of N(ω)-nitro-L-arginine (L-NNA), a NO synthase inhibitor, on VTD-induced vasorelaxation. In this set of experiments, each U46619-contracted artery was stimulated by VTD in the presence of PZ and, after washing, the experiment was repeated in the presence of L-NNA (20 µM, Figure 4). As described above, at 30 µM, VTD induced vasorelaxation in CAs (32.1 ± 2.4%; n = 26; p < 0.0001) while, in the presence of L-NNA, VTD had no longer had any effect on the contraction of CAs (p = 0.8193; Figure 4a,b). Since L-NNA totally inhibited the VTD-induced vasorelaxant responses (p < 0.0001; Figure 4c), we concluded that VTD induced ACh release by parasympathetic nerves which, in turn, activated NO production in the endothelium, leading to vasorelaxation.
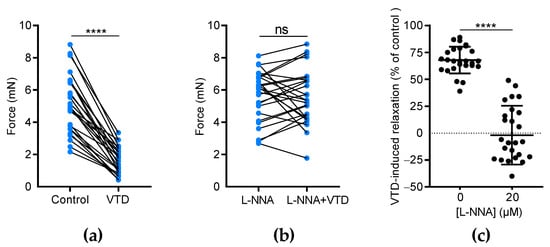
Figure 4.
The effects of L-NNA on VTD-induced vasorelaxation in CAs. (a,b) Connected scatter plots showing the contractile force (in mN) generated by isolated CAs before and after the application of VTD (30 µM) in the absence of L-NNA (a) and in the presence of 20 µM L-NNA (b). (c) Scatter plots illustrating the reduction in VTD-induced relaxation (in %) by L-NNA. All experiments were carried out on pre-contracted CAs with U46619 in the presence of PZ (1 µM). The CAs were isolated from male (n = 16) and female (n = 10) mice. The significance was analyzed by a parametric paired t test (****: p < 0.0001; ns: non-significant; p = 0.8193).
2.3. NCX Inhibition Partially Abolished VTD-Induced Vasorelaxation in CAs
Few studies have reported that NCX is also expressed in the endothelium and contributes to the activation of NO production in ECs [23,24,25]. Thus, we assayed the effects of 2-[2-[4-(4-nitrobenzyloxy)phenyl]ethyl]isothiourea methane sulfonate (KB-R7943), which blocks NCX1-3, and 2-[4-[(2,5-difluorophenyl)methoxy]-phenoxy]-5-ethoxyaniline (SEA0400), a selective blocker of NCX1 [26]. In the presence of KB-R7943 (10 µM), the VTD-induced vasorelaxant responses were strongly decreased by 3.0 folds (p < 0.0001; Figure 5a). SEA0400 also significantly reduced the VTD-induced vasorelaxation in a concentration-dependent manner by 1.5 and 2.7 folds, at 1 and 10 µM, respectively (p < 0.0001; Figure 5b). These results indicate that NCX likely contributes to the activation of endothelial NO synthase (eNOS) in the endothelium in response to VTD-induced ACh release.
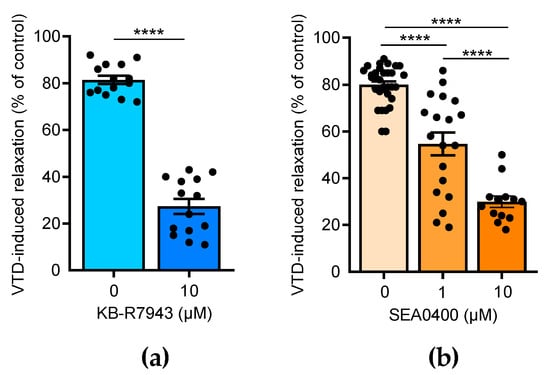
Figure 5.
Effects of NCX antagonists on VTD-induced vasorelaxation in CAs. Scatter plots illustrating reduction in VTD-induced vasorelaxant responses of CAs with KB-R7943 (10 µM, NCX blocker) (a) and with SEA0400 (1 and 10 µM, NCX1 blocker) (b). CAs were pre-contracted with U46619 in presence of PZ (1 µM). CAs were isolated from males (n = 7) and females (n = 7) (b). Values are means ± SEM. Significance was analyzed with paired t test (a) and one-way ANOVA, followed by Tukey multiple comparison test (b) (****: p < 0.0001).
Overall, these findings show that VTD binds to NaV channels in perivascular nerves, leading to NO-dependent vasorelaxation induced by ACh, involving the contribution of NCX. Like NaV channels, NCX is expressed in neurons, SMCs, and ECs [27], and both can be functionally coupled in these cells [11,17,28]. We have previously shown that NaV channels are expressed in SMCs and ECs of mouse CAs [29], but NCX expression has not yet been described in this artery. Hence, we first characterized the expression of NCX in CAs, ECs and SMCs isolated from mouse mesenteric arterial beds. The absolute RT-qPCR data show that only Slc8a1, encoding NCX1, was expressed in ECs and SMCs isolated from MAs (Figure 6a). Slc8a2 (encoding NCX2) and Slc8a3 (encoding NCX3) were not detectable. We then confirmed the expression of NCX1 by Western blotting and immunohistochemistry. The anti-NCX1 antibodies allowed the immunostaining of two bands with molecular weights corresponding to NCX1 with protein extracts from CAs (Figure 6b). In addition, strong immunolabeling was observed in CAs, exclusively in ECs and in co-localizing with the platelet EC adhesion molecule (PECAM1), an endothelium marker (Figure 6c).
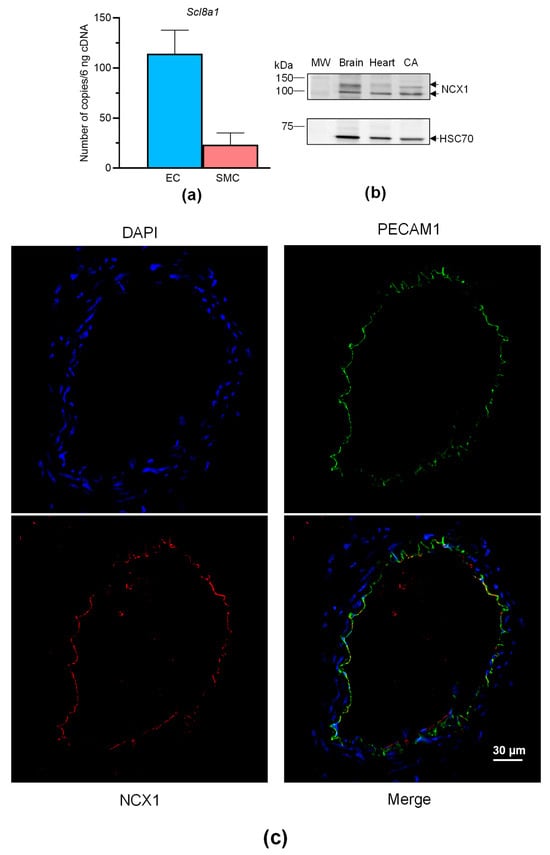
Figure 6.
NCX expression in CAs. (a) Histograms showing the mRNA expression levels of NCX determined by absolute RT-qPCR in CAs collected from male and female mice. (b) NCX1 immunoblotting in the CAs. NCX1 expression was evaluated in CAs by Western blotting with an anti-NCX1 antibody. HSC70 was used as a loading control and mouse brains and hearts were used as positive control samples. The experiments were carried out with 10 µg of proteins. Due to the limited size of the CAs, segments of three mice were pooled. (c) NCX1 immunolocalization in CAs. NCX1 were immunodetected in CAs by an anti-NCX1 antibody (red). Endothelium was immunolabeled by an anti-PECAM1 antibody (green). The nucleus was labeled by DAPI (blue). Values are the means ± SEM of three independent experiments. MW: molecular weight.
2.4. VTD Has No Effects on Intracellular Ca2+ in ECs
Since NaV channels are expressed in the ECs of FOMAs and CAs [29], and a functional coupling between these channels and NCX has been evidenced in human umbilical ECs (HUVECs) [11], we investigated whether VTD could induced a Ca2+ response in mouse ECs, which can induce the activation of eNOS [23,24,25]. The RT-qPCR data show that the Mile Sven 1 pancreatic ECs (MS1 ECs) expressed Nos3, encoding eNOS, and the EC markers Pecam1 and Chrm3, encoding the muscarinic receptor subtype 3 (M3-mAChR), showing that they constitute a convenient model for our study (Figure 7a). In addition, we found that the MS1 ECs expressed scn3a and scn1b, encoding the NaV channel subunits NaV1.3 and NaVβ1 (Figure 7b). The following genes were undetectable: scn1a, scn2a, scn4a, scn5a, scn8-11a, and scn2-4b. NaV channel expression was also evidenced by Western blotting (Figure 7b). At 30 µM, VTD did not modify [Ca2+]i in the MS1 ECs, despite the endogenous expression of NaV channels, nor NaV channel activators such as batrachotoxin (BTX) and brevetoxin 2 (PbTx2) (Figure 7c). In addition, while ACh induced a clear [Ca2+]i elevation, this response was not affected by the co-injection of VTD, nor by TTX (Figure 7d,e). As expected, the ACh-induced Ca2+ response was totally inhibited by AP (Figure 7e). These observations are thus consistent with our assessment that the VTD-induced relaxation of CAs is due to NaV channel activation in cholinergic perivascular nerves, leading to ACh release, and not to a direct effect of VTD in ECs.
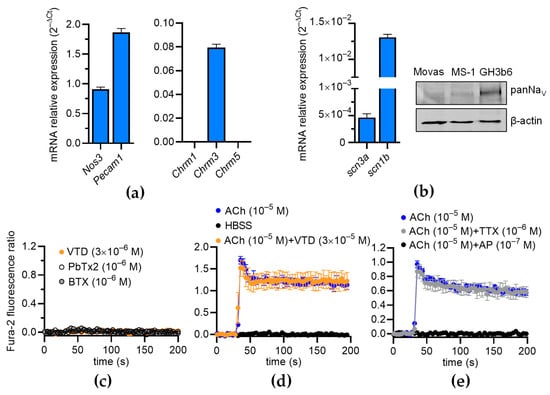
Figure 7.
Effects of VTD on intracellular Ca2+ concentration in MS1 ECs. (a,b) RT-qPCR data, illustrated as RNA relative level (2−ΔCT), showing expression of nos3, pecam1, chrm1-3, scn3a, and scn1b. Undetectable genes are not represented (scn1a, scn2a, scn4a, scn5a, scn8-11a, scn1-2b, and scn4b) (b) Western blot (right panel) illustrating NaV channel expression in MS1 ECs. Western blot was performed with 30 µg of proteins. PanNaV and β-actin antibodies were used. GH3b6 cells were used as positive control. (c,d) Example of kinetic traces of Fura-2 fluorescence–emission ratio obtained before and after injection, at 30 s, of VTD, brevetoxin 2 (PbTx2), batrachotoxin (BTX) (c), and ACh (d,e). Effects of co-injection of ACh and VTD or TTX or AP are shown (d,e). Hank’s Balanced Salt Solution (HBSS) was used as negative control. Data are the mean ± SEM of three independent experiments (n = 3).
2.5. NCX1 Contributes to ACh-Induced Ca2+ Responses in ECs
To further analyze the contribution of NCX in ECs, we first characterized the expression of NCX in MS1 ECs. We found that the MS1 ECs endogenously expressed Slc8a1 (Figure 8a, left panel), while Slc8a2 and Slc8a3 were undetectable by RT-qPCR. The expression of NCX1 was confirmed at the protein level by Western blotting (Figure 8a, right panel). As expected, the ACh-induced Ca2+ increase was completely inhibited by AP (100 nM), indicating that ACh-induced Ca2+ responses are mediated by muscarinic receptors (Figure 8b, left panel). In the absence of extracellular Ca2+, the Ach-induced Ca2+ responses exhibited a peak with the same amplitude as the control, followed by a slow decrease in the signal over time (Figure 8b, left panel). However, in the absence of extracellular Na+, the ACh-induced Ca2+ responses were considerably reduced (Figure 8b, left panel). Indeed, the ACh-induced Ca2+ responses decreased to 70.23 ± 4.72% (n = 9; p < 0.01; Wilcoxon test) in the absence of extracellular Ca2+ and dropped to 24.83 ± 3.75% (n = 9; p < 0.01; Wilcoxon test) in the absence of extracellular Na+ (Figure 8b, right panel). The ACh-induced Ca2+ responses were significantly lower in the absence of extracellular Na+ than in the absence of extracellular Ca2+ (p < 0.0001) (Figure 8b, right panel). Thus, the ACh-induced Ca2+ responses in the ECs depended on extracellular Ca2+ and extracellular Na+, in agreement with the contribution of NCX via the Ca2+ entry mode [30].
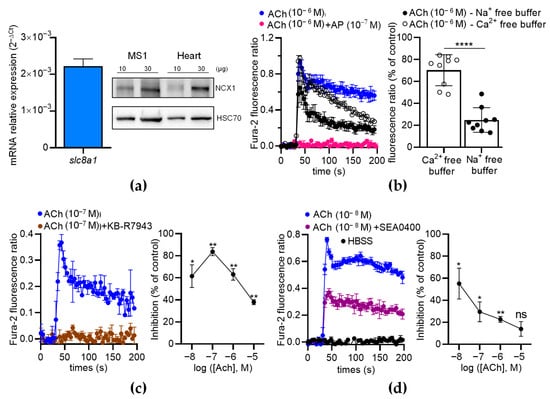
Figure 8.
The effects of NCX antagonists on the ACh-induced Ca2+ response in MS1 ECs. (a) RT-qPCR data (left panel) illustrated as the RNA relative level (2−ΔCT), showing the expression of slc8a1, encoding NCX1. The undetectable genes (Slc8a2 and Slc8a3) are not illustrated. The Western blot (right panel) shows the immunodetection of NCX1 in the MS1 ECs. HSC70 antibodies were used as loading controls. Protein extracts from mouse hearts served as positive controls. (b) An example of kinetic traces of the Fura-2 fluorescence–emission ratio, illustrating the effects of ACh (1 µM) co-injected or not co-injected with AP (100 nM), in free Na+ and Ca2+ buffers. The histograms illustrate the normalized emission ratio of Fura-2 measured after Ach injection (1 µM) in Ca2+-free buffer and in Na+-free buffer. These data represent the area under the curve (AUC) calculated from the kinetic traces and after normalization by ACh-induced responses at 1 µM in Hank’s Balanced Salt Solution (HBSS), used as the control. (c,d) The effects of NCX antagonists on the ACh-induced Ca2+ response in MS1 ECs. The left panels show examples of kinetic traces of the Fura-2 fluorescence–emission ratio before and after the injection, at 30 s, of ACh, which led to the highest inhibition induced by the two NCX antagonists KB-R7943 (10 µM) (c) and SEA0400 (10 µM) (d). The graphs on the right panels illustrate the inhibition (% of control) induced by KB-R7943 (c) and SEA0400 (d), as a function of the ACh concentration. HBSS was used as a negative control (d). Data are the mean ± SEM of three independent experiments (n = 3). Statistical significances were determined using the Mann–Whitney test (b) and Wilcoxon test (c,d) (* p < 0.05; ** p < 0.01; **** p < 0.0001; ns: non-significant).
Then, we used two inhibitors of the Ca2+ entry mode of NCX: KB-R7943 and SEA0400. The ACh-induced Ca2+ responses were much lower when ACh was co-injected with KB-R7943 (10 µM) or SEA0400 (10 µM) (Figure 8c,d). With KB-R7943, the inhibition rate depended on the ACh concentrations (Figure 8c, right panel). Notably, the highest inhibition rate occurred at 10−7 M of ACh (87.7% of inhibition based on the area under the curve determination (AUC)) and progressively decreased with increasing ACh concentrations (Figure 8c, right panel). The inhibitory effects of SEA0400 on the Ca2+ responses were the highest at 10−8 M of ACh and decreased with increasing ACh concentrations (Figure 8d, right panel). Similar results were observed with a third inhibitor of the Ca2+ entry mode of NCX, i.e., 2-[[4-[(4-Nitrophenyl)methoxy]phenyl]methyl]-4-thiazolidinecarboxylic acid ethyl ester (SN-6) at 10 µM (Figure S1).
Altogether, our data show that NCX1 contributes to [Ca2+]i elevation induced by ACh in MS1 ECs.
2.6. Thapsigargin and Chelerythrine Reduce ACh-Induced Ca2+ Responses in ECs
Our data show that extracellular Ca2+ partially contributes to ACh-induced Ca2+ responses in MS1 ECs, suggesting the involvement of Ca2+ store mobilization, as already described in other ECs [31,32,33]. Thus, we used thapsigargin to deplete the endoplasmic reticulum (ER) Ca2+ store in the MS1 ECs and measure the effects of ACh. We found that thapsigargin (5 µM) totally suppressed ACh-induced Ca2+ responses in the MS1 ECs (Figure 9a). Thus, the cytosolic elevation of Ca2+ was mainly mediated by store-operated channels, such as inositol 1,4,5 triphosphate receptors. Because the Ca2+ signaling pathway activated by ACh leads to PKC activation, which is known to increase NCX1 activity by phosphorylation [34,35], we tested the effects of its inhibition with chelerythrine, a pan-PKC inhibitor [36]. ACh-induced Ca2+ responses were measured with the same protocol used for testing NCX inhibitors. We observed that chelerythrine suppressed Ca2+ responses induced by 10−8 M of ACh (100.0% inhibition; p < 0.01). The inhibitory effects of chelerythrine progressively decreased when the ACh concentration was increased to reach 31.6% (p < 0.01) of the inhibition with 10−5 M of ACh (Figure 9b).
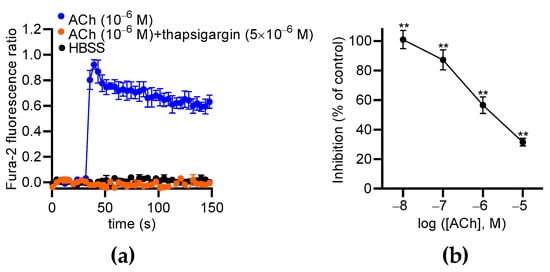
Figure 9.
The effects of thapsigargin and chelerythrine on ACh-induced Ca2+ responses in MS1 ECs. (a) The effects of thapsigargin (5 µM) on Ca2+ responses induced by 1 µM of ACh. Hank’s Balanced Salt Solution (HBSS) was used as a negative control. (b) The curves represent the inhibitory effects of chelerythrine (10 µM) on the Ca2+ responses induced by 0.01, 0.1, 1, and 10 µM of ACh in the MS1 ECs. The analyses were based on the area under the curve determined from the kinetic traces. The data were normalized by the Ca2+ response induced by ACh at 10 µM. The mean values of the inhibitory effects were compared to 0% using a one-sample t test (** p < 0.01). Values are means ± SEM (n = 3).
In conclusion, ACh induces Ca2+ release from ERs and then the activation of PKC that likely stimulates NCX1 in the Ca2+ entry mode.
3. Discussion
In the present study, we show that VTD induces vasorelaxation in CAs and MCAs, implicating the activation of NaV channels. Since VTD-induced vasorelaxation in the CAs was higher in the presence of PZ and totally inhibited by the muscarinic receptor antagonist AP, we assumed that this contractility response was the consequence of NE and ACh releases from sympathetic and parasympathetic perivascular nerves, respectively. The VTD-induced vasorelaxation in the CAs was inhibited by AP and L-NNA, suggesting that this response was mediated by NO production in ECs. In addition, we found that VTD-induced vasorelaxation is mediated by NCX. Using MS1 ECs, we showed that VTD had no effect on [Ca2+]i in the ECs, even though they expressed NaV channels at both transcriptional and protein levels. This reinforces the idea that VTD activates NaV channels in cholinergic perivascular nerves, leading to ACh release and endothelium-dependent vasorelaxation. Finally, we evidenced that, in MS1 ECs, ACh induces cytosolic Ca2+ elevation involving NCX1 in the Ca2+ entry mode.
We first aimed to study the role of NaV channels, endogenously expressed in ECs and vascular smooth muscle cells (VSMCs), in the vasomotor regulation of small arteries. Indeed, VTD has been extensively used to study the implication of vascular NaV channels in the contraction of isolated arteries [12,13,15,18,37]. However, the ⍺-1 adrenoceptor antagonist PZ strongly reduces VTD-induced contraction in the first-order MAs of rats [12] and suppresses the vasoconstriction of rat aortas [13] and human uterine arteries [37]. Our present findings, showing that VTD-induced vasorelaxation in MCAs is suppressed by AP, are in agreement with these reports. Thus, VTD activates the NaV channels of perivascular nerves, and its vascular effects arise from the release of NE or ACh, depending on the artery. These observations raise a question concerning the contribution of NaV channels in both arterial SMCs and ECs in vascular motricity. We have previously shown that TTX induces vasorelaxation in mouse CAs in the presence of VTD, PZ, and AP, indicating that arterial NaV channels can be activated during arterial constriction [29]. In this context, the vascular effects of VTD must be carefully considered, and the role of NaV channels endogenously expressed in ECs and VSMCs remains unclear under physiological conditions.
Thus, the contractile effect of VTD on MAs depends on the branch type, reflecting differences in vasomotor innervation. Indeed, VTD induces contraction in FOMAs from rats [12] and mice (Figure S2), while it induces vasorelaxation in CAs and MCAs. These arteries are known to be densely innervated, and, notably, it is well established that FOMAs and other branches of cranial mesenteric arteries are innervated by both adrenergic- and calcitonin gene-related peptide (CGRP) nerves that are vasoconstrictor and vasodilator, respectively [22,38,39,40]. None or few cholinergic nerves have been detected in FOMAs, and they are not associated with vasomotor regulation [22]. Thus, our data are consistent with these statements, as VTD-induced vasoconstriction in FOMAs is abolished by the ⍺-1 adrenoceptor antagonist (Figure S2). However, the innervation of CAs has not been described in detail, but the fact that the VTD-induced vasorelaxation was abolished by the muscarinic receptor antagonist strongly suggests that this branch contains vasomotor cholinergic nerves. These differences in the vasomotor innervation between the FOMAs and CAs likely reflect differences in jejunum–ileum and cecum vascularization to allow the fine control of blood flow throughout the mesenteric bed. Further experiments would help to confirm the distribution and function of cholinergic nerves in CAs.
Here, we assume that VTD induced ACh release from parasympathetic nerves and subsequently endothelial NO production, which triggered vasorelaxation. Indeed, we observed that L-NNA suppressed VTD-induced vasorelaxation in CAs. Since eNOS activity is regulated by Ca2+-dependent and phosphatidylinositol-3 kinase/Akt pathways, we can postulate that VTD indirectly evokes [Ca2+]i elevation in ECs [41]. In addition, regarding that ACh induced [Ca2+]i elevation mediated by Gq/11-coupled muscarinic receptors, we assume that this pathway was involved in the eNOS activation observed in the VTD-treated CAs. Moreover, the NCX antagonists KB-R7943 and SEA0400 significantly reduced VTD-induced vasorelaxation in the CAs, suggesting that endothelial NCX contributes to [Ca2+]i elevation and, subsequently, to NO production, as previously described [23,24,25]. This assessment is supported by our observation of the expression of NCX1 in the endothelium of the CAs and in the dissociated ECs. NCX is also expressed in neurons [27], but since the mAChR antagonist AP abolishes VTD-induced vasorelaxation in CAs, we could exclude its contribution.
VTD did not affect [Ca2+]i concentration in the MS1 ECs. Thereby, there was not functional coupling between NaV channels and Ca2+ homeostasis in these cells, as has been described in HUVECs [11]. This suggests that NaV channels are not involved in the regulation of NO production in the endothelium. Thus, we could exclude the implication of endothelial NaV channels in the VTD-induced relaxation observed in the CAs, which was more likely due to ACh release and, in turn, store-operated Ca2+ release, leading to eNOS activation [42]. By monitoring [Ca2+]i, we found that primary ECs from the MAs and MS1 ECs exhibited similar responses to ACh, with a peak and a sustained component, as previously described [43]. The ACh-induced Ca2+ responses in both cell models were initiated by Ca2+ release from intracellular stores, as they were inhibited by incubation with thapsigargin. Moreover, ACh-induced [Ca2+]i elevation was significantly reduced in the Ca2+-free or Na+-free media, in agreement with previous studies [24].
Our data evidenced that only Slc8a1 transcripts were expressed in dissociated ECs from the MAs and MS1 ECs, indicating that only NCX1 was expressed in the endothelium. Thus, the reduction in ACh-induced Ca2+ elevation by NCX inhibitors in the MS1 ECs revealed the contribution of the Ca2+ exchange entry mode of NCX1 in the Ca2+ signaling. This mechanism could explain why NCX and eNOS inhibitors also reduced VTD-induced vasorelaxation in the CAs. Since L-NNA totally suppressed the VTD-induced vasorelaxation in the CAs, we did not explore the implication of NCX1 in the endothelium-derived hyperpolarizing factor (EDHF) pathway, although this pathway has been shown to contribute to vasorelaxation induced by ACh in rat MAs [23]. The Ca2+ entry mode of NCX1 in ECs has also been proven in other EC models, such as ECs from MAs, HUVECs, and cardiac microvessels [23,44,45]. Our findings bring novel evidence of the Ca2+ entry mode of NCX1 in the endothelium which must be considered a significant actor in Ca2+-dependent vasodilation.
We showed that the MS1 ECs expressed only the muscarinic M3-mAChR, and its activation by ACh induced Ca2+ release from the ERs and extracellular Ca2+ entry through NCX1. Indeed, M3-mAChR is coupled to Gq/11 proteins that can activate phospholipase Cβ and the subsequent release of inositol 1,4,5-triphosphate (IP3) from the plasma membrane [46]. The release of IP3 in the cytoplasm triggers Ca2+ release from ERs, which constitutes the first step leading to [Ca2+]i elevation. NCX1 could participate in [Ca2+]i elevation in a second phase, as already described [23]. In this context, the activation of the Ca2+ entry mode of NCX1 is more complex to understand. TrpV4 and TrpC channels have also been shown to contribute to [Ca2+]i elevation induced by ACh and bradykinine in ECs [47,48], and both could lead to a [Na+]i increase that could in turn activate the Ca2+ entry mode of NCX1 [23]. Here, we can definitively exclude the involvement of NaV channels in [Na+]i increase in MS1 ECs. Interestingly, our data showed that the activation of PKC, which certainly occurred after Ca2+ release from the ERs, could contribute to the activation of the Ca2+ entry mode of NCX1. Further experiments using RNAi or shRNA to inhibit the expression of PKC in ECs will be needed to confirm this assumption.
4. Conclusions
Our data demonstrate that the vasomotor responses mediated by VTD are due to the activation of NaV channels expressed in perivascular nerves in mouse CAs. Indeed, VTD induces vasorelaxant response in CAs, which is suppressed by AP, revealing ACh release by cholinergic perivascular nerves. ACh release exclusively causes intracellular Ca2+ elevation, mediated by NCX1 in the endothelium, which activates eNOS. Finally, we propose that the Ca2+ entry mode of NCX1 could be activated by PKC. In addition, our data bring novel evidence that arterial hypotension observed during VTD poisoning could be partially attributed to a diminution of peripheral vascular resistance.
5. Materials and Methods
5.1. Chemicals and Reagents
VTD was obtained from Santa Cruz Biotechnology (Dallas, Texas, USA). TTX was obtained from Latoxan (Valence, France). U46619 was obtained from Cayman Chemical (Ann Arbor, MI, USA). Fura-2-AM and Optical Cutting Temperature (OCT) compounds were obtained from Thermo Fisher Scientific (Waltham, MA, USA). All other chemicals including ACh, phenylephrine (Phe), PZ, AP, L-NNA, KB-R7943, SEA0400, SN-6, thapsigargin, chelerythrine, and pluronic®-F127 acid were obtained from Sigma-Aldrich Merck (Saint-Louis, MO, USA).
5.2. Ethical Statement, Animal Care, and Conditioning
All animal procedures were realized in compliance with the European Community council directive 2010/63/EU for the care and use of laboratory animals and were approved by our local ethical committees (N° A49007002, Animal facilities Unit of the Hospital University of Angers (SCAHU)). All experiments using mice were conducted in accordance with the NC3R’s ARRIVE guidelines. Male and female C57BL/6j mice were purchased from Janvier Labs (Le Genest-Saint-Isle, France) and used at the age of 5–6 months. The mice were euthanized by CO2 inhalation in an automated chamber (Tem Sega, Pessac, France).
5.3. Wire Myography
The wire myograph technique was used to measure the contractility of the mice MAs, as already described, using a Mulvany–Halpern-type wire myograph (Danish MyoTechnology, DMT, Aarhus, Denmark) [29,49]. Two different branches of MAs, CAs and MCAs, were collected (Figure 1b) in cold physiological salt solution (PSS, in mM: NaCl, 130; KCl, 3.7; MgSO4(7H2O), 1.2; NaHCO3, 14.9; CaCl2(2H2O), 1.6; HEPES, 5; KH2PO4, 1.2; D-glucose, 11) at a pH of 7.4 (pO2 160 mmHg and pCO2 37 mmHg). After the removal of adherent tissues, mainly perivascular fat, CA and MCA segments with a length of 2 mm were mounted on a myograph The contractile responses of the CAs and MCAs were measured in 5 mL PSS maintained at 37 °C and at a pH of 7.4 (pO2 160 mmHg and pCO2 37 mmHg), as previously described [29]. After wall tension normalization, the arteries were stabilized for 40 min. The maximal contractile capacity was triggered in PSS containing 80 mM K+ with 3 µM Phe. The endothelial integrity of each artery was controlled after contraction with 2 µM Phe and then 2 µM ACh that induced vasorelaxation. Arteries that did not show endothelium-dependent relaxation (relaxation in response to Ach) were discarded. To characterize the VTD effects, each artery was progressively contracted with U46619 (15 to 90 nM of thromboxane A2 analog by 5 nM increment) to determine the concentration of U46619 that induced 50% of its maximal contraction. PZ (an α1-adrenoceptor inhibitor, 1 µM) or a cocktail of PZ and AP (a muscarinic receptor antagonist, 100 nM) were used to inhibit the effects of NE and ACh released by sympathetic and parasympathetic perivascular nerves, respectively, for 20 min before VTD application. VTD-induced effects were analyzed in the presence of TTX (0.3 and 1 µM) or in a low Na+ PSS (in mM: choline chloride, 130; KCl, 3.7; MgSO4(7H2O), 1.2; NaHCO3, 14.9; CaCl2(2H2O), 1.6; HEPES, 5; KH2PO4, 1.2; D-glucose, 11). To characterize the VTD-induced vasorelaxation responses observed in the CAs, experiments were performed in the presence or absence of L-NNA (20 µM, a nitric oxide synthase inhibitor), KB-R7943 (a NCX inhibitor; 10 µM), or SEA0400 (a selective NCX1 inhibitor; 1 and 10 µM).
5.4. Cell Culture
As a model of ECs, the primary murine mesenteric EC (C57BL/6 mouse primary intestinal mesenteric vascular endothelial cells, M1168, Cell Biologics, Chicago, IL, USA) and Mile Sven 1 MS1 murine pancreatic endothelial cell line (CRL-2279, ATCC®, authenticated by ATCC on 26 March 2021) were used. The primary ECs were cultured in complete mouse endothelial cell medium (Cell Biologics) and used from passage 4 until passage 6. The MS1 cells were cultured from passage 8 until passage 20 at 37 °C/5% CO2 in DMEM/F12 (PAN-Biotech, Aidenbach, Germany) supplemented with 10% FCS (Eurobio Scientific, Les Ulis, France), 1 mM L-glutamine (PAN-biotech), and 1 mM of penicillin and streptomycin solution (PAN-Biotech).
5.5. Quantitative Real-Time Polymerase Chain Reaction
To quantitate NCX transcript expression, total RNAs were extracted from the CAs, isolated mesenteric vascular cells, and MS1 ECs using the RNeasy micro kit (Qiagen, Courtaboeuf, France), as described previously [50]. A total of 300 ng of total RNA was processed for cDNA synthesis using random hexamers and the QuantiTect Reverse Transcription kit (Qiagen). Real-time PCR assays were assessed using a LightCycler 480 Instrument II (Roche, Meylan, France) using the Sybr® Select Master Mix (Applied Biosystems Inc., Lincoln, CA, USA), 6 ng of cDNA in duplicate, and gene-specific primers (see Table 1) previously designed using the Primer3 Software. The cycle threshold method was used to determine differences in transcript expression levels, as described earlier [51]. Amplification specificity was confirmed by one peak-melting curve at the end of the amplification process. To perform the absolute quantification method, 3 cDNA clones of mouse, Slc8a1-3 (ABIN4099663, ABIN4102124, and ABIN4102129, Genomics, Aachen, Germany) were used. All cDNA sequences were verified and guaranteed by genomics. To calculate the copy numbers of the transcripts, cDNA copies were evaluated using the calibration curve method from the recombinant double-stranded plasmid DNA molecule, as previously described [52]. The cDNA copy numbers of 8 plasmid dilutions were used to establish the calibration curves for each gene, allowing PCR efficiency determination (~100% for each gene). For the relative quantification method, gene expression levels were normalized to the means of the expression levels of 3 validated housekeeping genes using the 2−ΔCT method: Gapdh (glyceraldehyde-3-phosphate dehydrogenase), Hprt (hypoxanthine phosphoribosyltransferase), and Gusb (beta-glucuronidase).

Table 1.
Sequence of primers used for real-time RT-PCR.
5.6. Immunohistochemistry
CAs cryoconserved in an embedding medium OCT compound were transversally cut to 10 µm thick using Cryostat (Leica) at −25 °C and placed on SuperFrostPlus slides (Thermo Fisher Scientific, USA). The artery slices were dried at room temperature. Immunofluorescence staining was performed using the anti-NCX1 mouse primary antibody (1:500, R3F1, Swant AG, Burgdorf, Switzerland). The endothelium was identified with anti-PECAM1 rabbit primary antibodies (anti-CD31 labeled with FITC, 1:50, eBioscience Inc., San Diego, CA, USA). Nuclei were stained with DAPI 10 µg/mL (Molecular probes, Invitrogen, Eugene, OR, USA). All the primary antibodies and DAPI were incubated overnight at 4 °C in a dark room. The artery slices were washed and then incubated with Alexa fluor 568 conjugated goat anti-mouse antibodies (1:200, Invitrogen) for 3 h at 4 °C in dark room. After washing, a drop of aqueous mounting medium (Fluoromount, Sigma-Aldrich Merck, Saint-Louis, MO, USA) was placed on the artery slices, and a coverslip was then put on each slide. After drying for 1 h, fluorescent staining was revealed using a confocal microscope Nikon Eclipse TE2000-S. Imaging acquisition was performed with Metamorph software (Molecular Devices, San Jose, CA, USA). Negative control experiments excluding the primary antibody were carried out to validate the specificity of the immunofluorescence labeling.
5.7. Western Blotting
MS1 ECs were lysed in RIPA extraction buffer (50 mM Tris-HCl, 150 mM NaCl, 12 mM Na Deoxycholate, 0.1% SDS, 1% Triton X-100, and protease inhibitor cocktail (Thermo Fisher Scientific)). After homogenization for 30 min at 4 °C, the samples were centrifuged at 14,000× g at 8 °C for 20 min. The protein quantity of the supernatant was determined using the Micro BCA Protein Assay Kit (Thermo Fisher Scientific). Either 10 or 30 µg of proteins were separated by SDS-PAGE (10% polyacrylamide gel) and then transferred to a nitrocellulose membrane. The non-specific binding sites were blocked with Tris-buffered saline solution containing 0.1% Tween and 5% BSA for 90 min. Next, the membranes were incubated with rabbit anti-NCX1 (1:500, ANX-011, Alomone Labs, Jerusalem, Israel) or rabbit anti-Pan NaV (1:200, ASC-003, Alomone Labs) primary antibodies overnight at 4 °C. Anti-β-actin (1:10,000, A3854, Sigma-Aldrich Merck) or anti-HSC70 primary antibodies (1:10,000, SC-7298, Santa Cruz Biotechnology, Dallas, TX, USA) were used as loading controls. After washing, the membranes were incubated with the anti-rabbit or -mouse secondary antibodies conjugated to horseradish peroxidase (1:5000, Thermo Fisher Scientific) for 90 min. Proteins were revealed using the Pierce ECL Western Blotting Substrate kit (Thermo Fisher Scientific) and an LAS-3000 imager (Fuji, Tokyo, Japan). Image acquisition was performed with Image Labs (BioRad, Hercules, CA, USA).
5.8. Fluorescence Assays
MS1 ECs were plated at a density of 20,000 cells per well (96 wells) in their adequate medium and assayed 24 h after plating using a FlexStation® 3 Benchtop Multi-Mode Microplate Reader (Molecular Devices, Sunnyvale, CA, USA). The cells were washed with Ca2+ buffer (Hank’s Balanced Salt Solution, HBSS) and supplemented with 2.5 mM CaCl2, 1 mM MgCl2, 10 mM HEPES, and 0.5% BSA with a pH adjusted at 7.4. Next, the MS1 ECs were incubated for 1 h at room temperature in the freshly prepared Fura-2-AM buffer (5 µM Fura-2-AM and 0.02% Pluronic®-F127 acid dissolved in Ca2+ buffer). After washing, they were incubated in Ca2+ buffer for 45 min for the complete de-esterification of Fura-2-AM. To evaluate the variation of [Ca2+]i, the plates were exposed at 340 nm and 380 nm excitation wavelengths. The fluorescence emission spectra were recorded at 510 nm for 180 s with an acquisition frequency of 0.25 Hz. After a 30 s baseline, ACh (0.1 Nm–10 µM) was automatically injected to stimulate the cells. To evaluate the effects of NCX inhibition, KB-R7943 (10 µM) or SEA0400 (10 µM) were co-injected with ACh. The MS1 ECs were also stimulated with ACh in Na+-free buffer (HBSS containing choline chloride instead of Na+ and supplemented with 2.5 mM CaCl2, 1 mM MgCl2, 10 mM HEPES, and 0.5% BSA at a pH of 7.4) or in Ca2+-free buffer (HBSS supplemented with 2.5 mM EGTA, 1 mM MgCl2, 10 mM HEPES, and 0.5% BSA at a pH of 7.4). To empty the ER Ca2+ storage, the cells were treated with the specific inhibitor of SERCA, thapsigargin (5 µM), before ACh-stimulation. Each condition was carried out in 3–5 wells. All experiments were repeated at least three times (n = 3–4). Data acquisition was performed with SoftMax Pro 5.4.1 software (Molecular Devices, Sunnyvale, CA, USA).
5.9. Statistical Analysis
GraphPad Prism 7.02 (La Jolla, CA, USA) software was used for graph generation and statistical analyses. All data presented are the mean ± SEM. The normality of the data distribution was evaluated using the Shapiro–Wilk test, and significance tests between groups were performed using parametric or non-parametric tests when appropriate. To analyze the significance between two groups, the t-test, Wilcoxon test, or Mann–Whitney test were used when appropriate. For multiple comparisons, the Kruskal–Wallis test, followed by Dunn’s post hoc test, was used. Wire myography experiments were repeated with isolated arteries from at least 7 animals. Data from fluorescence assays are the mean ± SEM, calculated from at least 3 independent experiments (n = 3–4). The kinetic traces of Fura-2 fluorescence were plotted as an emission ratio (λex 340 nm/λ ex 380nm), and the integration of the fluorescence kinetics (AUC) was used for data analysis. Differences with p < 0.05 were considered significant (ns: not significant; * for p < 0.05; ** for p < 0.01; *** for p < 0.001; **** for p < 0.0001).
Supplementary Materials
The following supporting information can be downloaded at https://www.mdpi.com/article/10.3390/toxins16120533/s1. Figure S1: Effects of SN-6 on ACh-induced Ca2+ response in MS1 ECs, Figure S2: Effects of veratridine on first order mesenteric arteries from mice.
Author Contributions
Conceptualization, C.L. (Christian Legros); methodology, C.M. (César Mattei), C.L. (Claire Legendre) and C.L. (Christian Legros); formal analysis, J.P. and C.L. (Christian Legros); investigation, J.P., C.S., J.F., L.R., C.P., L.G., E.V., J.B. and C.L. (Claire Legendre); writing—original draft preparation, C.L. (Christian Legros) and J.P.; writing—review and editing, D.H., C.M. (Céline Marionneau), Z.F., C.L. (Christian Legros) and C.L. (Claire Legendre); supervision, C.L. (Christian Legros); project administration, C.L. (Christian Legros); funding acquisition, C.L. (Christian Legros). All authors have read and agreed to the published version of the manuscript.
Funding
This research was funded by the “Region Pays de la Loire, Paris scientifiques 2017, SODIVASC”. J.P. was a recipient of a PhD fellowship from this grant.
Institutional Review Board Statement
All animal procedures were carried out in accordance with the European Community council directive 2010/63/EU for the care and use of laboratory animals. The animal study protocol was approved by the ethics committee SCAHU (N°A49007002) and the ethics committee “Pays de la Loire” (CEEA 006, protocol N°APAFIS#24014-202001311653562, 17 April 2020).
Informed Consent Statement
Not applicable.
Data Availability Statement
The original contributions presented in this study are included in the article/Supplementary Materials. Further inquiries can be directed to the corresponding author(s).
Acknowledgments
We thank Vincent Paillé and Nathalie C Guérineau for helpful discussions during this work. We are grateful to Evelyne Benoit for her scientific advice concerning this work. We also thank Elodie Le Seac’h, William Ehanno, Anne-Laure Guihot, Agnès Barbelivien, and Louis Gourdin for their technical assistance during the work.
Conflicts of Interest
The authors declare no conflicts of interest.
Correction Statement
This article has been republished with a minor correction to the correspondence contact information. This change does not affect the scientific content of the article.
Abbreviations
The following abbreviations are used in this manuscript:
| ACh | acetylcholine |
| AP | atropine |
| AUC | area under curve |
| CA | cecocolic artery |
| [Ca2+]i | intracellular Ca2+ concentration |
| EC | endothelial cell |
| ER | endoplasmic reticulum |
| FOMA | first-order mesenteric artery |
| IP3 | inositol 1,4,5 triphosphate |
| L-NNA | N(ω)-nitro-L-arginine |
| MA | mesenteric artery |
| MCA | middle cecolic artery |
| MS1 | Mile Sven 1 murine |
| M3-mAChR | muscarinic receptor subtype 3 |
| [Na+]i | intracellular Na+ concentration |
| NaV channel | voltage-gated Na+ channel |
| NE | norepinephrine |
| Phe | phenylephrine |
| PZ | prazosin |
| TTX | tetrodotoxin |
| TTX-R | resistant to tetrodotoxin |
| TTX-S | sensitive to tetrodotoxin |
| VSMC | vascular smooth muscle cell |
| VTD | veratridine |
References
- Krayer, O.; Acheson, G.H. The Pharmacology of the Veratrum Alkaloids. Physiol. Rev. 1946, 26, 383–446. [Google Scholar] [CrossRef] [PubMed]
- Ulbricht, W. Effects of Veratridine on Sodium Currents and Fluxes. In Reviews of Physiology Biochemistry and Pharmacology, Volume 133; Springer: Berlin/Heidelberg, Germany, 1998; pp. 1–54. ISBN 978-3-540-63945-9. [Google Scholar]
- Craig, R.A.; Garrison, C.E.; Nguyen, P.T.; Yarov-Yarovoy, V.; Du Bois, J. Veratridine: A Janus-Faced Modulator of Voltage-Gated Sodium Ion Channels. ACS Chem. Neurosci. 2020, 11, 418–426. [Google Scholar] [CrossRef] [PubMed]
- Mattei, C.; Legros, C. The Voltage-Gated Sodium Channel: A Major Target of Marine Neurotoxins. Toxicon 2014, 91, 84–95. [Google Scholar] [CrossRef]
- Réthoré, L.; Park, J.; Montnach, J.; Nicolas, S.; Khoury, J.; Le Seac’h, E.; Mabrouk, K.; De Pomyers, H.; Tricoire-Leignel, H.; Mattei, C.; et al. Pharmacological Dissection of the Crosstalk between NaV and CaV Channels in GH3b6 Cells. Int. J. Mol. Sci. 2022, 23, 827. [Google Scholar] [CrossRef] [PubMed]
- Mcdonough, J.H.; Jaax, N.K.; Crowley, R.A.; Mays, M.Z.; Modrow, H.E. Atropine and/or Diazepam Therapy Protects against Soman-Induced Neural and Cardiac Pathology. Toxicol. Sci. 1989, 13, 256–276. [Google Scholar] [CrossRef]
- Grobosch, T.; Binscheck, T.; Martens, F.; Lampe, D. Accidental Intoxication with Veratrum Album. J. Anal. Toxicol. 2008, 32, 768–773. [Google Scholar] [CrossRef]
- Moser, M. Evolution of the Treatment of Hypertension From the 1940s to JNC V. Am. J. Hypertens. 1997, 10, 2S–8S. [Google Scholar] [CrossRef]
- Meilman, E.; Krayer, O. Clinical Studies on Veratrum Alkaloids: I. The Action of Protoveratrine and Veratridine in Hypertension. Circulation 1950, 1, 204–213. [Google Scholar] [CrossRef]
- Uribe, L.A.; Leonardo, S.; Nielsen, T.T.; Steinmann, C.; Campàs, M.; Fragoso, A. Supramolecular Complexes of Plant Neurotoxin Veratridine with Cyclodextrins and Their Antidote-like Effect on Neuro-2a Cell Viability. Pharmaceutics 2022, 14, 598. [Google Scholar] [CrossRef]
- Andrikopoulos, P.; Fraser, S.P.; Patterson, L.; Ahmad, Z.; Burcu, H.; Ottaviani, D.; Diss, J.K.J.; Box, C.; Eccles, S.A.; Djamgoz, M.B.A. Angiogenic Functions of Voltage-Gated Na+ Channels in Human Endothelial Cells: Modulation of Vascular Endothelial Growth Factor (VEGF) Signaling. J. Biol. Chem. 2011, 286, 16846–16860. [Google Scholar] [CrossRef]
- Ho, W.-S.V.; Davis, A.J.; Chadha, P.S.; Greenwood, I.A. Effective Contractile Response to Voltage-Gated Na+ Channels Revealed by a Channel Activator. Am. J. Physiol. Cell Physiol. 2013, 304, C739–C747. [Google Scholar] [CrossRef] [PubMed]
- Fort, A.; Cordaillat, M.; Thollon, C.; Salazar, G.; Mechaly, I.; Villeneuve, N.; Vilaine, J.-P.; Richard, S.; Virsolvy, A. New Insights in the Contribution of Voltage-Gated NaV Channels to Rat Aorta Contraction. PLoS ONE 2009, 4, e7360. [Google Scholar] [CrossRef] [PubMed]
- Rice, F.L.; Albrecht, P.J.; Wymer, J.P.; Black, J.A.; Merkies, I.S.; Faber, C.G.; Waxman, S.G. Sodium Channel NaV1.7 in Vascular Myocytes, Endothelium, and Innervating Axons in Human Skin. Mol. Pain 2015, 11, 26. [Google Scholar] [CrossRef] [PubMed]
- Shinjoh, M.; Nakaki, T.; Otsuka, Y.; Sasakawa, N.; Kato, R. Vascular Smooth Muscle Contraction Induced by Na+ Channel Activators, Veratridine and Batrachotoxin. Eur. J. Pharmacol. 1991, 205, 199–202. [Google Scholar] [CrossRef]
- Bocquet, A.; Sablayrolles, S.; Vacher, B.; Le Grand, B. F 15845, a New Blocker of the Persistent Sodium Current Prevents Consequences of Hypoxia in Rat Femoral Artery. Br. J. Pharmacol. 2010, 161, 405–415. [Google Scholar] [CrossRef]
- Virsolvy, A.; Farah, C.; Pertuit, N.; Kong, L.; Lacampagne, A.; Reboul, C.; Aimond, F.; Richard, S. Antagonism of NaV Channels and α1-Adrenergic Receptors Contributes to Vascular Smooth Muscle Effects of Ranolazine. Sci. Rep. 2015, 5, 17969. [Google Scholar] [CrossRef]
- Figueroa, X.F.; Chen, C.-C.; Campbell, K.P.; Damon, D.N.; Day, K.H.; Ramos, S.; Duling, B.R. Are Voltage-Dependent Ion Channels Involved in the Endothelial Cell Control of Vasomotor Tone? Am. J. Physiol. Heart Circ. Physiol. 2007, 293, H1371–H1383. [Google Scholar] [CrossRef]
- Kratholm, N.M.; Jensen, P.S.; Kringelholt, S.; Simonsen, U.; Bek, T. Activation of Veratridine Sensitive Sodium Channels, but Not Electrical Field Stimulation, Dilates Porcine Retinal Arterioles with Preserved Perivascular Tissue. Curr. Eye Res. 2017, 42, 1497–1502. [Google Scholar] [CrossRef]
- Aalkjaer, C.; Nilsson, H.; De Mey, J. Sympathetic and Sensory-Motor Nerves in Peripheral Small Arteries. Physiol. Rev. 2021, 101, 495–544. [Google Scholar] [CrossRef]
- Westcott, E.B.; Segal, S.S. Perivascular Innervation: A Multiplicity of Roles in Vasomotor Control and Myoendothelial Signaling. Microcirculation 2013, 20, 217–238. [Google Scholar] [CrossRef]
- Tangsucharit, P.; Takatori, S.; Sun, P.; Zamami, Y.; Goda, M.; Pakdeechote, P.; Takayama, F.; Kawasaki, H. Do Cholinergic Nerves Innervating Rat Mesenteric Arteries Regulate Vascular Tone? Am. J. Physiol. Regul. Integr. Comp. Physiol. 2012, 303, R1147–R1156. [Google Scholar] [CrossRef] [PubMed]
- Lillo, M.A.; Gaete, P.S.; Puebla, M.; Ardiles, N.M.; Poblete, I.; Becerra, A.; Simon, F.; Figueroa, X.F. Critical Contribution of Na+-Ca2+ Exchanger to the Ca2+-Mediated Vasodilation Activated in Endothelial Cells of Resistance Arteries. FASEB J. 2018, 32, 2137–2147. [Google Scholar] [CrossRef] [PubMed]
- Teubl, M.; Groschner, K.; Kohlwein, S.D.; Mayer, B.; Schmidt, K. Na+/Ca2+ Exchange Facilitates Ca2+-Dependent Activation of Endothelial Nitric-Oxide Synthase. J. Biol. Chem. 1999, 274, 29529–29535. [Google Scholar] [CrossRef]
- Schneider, J.-C.; El Kebir, D.; Chéreau, C.; Mercier, J.-C.; Dall’Ava-Santucci, J.; Dinh-Xuan, A.T. Involvement of Na+/Ca2+ Exchanger in Endothelial NO Production and Endothelium-Dependent Relaxation. Am. J. Physiol. Heart Circ. Physiol. 2002, 283, H837–H844. [Google Scholar] [CrossRef]
- Iwamoto, T.; Kita, S.; Uehara, A.; Imanaga, I.; Matsuda, T.; Baba, A.; Katsuragi, T. Molecular Determinants of Na+/Ca2+ Exchange (NCX1) Inhibition by SEA0400*. J. Biol. Chem. 2004, 279, 7544–7553. [Google Scholar] [CrossRef] [PubMed]
- Khananshvili, D. Structure-Based Function and Regulation of NCX Variants: Updates and Challenges. Int. J. Mol. Sci. 2022, 24, 61. [Google Scholar] [CrossRef] [PubMed]
- Fekete, Á.; Franklin, L.; Ikemoto, T.; Rózsa, B.; Lendvai, B.; Sylvester Vizi, E.; Zelles, T. Mechanism of the Persistent Sodium Current Activator Veratridine-evoked Ca2+ Elevation: Implication for Epilepsy. J. Neurochem. 2009, 111, 745–756. [Google Scholar] [CrossRef]
- Park, J.; Proux, C.; Ehanno, W.; Réthoré, L.; Vessières, E.; Bourreau, J.; Favre, J.; Kauffenstein, G.; Mattei, C.; Tricoire-Leignel, H.; et al. Tetrodotoxin Decreases the Contractility of Mesenteric Arteries, Revealing the Contribution of Voltage-Gated Na+ Channels in Vascular Tone Regulation. Mar. Drugs 2023, 21, 196. [Google Scholar] [CrossRef]
- Verkhratsky, A.; Trebak, M.; Perocchi, F.; Khananshvili, D.; Sekler, I. Crosslink between Calcium and Sodium Signalling. Exp. Physiol. 2018, 103, 157–169. [Google Scholar] [CrossRef]
- Wang, X.; van Breemen, C. Multiple Mechanisms of Activating Ca2+ Entry in Freshly Isolated Rabbit Aortic Endothelial Cells. J. Vasc. Res. 1997, 34, 196–207. [Google Scholar] [CrossRef]
- Fukao, M.; Hattori, Y.; Kanno, M.; Sakuma, I.; Kitabatake, A. Sources of Ca2+ in Relation to Generation of Acetylcholine-induced Endothelium-dependent Hyperpolarization in Rat Mesenteric Artery. Br. J. Pharmacol. 1997, 120, 1328–1334. [Google Scholar] [CrossRef] [PubMed]
- Ghisdal, P.; Morel, N. Cellular Target of Voltage and Calcium-dependent K+ Channel Blockers Involved in EDHF-mediated Responses in Rat Superior Mesenteric Artery. Br. J. Pharmacol. 2001, 134, 1021–1028. [Google Scholar] [CrossRef] [PubMed]
- Lytton, J. Na+/Ca2+ Exchangers: Three Mammalian Gene Families Control Ca2+ Transport. Biochem. J. 2007, 406, 365–382. [Google Scholar] [CrossRef] [PubMed]
- Annunziato, L.; Pignataro, G.; Di Renzo, G.F. Pharmacology of Brain Na+/Ca2+ Exchanger: From Molecular Biology to Therapeutic Perspectives. Pharmacol. Rev. 2004, 56, 633–654. [Google Scholar] [CrossRef]
- Ringvold, H.C.; Khalil, R.A. Protein Kinase C as Regulator of Vascular Smooth Muscle Function and Potential Target in Vascular Disorders. Adv. Pharmacol. 2017, 78, 203–301. [Google Scholar] [CrossRef]
- Virsolvy, A.; Fort, A.; Erceau, L.; Charrabi, A.; Hayot, M.; Aimond, F.; Richard, S. Hypoxic Conditions Promote Rhythmic Contractile Oscillations Mediated by Voltage-Gated Sodium Channels Activation in Human Arteries. Int. J. Mol. Sci. 2021, 22, 2570. [Google Scholar] [CrossRef] [PubMed]
- Yokomizo, A.; Takatori, S.; Hashikawa-Hobara, N.; Goda, M.; Kawasaki, H. Characterization of Perivascular Nerve Distribution in Rat Mesenteric Small Arteries. Biol. Pharm. Bull. 2015, 38, 1757–1764. [Google Scholar] [CrossRef]
- Kawasaki, H.; Takatori, S.; Zamami, Y.; Koyama, T.; Goda, M.; Hirai, K.; Tangsucharit, P.; Jin, X.; Hobara, N.; Kitamura, Y. Paracrine Control of Mesenteric Perivascular Axo-Axonal Interaction. Acta Physiol. 2011, 203, 3–11. [Google Scholar] [CrossRef]
- Fujiwara, H.; Hashikawa-Hobara, N.; Wake, Y.; Takatori, S.; Goda, M.; Higuchi, H.; Zamami, Y.; Tangsucharit, P.; Kawasaki, H. Neurogenic Vascular Responses in Male Mouse Mesenteric Vascular Beds. J. Pharmacol. Sci. 2012, 119, 260–270. [Google Scholar] [CrossRef]
- Dudzinski, D.; Michel, T. Life History of eNOS: Partners and Pathways. Cardiovasc. Res. 2007, 75, 247–260. [Google Scholar] [CrossRef]
- Saternos, H.C.; Almarghalani, D.A.; Gibson, H.M.; Meqdad, M.A.; Antypas, R.B.; Lingireddy, A.; AbouAlaiwi, W.A. Distribution and Function of the Muscarinic Receptor Subtypes in the Cardiovascular System. Physiol. Genom. 2018, 50, 1–9. [Google Scholar] [CrossRef] [PubMed]
- Bondarenko, A. Sodium-Calcium Exchanger Contributes to Membrane Hyperpolarization of Intact Endothelial Cells from Rat Aorta during Acetylcholine Stimulation: Sodium-Calcium Exchanger in Endothelial Cells. Br. J. Pharmacol. 2004, 143, 9–18. [Google Scholar] [CrossRef] [PubMed]
- Moccia, F.; Berra-Romani, R.; Baruffi, S.; Spaggiari, S.; Signorelli, S.; Castelli, L.; Magistretti, J.; Taglietti, V.; Tanzi, F. Ca2+ Uptake by the Endoplasmic Reticulum Ca2+-ATPase in Rat Microvascular Endothelial Cells. Biochem. J. 2002, 364, 235–244. [Google Scholar] [CrossRef]
- Girardin, N.C.; Antigny, F.; Frieden, M. Electrophysiological Characterization of Store-Operated and Agonist-Induced Ca2+ Entry Pathways in Endothelial Cells. Pflügers Arch. Eur. J. Physiol. 2010, 460, 109–120. [Google Scholar] [CrossRef]
- Wess, J.; Eglen, R.M.; Gautam, D. Muscarinic Acetylcholine Receptors: Mutant Mice Provide New Insights for Drug Development. Nat. Rev. Drug Discov. 2007, 6, 721–733. [Google Scholar] [CrossRef] [PubMed]
- Darby, W.G.; Potocnik, S.; Ramachandran, R.; Hollenberg, M.D.; Woodman, O.L.; McIntyre, P. Shear Stress Sensitizes TRPV4 in Endothelium-Dependent Vasodilatation. Pharmacol. Res. 2018, 133, 152–159. [Google Scholar] [CrossRef]
- Yao, X.; Garland, C.J. Recent Developments in Vascular Endothelial Cell Transient Receptor Potential Channels. Circ. Res. 2005, 97, 853–863. [Google Scholar] [CrossRef]
- Mulvany, M.J.; Halpern, W. Contractile Properties of Small Arterial Resistance Vessels in Spontaneously Hypertensive and Normotensive Rats. Circ. Res. 1977, 41, 19–26. [Google Scholar] [CrossRef]
- Vessieres, E.; Guihot, A.-L.; Grimaud, L.; Rivron, J.; Arnal, J.-F.; Loufrani, L.; Henrion, D. Estrogens and the Angiotensin II Type 2 Receptor Control Flow-Mediated Outward Remodeling in the Female Mouse Mesenteric Artery. J. Vasc. Res. 2021, 58, 16–26. [Google Scholar] [CrossRef]
- Morrison, T.B.; Weis, J.J.; Wittwer, C.T. Quantification of Low-Copy Transcripts by Continuous SYBR Green I Monitoring during Amplification. Biotechniques 1998, 24, 954–958, 960, 962. [Google Scholar]
- Lee, C.; Kim, J.; Shin, S.G.; Hwang, S. Absolute and Relative QPCR Quantification of Plasmid Copy Number in Escherichia Coli. J. Biotechnol. 2006, 123, 273–280. [Google Scholar] [CrossRef] [PubMed]


Disclaimer/Publisher’s Note: The statements, opinions and data contained in all publications are solely those of the individual author(s) and contributor(s) and not of MDPI and/or the editor(s). MDPI and/or the editor(s) disclaim responsibility for any injury to people or property resulting from any ideas, methods, instructions or products referred to in the content. |
© 2024 by the authors. Licensee MDPI, Basel, Switzerland. This article is an open access article distributed under the terms and conditions of the Creative Commons Attribution (CC BY) license (https://creativecommons.org/licenses/by/4.0/).