Aligning Post-Column ESI-MS, MALDI-MS, and Coagulation Bioassay Data of Naja spp., Ophiophagus hannah, and Pseudonaja textillis Venoms Chromatographically to Assess MALDI-MS and ESI-MS Complementarity with Correlation of Bioactive Toxins to Mass Spectrometric Data

 , , and
Abstract
:1. Introduction
2. Results and Discussion
2.1. Naja kaouthia
2.2. Naja naja
2.3. Naja haje
2.4. Naja atra
2.5. Naja pallida
2.6. Ophiophagus hannah
2.7. Pseudonaja textillis
2.8. Comparative Overview of the LC-ESI-MS, LC-MALDI-MS, and Coagulation Assay Results
3. Conclusions
4. Materials and Methods
4.1. Reagents
4.2. Venoms
4.3. Nanofractionation Analytics
4.4. Online (LC-)ESI-MS Measurements
4.5. OffLine MALDI-MS Measurements
4.6. Plasma Coagulation Assay
4.7. Correlation of LC-ESI-MS (and LC-UV) Data with Offline LC-MALDI-MS and LC-Coagulation Bioassay Data
Author Contributions
Funding
Institutional Review Board Statement
Informed Consent Statement
Data Availability Statement
Conflicts of Interest
References
- Harrison, R.A.; Hargreaves, A.; Wagstaff, S.C.; Faragher, B.; Lalloo, D.G. Snake Envenoming: A disease of poverty. PLoS Negl. Trop. Dis. 2009, 3, e569. [Google Scholar] [CrossRef] [PubMed]
- Chippaux, J.P. Snakebite envenomation turns again into a neglected tropical disease! J. Venom. Anim. Toxins Incl. Trop. Dis. 2017, 23, 38. [Google Scholar] [CrossRef] [PubMed]
- Gutiérrez, J.M.; Calvete, J.J.; Habib, A.G.; Harrison, R.A.; Williams, D.J.; Warrell, D.A. Snakebite envenoming. Nat. Rev. Dis. Prim. 2017, 3, 17063. [Google Scholar] [CrossRef] [PubMed]
- Casewell, N.R.; Wagstaff, S.C.; Wuster, W.; Cook, D.A.; Bolton, F.M.; King, S.I.; Pla, D.; Sanz, L.; Calvete, J.J.; Harrison, R.A. Medically important differences in snake venom composition are dictated by distinct postgenomic mechanisms. Proc. Natl. Acad. Sci. USA 2014, 111, 9205–9210. [Google Scholar] [CrossRef]
- Chan, Y.S.; Cheung, R.C.F.; Xia, L.; Wong, J.H.; Ng, T.B.; Chan, W.Y. Snake venom toxins: Toxicity and medicinal applications. Appl. Microbiol. Biotechnol. 2016, 100, 6165–6181. [Google Scholar] [CrossRef]
- Jackson, T.N.W.; Fry, B.G. A Tricky Trait: Applying the fruits of the “function debate” in the philosophy of biology to the “venom debate” in the science of toxinology. Toxins 2016, 8, 263. [Google Scholar] [CrossRef]
- Jackson, T.N.W.; Jouanne, H.; Vidal, N. Snake Venom in Context: Neglected clades and concepts. Front. Ecol. Evol. 2019, 7, 332. [Google Scholar] [CrossRef]
- Massey, D.J.; Calvete, J.J.; Sánchez, E.E.; Sanz, L.; Richards, K.; Curtis, R.; Boesen, K. Venom variability and envenoming severity outcomes of the Crotalus scutulatus scutulatus (Mojave rattlesnake) from Southern Arizona. J. Proteom. 2012, 75, 2576–2587. [Google Scholar] [CrossRef]
- Dias, G.S.; Kitano, E.S.; Pagotto, A.H.; Sant’anna, S.S.; Rocha, M.M.; Zelanis, A.; Serrano, S.M. Individual variability in the venom proteome of juvenile Bothrops jararaca specimens. J. Proteome Res. 2013, 12, 4585–4598. [Google Scholar] [CrossRef]
- Menezes, M.C.; Furtado, M.F.; Travaglia-Cardoso, S.R.; Camargo, A.C.M.; Serrano, S.M.T. Sex-based individual variation of snake venom proteome among eighteen Bothrops jararaca siblings. Toxicon 2006, 47, 304–312. [Google Scholar] [CrossRef]
- Barlow, A.; Pook, C.E.; Harrison, R.A.; Wüster, W. Coevolution of diet and prey-specific venom activity supports the role of selection in snake venom evolution. Proc. R. Soc. B. 2009, 276, 2443–2449. [Google Scholar] [CrossRef] [PubMed]
- Gubenšek, F.; Sket, D.; Turk, V.; Lebez, D. Fractionation of Vipera ammodytes venom and seasonal variation of its composition. Toxicon 1974, 12, 167–171. [Google Scholar] [CrossRef] [PubMed]
- Williams, D.J.; Gutiérrez, J.M.; Calvete, J.J.; Wüster, W.; Ratanabanangkoon, K.; Paiva, O.; Brown, N.I.; Casewell, N.R.; Harrison, R.A.; Rowley, P.D.; et al. Ending the drought: New strategies for improving the flow of affordable, effective antivenoms in Asia and Africa. J. Proteom. 2011, 74, 1735–1767. [Google Scholar] [CrossRef] [PubMed]
- Casewell, N.R.; Cook, D.A.; Wagstaff, S.C.; Nasidi, A.; Durfa, N.; Wüster, W.; Harrison, R.A. Pre-clinical assays predict pan-African Echis viper efficacy for a species-specific antivenom. PLoS Negl. Trop. Dis. 2010, 4, e851. [Google Scholar] [CrossRef]
- Segura, A.; Villalta, M.; Herrera, M.; León, G.; Harrison, R.; Durfa, N.; Nasidi, A.; Calvete, J.J.; Theakston, R.D.G.; Warrell, D.A.; et al. Preclinical assessment of the efficacy of a new antivenom (EchiTAb-Plus-ICP®) for the treatment of viper envenoming in sub-Saharan Africa. Toxicon 2010, 55, 369–374. [Google Scholar] [CrossRef]
- Vonk, F.J.; Casewell, N.R.; Henkel, C.V.; Heimberg, A.M.; Jansen, H.J.; McCleary, R.J.R.; Kerkkamp, H.M.E.; Vos, R.A.; Guerreiro, I.; Calvete, J.J.; et al. The king cobra genome reveals dynamic gene evolution and adaptation in the snake venom system. Proc. Natl. Acad. Sci. USA 2013, 110, 20651–20656. [Google Scholar] [CrossRef]
- McCleary, R.J.; Kini, R.M. Non-enzymatic proteins from snake venoms: A gold mine of pharmacological tools and drug leads. Toxicon 2013, 62, 56–74. [Google Scholar] [CrossRef]
- Boldrini-França, J.; Pinheiro-Junior, E.L.; Peigneur, S.; Pucca, M.B.; Cerni, F.A.; Borges, R.J.; Costa, T.R.; Carone, S.E.I.; Fontes, M.R.d.M.; Sampaio, S.V.; et al. Beyond hemostasis: A snake venom serine protease with potassium channel blocking and potential antitumor activities. Sci. Rep. 2020, 10, 4476. [Google Scholar] [CrossRef]
- Calvete, J.J. Next-generation snake venomics: Protein-locus resolution through venom proteome decomplexation. Expert Rev. Proteom. 2014, 11, 315–329. [Google Scholar] [CrossRef]
- Calvete, J.J.; Juárez, P.; Sanz, L. Snake venomics. strategy and applications. J. Mass Spectrom. 2007, 42, 1405–1414. [Google Scholar] [CrossRef]
- Calvete, J.J. Venomics: Integrative venom proteomics and beyond. Biochem. J. 2017, 474, 611–634. [Google Scholar] [CrossRef]
- Calvete, J.J. Snake venomics—From low-resolution toxin-pattern recognition to toxin-resolved venom proteomes with absolute quantification. Expert Rev. Proteom. 2018, 15, 555–568. [Google Scholar] [CrossRef]
- Slagboom, J.; Mladić, M.; Xie, C.; Kazandjian, T.D.; Vonk, F.; Somsen, G.W.; Casewell, N.R.; Kool, J. High throughput screening and identification of coagulopathic snake venom proteins and peptides using nanofractionation and proteomics approaches. PLoS Negl. Trop. Dis. 2020, 14, e0007802. [Google Scholar] [CrossRef] [PubMed]
- Still, K.B.M.; Slagboom, J.; Kidwai, S.; Xie, C.; Zhao, Y.; Eisses, B.; Jiang, Z.; Vonk, F.J.; Somsen, G.W.; Casewell, N.R.; et al. Development of high-throughput screening assays for profiling snake venom phospholipase A(2) activity after chromatographic fractionation. Toxicon 2020, 184, 28–38. [Google Scholar] [CrossRef]
- Xie, C.; Bittenbinder, M.A.; Slagboom, J.; Arrahman, A.; Bruijns, S.; Somsen, G.W.; Vonk, F.J.; Casewell, N.R.; Garcia-Vallejo, J.J.; Kool, J. Erythrocyte haemotoxicity profiling of snake venom toxins after nanofractionation. J. Chromatogr. B 2021, 1176, 122586. [Google Scholar] [CrossRef] [PubMed]
- Zietek, B.M.; Mayar, M.; Slagboom, J.; Bruyneel, B.; Vonk, F.J.; Somsen, G.W.; Casewell, N.R.; Kool, J. Liquid chromatographic nanofractionation with parallel mass spectrometric detection for the screening of plasmin inhibitors and (metallo)proteinases in snake venoms. Anal. Bioanal. Chem. 2018, 410, 5751–5763. [Google Scholar] [CrossRef] [PubMed]
- Wilm, M. Principles of Electrospray Ionization. Mol. Cell. Proteom. 2011, 10, M111.009407. [Google Scholar] [CrossRef]
- Valente, R.H.; Nicolau, C.A.; Perales, J.; Neves-Ferreira, A. Snake venom proteopeptidomics: What lies behind the curtain. In Venom Genomics and Proteomics; Springer: Dordrecht, The Netherlands, 2016; pp. 333–365. [Google Scholar]
- Petras, D.; Heiss, P.; Süssmüth, R.D.; Calvete, J.J. Venom proteomics of Indonesian king cobra, Ophiophagus hannah: Integrating Top-down and Bottom-up approaches. J. Proteome Res. 2015, 14, 2539–2556. [Google Scholar] [CrossRef]
- Slagboom, J.; Kaal, C.; Arrahman, A.; Vonk, F.J.; Somsen, G.W.; Calvete, J.J.; Wüster, W.; Kool, J. Analytical strategies in venomics. Microchem. J. 2022, 175, 107187. [Google Scholar] [CrossRef]
- Kaltashov, I.A.; Bobst, C.E.; Abzalimov, R.R.; Wang, G.; Baykal, B.; Wang, S. Advances and challenges in analytical characterization of biotechnology products: Mass spectrometry-based approaches to study properties and behavior of protein therapeutics. Biotechnol. Adv. 2012, 30, 210–222. [Google Scholar] [CrossRef]
- Hempel, B.F.; Damm, M.; Mrinalini; Göçmen, B.; Karış, M.; Nalbantsoy, A.; Kini, R.M.; Suessmuth, R.D. Extended snake venomics by top-down in-source decay: Investigating the newly discovered Anatolian Meadow Viper subspecies, Vipera anatolica senliki. J. Proteome Res. 2020, 19, 1731–1749. [Google Scholar] [CrossRef]
- Demeure, K.; Gabelica, V.; De Pauw, E.A. New advances in the understanding of the in-source decay fragmentation of peptides in MALDI-TOF-MS. J. Am. Soc. Mass Spectrom. 2010, 21, 1906–1917. [Google Scholar] [CrossRef] [PubMed]
- Hanisch, F.G. Top-down sequencing of O-glycoproteins by in-source decay matrix-assisted laser desorption ionization mass spectrometry for glycosylation site analysis. Anal. Chem. 2011, 83, 4829–4837. [Google Scholar] [CrossRef] [PubMed]
- Quinton, L.; Demeure, K.; Dobson, R.; Gilles, N.; Gabelica, V.; De Pauw, E. New method for characterizing highly disulfide-bridged peptides in complex mixtures: Application to toxin identification from crude venoms. J. Proteome Res. 2007, 6, 3216–3223. [Google Scholar] [CrossRef] [PubMed]
- Karas, M.; Krüger, R. Ion Formation in MALDI: The cluster ionization mechanism. Chem. Rev. 2003, 103, 427–440. [Google Scholar] [CrossRef] [PubMed]
- Hillenkamp, F. Matrixassisted laser desorption/ionization mass spectrometry of biopolymers. Anal. Chem. 1989, 63, 187–190. [Google Scholar]
- Calvete, J.J.; Bonilla, F.; Granados-Martínez, S.; Sanz, L.; Lomonte, B.; Sasa, M. Venomics of the Duvernoy’s gland secretion of the false coral snake Rhinobothryum bovallii (Andersson, 1916) and assessment of venom lethality towards synapsid and diapsid animal models. J. Proteom. 2020, 225, 103882. [Google Scholar] [CrossRef]
- Chapeaurouge, A.; Reza, M.A.; Mackessy, S.P.; Carvalho, P.C.; Valente, R.H.; Teixeira-Ferreira, A.; Perales, J.; Lin, Q.; Kini, R.M. Interrogating the venom of the Viperid Snake Sistrurus catenatus edwardsii by a combined approach of electrospray and MALDI mass spectrometry. PLoS ONE 2015, 10, e0092091. [Google Scholar] [CrossRef]
- Liu, S.; Zhang, C.; Xu, Y.F.; Yang, F.; Sun, M.Z. Electrospray ionization mass spectrometry as a critical tool for revealing new properties of snake venom phospholipase A2. Rapid Commun. Mass Spectrom. 2009, 23, 1158–1166. [Google Scholar] [CrossRef]
- Stapels, M.D.; Barofsky, D.F. Complementary use of MALDI and ESI for the HPLC-MS/MS analysis of DNA-binding proteins. Anal. Chem. 2004, 76, 5423–5430. [Google Scholar] [CrossRef]
- Sánchez-Juanes, F.; Muñiz, M.C.; Raposo, C.; Rodríguez-Prieto, S.; Paradela, A.; Quiros, Y.; López-Hernández, F.; González-Buitrago, J.M.; Ferreira, L. Unveiling the rat urinary proteome with three complementary proteomics approaches. Electrophoresis 2013, 34, 2473–2483. [Google Scholar] [CrossRef]
- Gonçalves, L.D.R.; Soares, M.R.; Nogueira, F.C.; Garcia, C.; Camisasca, D.R.; Domont, G.; Feitosa, A.C.; de Abreu Pereira, D.; Zingali, R.B.; Alves, G. Comparative proteomic analysis of whole saliva from chronic periodontitis patients. J. Proteom. 2010, 73, 1334–1341. [Google Scholar] [CrossRef]
- Matysiak, J.; Schmelzer, C.E.; Neubert, R.H.; Kokot, Z.J. Characterization of honeybee venom by MALDI-TOF and nanoESI-QqTOF mass spectrometry. J. Pharm. Biomed. Anal. 2011, 54, 273–278. [Google Scholar] [CrossRef] [PubMed]
- Pimenta, A.M.; Rates, B.; Bloch, C., Jr.; Gomes, P.C.; Santoro, M.M.; de Lima, M.E.; Richardson, M.; Cordeiro, M.d.N. Electrospray ionization quadrupole time-of-flight and matrix-assisted laser desorption/ionization tandem time-of-flight mass spectrometric analyses to solve micro-heterogeneity in post-translationally modified peptides from Phoneutria nigriventer (Aranea, Ctenidae) venom. Rapid Commun. Mass Spectrom. 2005, 19, 31–37. [Google Scholar]
- Still, K.B.M.; Nandlal, R.S.S.; Slagboom, J.; Somsen, G.W.; Casewell, N.R.; Kool, J. Multipurpose HTS coagulation analysis: Assay development and assessment of coagulopathic snake venoms. Toxins 2017, 9, 382. [Google Scholar] [CrossRef]
- Arrahman, A.; Kazandjian, T.D.; Still, K.B.M.; Slagboom, J.; Somsen, G.W.; Vonk, F.J.; Casewell, N.R.; Kool, J. A combined bioassay and nanofractionation approach to investigate the anticoagulant toxins of Mamba and Cobra venoms and their inhibition by varespladib. Toxins 2022, 14, 736. [Google Scholar] [CrossRef] [PubMed]
- Schiller, J.; Müller, K.; Süß, R.; Arnhold, J.; Gey, C.; Herrmann, A.; Leßig, J.; Arnold, K.; Müller, P. Analysis of the lipid composition of bull spermatozoa by MALDI-TOF mass spectrometry—A cautionary note. Chem. Phys. Lipids 2003, 126, 85–94. [Google Scholar] [CrossRef]
- El Aziz, T.M.A.; Bourgoin-Voillard, S.; Combemale, S.; Beroud, R.; Fadl, M.; Seve, M.; De Waard, M. Fractionation and proteomic analysis of the Walterinnesia aegyptia snake venom using OFFGEL and MALDI-TOF-MS techniques. Electrophoresis 2015, 36, 2594–2605. [Google Scholar] [CrossRef] [PubMed]
- Favreau, P.; Cheneval, O.; Menin, L.; Michalet, S.; Gaertner, H.; Principaud, F.; Thai, R.; Ménez, A.; Bulet, P.; Stöcklin, R. The venom of the snake genus Atheris contains a new class of peptides with clusters of histidine and glycine residues. Rapid Commun. Mass Spectrom. 2007, 21, 406–412. [Google Scholar] [CrossRef]
- Wermelinger, L.S.; Dutra, D.L.S.; Oliveira-Carvalho, A.L.; Soares, M.R.; Bloch, C., Jr.; Zingali, R.B. Fast analysis of low molecular mass compounds present in snake venom: Identification of ten new pyroglutamate-containing peptides. Rapid Commun. Mass Spectrom. 2005, 19, 1703–1708. [Google Scholar] [CrossRef]
- Newton, K.A.; Clench, M.R.; Deshmukh, R.; Jeyaseelan, K.; Strong, P.N. Mass fingerprinting of toxic fractions from the venom of the Indian red scorpion, Mesobuthus tamulus: Biotope-specific variation in the expression of venom peptides. Rapid Commun. Mass Spectrom. 2007, 21, 3467–3476. [Google Scholar] [CrossRef] [PubMed]
- Schwartz, E.F.; Camargos, T.S.; Zamudio, F.Z.; Silva, L.P.; Bloch, C.; Caixeta, F.; Schwartz, C.A.; Possani, L.D. Mass spectrometry analysis, amino acid sequence and biological activity of venom components from the Brazilian scorpion Opisthacanthus cayaporum. Toxicon 2008, 51, 1499–1508. [Google Scholar] [CrossRef] [PubMed]
- Mott, T.M.; Everley, R.A.; Wyatt, S.A.; Toney, D.M.; Croley, T.R. Comparison of MALDI-TOF/MS and LC-QTOF/MS methods for the identification of enteric bacteria. Int. J. Mass Spectrom. 2010, 291, 24–32. [Google Scholar] [CrossRef]
- Tan, K.Y.; Tan, C.H.; Fung, S.Y.; Tan, N.H. Venomics, lethality and neutralization of Naja kaouthia (monocled cobra) venoms from three different geographical regions of Southeast Asia. J Proteom. 2015, 120, 105–125. [Google Scholar] [CrossRef]
- Doley, R.; Mukherjee, A.K. Purification and characterization of an anticoagulant phospholipase A(2) from Indian monocled cobra (Naja kaouthia) venom. Toxicon 2003, 41, 81–91. [Google Scholar] [CrossRef]
- Vulfius, C.A.; Kasheverov, I.E.; Starkov, V.G.; Osipov, A.V.; Andreeva, T.V.; Filkin, S.Y.; Gorbacheva, E.V.; Astashev, M.E.; Tsetlin, V.I.; Utkin, Y.N. Inhibition of nicotinic acetylcholine receptors, a novel facet in the pleiotropic activities of snake venom phospholipases A2. PLoS ONE 2014, 9, e115428. [Google Scholar] [CrossRef] [PubMed]
- Das, D.; Sharma, M.; Kumar Das, H.; Pratim Sahu, P.; Doley, R. Purification and characterization of Nk-3FTx: A three finger toxin from the venom of North East Indian Monocled Cobra. J. Biochem. Mol. Toxicol. 2016, 30, 59–70. [Google Scholar] [CrossRef]
- Chanda, A.; Kalita, B.; Patra, A.; Senevirathne, W.D.S.T.; Mukherjee, A.K. Proteomic analysis and antivenomics study of Western India Naja naja venom: Correlation between venom composition and clinical manifestations of cobra bite in this region. Expert Rev. Proteom. 2019, 16, 171–184. [Google Scholar] [CrossRef] [PubMed]
- Sundell, I.B.; Rånby, M.; Zuzel, M.; Robinson, K.A.; Theakston, R.D. In vitro procoagulant and anticoagulant properties of Naja naja naja venom. Toxicon 2003, 42, 239–247. [Google Scholar] [CrossRef] [PubMed]
- Dutta, S.; Gogoi, D.; Mukherjee, A.K. Anticoagulant mechanism and platelet deaggregation property of a non-cytotoxic, acidic phospholipase A2 purified from Indian cobra (Naja naja) venom: Inhibition of anticoagulant activity by low molecular weight heparin. Biochimie 2015, 110, 93–106. [Google Scholar] [CrossRef]
- Osipov, A.V.; Filkin, S.Y.; Makarova, Y.V.; Tsetlin, V.I.; Utkin, Y.N. A new type of thrombin inhibitor, noncytotoxic phospholipase A2, from the Naja haje cobra venom. Toxicon 2010, 55, 186–194. [Google Scholar] [CrossRef] [PubMed]
- Fry, B.G. Structure–function properties of venom components from Australian elapids. Toxicon 1999, 37, 11–32. [Google Scholar] [CrossRef] [PubMed]
- Masci, P.P.; Rowe, E.A.; Whitaker, A.N.; de Jersey, J. Fibrinolysis as a feature of disseminated intravascular coagulation (DIC) after Pseudonaja textilis textilis envenomation. Thromb. Res. 1990, 59, 859–870. [Google Scholar] [CrossRef] [PubMed]
- Armugam, A.; Gong, N.; Li, X.; Siew, P.Y.; Chai, S.C.; Nair, R.; Jeyaseelan, K. Group IB phospholipase A2 from Pseudonaja textilis. Arch. Biochem. Biophys. 2004, 421, 10–20. [Google Scholar] [CrossRef]
- Escoubas, P.; Chamot-Rooke, J.; Stöcklin, R.; Whiteley, B.J.; Corzo, G.; Genet, R.; Nakajima, T. A comparison of matrix-assisted laser desorption/ionization time-of-flight and liquid chromatography electrospray ionization mass spectrometry methods for the analysis of crude tarantula venoms in the Pterinochilus group. Rapid Commun. Mass Spectrom. 1999, 13, 1861–1868. [Google Scholar] [CrossRef]
- Xie, C.; Albulescu, L.O.; Bittenbinder, M.A.; Somsen, G.W.; Vonk, F.J.; Casewell, N.R.; Kool, J. Neutralizing effects of small molecule inhibitors and metal chelators on coagulopathic Viperinae snake venom toxins. Biomedicines 2020, 8, 297. [Google Scholar] [CrossRef]
- Xie, C.; Slagboom, J.; Albulescu, L.-O.; Somsen, G.W.; Vonk, F.J.; Casewell, N.R.; Kool, J. Neutralising effects of small molecule toxin inhibitors on nanofractionated coagulopathic Crotalinae snake venoms. Acta Pharm. Sin. B 2020, 10, 1835–1845. [Google Scholar] [CrossRef]
- Slagboom, J.; Otvos, R.A.; Cardoso, F.C.; Iyer, J.; Visser, J.C.; van Doodewaerd, B.R.; McCleary, R.J.R.; Niessen, W.M.A.; Somsen, G.W.; Lewis, R.J.; et al. Neurotoxicity fingerprinting of venoms using on-line microfluidic AChBP profiling. Toxicon 2018, 148, 213–222. [Google Scholar] [CrossRef]
- Chronopoulou, E.G.; Varotsou, C.; Georgakis, N.; Premetis, G.; Ioannou, E.; Labrou, N.E. Ligand fishing: An approach for the discovery of inhibitors from complex biological mixtures. In Targeting Enzymes for Pharmaceutical Development: Methods and Protocols; Humana: New York, NY, USA, 2020; Volume 2089, pp. 235–243. [Google Scholar]
- Chanda, A.; Patra, A.; Kalita, B.; Mukherjee, A.K. Proteomics analysis to compare the venom composition between Naja naja and Naja kaouthia from the same geographical location of Eastern India: Correlation with pathophysiology of envenomation and immunological cross-reactivity towards commercial Polyantivenom. Expert Rev. Proteom. 2018, 15, 949–961. [Google Scholar] [CrossRef]
- Adamude, F.A.; Dingwoke, E.J.; Abubakar, M.S.; Ibrahim, S.; Mohamed, G.; Klein, A.; Sallau, A.B. Proteomic analysis of three medically important Nigerian Naja (Naja haje, Naja katiensis and Naja nigricollis) snake venoms. Toxicon 2021, 197, 24–32. [Google Scholar] [CrossRef]
- Kuna, E.; Bocian, A.; Hus, K.K.; Petrilla, V.; Petrillova, M.; Legath, J.; Lewinska, A.; Wnuk, M. Evaluation of antifungal activity of Naja pallida and Naja mossambica venoms against three candida species. Toxins 2020, 12, 500. [Google Scholar] [CrossRef]
- Shan, L.-L.; Gao, J.-F.; Zhang, Y.-X.; Shen, S.-S.; He, Y.; Wang, J.; Ma, X.-M.; Ji, X. Proteomic characterization and comparison of venoms from two Elapid snakes (Bungarus multicinctus and Naja atra) from China. J. Proteom. 2016, 138, 83–94. [Google Scholar] [CrossRef] [PubMed]
- Tan, C.H.; Tan, K.Y.; Fung, S.Y.; Tan, N.H. Venom-gland transcriptome and venom proteome of the Malaysian King Cobra (Ophiophagus hannah). BMC Genom. 2015, 16, 687. [Google Scholar] [CrossRef] [PubMed]
- McCleary, R., Jr.; Sridharan, S.; Dunstan, N.L.; Mirtschin, P.J.; Kini, R.M. Proteomic comparisons of venoms of long-term captive and recently wild-caught Eastern Brown snakes (Pseudonaja textilis) indicate venom does not change due to captivity. J. Proteom. 2016, 144, 51–62. [Google Scholar] [CrossRef] [PubMed]


| Venom Species | RT | m/z | Charge | Mass in ESI (Da) | Intensity | Mass in MALDI (Matched) | Intensity (S/N) | Mass Diff (MALDI-ESI) (Da) | Mass in MALDI (Unmatched) | Intensity (S/N) | Mass Matching Coverage (%) |
|---|---|---|---|---|---|---|---|---|---|---|---|
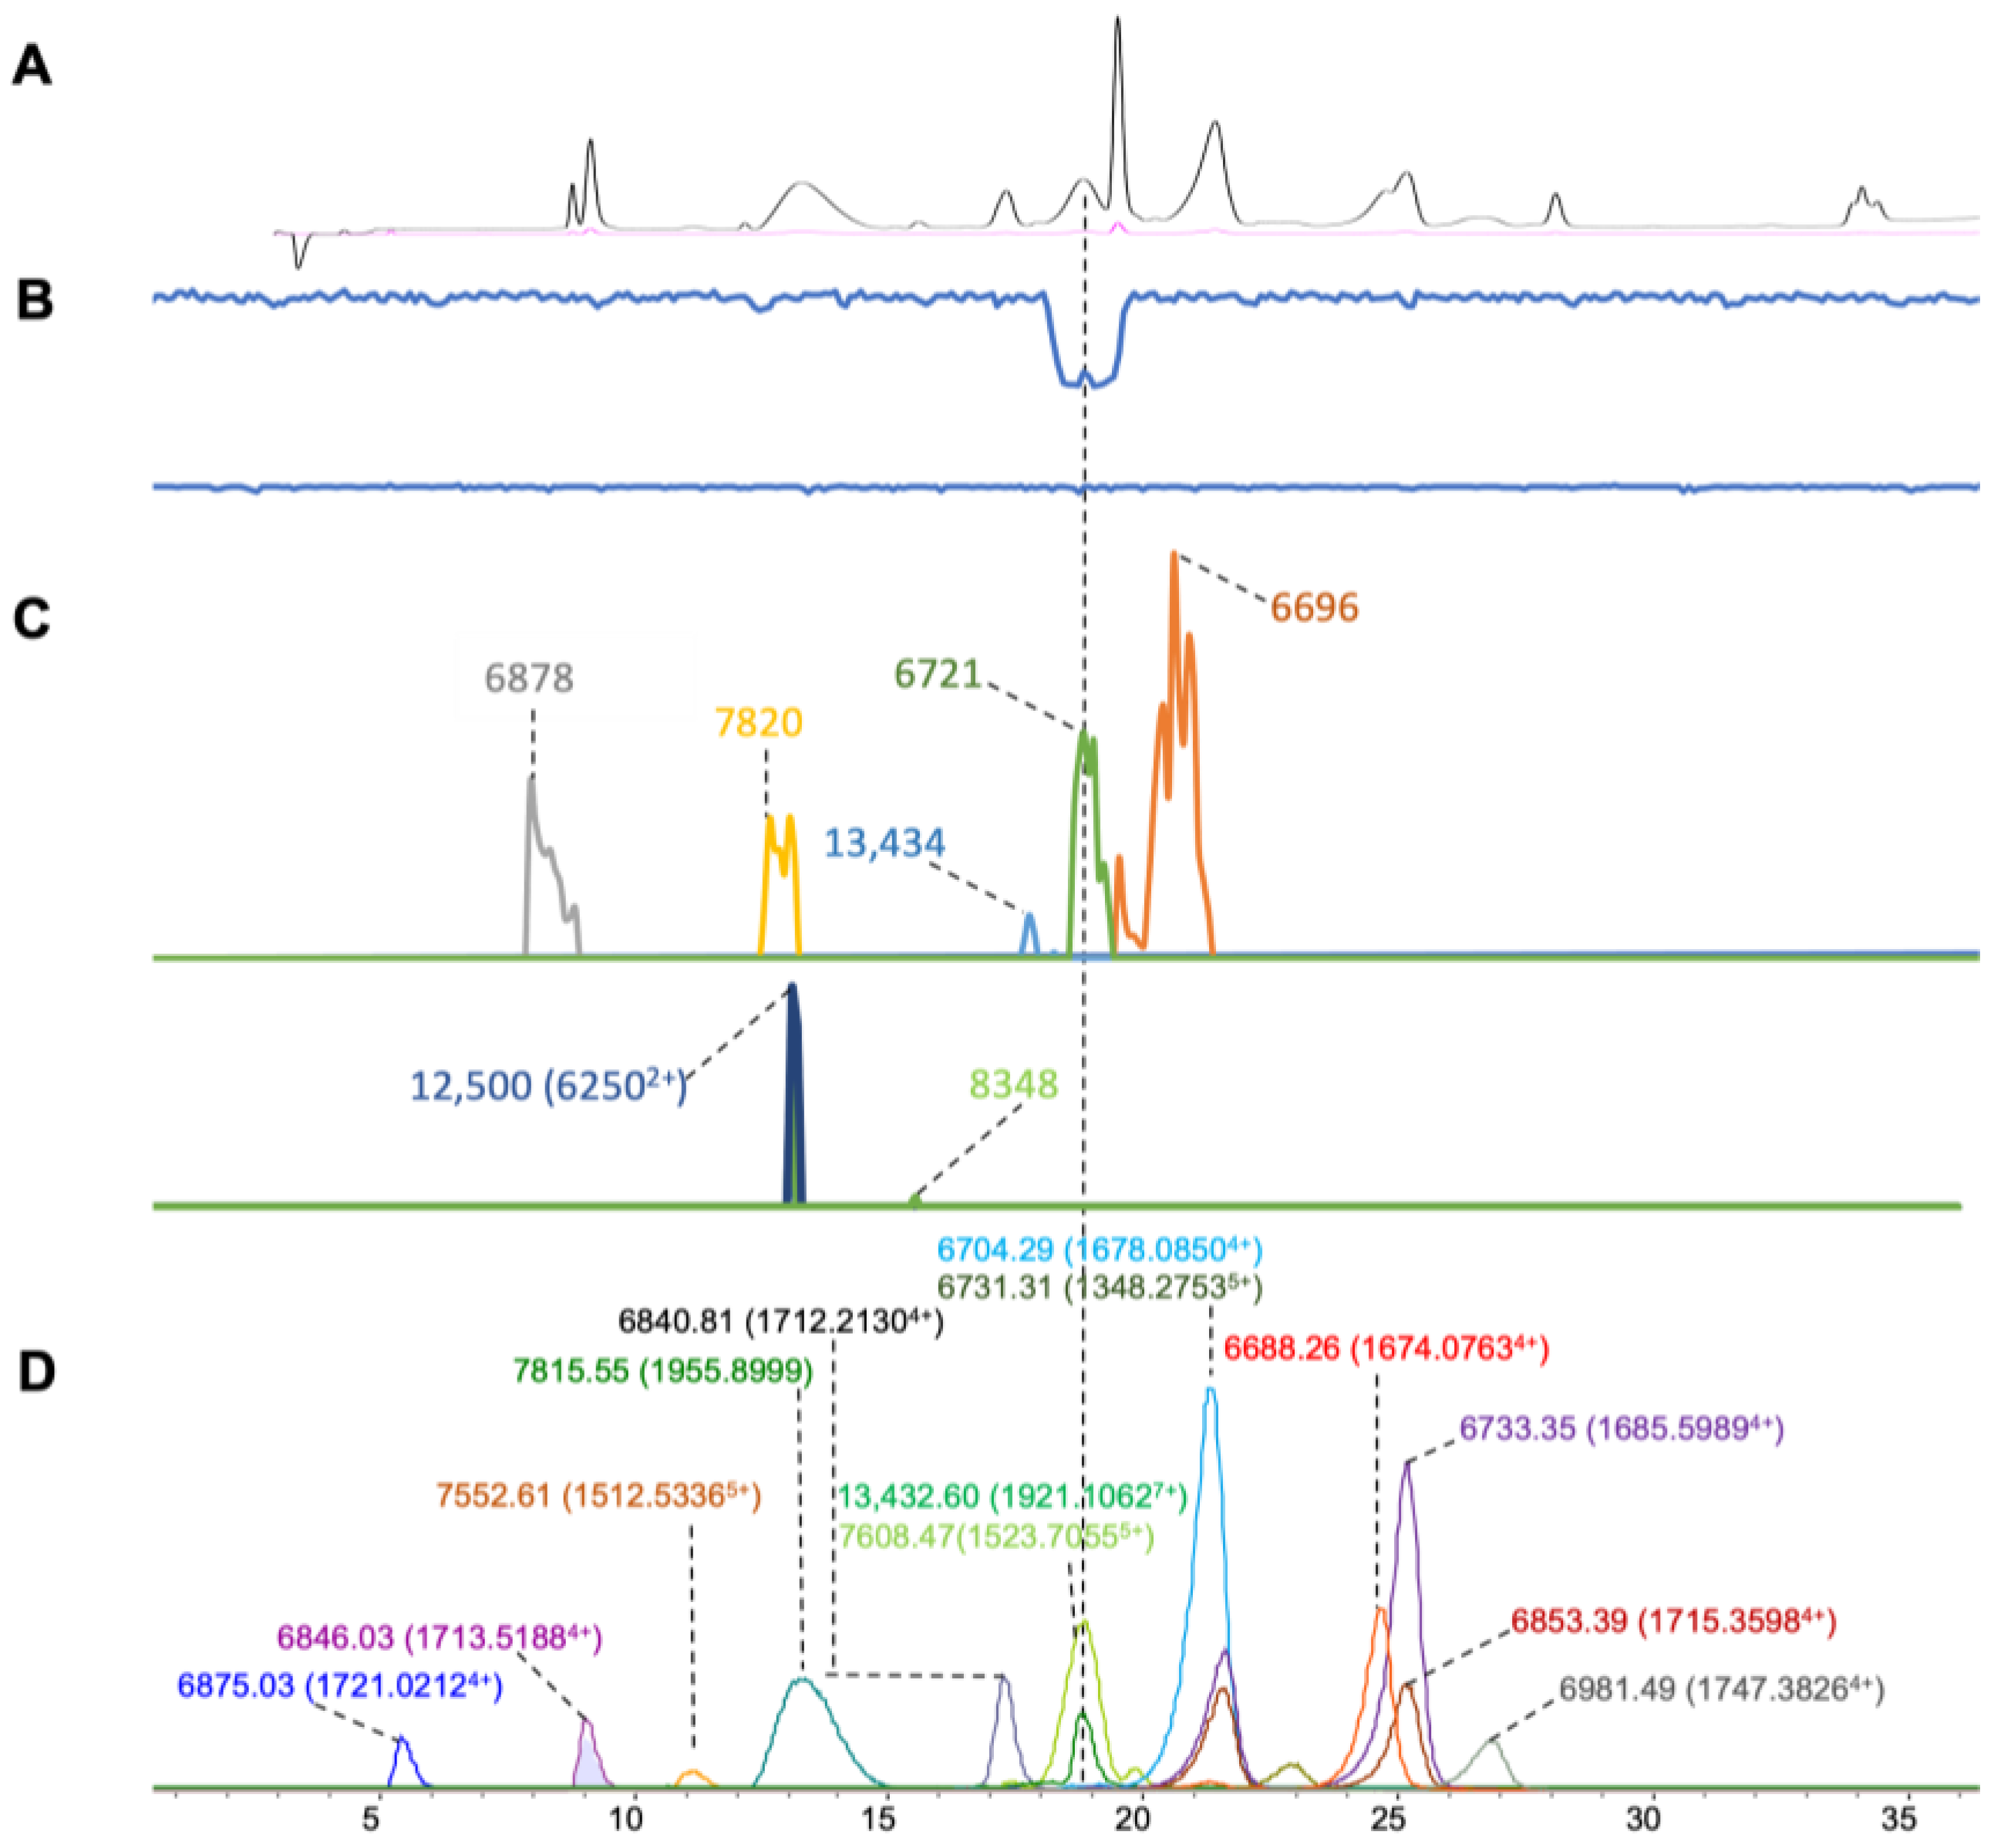
| N. kaouthia | 7.8–10.3 | 1713.5188 | 4 | 6846.0296 | 118,960 | 38.4 | |||||
| 5.8–7.3 | 1721.0212 | 4 | 6875.0319 | 87,030 | 6878 | 2026 | 3 | 6250 | 53 | ||
| 10.3–12.3 | 1512.5336 | 5 | 7552.6119 | 28,926 | 12,500 (62502+) | 68 | |||||
| 12.2–15.0 | 1955.8999 | 4 | 7815.5549 | 183,168 | 7820 | 1214 | 5 | 8348 | 3 | ||
| 16.7–18.3 | 1712.213 | 4 | 6840.8059 | 188,096 | |||||||
| 17.9–20.2 | 1523.7055 | 5 | 7608.4699 | 284,996 | |||||||
| 17.9–20.2 | 1921.1062 | 7 | 13,432.6 | 121,992 | 13,434 | 365 | 2 | ||||
| 20.2–22.2 | 1678.085 | 4 | 6704.2948 | 678,428 | |||||||
| 20.2–22.2 | 1348.2753 | 5 | 6731.3139 | 169,332 | 6721 | 1860 | 10 | ||||
| 22.3–23.6 | 1747.3826 | 4 | 6981.4859 | 37,924 | |||||||
| 23.6–26.0 | 1685.5989 | 4 | 6733.3464 | 552,306 | |||||||
| 23.6–26.0 | 1674.0763 | 4 | 6688.261 | 304,032 | 6696 | 3468 | 8 | ||||
| 25.9–27.5 | 1715.3598 | 4 | 6853.3948 | 80,152 | |||||||
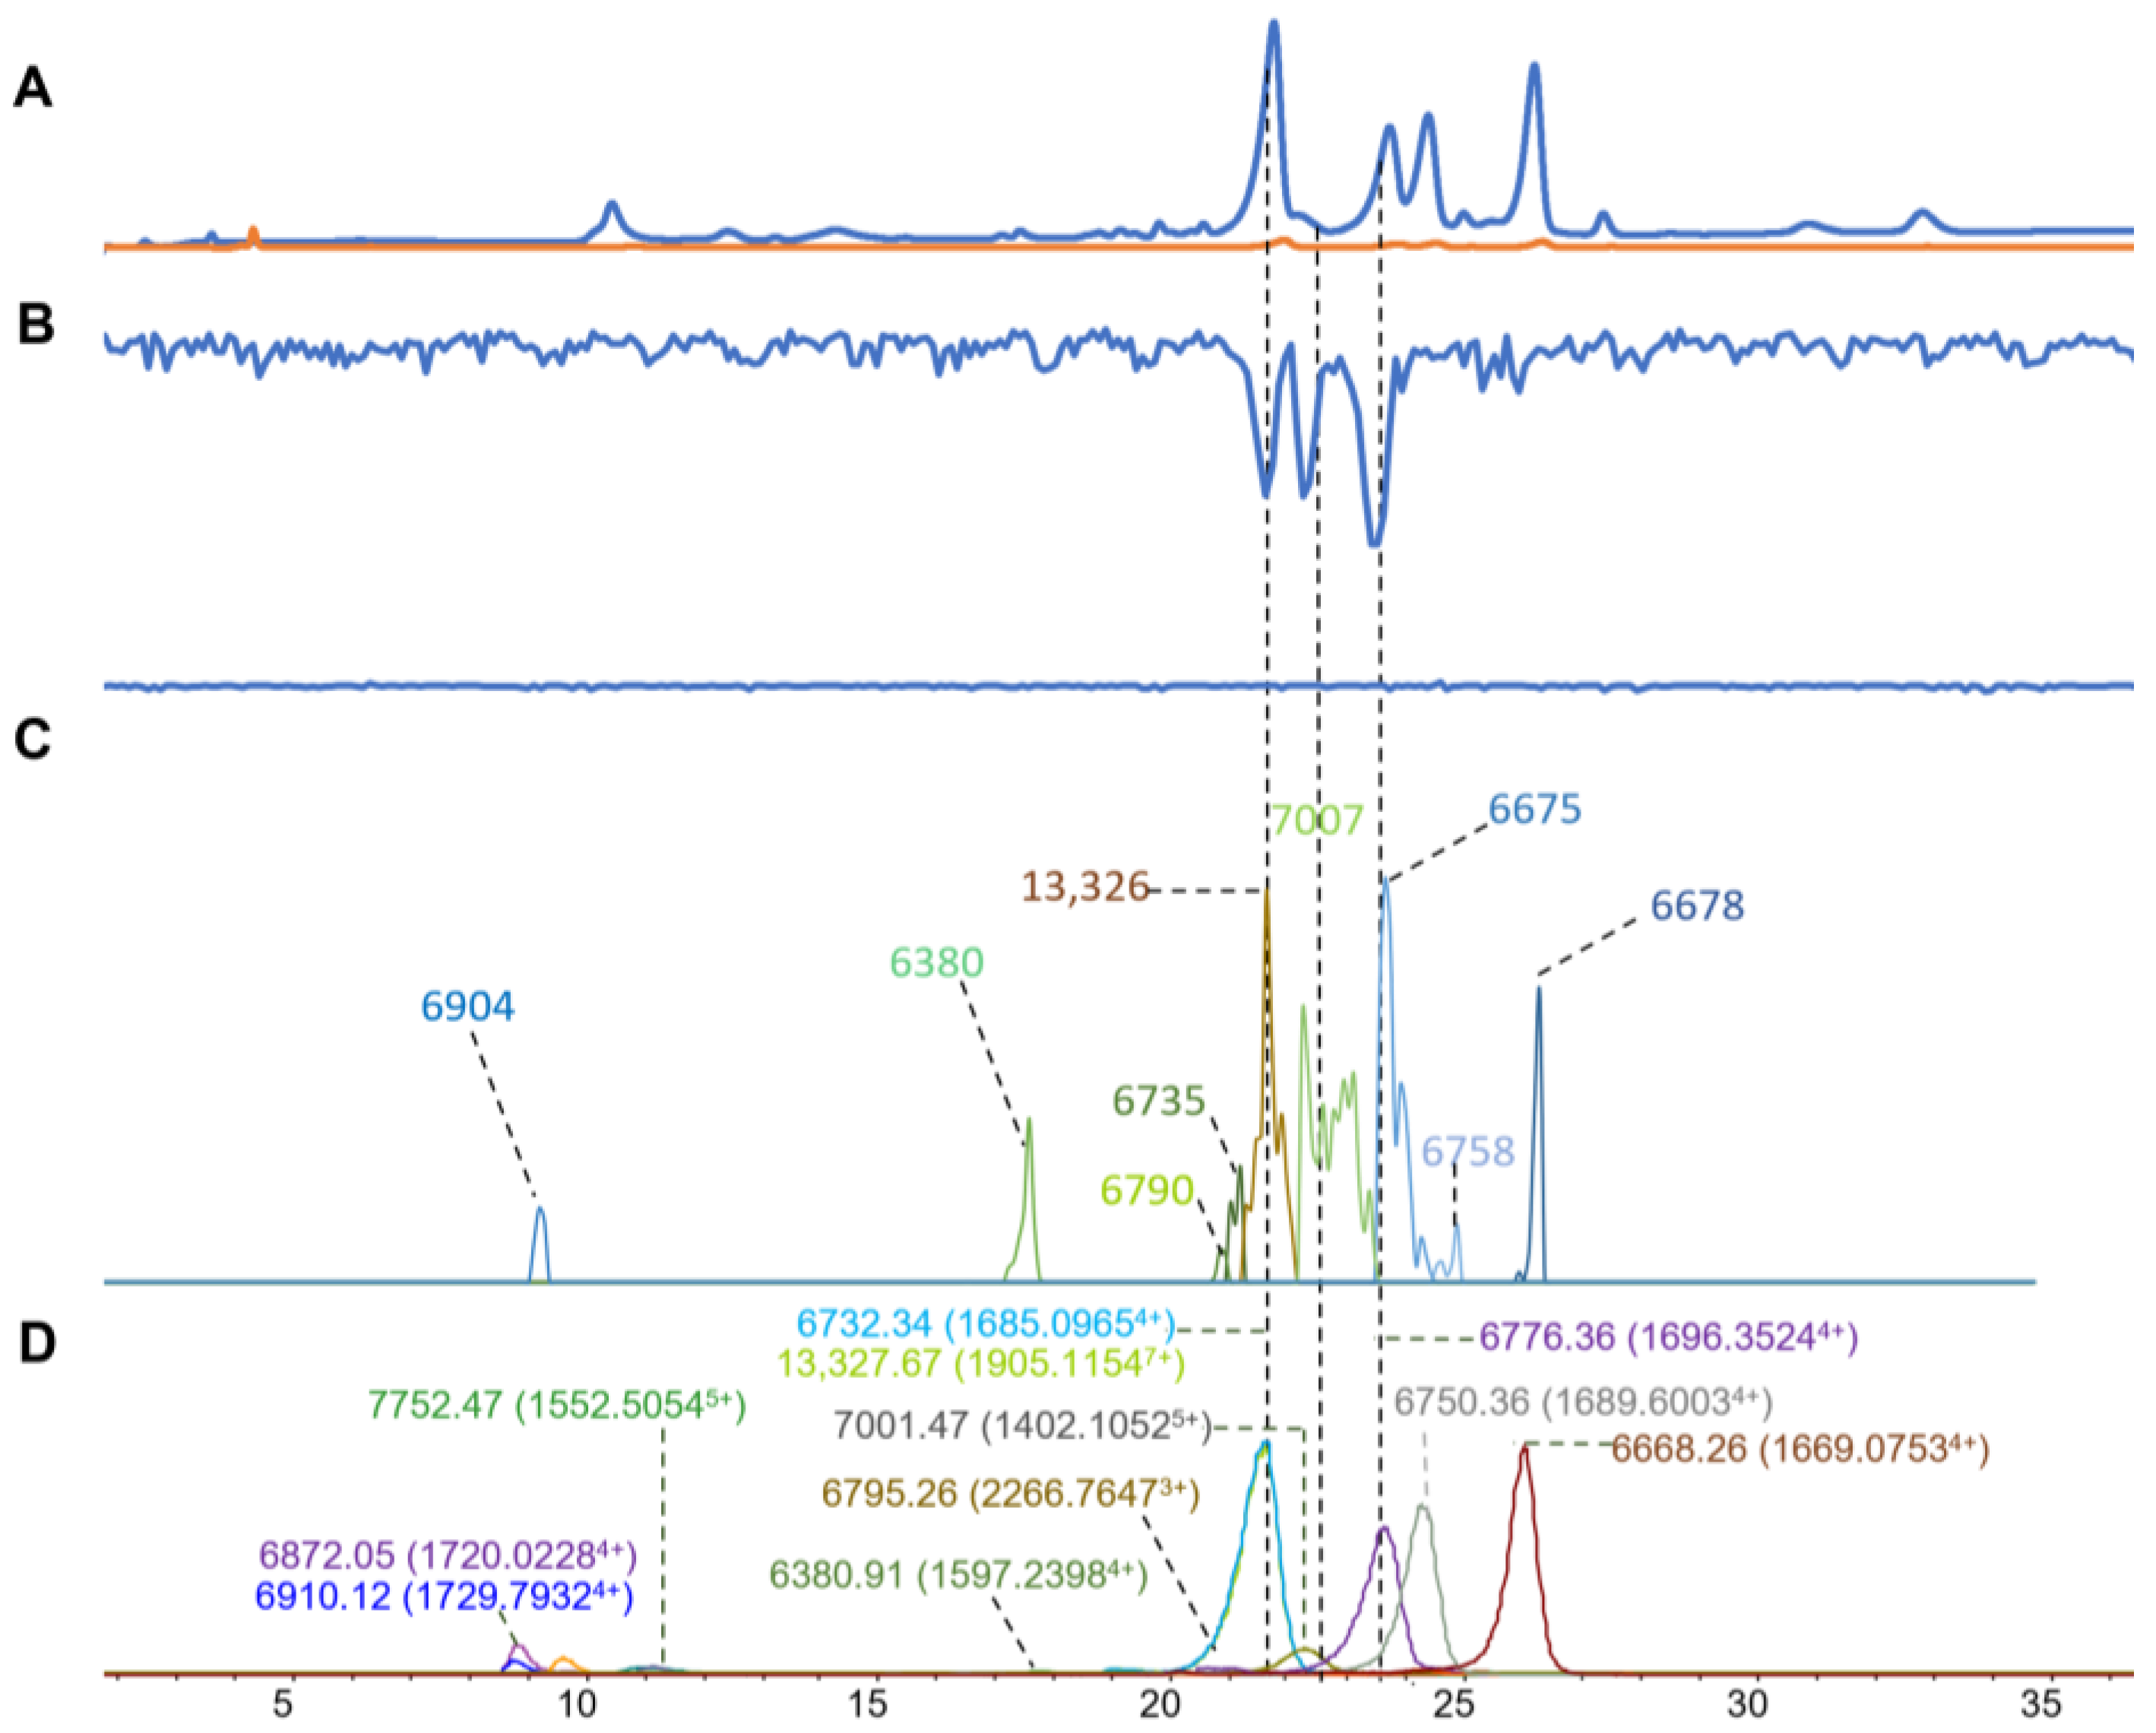
| N. naja | 8.1–10.6 | 1720.0228 | 4 | 6872.0474 | 95,500 | 60 | |||||
| 8.1–10.6 | 1729.7932 | 4 | 6910.116 | 45,730 | 6904 | 445 | 6 | ||||
| 8.1–10.6 | 1597.2398 | 4 | 6380.9144 | 49,120 | 6380 | 1770 | 0.9 | ||||
| 10.4–14.1 | 1552.5054 | 5 | 7752.4698 | 22,620 | |||||||
| 10.4–14.1 | 1512.5363 | 5 | 7552.6249 | 25,002 | 13,936 | 48 | |||||
| 14.1–19.8 | 1905.1154 | 7 | 13327.6723 | 10,810 | 13,326 | 4220 | 1.6 | 20,332 (10,1652+) | 32 | ||
| 20.0–23.1 | 1685.0965 | 4 | 6732.3407 | 736,612 | 6735 | 1110 | 2 | 10,165 | 30 | ||
| 20.0–23.1 | 2266.7647 | 3 | 6795.2598 | 8040 | 6790 | 1540 | 5.2 | 13,591 | 66 | ||
| 20.0–23.1 | 1402.1052 | 5 | 7001.4724 | 79,996 | 7007 | 2460 | 5.6 | ||||
| 23.1–24.9 | 1696.3524 | 4 | 6776.3613 | 492,842 | 13,558 | 22 | |||||
| 23.1–24.9 | 1337.4707 | 5 | 6677.2952 | 16,360 | 6675 | 4352 | 2.2 | ||||
| 24.8–26.5 | 1689.6003 | 4 | 6750.356 | 558,344 | 6758 | 625 | 8.3 | 13,517 | 36 | ||
| 26.4–32.4 | 1669.0753 | 4 | 6668.2556 | 930,222 | 6678 | 3124 | 9.8 | ||||
| N. haje | 14.3–19.2 | 1540.3371 | 5 | 7690.6252 | 259,700 | 7694 | 2060 | 4.6 | 5848 | 8 | 23.8 |
| 14.3–19.2 | 1804.0359 | 4 | 7207.0973 | 45,036 | 6560 | 39 | |||||
| 14.3–19.2 | 1809.2793 | 4 | 7227.0624 | 10,580 | 7222 | 1190 | 5 | 6393 | 529 | ||
| 19.1–21.8 | 1692.0586 | 4 | 6760.1881 | 1,300,398 | 9541 | 4 | |||||
| 19.1–21.8 | 2707.0797 | 5 | 13,522.3358 | 42,858 | 13,513 | 311 | 8.7 | 9688 | 29 | ||
| 21.5–23.2 | 1713.0735 | 4 | 6844.2473 | 186,076 | 13,765 | 104 | |||||
| 21.5–23.2 | 2336.032 | 3 | 7001.0381 | 776 | 7006 | 7298 | 5 | 20,290 (10,1472+) | 81 | ||
| 23.1–27.8 | 1713.062 | 4 | 6844.2047 | 803,464 | 20,542 (10,2602+) | 50 | |||||
| 23.1–27.8 | 1367.2478 | 5 | 6826.1874 | 52,578 | 6826 | 6086 | 0.1 | 27,045 (70063+) | 26 | ||
| 29,076 (14,5732+) | 8 | ||||||||||
| N. atra | 7.1–10.0 | 1737.9997 | 4 | 6943.9542 | 296,046 | 6947 | 4086 | 3.1 | 5814 | 10 | 50 |
| 9.8–13.3 | 1870.5805 | 4 | 7474.2789 | 6456 | 7479 | 232 | 4.8 | 6662 | 6085 | ||
| 14.8–15.7 | 1596.9376 | 4 | 6380.7067 | 22,144 | 6381 | 277 | 1.7 | 7005 | 236 | ||
| 14.8–15.7 | 1904.6295 | 4 | 7609.4763 | 7772 | 7616 | 1150 | 6.6 | 8387 | 15 | ||
| 13.4–14.8 | 1826.319 | 4 | 7297.2307 | 3260 | 7305 | 120 | 7.8 | 8852 | 12 | ||
| 19.2–21.3 | 2668.5028 | 5 | 13,328.4297 | 7130 | 13,329 | 869 | 0.6 | 10,172 | 18 | ||
| 21.1–27.3 | 2262.4411 | 3 | 6779.2931 | 46,420 | 6771 | 6367 | –8.2 | 10,429 | 8 | ||
| 19.2–21.3 | 2696.2686 | 5 | 13,467.2678 | 1914 | 13,474 | 404 | 6.8 | 13,890 | 153 | ||
| N. pallida | 12.4–15.0 | 1964.0992 | 4 | 7839.334 | 9400 | 7832 | 1132 | −7.3 | 13,009 | 112 | 50 |
| 12.4–15.0 | 1442.6444 | 5 | 7204.1603 | 261,398 | 7206 | 1869 | 1.9 | 13,470 | 450 | ||
| 18.4–20.2 | 1697.3461 | 4 | 6781.3384 | 644,342 | 6792 | 686 | 10.7 | 12,603 | 282 | ||
| 18.4–20.2 | 2665.1658 | 5 | 13,311.7823 | 19,900 | 13,322 | 1024 | 10.3 | 5637 | 49 | ||
| 19.6–23.1 | 1900.8443 | 7 | 13,283.7938 | 582,788 | 7468 | 4 | |||||
| 19.6–23.1 | 1888.6947 | 7 | 13,204.7641 | 384,474 | 13,212 | 1049 | 7.3 | 5329 | 11 | ||
| 19.6–23.1 | 1747.5919 | 4 | 6975.3087 | 7046 | 6973 | 686 | −2.3 | 7697 | 17 | ||
| 23.0–30.6 | 1705.5875 | 4 | 6814.3033 | 2,050,898 | 9244 | 25 | |||||
| 23.0–30.6 | 1701.3316 | 4 | 6796.2811 | 33,470 | 6793 | 9138 | −3.2 | 14,407 | 119 | ||
| 23.0–30.6 | 2728.5258 | 5 | 13,630.535 | 90,620 | 13,632 | 560 | 1.5 | 20,196 | 102 | ||
| 30.6–33.3 | 1680.0344 | 5 | 8389.4521 | 5064 | 8404 | 127 | 4.6 | ||||
| 30.6–33.3 | 2099.7898 | 12 | 25,169.2375 | 12,436 | |||||||
| 30.6–33.3 | 1929.6506 | 11 | 21,206.4127 | 3546 | 20,196 | 102 | 10.4 | ||||
| 33.3–36.3 | 1043.6935 | 7 | 7305.83 | 3444 | 7313 | 115 | 7.2 | ||||
| O. hannah | 9.2–11.4 | 1404.618 | 5 | 7014.0344 | 235,644 | 7003 | 4200 | −11 | 21,030 | 28 | 66.6 |
| 9.2–11.4 | 1401.2144 | 5 | 6996.017 | 101,660 | 7003 | 4200 | 4 | 7130 | 59 | ||
| 9.2–11.4 | 2808.6149 | 5 | 14,028.9908 | 12,904 | 14,026 | 270 | −2.9 | 6318 | 834 | ||
| 12.4–17.9 | 1461.839 | 5 | 7299.1297 | 13,584 | 7297 | 19 | −2.1 | ||||
| 12.4–17.9 | 1855.5367 | 4 | 7412.091 | 15,948 | 7418 | 32 | 6 | ||||
| 12.4–17.9 | 1909.5994 | 4 | 7630.3523 | 12,004 | 7643 | 65 | 12.7 | ||||
| P. textillis | 2.3–14.8 | 1668.2809 | 4 | 6666.0835 | 16,832 | 7064 | 1084 | 31.2 | |||
| 14.6–16.1 | 2319.5346 | 6 | 13,903.1396 | 16,114 | 6566 | 19 | |||||
| 14.6–16.1 | 1613.4088 | 4 | 6445.5897 | 19,406 | 10,037 | 5 | |||||
| 16.0–17.4 | 1680.2471 | 4 | 6711.9367 | 149,532 | 6704 | 2319 | −7.9 | 13,402 (67042+) | 29 | ||
| 16.0–17.4 | 1673.7435 | 4 | 6686.9284 | 194,924 | 7175 | 13 | |||||
| 17.2–18.3 | 2392.5352 | 6 | 14,340.1415 | 49,090 | 14,345 | 61 | 4.9 | ||||
| 17.2–18.3 | 1685.2454 | 4 | 6706.9143 | 25,428 | 6704 | 2319 | −7.9 | ||||
| 18.2–19.3 | 1708.9607 | 4 | 6827.7974 | 242,488 | 13,663 | 4 | |||||
| 18.2–19.3 | 2391.5371 | 6 | 14,335.1533 | 38,600 | 9412 | 7 | |||||
| 18.2–19.3 | 1727.9332 | 4 | 6902.6799 | 6986 | 6912 | 2049 | 9.4 | ||||
| 20.0–22.7 | 2302.016 | 6 | 13,799.0286 | 24,990 | |||||||
| 22.6–23.8 | 2351.5032 | 6 | 14,092.9367 | 103,814 | 14,098 | 857 | 5.1 | ||||
| 23.7–28.2 | 2602.9066 | 5 | 13,003.4925 | 31,024 | |||||||
| 23.7–28.2 | 3313.6185 | 9 | 29,805.5678 | 1994 | |||||||
| 28.2–32.7 | 1691.8874 | 5 | 8448.3763 | 11,332 | |||||||
| 28.2–32.7 | 2075.5803 | 4 | 8293.2742 | 6762 |
| Venom | Identified Toxin Families and Their Abundances | Number of Toxins Identified | Reference |
|---|---|---|---|
| N. naja | 3FTxs (61.07%), PLA2s (20.17%), SVMPs (6.10%), NGF (3.13%), CRISPs (3.03%), and LAAOs (1.97%) | 52 | [71] |
| N. kaouthia | 3FTxs (62.75%), PLA2s (17.48%), CRISPs (6.19%), SVMPs (4.53%), CVF (2.29%), and LAAOs (1.79%) | 55 | [71] |
| N. haje | 3FTxs (52.14%), PLA2s (24.02%), SVMPs (7.2%), CRISPs (4.85%), LAAOs (3.63%), and CVF (2.93%) | 57 | [72] |
| N. pallida | 3FTxs (81%), PLA2s (5%), CRISPs (3%), LAAOs (2%), NGF (2%), and SVMPs (1%) | N/A | [73] |
| N. atra | 3FTxs (84.3%), PLA2s (12.2%), CRISPs (1.8%), SVMPs (1.6%), and NGF (0.1%) | N/A | [74] |
| O. hannah | 3FTxs (43.0%), SVMPs (24.4%), CRISPs (8.7%), LAAOs (5.7%), Vespryn (5.7%), PLA2s (4.0%), and CVF (2.8%) | 116 | [75] |
| P. textillis | 3FTxs (34.73%), PLA2s (I15.64%), KPIs (14.55%), prothrombinase complex (12.25%), Snaclecs (10.55%), SVMPs (5.7%), and CRISPs (5.4%), 5′-NTs (2.1%) | N/A | [76] |
Disclaimer/Publisher’s Note: The statements, opinions and data contained in all publications are solely those of the individual author(s) and contributor(s) and not of MDPI and/or the editor(s). MDPI and/or the editor(s) disclaim responsibility for any injury to people or property resulting from any ideas, methods, instructions or products referred to in the content. |
© 2024 by the authors. Licensee MDPI, Basel, Switzerland. This article is an open access article distributed under the terms and conditions of the Creative Commons Attribution (CC BY) license (https://creativecommons.org/licenses/by/4.0/).
Share and Cite
Xu, H.; El-Asal, S.; Zakri, H.; Mutlaq, R.; Krikke, N.T.B.; Casewell, N.R.; Slagboom, J.; Kool, J. Aligning Post-Column ESI-MS, MALDI-MS, and Coagulation Bioassay Data of Naja spp., Ophiophagus hannah, and Pseudonaja textillis Venoms Chromatographically to Assess MALDI-MS and ESI-MS Complementarity with Correlation of Bioactive Toxins to Mass Spectrometric Data. Toxins 2024, 16, 379. https://doi.org/10.3390/toxins16090379
Xu H, El-Asal S, Zakri H, Mutlaq R, Krikke NTB, Casewell NR, Slagboom J, Kool J. Aligning Post-Column ESI-MS, MALDI-MS, and Coagulation Bioassay Data of Naja spp., Ophiophagus hannah, and Pseudonaja textillis Venoms Chromatographically to Assess MALDI-MS and ESI-MS Complementarity with Correlation of Bioactive Toxins to Mass Spectrometric Data. Toxins. 2024; 16(9):379. https://doi.org/10.3390/toxins16090379
Chicago/Turabian StyleXu, Haifeng, Susan El-Asal, Hafsa Zakri, Rama Mutlaq, Natascha T. B. Krikke, Nicholas R. Casewell, Julien Slagboom, and Jeroen Kool. 2024. "Aligning Post-Column ESI-MS, MALDI-MS, and Coagulation Bioassay Data of Naja spp., Ophiophagus hannah, and Pseudonaja textillis Venoms Chromatographically to Assess MALDI-MS and ESI-MS Complementarity with Correlation of Bioactive Toxins to Mass Spectrometric Data" Toxins 16, no. 9: 379. https://doi.org/10.3390/toxins16090379