Article

Pulsed Electric Field Induces Significant Changes in the Metabolome of Fusarium Species and Decreases Their Viability and Toxigenicity

1
Department of Food Analysis and Nutrition, University of Chemistry and Technology, Prague, Technicka 3, 166 28 Prague, Czech Republic
2
Crop Research Institute in Prague, Drnovska 507/73, 161 00 Prague, Czech Republic
*
Author to whom correspondence should be addressed.
Toxins 2025, 17(1), 33; https://doi.org/10.3390/toxins17010033
Submission received: 27 November 2024 / Revised: 31 December 2024 / Accepted: 9 January 2025 / Published: 11 January 2025
(This article belongs to the Section Mycotoxins)

Abstract

:
Fusarium fungi are widespread pathogens of food crops, primarily associated with the formation of mycotoxins. Therefore, effective mitigation strategies for these toxicogenic microorganisms are required. In this study, the potential of pulsed electric field (PEF) as an advanced technology of increasing use in the food processing industry was investigated to minimize the viability of Fusarium pathogens and to characterize the PEF-induced changes at the metabolomic level. Spores of four Fusarium species (Fusarium culmorum, Fusarium graminearum, Fusarium poae, and Fusarium sporotrichioides) were treated with PEF and cultured on potato dextrose agar (PDA) plates. The viability of the Fusarium species was assessed by counting the colony-forming units, and changes in the mycotoxin content and metabolomic fingerprints were evaluated by using UHPLC-HRMS/MS instrumental analysis. For metabolomic data processing and compound identification, the MS-DIAL (v. 4.80)–MS-CleanR–MS-Finder (v. 3.52) software platform was used. As we found out, both fungal viability and the ability to produce mycotoxins significantly decreased after the PEF treatment for all of the species tested. The metabolomes of the treated and untreated fungi showed statistically significant differences, and PEF-associated biomarkers from the classes oxidized fatty acid derivatives, cyclic hexapeptides, macrolides, pyranocoumarins, carbazoles, and guanidines were identified.
Key Contribution: The metabolomes of PEF-treated and untreated Fusarium spp. showed large differences, and a new data filtration method was proposed to select significant biomarkers, which were characterized and illustrate the influence of PEF on Fusarium spp. PEF was proved to reduce Fusarium spore viability and subsequent mycotoxin production by the formed fungi.

1. Introduction

Microscopic filamentous fungi of the Fusarium genus are among the most widespread plant pathogens [1]. These pathogens are responsible for many plant diseases, including seedling blights [2], root rots [3], and Fusarium head blight (FHB) [4], and can cause major losses in crop yield and quality, particularly when affecting cereal crops. Crop contamination is also accompanied by the presence of toxic secondary metabolites, mycotoxins, which represent a serious health risk to farm animals and humans [5]. For these reasons, together with the fact that climate change scenarios predict further increases in crop contamination [6], control, prevention, and decontamination strategies are urgently needed.
Prevention strategies involve adopting the best agricultural, manufacturing, and hygiene practices to mitigate the growth and spread of fungi, followed by mycotoxin synthesis [7]. The decontamination approach is based on chemical, biological, or physical methods, where the physical methods include technologies such as cold plasma [8], pulsed light [9], ozone treatment [10], ultrasound [11], and pulsed electric field (PEF) [12]. Of these, PEF technology, utilizing the application of short and intensive electric pulses on microbial pathogens, appears to be the most promising from the viewpoint of the mitigation of pathogenic fungi and mycotoxin reduction, with minimal effects on food taste, color, and nutrient content [13].
PEF technology has been used in the food industry for decades. Its antimicrobial effect is based on the fact that the high-potential electrical pulses with defined parameters in the environment of a conductive food matrix lead to the permeabilization of microorganism cell membranes and result in cell death [12,14]. Until now, it has been used mainly for the preservation of milk, eggs, juices, and other liquid foods, and its efficiency has been demonstrated mainly for yeasts and bacteria [15,16,17]. Although some studies indicating the potential of PEF to eliminate microscopic fungi have been published, this information is rather limited. Zhong et al. [18] demonstrated this phenomenon in Fusarium mycelium cells during PEF treatment of nutrient solutions. Evrendilek et al. [12] observed a significant reduction in pathogenic F. graminearum after PEF treatment of wheat, barley, parsley, onion, lettuce, tomato, and garden rocket seeds. A recent study by Palicova et al. [19] investigated the ability of Fusarium spores to survive PEF treatment with different intensities.
From a practical point of view, PEF technology has great potential in food technologies using “wet” technological steps, as it needs an electric current conductor. This is why intensive research on its application in malting technology for reducing mycotoxins was performed recently [20]. The aim was to apply PEF to barley containing Fusarium and Alternaria mycotoxins and reduce their content by degradation and increased extraction to the steeping water [20]. However, to the best of our knowledge, the direct influence of PEF on Fusarium fungus spores, as well as the impact of PEF on their metabolome, has not been investigated.
The present paper provides new information about the viability of Fusarium spores, the toxigenicity of the developed fungi, and the metabolomic changes during fungal maturation induced by the PEF treatment of spores of four well-known Fusarium species (F. culmorum (FC), F. graminearum (FG), F. poae (FP), and F. sporotrichioides (FS)). This pilot study provides important information exploitable for combatting this important food pathogen.

2. Results

2.1. UHPLC–HRMS/MS Method Optimization

One of the most important steps during the development of the UHPLC-HRMS/MS fingerprinting method was the optimization of the extraction procedure. In general, the extraction efficiency must be very broad and cover a wide range of metabolite polarities to avoid discrimination between some important biomarkers. The optimization of the extraction included testing four extraction solvents/solvent mixtures representing a different range of polarities, in particular methanol/propan-2-ol (50:50, v/v), methanol, methanol/water (50:50, v/v), and water. The final choice of extraction solvent depended on the absolute numbers of polar (eluting to 6 min RT), middle-polar (eluting from 6 to 12 min RT), and less polar metabolites (eluting between 12 and 19 min RT) to ensure a sufficient number of metabolites with different physicochemical properties. Accordingly, the best results were found for methanol/propan-2-ol, with an absolute number of 18,227 features (13,008 and 5219 features in positive (ESI+) and negative (ESI-) ionization mode). Nevertheless, according to Table 1, a methanol extract with an absolute number of features of 17,583 (12,109 and 5474 features in ESI+/ESI−) was more representative in the polar region and therefore chosen as the best option. The TIC (total ion current) records of the UHPLC-HRMS/MS fingerprints of the PEF-treated and control samples (FC, FG, FP, and FS) are shown in Figures S1–S4 of the Supplementary Materials. Although, at first sight, the TIC records of the PEF-treated and control samples were very similar, subsequent chemometric analysis identified clear differences.

2.2. Chemometric Analysis

The workflow pipeline, including the MS-DIAL (v. 4.80)–MS-CleanR–MS-FINDER (v. 3.52) software platform described in Section 5.6, was used to process the raw data files generated by the UHPLC-HRMS/MS analysis. In the first step, all the data were processed together by PCA to provide a first view of the differences between the metabolomes of samples from various groups. Figure 1 presents the PCA score scatter plot, where samples are colored according to Fusarium species and PEF-treated/untreated control groups. As seen from this figure, some PEF-treated samples were grouped together with the “PDA blank” samples. After a detailed check of the photos of the PDA plates, we found that on these plates, Fusarium mycelia were totally absent (in other words, PEF deprived the spores of their ability to germinate and form mycelia), so these samples were excluded from subsequent data analysis. In the next step, the data were processed as binary models for treated/non-treated variants for each Fusarium species, as described in Section 5.7. Then, for each species, PCAs were performed again, and as can be seen from Figure 2, the cluster separation was even better, promising good potential for follow-up supervised mathematical–statistical models and statistically significant marker generation.
To determine which features were most responsible for the clear clustering of samples between the PEF-treated and control samples in all datasets, supervised OPLS-DA models were built (see Figure S5). The values of all the quality parameters for all models are summarized in Table S1. The quality of all classification models was excellent according to the model classification by Triba et al. [21], the Q2 intercept values from the permutation tests (determined after 100 permutations) were below 0, and all models classified all samples into the known classes 100% correctly.
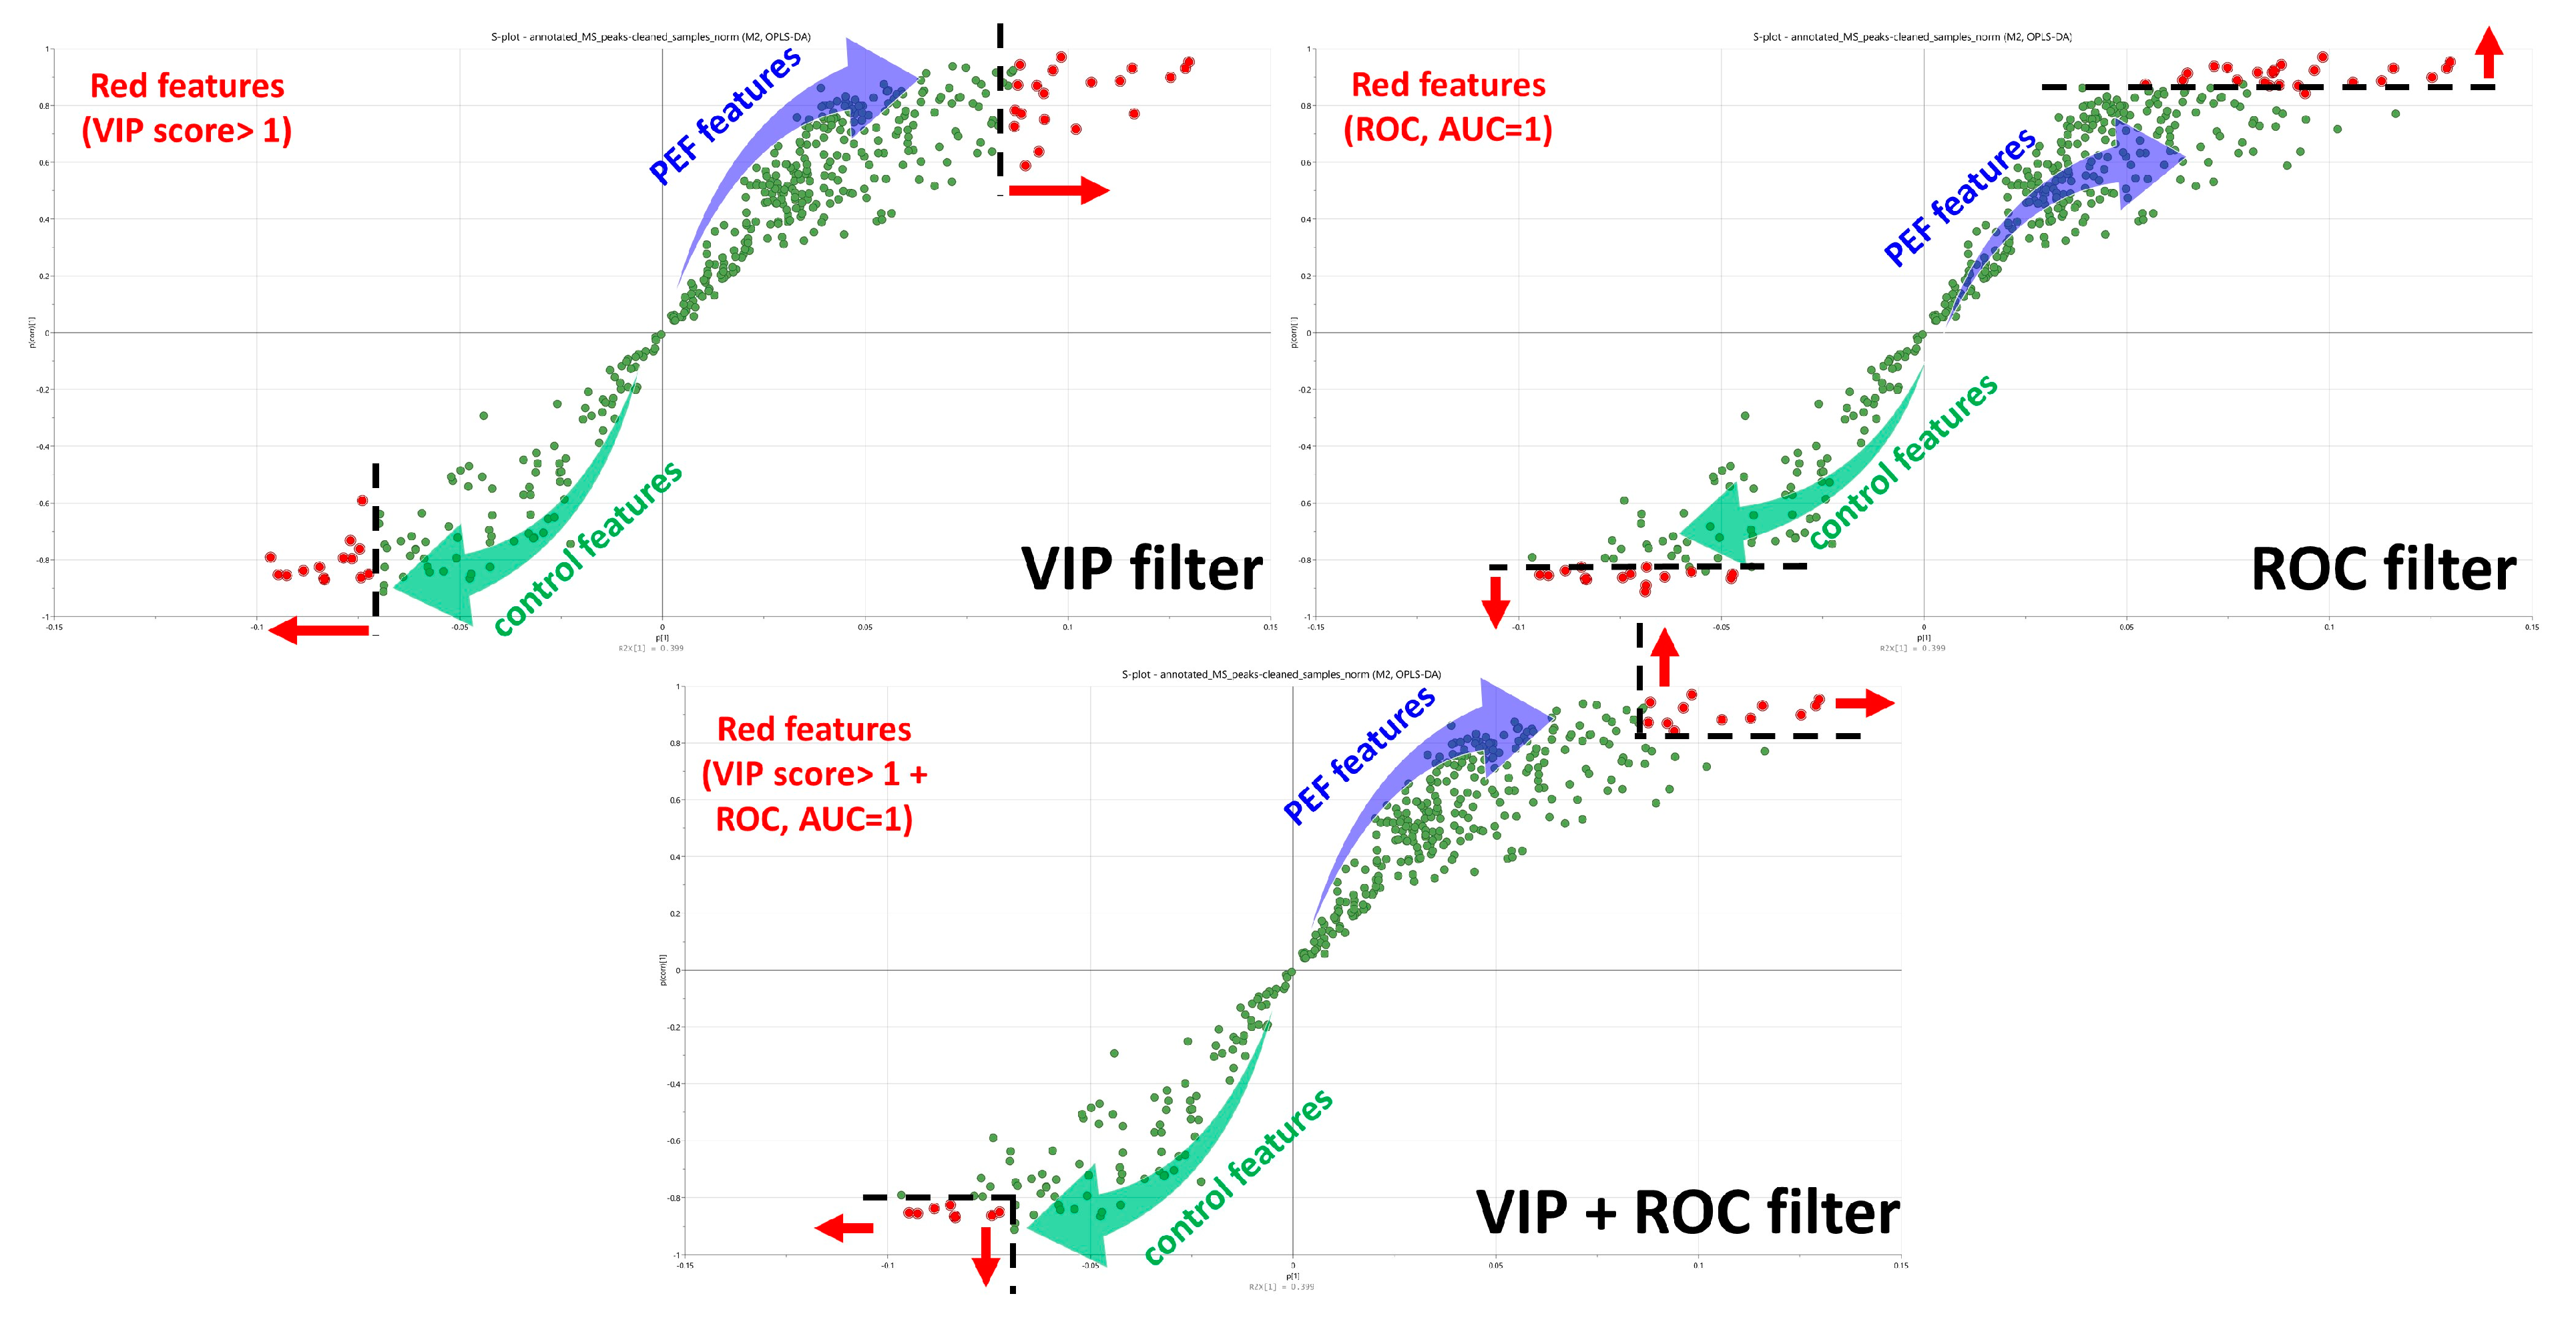
The most significant features responsible for the clustering of the PEF-treated and control samples, referring to biomarkers of metabolic changes in fungal metabolism after PEF treatment, were selected using VIP plots (VIP score > 1) combined with ROC analysis (AUC = 1). The simultaneous application of these two independent orthogonal statistical filters enabled the selection of a relatively low number of biomarkers, which were, however, very powerful and unique, which is essential for effective data interpretation. The selection of statistically significant features from the S-plot using a combination of VIP and ROC filters is illustrated in Figure 3.

2.3. PEF Biomarkers

Through this procedure, two groups of statistically significant features were selected for each dataset (where the PEF-related features represented biomarkers up-regulated after PEF treatment, whereas the control ones represented biomarkers down-regulated in reaction to PEF). In particular, 19 biomarkers related to PEF treatment (4 up-regulated, 15 down-regulated) were selected for FC, 26 biomarkers (21 up-regulated, 5 down-regulated) for FG, 40 biomarkers (24 up-regulated, 16 down-regulated) for FP, and 60 biomarkers (53 up-regulated, 7 down-regulated) for FS. All these biomarkers are summarized in the Candidates of PEF-related biomarkers and Candidates of control-related biomarkers .xlsx supplementary files, together with the mass spectrometric characteristics and the VIP/ROC selection parameters.
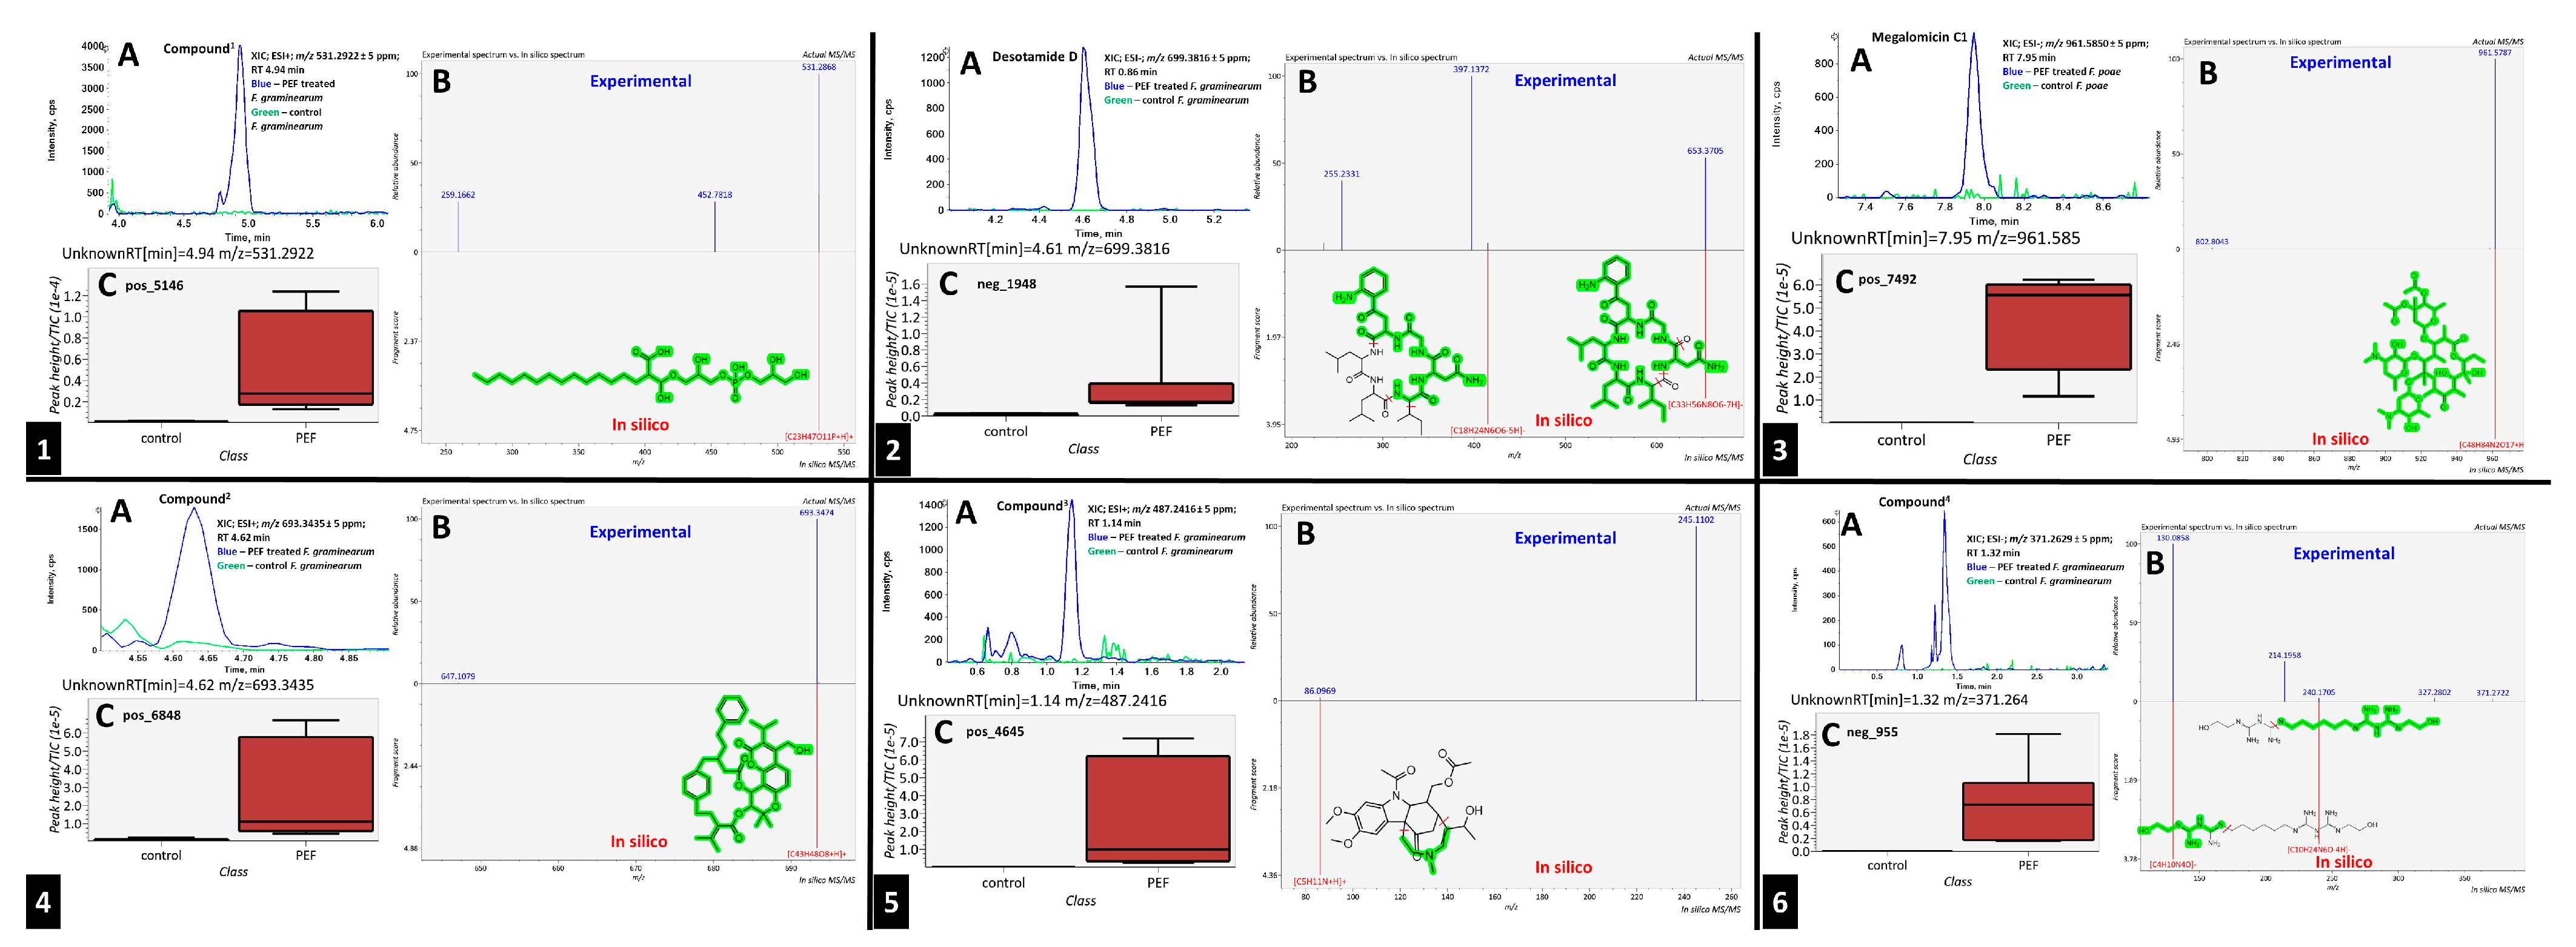
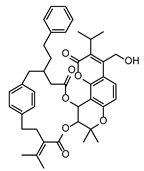
In the second step, biomarkers overlaying between the Fusarium species were investigated in more detail. Table 2 summarizes the PEF-related (up-regulated) biomarkers occurring exclusively in the PEF-related samples and in more than one Fusarium species. As can be seen from this table, one of the most commonly occurring PEF-related biomarker was 2-((3-(((2,3-dihydroxypropoxy)(hydroxy)phosphoryl)oxy)-2-hydroxypropoxy)(hydroxy)methyl)hexadecanoic acid, which was present in the mycelia of FG, FP, and FS. The other biomarkers belonged to the chemical classes cyclic hexapeptides, derivatives of N-acyl-alpha amino acids, pyranocoumarins, carbazoles, guanidines, and macrolides (see Table 2). The intensity trends of these biomarkers, shown as intensity boxplots, together with the raw mass spectrometric data, are shown in Figure 4. It is worth noting that this final check of the biomarker signals in the raw UHPLC-HRMS/MS data (not influenced by any kind of statistical intervention) is one of the most important steps confirming the diagnostic strength of a particular feature.
In the case of the control-related (down-regulated) biomarkers, the overlays between each Fusarium species were observed at the level of chemical ontology only (no metabolites that were structurally the same were found in the different Fusarium species, but some of them were of the same chemical groups, as classified by MS-FINDER software (v. 3.52)). These overlays are summarized in Table S2 and include triterpenoids, N-acyl-alpha amino acids and derivatives, and oligopeptides.

2.4. Influence of PEF on Fungal Viability and Mycotoxin Production

In addition to metabolomic analysis, the effect of PEF on the spore viability and mycotoxin production of Fusarium fungi was investigated. An important fact is that the viability of all four Fusarium species (FC, FG, FP, and FS) showed a statistically significant decrease after PEF treatment of the spores when compared to the control (see Table S3). However, the extent of this response to PEF was not the same and varied between the species. FP spores were the most sensitive and showed a strong reduction in viability (9.4% of surviving spores). On the other hand, FC spores were shown to be the most resistant (53.4% of surviving spores).
As concerns the influence of PEF on the potential of fungi to form mycotoxins, the UHPLC-HRMS/MS analyses performed on three biological replicates of all variants (Fusarium species and PEF-treated vs. control samples) revealed interesting facts. Of all 22 Fusarium mycotoxins included in our method, altogether, 9 toxins were semi-quantified in PDA cultivates of our FG, FC, FS, and FP strains (see Table S4), with type B trichothecenes, including deoxynivalenol (DON) and its acetylated derivatives, as the main metabolites produced by FC, zearalenone (ZEA) as the main mycotoxin produced by FG, and type A trichothecenes, including T2 toxin, HT2 toxin, diacetoxyscirpenol (DAS), and neosolaniol (NEO), as the main metabolites of FS and FP. We observed statistically significant decreases in the PEF-treated variants for almost all mycotoxin/producer combinations, i.e., for DON in FC isolates and for ZEA in both FC and FG isolates. As concerns the FS and FP strains, a statistically significant reduction could be observed for DAS and NEO (see Figure 5). Considering that the presence of potential degradation products of unknown toxicity could pose a risk to food safety, we also performed targeted screening for PEF-induced transformation/degradation products of mycotoxins according to Stranska et al. [20]. As no convincing signals for these degradation products meeting the standard quality of mass spectrometric data were identified, we can say that the reduced mycotoxin content after PEF treatment is a direct consequence of the reduced viability of the fungal producer.

3. Discussion

Rapidly increasing advances and innovations in mass spectrometry, including throughput, sensitivity, resolution, and other parameters, are responsible for generating large amounts of big and very complex data. In response to that, adequate innovations in data processing are required [22]. Currently, it is possible to observe a noticeable trend in the use of freely available “vendor-free” software for data handling, which is continuously driven and upgraded by an active scientific community. Unlike commercial software provided by vendors, open access software is able to support datasets from different instruments and provide readily available data analysis on personal computers [23,24,25]. Data processing software assuring peak picking and alignment (e.g., MS-DIAL [23], MzMine [22]) often works hand in hand with annotating software (e.g., MS-FINDER [26], SIRIUS [27]), providing automatic identification of thousands of compounds. In addition to this, various data “cleaning” software platforms eliminating insignificant features, like ghost peaks, blank ions, and artefacts and ions with improbable retention time shifts or relative mass defects (e.g., MS-CleanR [28], notame [29]), can be used. The outputs of these software platforms then represent a filtered dataset of metabolomic features describing the biological systems examined. Especially thanks to automatic identification, which represents a significant time saving step (instead of manually searching the databases), it is possible to focus on data interpretation and strengthen the impact of the whole study.
In this study, the workflow pipeline, including the MS-DIAL–MS-CleanR–MS-FINDER vendor-free software platform, was used to handle data from processing, through cleaning and filtering, to the final annotation and identification of the features. To describe the metabolomic changes related to PEF treatment and find the biomarkers responsible for these changes, the choice of statistical tools for the selection of statistically significant features was very important. In this way, the use of two independent filters (VIP + ROC) was implemented for the first time. Simultaneous application of these filters provided a list of unique biomarkers related to the up-regulation (PEF-related) and down-regulation (control-related) of various biosynthetic pathways induced by the PEF treatment. In general, this workflow pipeline, based exclusively on free software, enabled the collection of a list of robust and biologically significant metabolites, applicable for studying metabolic changes in a wide range of food-related pathogenic microorganisms.
The primary effect of PEF on a majority of microorganisms is that it creates irreversible micropores on the membranes of microbial cells, rendering the membrane semipermeable, and resulting in cell death. However, different mechanisms probably work in the case of spores, as highly durable forms of microorganisms resistant to a variety of adverse conditions, such as heat or UV/ionizing irradiation, among others. For spores, only a limited inactivation effect has been reported to date, and the possible modes of action are still unclear. There are some studies in the literature focused on bacterial and yeast spores describing changes in their physical shape, and the creation of tiny physical cracks on the spore surface, influencing the two-way transport of nutrients, metabolites, and various signal molecules [30,31]. In our study, the research was focused on the spores of fungi; however, we presume that the PEF-induced processes influencing skeletal changes are more or less similar. The conidia of Fusarium fungi are known to contain a high content of endogenous lipids, which usually serve as a good substrate for their germination [32]. However, the PEF-initiated damage to the spore wall probably enables the leakage of these storage lipids (and other nutrients) from spores through the cracks, thus influencing the spore germination, as well as the whole metabolism during fungal maturation and mycelial development. This phenomenon is nicely demonstrated by our data presented in Table S5 where we clearly prove a significantly higher amount of lipid species in the PEF-treated spore suspension when compared to the control (experiment described below Table S5 in the Supplementary Materials).
As further illustrated above and shown in Figure 1 and Figure 2, the metabolomes of the PEF-treated and control Fusarium fungi are completely different for all of the Fusarium species investigated. By using all of the above-described utilities of contemporary modern science, we were able to identify several very strong and unique PEF-related biomarkers occurring exclusively in the PEF-related samples (see the boxplots in Figure 4), which co-occurred in more than one or two Fusarium species. The most frequent PEF-related biomarker occurring in even three of the four Fusarium species investigated (FG+FS+FP) was identified as a derivative of glycerolphosphate and propoxy-hydroxy-hexadecanoic acid (Compound1 in Table 2 and Figure 4). Despite the deep-seated aim to find any details about this compound, we were not successful in searching the databases, and thus the biological interpretation is not known. Another PEF-related biomarker identified in the FG and FP species was tentatively identified as desotamide D (Table 2, Figure 4), a compound belonging to the cyclic hexapeptide class. The compound was previously isolated from the marine bacterium Streptomyces scopuliridis and was shown to be active against some species of pathogenic bacteria [33]. Another PEF-related biomarker co-occurring in the FP and FS species was megalomicin C1 (Table 2, Figure 4), a compound previously described as a secondary metabolite of the micromycete Micromonospora megalomicea, and belonging to the macrolide group of antibiotics with a broad scope of antimicrobial activities [34]. Another three so far undescribed compounds belonging to the chemical classes pyranocoumarins, carbazoles, and guanidines (Compound2, Compound3, Compound4; Table 2, Figure 4) were identified as unique PEF-related metabolites occurring in the FG + FS species.
Elucidation of the origination of these biomarkers at the biochemical level is difficult, as the current knowledge of metabolomic pathways for microorganisms, specifically Fusarium fungi, is not deep enough (it has been reported that filamentous fungi express tens thousands of secondary metabolites, where perhaps less than 10% of these metabolites are known [35]). Nevertheless, despite the fact that a satisfactory interpretation is not possible at this stage, it is highly probable that these results provide an important basis for follow-up research integrating other superior levels of the “omics” disciplines, including transcriptomics and proteomics. The Fusarium metabolites identified in this study were formed exclusively as a consequence of the PEF treatment of the Fusarium spores and are directly associated with a significant decrease in organism viability, as well as with a decreased potential of fungi to produce toxic mycotoxins. The current results will serve as cornerstones for further understanding.

4. Conclusions

This study aimed to describe the effect of PEF on the changes in the metabolomes of four of the most commonly occurring Fusarium species, together with an assessment of the viability and toxigenicity of these micromycetes after the PEF treatment. The most significant results relevant to the practical impact of PEF on the final fungi are summarized below:
  • The PEF treatment significantly reduced the viability of the Fusarium species investigated in this study (i.e., F. culmorum, F. graminearum, F. sporotrichioides, and F. poae), where the extent of the reduction was the highest for F. poae (9.4% of surviving spores) and the lowest for F. culmorum (53.4% of surviving spores).
  • The reduction in Fusarium species viability corresponded with a reduction in the mycotoxin content, specifically for DON in the F. culmorum isolates, ZEA in both the F. culmorum and F. graminearum isolates, and DAS and NEO in both the F. sporotrichioides and F. poae species.
  • The overall metabolomes of the PEF-treated and untreated Fusarium species were significantly changed, and the statistically significant markers related to the PEF treatment were characterized using the tools of modern high-resolution mass spectrometry. Despite the fact that the biological interpretation of these markers was not successful at this stage, as the knowledge on complex metabolic pathways and the secondary metabolism of micromycetes, including Fusarium, is very poor, the well-characterized compounds directly associated with the PEF intervention will serve as a basis for follow-up multi-omics studies.

5. Materials and Methods

5.1. Analytical Standards and Chemicals

Altogether, 22 certified analytical standards of mycotoxins and their metabolites (Table S6 in the Supplementary Materials) were obtained from Romer labs (Getzersdorf, Austria), Cayman Chemical (Ann Arbor, MI, USA), Merck (Darmstadt, Germany), and LKT Laboratories (St. Paul, MN, USA). This group of analytes included 22 Fusarium toxins (for details, see the Supplementary Text).
Acetonitrile, methanol, isopropanol, ammonium formate, ammonium acetate, and formic acid (all LC-MS-grade) were obtained from Merck (Darmstadt, Germany). Deionized water (18 MΩ, 25 °C) was prepared using a Milli-Q® system (Millipore, Bedford, MA, USA).

5.2. PEF Treatment of Fusarium Spores

Four highly pathogenic Fusarium strains (F. culmorum—VURV-F 425; F. graminearum—VURV-F 361; F. poae—VURV-F 996; F. sporotrichioides—VURV-F 205) obtained from the Culture collection of microorganisms of the Crop Research Institute (Czech Republic) were used for the experiments in our study. For each Fusarium strain, spore suspensions in sterile tap water (105 spore·mL−1) were prepared according to the method described by Šíp et al. [36] and treated separately, one after another, by the PEF System (OMNIPEF, VITAVE, Czech Republic) with a continual treatment chamber reactor. Treatment was performed under the following conditions: voltage 10 kV.cm−1, current 10 A, bipolar pulses (positive and negative), pulse width 5 µs, frequency 450 Hz, and flow rate 5 mL·s−1. The total treatment time was about 10 min, and the total specific energy delivered to the suspension was 90 J·mL−1 (calculated according to Formula S1 in the Supplementary Materials), representing an energy dose similar to real conditions when using PEF to minimize Fusarium during food processing (Prusova et al. [37]). The control samples were passed through the PEF device without the application of electric pulses to ensure the same “processing background” for the experiment. At the end of the treatment, the suspension was drained from the device and collected in sterile tubes for further analysis. The device was sterilized prior to each treatment.

5.3. PDA Plate Preparation

Treated and untreated water spore suspensions were subsequently pipetted onto Petri dishes with potato dextrose agar (PDA, HiMedia Laboratories, Brno, Czech Republic). The spore concentration was unified for all samples. Every PDA plate (60 mm) was inoculated with 20 µL of spore suspension and cultivated for seven days at 20 °C in the dark. All sample variants were prepared in eight replicates. To ensure the suppression of bacterial growth, the antibiotic gentamycin (2 mL·L−1) was added to the PDA medium. “PDA blank” plates without fungal inoculation were also prepared for the purposes of UHPLC-HRMS/MS data processing. Samples were stored at −80 °C before processing in the laboratory.

5.4. Exraction of PDA Plates

Before extraction, whole frozen samples of PDA plates with mycelial isolates were cut and placed into a PTFE (polytetrafluoroethylene) cuvette to ensure the processing of all fungal mycelia. Then, methanol (MeOH) was added to each sample at a sample/solvent ratio of 1:5 (g:mL) and homogenized (IKA-Turrax-T25D, IKA Works GmbH & Co. KG, Staufen im Breisgau, Germany). The cuvette with the homogenized sample was then placed on a laboratory shaker (HS 260 basic, IKA Works GmbH & Co. KG, Germany) for 30 min (shaking at 240 RPM). The extract was then centrifuged (Rotina 35 R, Hettich Zentrifugen, Germany) for 2 min at 13,528 RCF (relative centrifugal force) and microfiltered through 0.2 µm spin filters (Ciro, Deerfield Beach, FL, USA). Finally, an aliquot of approx. 1 mL was transferred to a glass HPLC vial for further analyses by UHPLC-HRMS/MS. The “PDA blank” samples were prepared in the same way. To eliminate potential system drift in the analytical system, the pooled extract (quality control sample (QC)) was prepared by mixing 100 µL of extract from each sample and analyzed. To exclude background signals from the laboratory dishes and solvents, a “processing blank” sample was prepared together with the analyzed samples.

5.5. UHPLC-HRMS/MS Metabolomic Fingeprinting

UHPLC-HRMS/MS analysis was performed according to the study of Stranska et al. [38], with slight modifications. For more details about the UHPLC-HRMS/MS method, see the Supplementary Text. To record the MS1 and MS/MS data, the TOF MS method (full scan) and the Information Dependent Acquisition (IDA) method with electrospray ionization in positive and negative polarity (ESI+/ESI-) were used. The working range was 100–1200 m/z for MS1 and 50–1000 m/z for MS/MS, and data were acquired between 0.5 and 19 min. The MS/MS spectra were collected for the eight most intensive ions of the MS spectra throughout the chromatographic run. The collision energy was 35 ± 15 V, and the QC sample was analyzed every ten samples during the sequence. Instrument control and data acquisition were operated with Analyst 1.7.1 TF software (SCIEX, Concord, ON, Canada), and qualitative analysis was performed using SCIEX OS software (v. 1.5.0.23389, SCIEX, Concord, ON, Canada).

5.6. Metabolomic Data Processing and Statistical Analysis

Data processing: For data mining and processing, the freely available MS-DIAL–MS-CleanR–MS-FINDER software platform was used according to the workflow published by Stranska et al. [38]. In the first step, the UHPLC-HRMS/MS data were processed and deconvoluted by MS-DIAL (v. 4.80, 2021, RIKEN, Saitama, Japan). For peak picking, the MS1 and MS/MS tolerances were set to 0.03 and 0.1 Da in the centroid mode for both the datasets acquired in the ESI- and ESI+ modes. For peak alignment, the QC reference file was used, with an RT tolerance of 0.05 min and mass tolerance of 0.015 Da. The minimum peak height for peak detection was set to amplitude 9000 (referring to 70% under the observed baseline for a blank injection). Zero values were replaced with 1/10 of the minimum peak height for all samples during the export of the aligned results from MS-DIAL. In the second step, the aligned results were cleaned with the MS-CleanR (MetaToul-AgromiX Platform) tool based on the user-friendly Shiny–RStudio interface. For data cleaning, all filters, including blank filters, a ghost peak filter, incorrect mass, relative standard deviation, and relative mass defect, were activated, with the minimum blank ratio set to 0.8, the maximum relative standard deviation (RSD) set to 30%, and the relative mass defect (RMD) ranging from 50 to 3000. The maximum RT difference and mass difference tolerance values were set to 0.025 min and 0.005 Da for Pearson correlation and ESI+/- data merging. In this step, feature clustering based on Pearson correlation and the MS-DIAL peak character estimation algorithm (MS-DIAL-PCE) was implemented, and one peak (the most intense) was kept in each cluster. In the third step, the filtered features were automatically annotated with MS-FINDER (v. 3.52, 2021, RIKEN, Japan). The MS1 and MS/MS tolerances were set to 5 and 15 ppm, respectively. C, H, O, N, P, and S atoms were included in the formula finder parameter module. As a data source for automatic identification, the databases YMDB, ECMDB, PlantCyc, ChEBI, T3DB, NPA, KNApSAcK, LipidMaps, and PubChem were used. On the basis of the accurate mass and isotope ratio of MS1 ions, the elemental compositions of the candidate ions were proposed, and possible chemical structures of the candidates were computed by comparing the experimental and in silico MS/MS spectra (MS-FINDER in silico fragmentation is based on the hydrogen rearrangement rules published by Tsugawa et al. [26]). For the last step, MS-FINDER offers several available chemical formulas and related chemical structures ranked by score for each parameter. The best results often match with the highest scoring formula and structure options and are included in the next steps. Finally, MS-CleanR was launched, where it matched information from the MS-FINDER automatic annotation with filtered features and created a final data matrix with filtered and annotated features for further statistical analysis. In this step, MS-CleanR also matched data from the ESI+ and ESI- ionization modes into one data matrix. First, the data were processed together in order to obtain a primary insight, and then separately for each Fusarium species (FC, FG, FP, FS). Statistical analysis: Each data matrix (FC, FG, FP, FS) was filtered using univariate tools (volcano plot—t-test, fold change) to exclude statistically insignificant features and prevent overfitting of the final models. Univariate methods were performed by using the freely available web platform MetaboAnalyst (v. 5.0, Xia Lab, McGill, Montreal, QC, Canada), with a t-test false discovery rate (FDR) adjusted p-value of <0.01 and fold change of >2. A general overview of the features reduction during data filtration for all data matrices is summarized in Table S7. The final filtered and annotated data matrices, including annotated features only (for each species separately), were processed with MS Excel to perform normalization of the data (total area sum normalization). Normalized data were uploaded to SIMCA software (v. 17.0, 2021, Sartorius, Göttingen, Germany), where multivariate principal component analysis (PCA) and orthogonal partial least squares discriminant analysis (OPLS-DA) were performed. Before the creation of every classification model, Pareto scaling and logarithmic transformation of the data were performed. The quality of the models was determined using the R2Y and Q2 validation parameters calculated by a 7-round internal cross-validation and misclassification table (MT), which summarizes how well the selected models classify the samples into the known classes. Candidate biomarker compounds were selected based on OPLS-DA S-plots and Variable Importance in Projection (VIP) plots, together with receiver operating characteristics (ROCs). Both filters were applied simultaneously in an orthogonal way to assure proper statistical filtration and to keep only the strong biomarkers relevant for further data interpretation. For selection, VIP scores greater than 1 (VIP score >1) and ROC area under the curve (AUC = 1) parameters were set. The biomarker selection process was confirmed by checking the boxplots illustrating the distribution of features between the sample groups.

5.7. Target Analysis of Mycotoxins by UHPLC-HRMS/MS and Statistical Evaluation

For targeted screening of mycotoxins, methanolic extracts of PDA plates (Section 5.4, Extraction of PDA Plates) were used. UHPLC-HRMS/MS analysis was performed according to the study of Dzuman et al. [39]. The UHPLC-HRMS/MS method is described in detail in the Supplementary Text and in Tables S8 and S9. For the semi-quantitative results, an external solvent (methanol) calibration series of mycotoxin standards (Section 5.1, Analytical Standards and Chemicals) was created in the concentration range of 0.5–200 ng·mL−1. The determined limits of quantification (LOQs) of all detected mycotoxins are summarized in Table S10. The significance of the differences between the PEF-treated and control samples was statistically evaluated using the Wilcoxon rank-sum test (p-value < 0.1) performed in MetaboAnalyst.

5.8. Viability Test and Statistical Evaluation

Fusarium spore viability testing was performed on PDA plates prepared according to Section 5.3, PDA Plate Preparation. The number of colony-forming units (CFUs) per plate was counted after 3 days of cultivation. Statistical differences between the PEF-treated and control samples were analyzed by ANOVA (analysis of variance) with a 95% confidence interval and 5% level of significance separately for each Fusarium species. ANOVA was performed using STATISTICA software (ver. 14.0.0.15, TIBCO, Palo Alto, CA, USA).

Supplementary Materials

The following supporting information can be downloaded at https://www.mdpi.com/article/10.3390/toxins17010033/s1: Supplementary text to Section 5.1, Analytical Standards and Chemicals. Supplementary text to Section 5.2, PEF Treatment of Fusarium Spores. Supplementary text to Section 5.5, UHPLC-HRMS/MS Metabolomic Fingerprinting. Supplementary text to Section 5.8, Target Screening of Mycotoxins by UHPLC-HRMS/MS. Table S1: Quality parameters (R2Y, Q2) and misclassification table (MT) results of OPLS-DA models. Table S2: Control-related biomarkers and their ontologies co-occurring in at least two Fusarium species. Table S3: Boxplots demonstrating statistically significant differences between control (C) and PEF-treated spore suspensions of four Fusarium species (FC—F. culmorum; FG—F. graminearum; FP—F. poae; FS—F. sporotrichioides), CFU/dish (colony-forming units per Petri dish with PDA). Significance was tested using ANOVA (p-value <0.5). Table S4: List of semi-quantified mycotoxins with their abundance in selected samples (3 biological replicates of each Fusarium species (FC—F. culmorum; FG—F. graminearum; FP—F. poae; FS—F. sporotrichioides) and sample type: control vs. PEF-treated). Results represent concentrations of mycotoxins (15-acetyldeoxynivalenol (15-ADON), 3-acetyldeoxynivalenol (3-ADON), beauvericin (BEA), diacetoxyscirpenol (DAS), deoxynivalenol (DON), HT-2 toxin (HT2), neosolaniol (NEO), T-2 toxin (T2), zearalenone (ZEA)) [µg·kg−1] spread in the whole PDA plate, including the PDA media. Mycotoxins with statistically significant differences (Wilcoxon rank-sum test (p-value < 0.1)) are highlighted green. Table S5: Non-targeted lipidomics by UHPLC-HRMS/MS—number of nonpolar features representing amount of lipid species in control and PEF-treated spore suspensions. Table S6: List of 22 certified analytical standards of mycotoxins and their metabolites. Table S7: The general overview of the feature reduction during data filtration for all data matrices. Table S8: Detailed conditions of UHPLC-HRMS/MS mycotoxin analysis. Table S9: A list of exact masses of target analytes, fragment ions, retention times, and analyte-specific normalized collision energies (NCEs). Precursor ions for fragmentation are in bold. Table S10: Determined limits of quantification (LOQs) of all semi-quantified mycotoxins in PDA plates. Figures S1–S4: UHPLC-HRMS fingerprints of PEF-treated (blue) and control (green) F. culmorum (FC), F. graminearum (FG), F. poae (FP), and F. sporotrichioides (FS) samples; MeOH extracts, ESI+. The zoomed-in areas of the TIC chromatograms highlight the differences in the low-intensity regions. Figure S5: The OPLS-DA models (score scatter plot) of each Fusarium species dataset (FC—F. culmorum; FG—F. graminearum; FP—F. poae; FS—F. sporotrichioides) colored according to PEF treatment (PEF) and control with excellent values of quality parameters.

Author Contributions

Conceptualization, M.S.; methodology, M.S., A.B. and J.P.; software, A.B.; validation, A.B., J.P., A.-H.T. and N.P.; formal analysis, A.B., J.P., A.-H.T. and N.P.; investigation, A.B., J.P., A.-H.T., N.P. and M.S.; resources, M.S.; data curation, A.B., J.P. and N.P.; writing—original draft preparation, A.B.; writing—review and editing, A.B. and M.S.; visualization, A.B. and J.P.; supervision, M.S.; project administration, M.S.; funding acquisition, M.S. All authors have read and agreed to the published version of the manuscript.

Funding

This research was funded by the Czech Science Foundation (GACR) grant number 20-14649S and specific university research grant number A1_FPBT_2024_006. This work used data/tools/services/facilities provided by the METROFOOD-CZ Research Infrastructure (https://metrofood.cz, accessed on 1 January 2020), supported by the Ministry of Education, Youth and Sports of the Czech Republic (Project number LM2023064).

Institutional Review Board Statement

Not applicable.

Informed Consent Statement

Not applicable.

Data Availability Statement

The original contributions presented in this study are included in the article/supplementary material. Further inquiries can be directed to the corresponding author.

Acknowledgments

The authors would like to thank the collaborators from VITAVE (VITAVE Tech s.r.o., U Stavoservisu 692/1b, 108 00, Prague, Czech Republic) for the technical support and consultations when performing the experimental work.

Conflicts of Interest

The authors declare no conflicts of interest.

References

  1. Bakker, M.G.; Brown, D.W.; Kelly, A.C.; Kim, H.S.; Kurtzman, C.P.; McCormick, S.P.; O’Donnell, K.L.; Proctor, R.H.; Vaughan, M.M.; Ward, T.J. Fusarium Mycotoxins: A Trans-Disciplinary Overview. Can. J. Plant Pathol. 2018, 40, 161–171. [Google Scholar] [CrossRef]
  2. Inbaia, S.; Farooqi, A.; Ray, R. V Aggressiveness and Mycotoxin Profile of Fusarium Avenaceum Isolates Causing Fusarium Seedling Blight and Fusarium Head Blight in UK Malting Barley. Front. Plant Sci. 2023, 14, 1121553. [Google Scholar] [CrossRef] [PubMed]
  3. Wang, L.Y.; Xie, Y.S.; Cui, Y.Y.; Xu, J.; He, W.; Chen, H.G.; Guo, J.H. Conjunctively Screening of Biocontrol Agents (BCAs) against Fusarium Root Rot and Fusarium Head Blight Caused by Fusarium Graminearum. Microbiol. Res. 2015, 177, 34–42. [Google Scholar] [CrossRef]
  4. Moonjely, S.; Ebert, M.; Paton-Glassbrook, D.; Noel, Z.A.; Roze, L.; Shay, R.; Watkins, T.; Trail, F. Update on the State of Research to Manage Fusarium Head Blight. Fungal Genet. Biol. 2023, 169, 103829. [Google Scholar] [CrossRef] [PubMed]
  5. Perincherry, L.; Lalak-Kanczugowska, J.; Stepien, L. Fusarium-Produced Mycotoxins in Plant-Pathogen Interactions. Toxins 2019, 11, 664. [Google Scholar] [CrossRef] [PubMed]
  6. Torres, A.M.; Palacios, S.A.; Yerkovich, N.; Palazzini, J.M.; Battilani, P.; Leslie, J.F.; Logrieco, A.F.; Chulze, S.N. Fusarium Head Blight and Mycotoxins in Wheat: Prevention and Control Strategies across the Food Chain. World Mycotoxin J. 2019, 12, 333–355. [Google Scholar] [CrossRef]
  7. Smaoui, S.; Agriopoulou, S.; D’Amore, T.; Tavares, L.; Mousavi Khaneghah, A. The Control of Fusarium Growth and Decontamination of Produced Mycotoxins by Lactic Acid Bacteria. Crit. Rev. Food Sci. Nutr. 2022, 63, 11125–11152. [Google Scholar] [CrossRef]
  8. Homa, K.; Barney, W.P.; Davis, W.P.; Guerrero, D.; Berger, M.J.; Lopez, J.L.; Wyenandt, C.A.; Simon, J.E. Cold Plasma Treatment Strategies for the Control of Fusarium oxysporum f. sp. basilici in Sweet Basil. HortScience 2021, 56, 42–51. [Google Scholar] [CrossRef]
  9. Filho, F.O.; de Oliveira Silva, E.; de Almeida Lopes, M.M.; Ribeiro, P.R.V.; Oster, A.H.; Guedes, J.A.C.; de Souza Zampieri, D.; do Nascimento Bordallo, P.; Zocolo, G.J. Effect of Pulsed Light on Postharvest Disease Control-Related Metabolomic Variation in Melon (Cucumis Melo) Artificially Inoculated with Fusarium Pallidoroseum. PLoS ONE 2020, 15, e0220097. [Google Scholar] [CrossRef] [PubMed]
  10. Zuluaga-Calderón, B.; González, H.H.L.; Alzamora, S.M.; Coronel, M.B. Multi-Step Ozone Treatments of Malting Barley: Effect on the Incidence of Fusarium Graminearum and Grain Germination Parameters. Innov. Food Sci. Emerg. Technol. 2023, 83, 103219. [Google Scholar] [CrossRef]
  11. Bevilacqua, A.; Sinigaglia, M.; Corbo, M.R. Ultrasound and Antimicrobial Compounds: A Suitable Way to Control Fusarium Oxysporum in Juices. Food Bioprocess Technol. 2013, 6, 1153–1163. [Google Scholar] [CrossRef]
  12. Evrendilek, G.A.; Karatas, B.; Uzuner, S.; Tanasov, I. Design and Effectiveness of Pulsed Electric Fields towards Seed Disinfection. J. Sci. Food Agric. 2019, 99, 3475–3480. [Google Scholar] [CrossRef]
  13. Han, Z.; Zeng, X.A.; Zhang, B.S.; Yu, S.J. Effects of Pulsed Electric Fields (PEF) Treatment on the Properties of Corn Starch. J. Food Eng. 2009, 93, 318–323. [Google Scholar] [CrossRef]
  14. García, D.; Gómez, N.; Mañas, P.; Raso, J.; Pagán, R. Pulsed Electric Fields Cause Bacterial Envelopes Permeabilization Depending on the Treatment Intensity, the Treatment Medium PH and the Microorganism Investigated. Int. J. Food Microbiol. 2007, 113, 219–227. [Google Scholar] [CrossRef] [PubMed]
  15. Castro, A.J.; Barbosa-Cánovas, G.V.; Swanson, B.G. Microbial Inactivation of Foods by Pulsed Electric Fields. J. Food Process. Preserv. 1993, 17, 47–73. [Google Scholar] [CrossRef]
  16. Barbosa-Cánovas, G.V.; Altunakar, B. Pulsed Electric Fields Processing of Foods: An Overview. In Pulsed Electric Fields Technology for the Food Industry; Raso, J., Heinz, V., Eds.; Springer: Boston, MA, USA, 2006; pp. 3–26. ISBN 978-0-387-31122-7. [Google Scholar]
  17. Toepfl, S.; Heinz, V.; Knorr, D. High Intensity Pulsed Electric Fields Applied for Food Preservation. Chem. Eng. Process. Process Intensif. 2007, 46, 537–546. [Google Scholar] [CrossRef]
  18. Zhong, C.; Guan, X.; Fan, Z.; Song, W.; Chen, R.; Wang, Y.; Sun, X.; He, S. Pulsed Electric Field Disinfection Treatment of Fusarium Oxysporum in Nutrient Solution. Water Sci. Technol. Water Supply 2019, 19, 2116–2122. [Google Scholar] [CrossRef]
  19. Palicova, J.; Chrpova, J.; Tobolkova, A.; Ovesna, J.; Stranska, M. Effect of Pulsed Electric Field on Viability of Fusarium Micromycetes. Cereal Res. Commun. 2024. [Google Scholar] [CrossRef]
  20. Stranska, M.; Prusova, N.; Behner, A.; Dzuman, Z.; Lazarek, M.; Tobolkova, A.; Chrpova, J.; Hajslova, J. Influence of Pulsed Electric Field Treatment on the Fate of Fusarium and Alternaria Mycotoxins Present in Malting Barley. Food Control 2023, 145, 109440. [Google Scholar] [CrossRef]
  21. Triba, M.N.; Le Moyec, L.; Amathieu, R.; Goossens, C.; Bouchemal, N.; Nahon, P.; Rutledge, D.N.; Savarin, P. PLS/OPLS Models in Metabolomics: The Impact of Permutation of Dataset Rows on the K-Fold Cross-Validation Quality Parameters. Mol. Biosyst. 2015, 11, 13–19. [Google Scholar] [CrossRef]
  22. Schmid, R.; Heuckeroth, S.; Korf, A.; Smirnov, A.; Myers, O.; Dyrlund, T.S.; Bushuiev, R.; Murray, K.J.; Hoffmann, N.; Lu, M.; et al. Integrative Analysis of Multimodal Mass Spectrometry Data in MZmine 3. Nat. Biotechnol. 2023, 41, 447–449. [Google Scholar] [CrossRef] [PubMed]
  23. Tsugawa, H.; Ikeda, K.; Takahashi, M.; Satoh, A.; Mori, Y.; Uchino, H.; Okahashi, N.; Yamada, Y.; Tada, I.; Bonini, P.; et al. A Lipidome Atlas in MS-DIAL 4. Nat. Biotechnol. 2020, 38, 1159–1163. [Google Scholar] [CrossRef] [PubMed]
  24. Kvasnička, A.; Najdekr, L.; Dobešová, D.; Piskláková, B.; Ivanovová, E.; Friedecký, D. Clinical Lipidomics in the Era of the Big Data. Clin. Chem. Lab. Med. 2023, 61, 587–598. [Google Scholar] [CrossRef]
  25. Castillo, S.; Gopalacharyulu, P.; Yetukuri, L.; Orešič, M. Algorithms and Tools for the Preprocessing of LC-MS Metabolomics Data. Chemom. Intell. Lab. Syst. 2011, 108, 23–32. [Google Scholar] [CrossRef]
  26. Tsugawa, H.; Kind, T.; Nakabayashi, R.; Yukihira, D.; Tanaka, W.; Cajka, T.; Saito, K.; Fiehn, O.; Arita, M. Hydrogen Rearrangement Rules: Computational MS/MS Fragmentation and Structure Elucidation Using MS-FINDER Software. Anal. Chem. 2016, 88, 7946–7958. [Google Scholar] [CrossRef]
  27. Dührkop, K.; Fleischauer, M.; Ludwig, M.; Aksenov, A.A.; Melnik, A.V.; Meusel, M.; Dorrestein, P.C.; Rousu, J.; Böcker, S. SIRIUS 4: A Rapid Tool for Turning Tandem Mass Spectra into Metabolite Structure Information. Nat. Methods 2019, 16, 299–302. [Google Scholar] [CrossRef] [PubMed]
  28. Fraisier-Vannier, O.; Chervin, J.; Cabanac, G.; Puech, V.; Fournier, S.; Durand, V.; Amiel, A.; André, O.; Benamar, O.A.; Dumas, B.; et al. MS-CleanR: A Feature-Filtering Workflow for Untargeted LC-MS Based Metabolomics. Anal. Chem. 2020, 92, 9971–9981. [Google Scholar] [CrossRef]
  29. Klåvus, A.; Kokla, M.; Noerman, S.; Koistinen, V.M.; Tuomainen, M.; Zarei, I.; Meuronen, T.; Häkkinen, M.R.; Rummukainen, S.; Babu, A.F.; et al. “Notame”: Workflow for Non-Targeted LC-MS Metabolic Profiling. Metabolites 2020, 10, 135. [Google Scholar] [CrossRef]
  30. Yonemoto, Y.; Yamashita, T.; Muraji, M.; Tatebe, W.; Ooshima, H.; Kato, J.; Kimura, A.; Murata, K. Resistance of Yeast and Bacterial Spores to High Voltage Electric Pulses. J. Ferment. Bioeng. 1993, 75, 99–102. [Google Scholar] [CrossRef]
  31. Qiu, X.; Chang, J.; Jin, Y.; Wu, W.J. Pulsed Electric Field Treatments with Nonlethal Field Strength Alter the Properties of Bacterial Spores. J. Food Prot. 2022, 85, 1053–1060. [Google Scholar] [CrossRef]
  32. Palmero Llamas, D.; De Cara Gonzalez, M.; Iglesias Gonzalez, C.; Ruíz Lopez, G.; Tello Marquina, J.C. Effects of Water Potential on Spore Germination and Viability of Fusarium Species. J. Ind. Microbiol. Biotechnol. 2008, 35, 1411–1418. [Google Scholar] [CrossRef] [PubMed]
  33. Song, Y.; Li, Q.; Liu, X.; Chen, Y.; Zhang, Y.; Sun, A.; Zhang, W.; Zhang, J.; Ju, J. Cyclic Hexapeptides from the Deep South China Sea-Derived Streptomyces Scopuliridis SCSIO ZJ46 Active against Pathogenic Gram-Positive Bacteria. J. Nat. Prod. 2014, 77, 1937–1941. [Google Scholar] [CrossRef] [PubMed]
  34. Volchegursky, Y.; Hu, Z.; Katz, L.; McDaniel, R. Biosynthesis of the Antiparasitic Agent Megalomicin: Transformation of Erythromycin to Megalomicin in Saccharopolyspora Erythraea. Mol. Microbiol. 2000, 37, 752–762. [Google Scholar] [CrossRef] [PubMed]
  35. Smedsgaard, J.; Nielsen, J. Metabolite Profiling of Fungi and Yeast: From Phenotype to Metabolome by MS and Informatics. J. Exp. Bot. 2005, 56, 273–286. [Google Scholar] [CrossRef]
  36. Šíp, V.; Stuchlíková, E. Evaluation of the Response of Selected Winter Wheat Cultivars to Artificial Infection with Fusarium Culmorum in Field Conditions. Czech J. Genet. Plant Breed. 2000, 36, 49–58. [Google Scholar]
  37. Prusova, N.; Karabin, M.; Jelinek, L.; Chrpova, J.; Ovesna, J.; Svoboda, P.; Dolezalova, T.; Behner, A.; Hajslova, J.; Stranska, M. Application of Pulsed Electric Field During Malting: Impact on Fusarium Species Growth and Mycotoxin Production. Toxins 2024, 16, 537. [Google Scholar] [CrossRef] [PubMed]
  38. Stranska, M.; Uttl, L.; Bechynska, K.; Hurkova, K.; Behner, A.; Hajslova, J. Metabolomic Fingerprinting as a Tool for Authentication of Grapevine (Vitis vinifera L.) Biomass Used in Food Production. Food Chem. 2021, 361, 130166. [Google Scholar] [CrossRef]
  39. Dzuman, Z.; Zachariasova, M.; Lacina, O.; Veprikova, Z.; Slavikova, P.; Hajslova, J. A Rugged High-Throughput Analytical Approach for the Determination and Quantification of Multiple Mycotoxins in Complex Feed Matrices. Talanta 2014, 121, 263–272. [Google Scholar] [CrossRef] [PubMed]
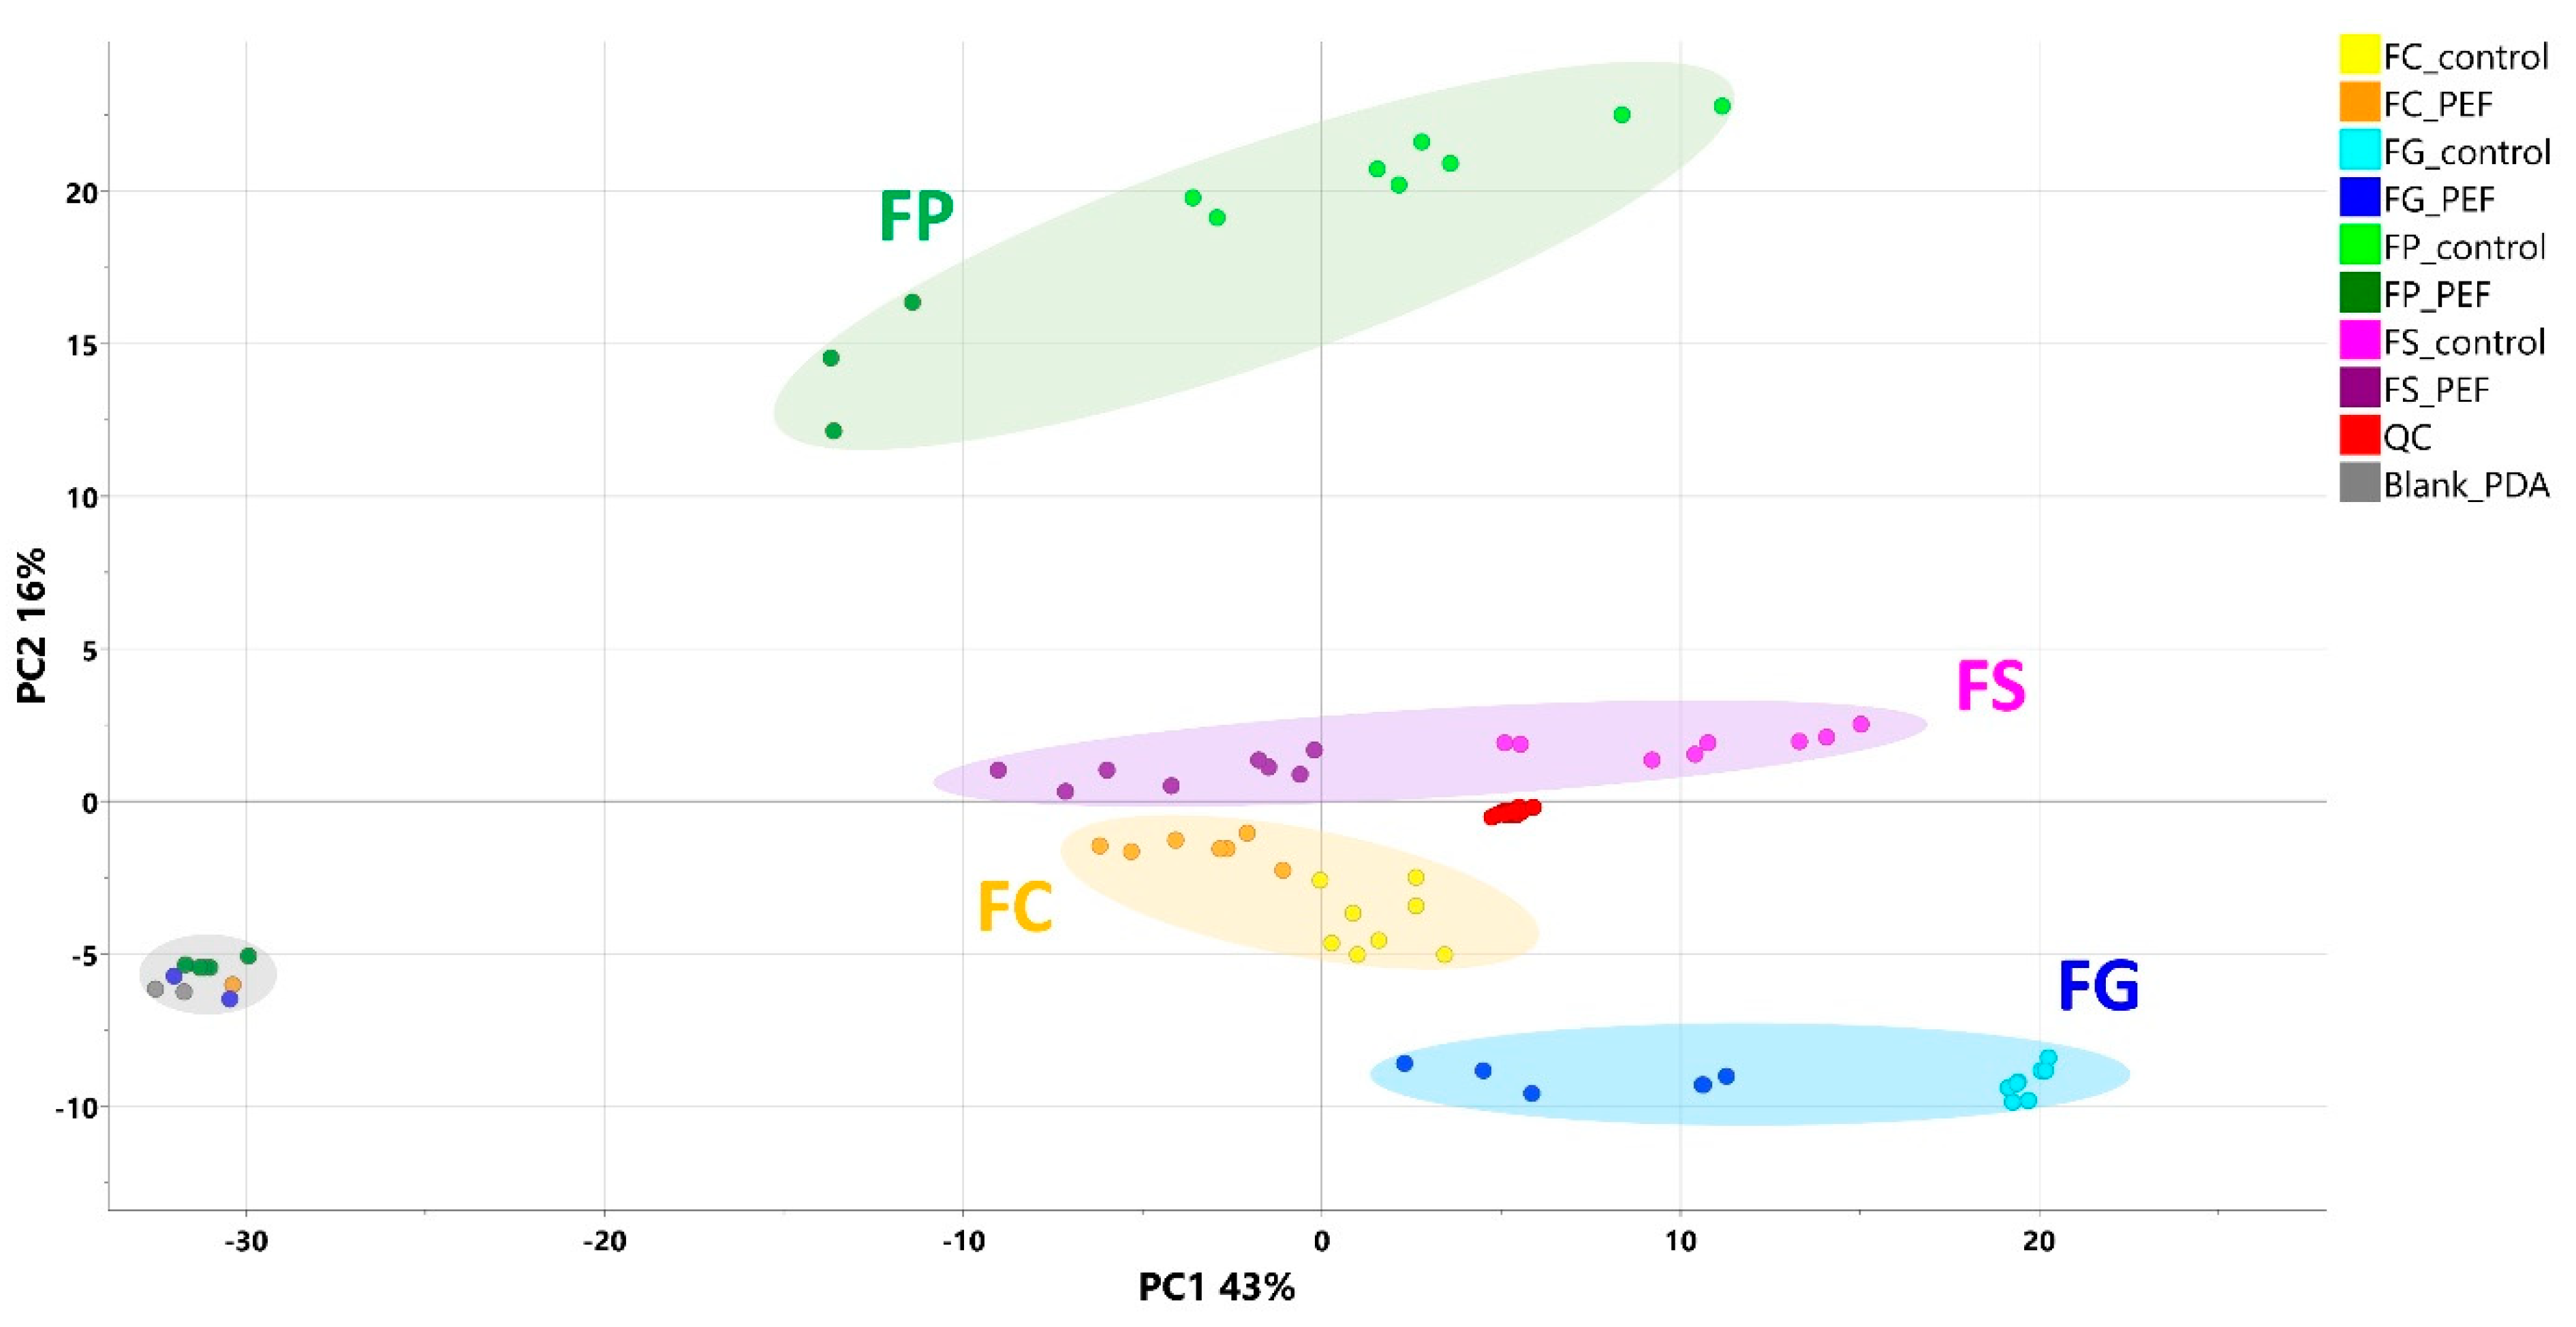
Figure 1. PCA (score scatter plot) including all samples (FC—F. culmorum; FG—F. graminearum; FP—F. poae; FS—F. sporotrichioides) colored according to the particular experimental conditions. Excluded PEF-treated samples are grouped with the “PDA blank” samples represented by gray dots in the left part of the plot.
Toxins 17 00033 g001
Figure 2. PCA (score scatter plots) of each Fusarium species dataset (FC—F. culmorum; FG—F. graminearum; FP—F. poae; FS—F. sporotrichioides) colored according to the particular experimental conditions.
Toxins 17 00033 g002
Figure 3. Selection of statistically significant features using VIP + ROC filters illustrated in the OPLS-DA S-plot.
Toxins 17 00033 g003
Figure 4. The extracted ion chromatograms (XICs) (A), match of experimental vs. in silico MS/MS spectra with chemical structures of fragments colored green (B), and boxplots before statistical analysis (C) of unique PEF-related biomarkers Compound1 (1), Desotamide D (2), Megalomicin C1 (3), Compound2 (4), Compound3 (5), and Compound4 (6). Tentative identifications and intensity trends of these biomarkers are presented in the FG and FP datasets. 1 2-((3-(((2,3-dihydroxypropoxy)(hydroxy)phosphoryl)oxy)-2-hydroxypropoxy)(hydroxy)methyl)hexadecanoic acid. 2 13-(hydroxymethyl)-19,19-dimethyl-3-(2-phenylethyl)-12-(propan-2-yl)-23-(propan-2-ylidene)-6,10,18,21-tetraoxapentacyclo[24.2.2.07,20.08,17.09,14]triaconta-1(28),8,12,14,16,26,29-heptaene-5,11,22-trione. 3 [8-acetyl-12-(1-hydroxyethyl)-4,5-dimethoxy-14-methyl-17-oxo-8,14-diazatetracyclo[9.5.2.0¹,⁹.0²,⁷]octadeca-2(7),3,5,12-tetraen-10-yl]methyl acetate. 4 1-[N′-[6-[[amino-[[N′-(2-hydroxyethyl)amidino]amino]methylene]amino]hexyl]amidino]-2-(2-hydroxyethyl)guanidine.
Toxins 17 00033 g004
Figure 5. Boxplots demonstrating the distribution of mycotoxin (diacetoxyscirpenol (DAS), deoxynivalenol (DON), neosolaniol (NEO), and zearalenone (ZEA)) abundance in PDA plates with fungi (FC—F. culmorum; FG—F. graminearum; FP—F. poae; FS—F. sporotrichioides) only with significant decreases after PEF treatment. Significance was statistically tested using the Wilcoxon rank-sum test (p-value < 0.1). Red boxplots represent control samples, and green boxplots represent PEF-treated samples. The black dots in the boxplot represent each sample and the yellow square represents the average.
Toxins 17 00033 g005
Table 1. Number of metabolomic features according to their polarity gained from UHPLC-HRMS/MS records of various extraction solvents and their mixtures. Electrospray ionization in positive (ESI+) and negative (ESI-) polarity.
Polarity of FeaturesExtraction Solvent/Solvent MixturesNumber of Features
ESI+ESI-SUM.
Polar
(0–6 min Rt)
water417929627141
methanol/water (50:50, v/v)582241659987
methanol6208417910,387
methanol/propan-2-ol (50:50, v/v)579037989588
Middle-polar
(6–12 min Rt)
water15171971714
methanol/water (50:50, v/v)11911781369
methanol446612855751
methanol/propan-2-ol (50:50, v/v)473812726010
Nonpolar
(12–19 min Rt)
water1416151431
methanol/water (50:50, v/v)8999908
methanol1435101445
methanol/propan-2-ol (50:50, v/v)24801492629
Table 2. PEF-related biomarkers co-occurring in at least two Fusarium species (sorted according to overlays between each dataset: FC, FG, FP, FS).
Dataset
Overlays
MS/MS spec. Match Score *TrendStructureOntologyInChIKey
Chemical Structure
FG ∩ FP ∩ FS1PEFCompound 1Oxidized long-chain fatty acid derivativesIGLRXLRPYYHFQN-UHFFFAOYSA-N
Toxins 17 00033 i001
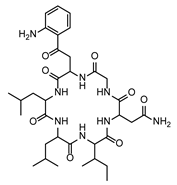
FG ∩ FP3PEFDesotamide DCyclic hexapeptidesLZYIIJVZWQGRJH-CBHSLMNUSA-N
Toxins 17 00033 i002
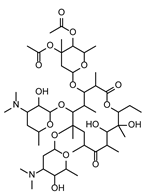
FP ∩ FS1PEFMegalomicin C1MacrolidesNGOSGEYHKQYUTN-XIBKBKGSSA-N
Toxins 17 00033 i003
FG ∩ FS1PEFCompound 2Angular pyranocoumarinsPRZGTCWIDNLJEN-UHFFFAOYSA-N
Toxins 17 00033 i004
FG ∩ FS2PEFCompound 3CarbazolesCBMRXUBLKLUUQW-CHRKOGDLNA-N
Toxins 17 00033 i005
FG ∩ FS3PEFCompound 4GuanidinesYMMKPCXKLMUKEC-UHFFFAOYSA-N
Toxins 17 00033 i006
* MS/MS spectrum match score: “0” = no fragments, “1” = only one fragment referring to pseudomolecular ion, “2” = one fragment, “3” = two or more fragments. 1 2-((3-(((2,3-dihydroxypropoxy)(hydroxy)phosphoryl)oxy)-2-hydroxypropoxy)(hydroxy)methyl)hexadecanoic acid. 2 13-(hydroxymethyl)-19,19-dimethyl-3-(2-phenylethyl)-12-(propan-2-yl)-23-(propan-2-ylidene)-6,10,18,21-tetraoxapentacyclo [24.2.2.07,20.08,17.09,14]triaconta-1(28),8,12,14,16,26,29-heptaene-5,11,22-trione. 3 [8-acetyl-12-(1-hydroxyethyl)-4,5-dimethoxy-14-methyl-17-oxo-8,14-diazatetracyclo[9.5.2.0¹,⁹.0²,⁷]octadeca-2(7),3,5,12-tetraen-10-yl]methyl acetate. 4 1-[N′-[6-[[amino-[[N′-(2-hydroxyethyl)amidino]amino]methylene]amino]hexyl]amidino]-2-(2-hydroxyethyl)guanidine.
Disclaimer/Publisher’s Note: The statements, opinions and data contained in all publications are solely those of the individual author(s) and contributor(s) and not of MDPI and/or the editor(s). MDPI and/or the editor(s) disclaim responsibility for any injury to people or property resulting from any ideas, methods, instructions or products referred to in the content.