Article

Real-Time CO2 Production Monitoring in Stored Oats as an Indicator of Type A Trichothecenes and Ochratoxin A Contamination Under Simulated Environmental Conditions

1
Magan Centre of Applied Mycology, Cranfield University, College Rd. Wharley End, Bedford MK43 0AL, UK
2
Institute of Bioanalytics and Agro-Metabolomics, Department of Agricultural Sciences, BOKU University, Konrad-Lorenz, Str. 20, 3430 Tulln, Austria
3
Institute for Global Food Security, National Measurement Laboratory, Centre of Excellence in Agriculture and Food Integrity, Queen’s University Belfast, 19 Chlorine Gardens, Belfast BT9 5DL, UK
*
Author to whom correspondence should be addressed.
Toxins 2025, 17(3), 132; https://doi.org/10.3390/toxins17030132
Submission received: 22 January 2025 / Revised: 4 March 2025 / Accepted: 7 March 2025 / Published: 11 March 2025

Abstract

:
Grain industries are interested in an integrated approach to in-silo grain quality and safety management using carbon dioxide (CO2) measurement with temperature and moisture monitoring. Our study investigates if CO2 production could predict mycotoxin production (T-2 toxin, HT-2 toxin, its glucoside, and ochratoxin A (OTA)) and identify storage conditions exceeding legislative limits in stored oats for the first time. The influence of water activity (aw) levels (0.70–0.95 aw), temperature (15 and 20 °C), and storage duration on (a) Fusarium populations, (b) CO2 respiration rates (RRs), and (c) mycotoxin concentrations in stored oats was examined. One hundred and twenty samples were analysed for multiple mycotoxins by LC-MS/MS. Substantial differences were found in the RRs of oats at ≥0.90 aw at both temperatures. A moderate positive correlation between CO2 and mycotoxins was noticed and mycotoxins exceeded their limits at ≥0.90 aw (22% moisture content) when RR ≥ 25 µg CO2 kg−1 h−1. This knowledge forms the basis for developing decision support systems for improving oats’ storage management.
Key Contribution: This article investigates for the first time if real-time respiration rates in stored oats can predict the risks of type A trichothecenes and OTA contamination exceeding legislative limits.

1. Introduction

Oats (Avena sativa L.) are significant cereal crops highly valued for their dietary benefits and growing market demand with the global oat market projected to reach USD 10.8 billion by 2032 [1]. It is well suited to cooler environments, requiring an optimal temperature range of 15–25 °C and moist conditions [2]. However, post-harvest losses due to spoilage, primarily caused by moulds and consecutive mycotoxin contamination, remain a significant challenge affecting around 14% of food produced globally [3]. Mycotoxins are toxic compounds produced by certain fungi under specific environmental conditions. The accumulation of mycotoxins in oats poses both economic concerns and health risks [4].
Fungal species such as Fusarium, Penicillium, and Aspergillus are commonly linked to oat spoilage and diseases, including Fusarium head blight [5,6,7,8,9]. These moulds thrive in warm and humid storage conditions and reduce the quality and quantity of grains by producing harmful mycotoxins. Fusarium langsethiae is an important Fusarium species found in oats [10] producing type A trichothecenes (T-2/HT-2 toxins). Other fungal genera produce ochratoxin A (OTA), deoxynivalenol (DON), and fumonisins [11,12].
Plants can metabolise T-2 and HT-2 produced by Fusarium species to modified forms such as HT-2-glucoside or T-2-glucoside, among others [13]. These modified forms are considered less toxic but can be converted back to their native form to regain their toxicity in the mammalian digestive tract [14].
To minimise the risks of mycotoxins, various countries and international organisations have established regulations and guidelines to control mycotoxin levels in food and feed. These regulations aim to ensure food safety and protect consumer health by setting maximum permissible levels of mycotoxins in various commodities. In the European Union, the maximum level for the sum of T-2 + HT-2 in unprocessed oats with inedible husks was enforced in 2024 and is 1250 μg/kg [15].
Respiration in stored cereal grains is the metabolic process of breaking down stored carbohydrates, such as starch, into simpler compounds like carbon dioxide (CO₂) and water, releasing energy [16]. This process is influenced by abiotic components (such as moisture and temperature), oxygen availability, and grain condition in storage [17]. Therefore, CO2 produced in a stored grain mass is due to the respiration of the grains and the biotic factors present such as microorganisms and insects. Many studies have discussed the impact of abiotic factors on the growth and mycotoxin production of Fusarium species [18,19,20].
As the moisture content (MC) rises in the grain silo, so does the temperature. The temperature of the external environment affects the silo wall, leading to condensation within the silo when the temperature decreases. This, in turn, increases the moisture content in the grains, causing them to respire and elevating the temperature inside the silo, ultimately resulting in grain spoilage. The movement of moisture and CO2 concentrations within a bulk grain mass was described by Ramachandran et al. [21].
Due to the inter-relationship between MC, temperature, and gas produced in grain silos, it is important to adopt an integrated approach that combines the monitoring of moisture, temperature, and CO2 concentrations in stored grain to improve grain quality and safety in storage. Some studies have employed this approach [22,23,24,25]. However, these studies did not consider the relationship between these abiotic factors (MC × temperature × CO2) and mycotoxins produced in the grains. Mylona et al. [26] assessed fungal growth and dry matter loss (DML) with the amount of CO2 produced in stored irradiated wheat and maize under different interacting conditions of water activity (aw) and temperature. They reported increased respiration rates (RRs) as aw and temperature increased with varying production patterns of Fusarium species. However, gas measurements in the irradiated grains were conducted by gas chromatography (GC). This does not accurately reflect the real-time CO2 measurements of the natural mycobiota of non-irradiated grains. Garcia-Cela et al. [27] also reported that RRs and related DMLs can indicate the relative likelihood of mycotoxin contamination in natural and irradiated wheat grains. The RRs were also measured with GC, and the grain size (10 g) is considerably smaller compared to the study of Oluwakayode et al. [28]. They investigated the relationship between CO2 measurement with real-time CO2 sensors and ochratoxin concentrations produced in a mini silo of wheat grains under different aw and temperature conditions, and identified that RR increased as aw increased and OTA concentrations were highest at the wettest aw level (0.95 aw). They highlighted a positive correlation between the CO2 produced and OTA produced at the wettest storage conditions.
This study aims to investigate the relationship between the respiration rates, type A trichothecenes, and OTA concentrations in mini silos of oats under different interacting environmental factors. We wanted to determine if CO2 production could indicate the risk of these mycotoxin contaminations above legislative limits in stored oats.
The objectives are to investigate the effect of storage conditions (0.70, 0.90, and 0.95 aw at 15 and 20 °C) on (a) mycotoxigenic fungal populations, (b) CO2 RRs, and (c) the sum of T-2/HT-2 toxin + HT-2-glucoside and OTA produced in naturally contaminated oats, and (d) to examine the relationship between the CO2 and mycotoxins concentrations in contaminated oats.

2. Results

2.1. Fungal Populations and Isolations in Contaminated Oats

Table 1 and Table 2 show the mean values of the colony-forming units (CFUs) and the frequency of isolation of potentially mycotoxigenic fungal genera in oat treatments per media.
Fusarium populations were observed at 0.70 and 0.90 aw, while Penicillium populations were mostly present at all storage conditions (Table 1).
Aspergillus sect. Nigri and Aspergillus sect. Flavi were only present at 0.95 aw in the contaminated oats at 20 °C. A. sect. Nigri’s mean values are 5.9 ± 6.1 and 5.9 ± 6.0 on MEA+ and DG18+, respectively, while A. sect. Flavi’s mean values are 5.1 ± 5.3 and 5.2 ± 5.4 on MEA+ and DG18+, respectively.
Pictorial representations of fungal populations or isolations in the contaminated oats on MEA+ media at all aw levels at 15 °C are shown in Figure S1 in the Supplementary Materials.
Fusarium isolation was higher in DG18+ media than in MEA+ at 0.70 and 0.90 aw but absent in the 0.95 aw on DG18+ media. Of the potentially mycotoxigenic fungal strain, Penicillium was relatively abundant in the oats in both media and highest at 0.95 aw. Interestingly, Aspergillus species were relatively low under drier storage conditions but present at 0.95 aw, especially at 20 °C where Fusarium growth was least observed.

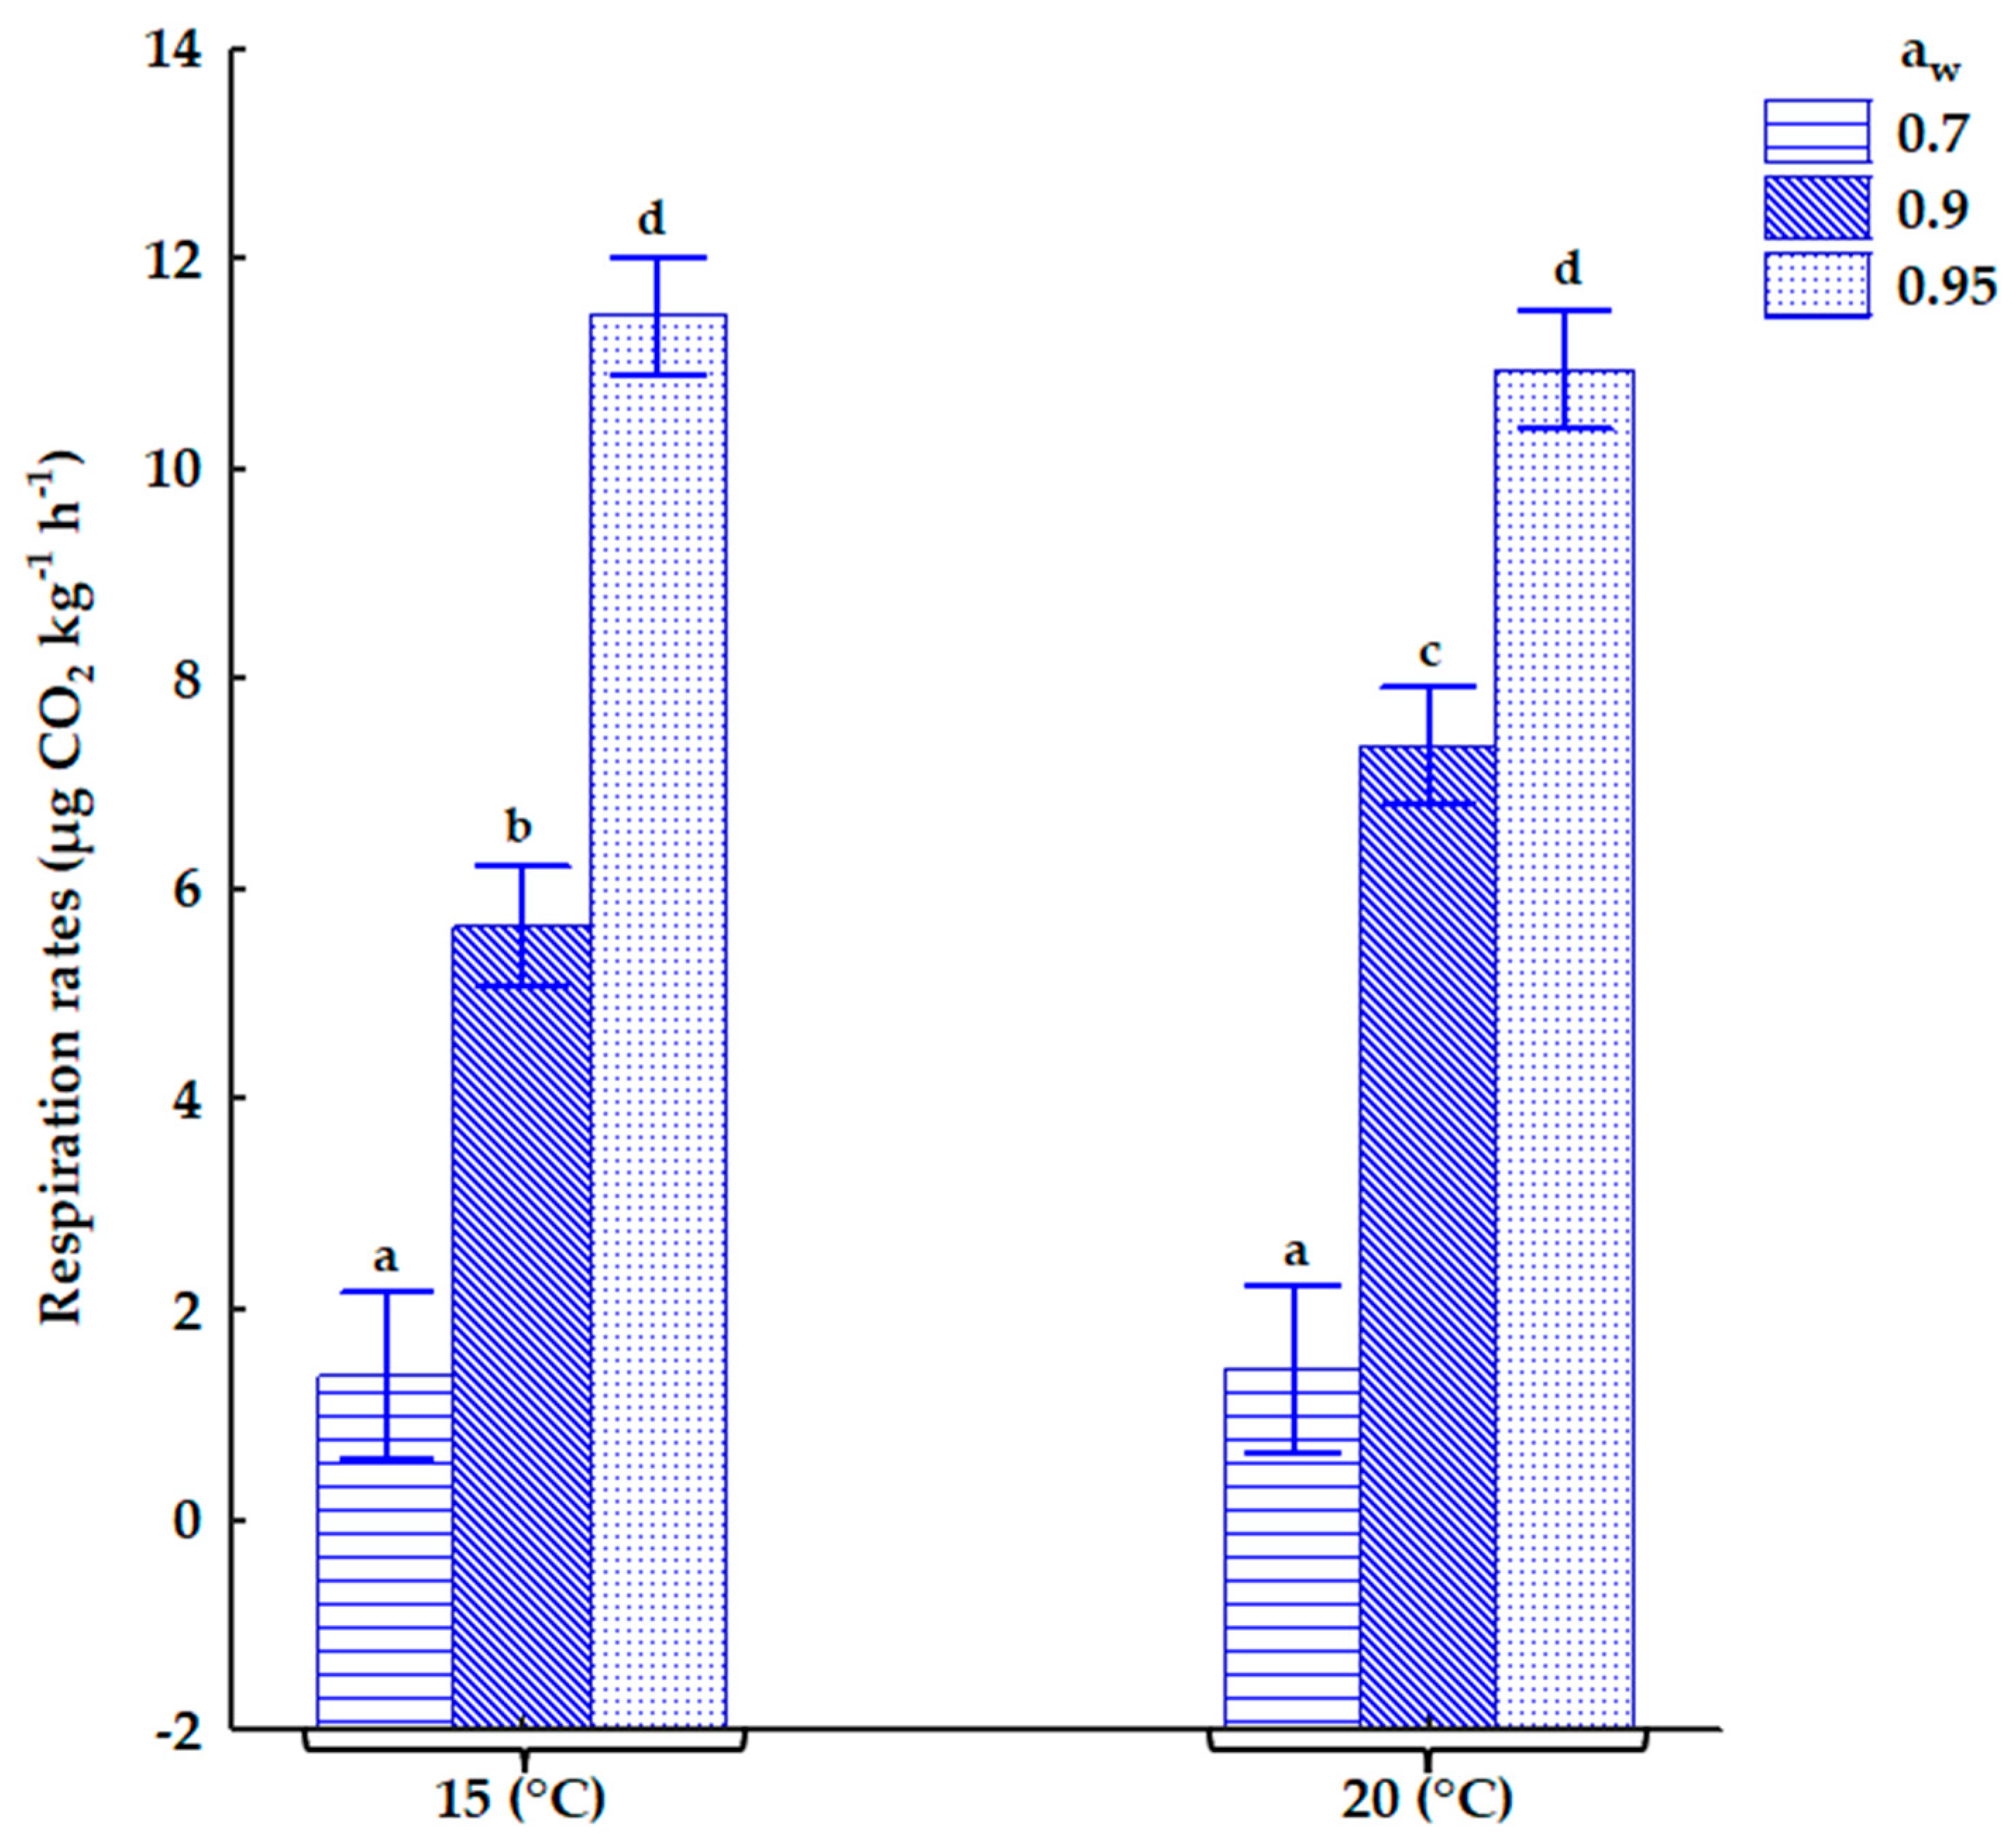
2.2. The Influence of Storage Conditions on Respiration Rates in Contaminated Oats

The RR increased significantly as the aw was increased in the stored oats (Figure 1). However, there were no significant differences in RRs between both temperatures for each aw except at 0.90 aw. An increase in storage days either as a single factor or its interactions with other conditions does not significantly impact RR. The interactions of aw × temperature significantly impact the RR in the stored oats as shown in Figure 1.
The mean values of RRs (µg CO2 kg−1 h−1) in contaminated oats at all storage conditions are shown in Table 3. The RR was more than four times higher under wetter conditions than at 0.70 aw at both temperatures.
Figure S2 in the Supplementary Materials shows the respiration rates produced at day 0, day 10, and day 20 for each aw and temperature.

2.3. Method Validation Performance and the Influence of Storage Conditions on Mycotoxin Concentrations in Contaminated Oats

2.3.1. Method Validation Performance in the Oat Matrix

The extraction efficiency (RE) of each analyte was within the acceptable range (70–120%) according to the amended guideline set by European Commission regulation No. 2021/808/EC [29]. The goodness of fit of the calibration curve for each analyte was acceptable, with r2 values (coefficient of determination) of >0.990. The relative standard deviation (RSD %) was satisfactory for the validated analytes <14% except for OTA (17%). The relative standard deviation of the within-laboratory reproducibility (RSDWLR), the matrix effect or the signal suppression/enhancement (SSE), and the apparent recovery (RA %) were calculated from the average of 48 replicates of the three different lots of oats spiked in quadruplicate across three separate days. The limit of detection (LOD) and limit of quantitation (LOQ) for the analytes ranged from 0.9–4.1 µg/kg and 2.9–13.6 µg/kg, respectively, which were lower than the minimum acceptable levels for the regulated mycotoxins in unprocessed oats [15,30]. The mean values of the RA, RE, RSD, LOD, and LOQ for each analyte are shown in Table 4.

2.3.2. The Influence of Storage Conditions on Mycotoxin Concentrations in the Naturally Contaminated Oats

In the naturally contaminated oats, the concentrations of the sum of T-2 + HT-2 including HT-2 glucoside were below the maximum limit (1250 μg/kg) at all storage conditions except at 0.90 and 0.95 aw at 20 °C on day 20 (Table 5). OTA levels were highest at 0.95 aw for both temperatures and increased significantly by 12% as aw rose from 0.90 to 0.95 aw.
The influence of the interactions of storage conditions on type A trichothecenes and OTA production in naturally contaminated oats is shown in Figure 2 below.
In Figure 2a, the Tukey HSD test shows that storage days significantly impacted T-2 concentrations (p = 0.0416) at 20 °C. aw as a single factor or its interaction with other storage conditions did not significantly impact T-2 concentrations.
HT-2 concentrations decreased significantly as temperature increased at 0.95 aw. However, HT-2 concentrations did not vary significantly across all aw levels at 15 °C (Figure 2b). Temperature and the interaction of aw × temperature significantly impacted HT-2 concentrations. Its concentrations decreased significantly as temperatures increased at 0.90 and 0.95 aw.
Figure 2c shows the interaction between aw × days on HT-2-Glc concentrations. There were no significant differences in its concentrations at each aw level on day 10. However, the concentrations of HT-2-Glc decreased significantly at 0.95 aw on day 20 (Figure 2c). Water activity, temperature, and storage days as single factors significantly impacted HT-2-Glc concentrations. Its concentrations in the contaminated oats increased as these factors increased.

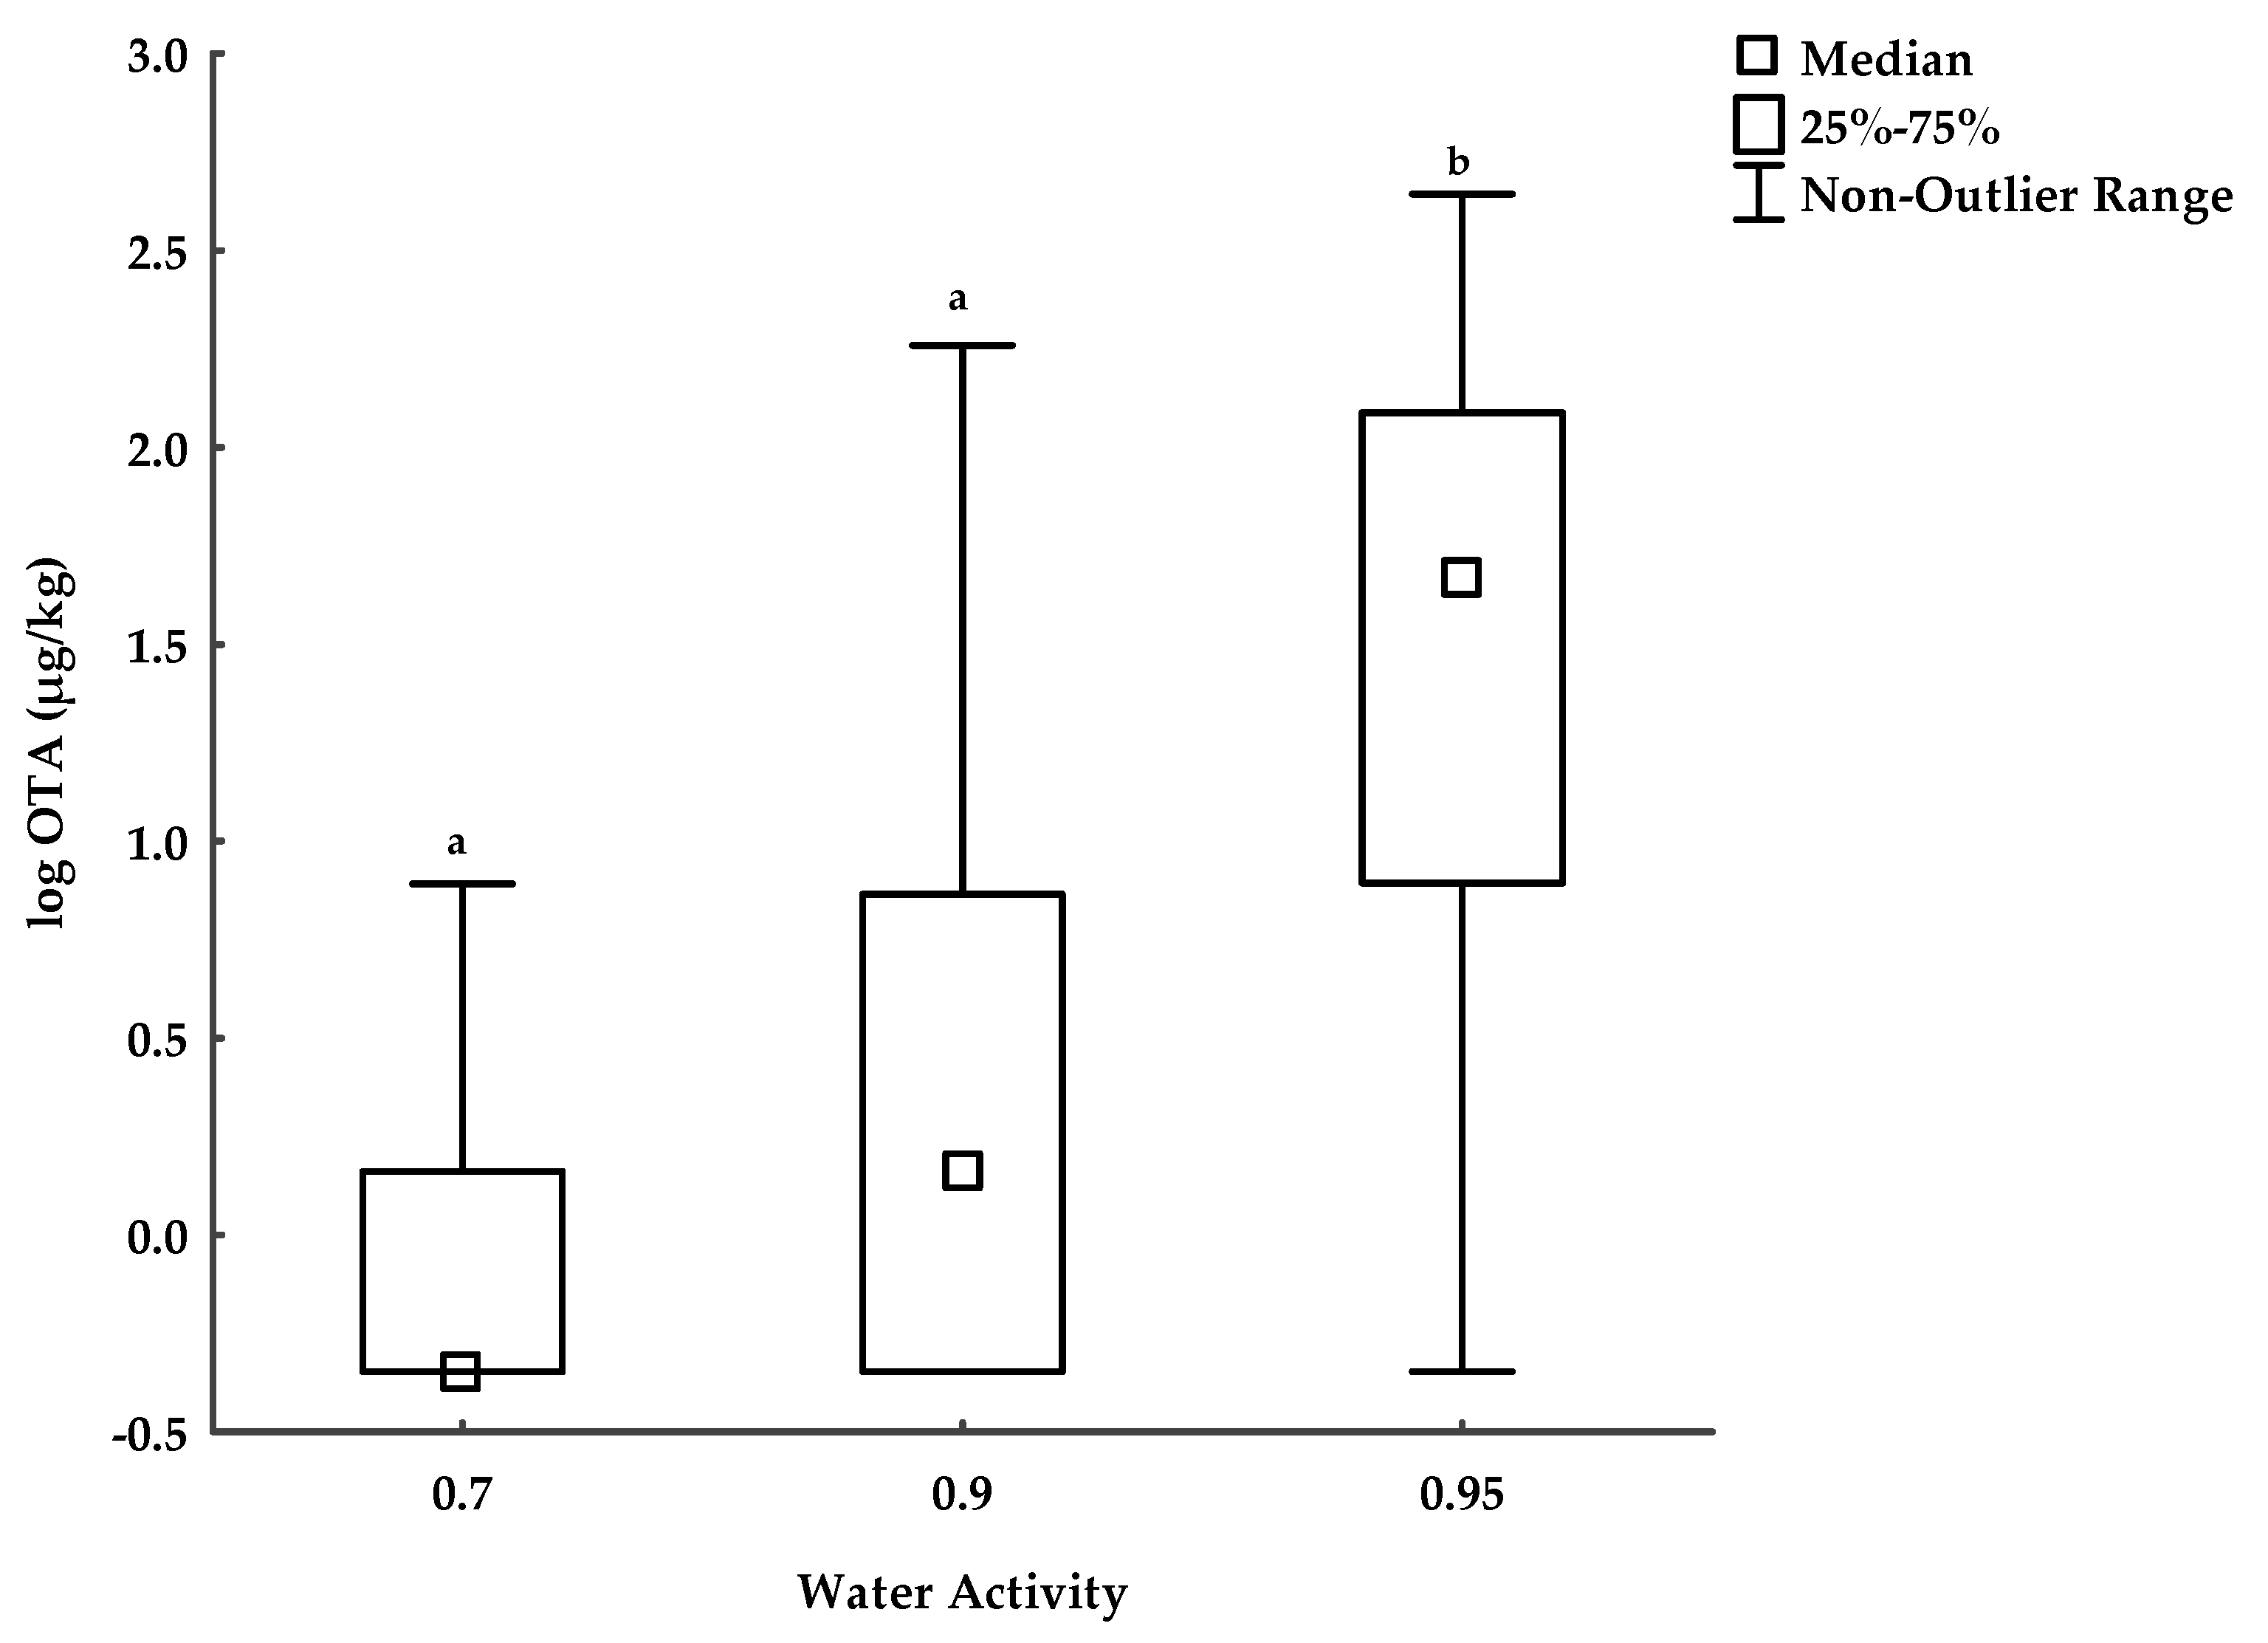
The Influence of Storage Conditions on OTA Concentrations in the Naturally Contaminated Oats

In Figure 3, the mean of the OTA concentrations was not significantly different between 0.70 and 0.90 aw. However, OTA concentrations significantly increased as aw reached 0.95 aw. Moreover, an increase in storage days significantly affected OTA concentrations only at 0.95 aw (see Table 5).

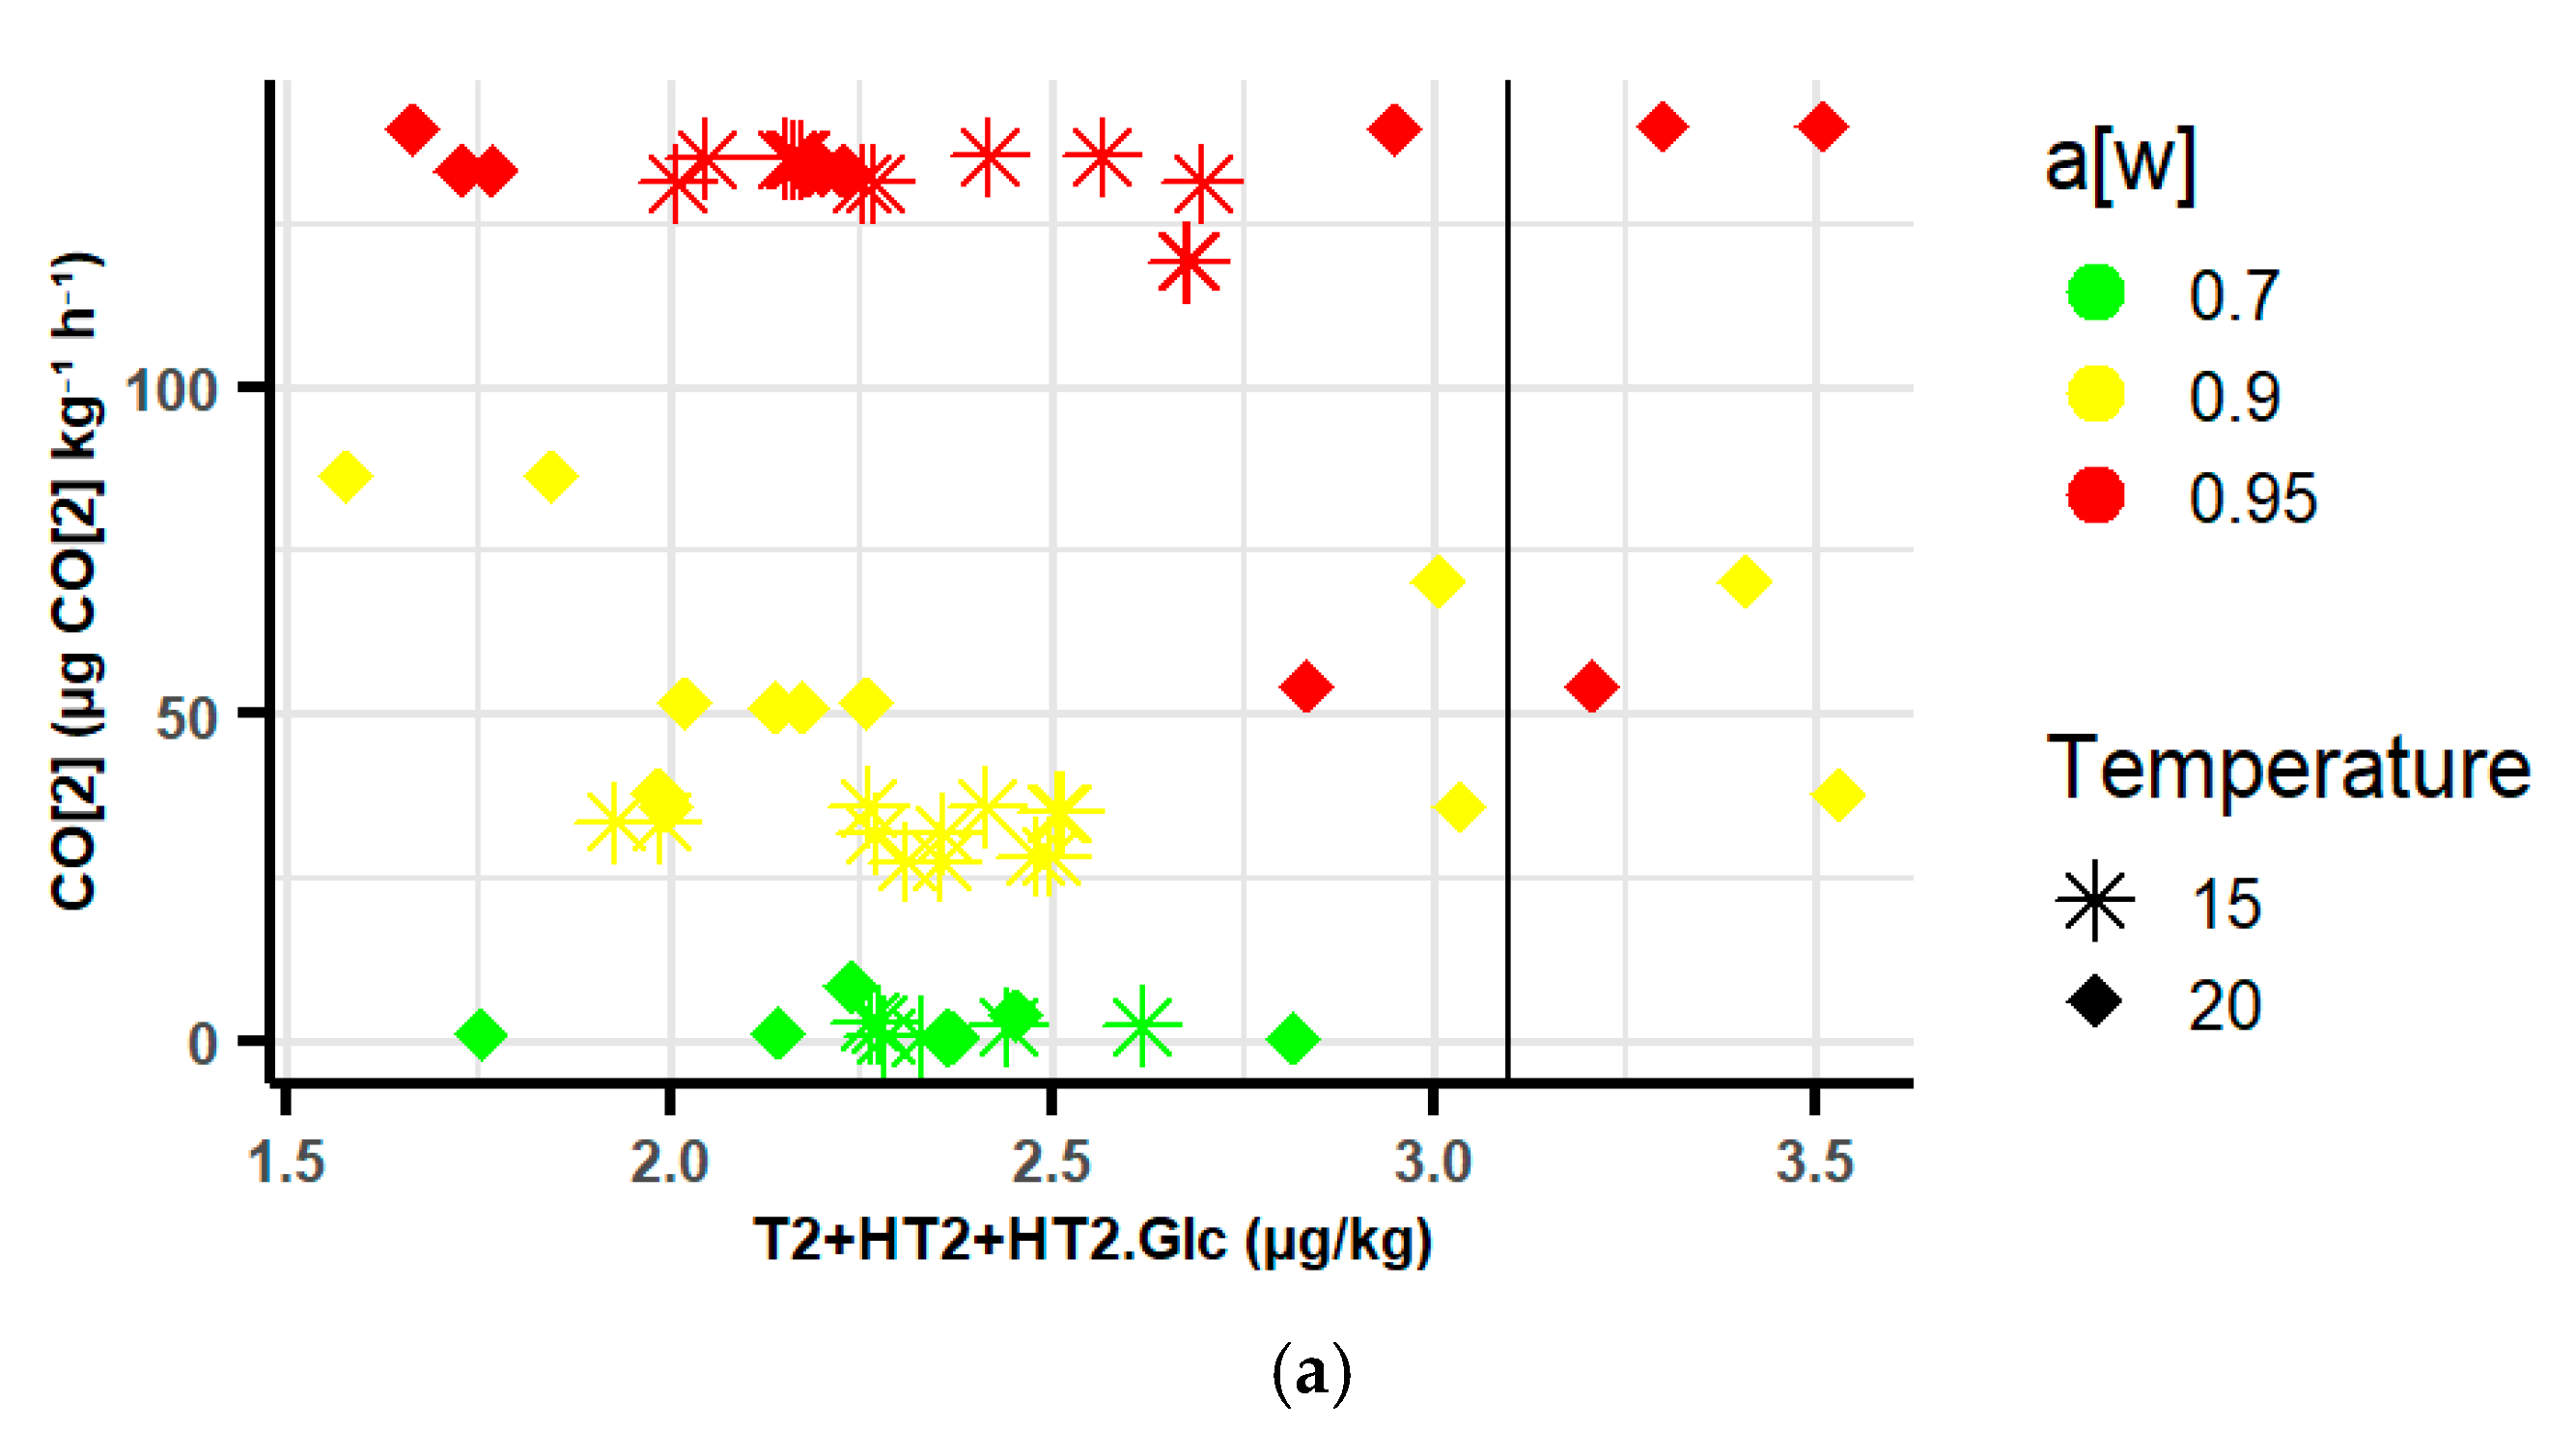
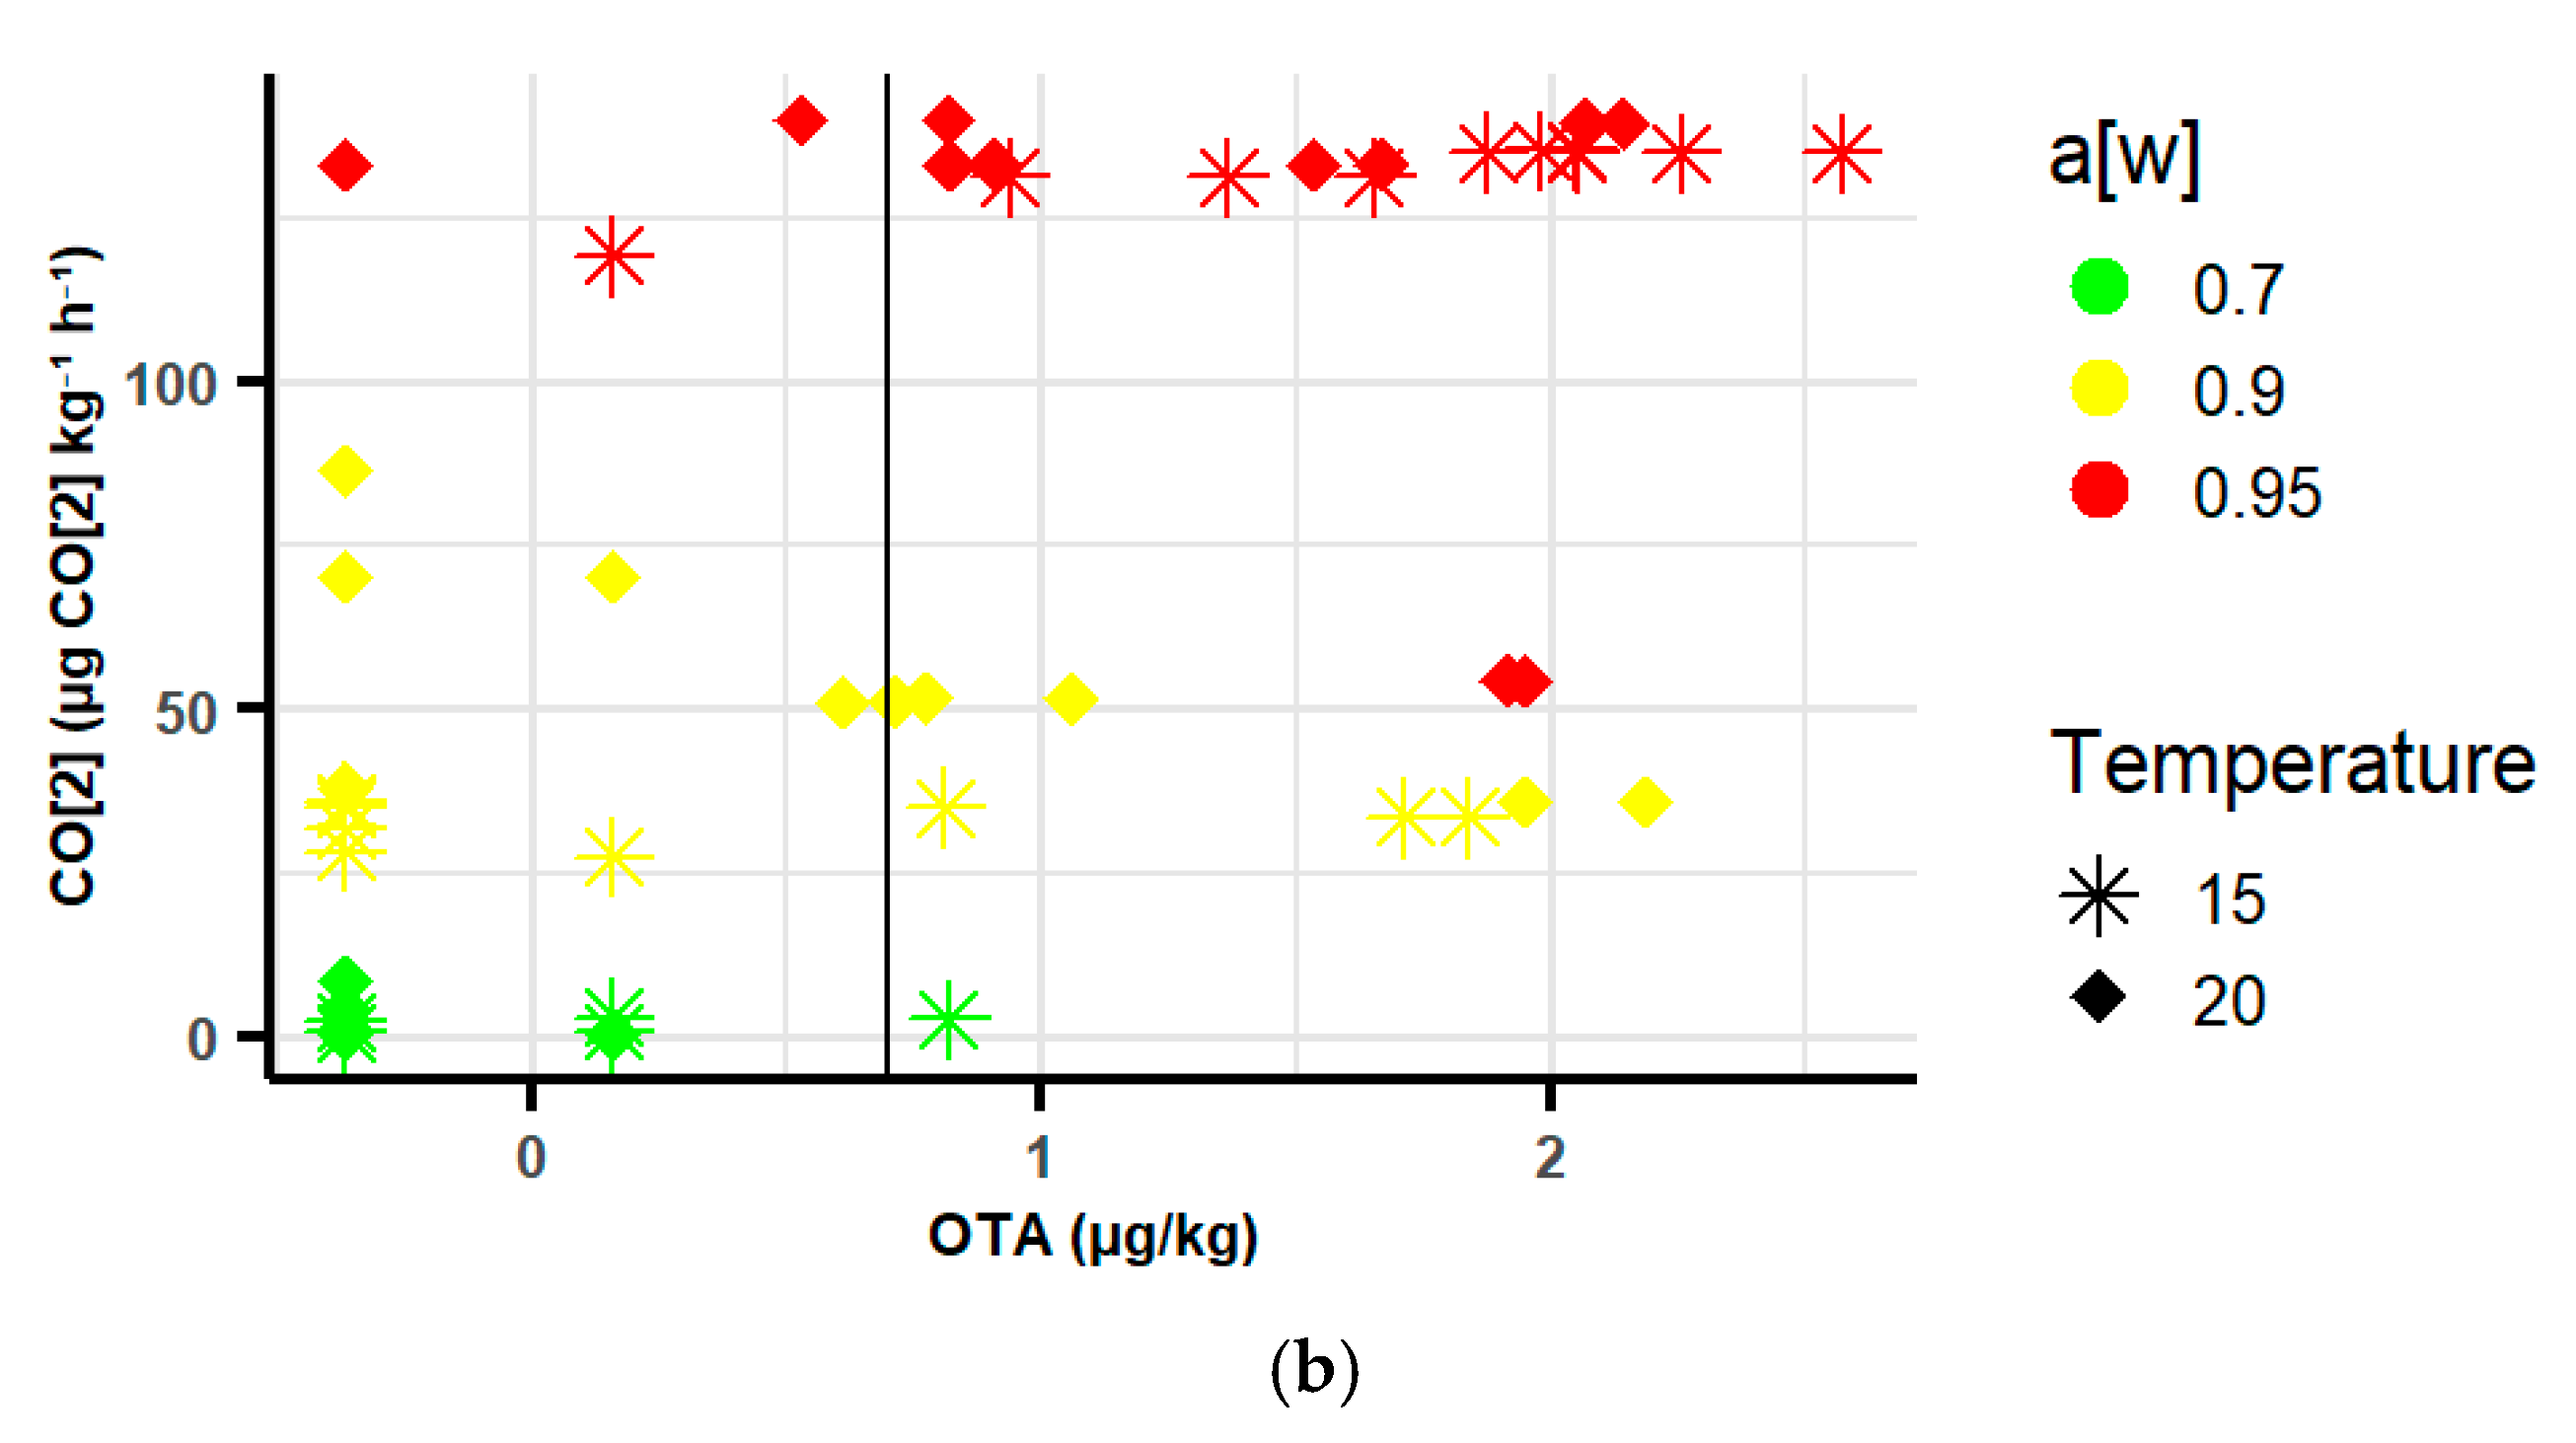
2.3.3. Relationship Between Respiration Rates (RR) and Type A Trichothecenes and Ochratoxins in Oats

At 0.70 aw, the RR was low, and the sum of the concentrations of T-2 + HT-2 + HT-2-Glc in the naturally contaminated oats at 15 °C did not exceed the maximum limit. However, as aw and temperature increased, the RR increased with a corresponding increase in T-2 + HT-2 + HT-2-Glc concentrations. It exceeded the maximum limit (1250 µg/kg) at ≥0.90 aw and ≥27 µg CO2 kg−1 h−1 as indicated by the reference line in Figure 4a.
Similarly, OTA concentrations increased as the CO2 RR increased and mostly exceeded the maximum limit at 0.90 aw and ≥27 µg CO2 kg−1 h−1 in the contaminated oats with an exception at 0.70 aw and 15 °C (Figure 4b).
The relationship between CO2 RR, type A trichothecenes, and ochratoxins in the contaminated oats was examined with linear regression and a generalised linear model (GLM). The adjusted R2 value for the OTA model is 0.3832. This suggests a moderate positive relationship as CO2 and storage days were significant predictors (p < 0.05) of ochratoxin concentrations. The GLM model showed similar results. The Pearson correlation coefficient (r = 0.5322) shows a significant correlation between CO2 and OTA concentrations (p-value < 0.0001) in the contaminated oats.
The adjusted R2 value for the T-2 + HT2 + HT2-Glc model was 0.06013, with storage days as a significant predictor. The Pearson correlation coefficient (r = 0.0039) shows an insignificant correlation between CO2 and the sum of T-2 + HT2 + HT2-Glc (p-value = 0.976) Table 6 below.
The model’s accuracy was assessed through cross-validation by comparing predicted mycotoxin values with known ones (Figures S3 and S4 in Supplementary Materials), but the linearity of the plots was not satisfactory. These models alone cannot accurately predict OTA and T-2 + HT2 + HT2-Glc concentrations using only CO2 levels as a predictor, as other storage conditions such as aw and temperature influence CO2 and mycotoxin levels in stored oats.

3. Discussion

To the best of our knowledge, the study of the relationship between the real-time CO2 measurement and the risk of trichothecenes and OTA in oats using a mini-silo pilot study has not been well documented. This study measures the real-time RR in stored oats with integrated CO2 sensors to examine the risk of type A trichothecenes and ochratoxins contamination under storage conditions 0.70, 0.90, and 0.95 aw, and 15–20 °C. These aw levels correspond to the oat moisture content (MC) of 14%, 22%, and 25% on a wet-weight basis [32]. These MCs can be achieved in stored oat grains due to inefficient drying or compromised storage conditions resulting from silo leaks, pest infestations, seasonal rainfall, or temperature changes [33].
Fusarium is commonly known to thrive in wet and humid conditions. Surprisingly, its populations and isolations at 0.95 aw were relatively low in Table 1 and Table 2. At the same aw level, Penicillium had the highest fungal isolations (100%) at 15 °C, indicating that it is a fungus adapted to temperate climates, while Aspergillus isolations were highest at 20 °C. Medina and Magan [18] reported the growth limit of F. langsethiae strains from the UK and northern Europe on an oat-based media at 0.92–0.93 aw at 10 °C. No growth was recorded at 0.90 aw regardless of strain type and temperature studied. A similar study on an oat-based medium, reported no growth rate for the F. langsethiae strain at 0.90 aw; however, growth was recorded at 0.95 aw at 15 and 20 °C after 10 days of incubation with a growth limit at 0.93 aw [34]. In contrast to these two studies, our findings show the populations of Fusarium in situ at 0.70 and 0.90 aw with low or no populations at 0.95 aw. This could be due to the adaptability or resilience of the spores in response to stress from drier conditions [35,36].

3.1. Respiration Rates in Contaminated Oats

Respiration rates have been an important factor indicating the deterioration of cereal grains in storage. Grains with fungal infections have higher respiration rates because of the increased metabolic activity associated with the infection [37]. Over many decades, research has highlighted that high moisture content leads to high RRs in stored grains, while grains stored at a drier aw of 0.70 aw (≤14% MC equivalent), produced a negligible amount of RRs [38,39,40]. Recent studies have supported this [23,27,28]. Our results show a marked increase in RR with a rise in aw in the oats. The RR was more than 100% higher at ≥0.90 aw for both temperatures. This result aligns with a recent study by Oluwakayode et al. [28] which investigated the impact of aw on RR in stored wheat. They reported a rapid increase in RR at a moisture content > 16% (0.80 aw) within the first 10 days of storage in a mini silo of wheat. The elevated level of CO2 could arise from pockets of grain mass within the silo due to a combination of factors, such as moisture content, the presence of moulds or other microbes, insect infestation, and temperature [22].
Our findings showed that an increase in temperature alone did not significantly increase the RR, but its interactions with other storage conditions did. An important observation is that the CO2 produced was highest at 0.95 aw for both temperatures. However, it did not correspond to Fusarium growth at the same aw level. The CO2 at each aw was produced by both the grain and the fungal communities which include both spoilage and toxigenic moulds within the oats in the silo. It is therefore unrealistic to separate the grain’s respiration from the fungus’s respiration during CO2 monitoring. As CO2 increased and become saturated within the silo, the CO2 sensor’s concentration limit (50,000 ppm) was reached, and the readings remained constant throughout the storage. Hence, for both temperatures, the wettest water activity (0.95 aw) showed the same real-time respiration rates from day 10 until day 20 without any significant difference.
Despite observing low or no Fusarium growth from the fungal population and isolation results at 0.95 aw for both temperatures, considerable levels of type A trichothecenes were found in the oats samples with T-2 concentrations alone exceeding the maximum limit of the sum of T-2 + HT-2 (1250 µg/kg) in most cases. It is understood that Fusarium’s growth may be suppressed under low-oxygen and high-humidity conditions, prompting it to produce mycotoxins such as fumonisins, zearalenone, and trichothecenes to deter microbial competition and adapt to stress [41]. Fusarium regulates growth and toxin synthesis through separate metabolic pathways, allowing toxin production independent of growth [42].

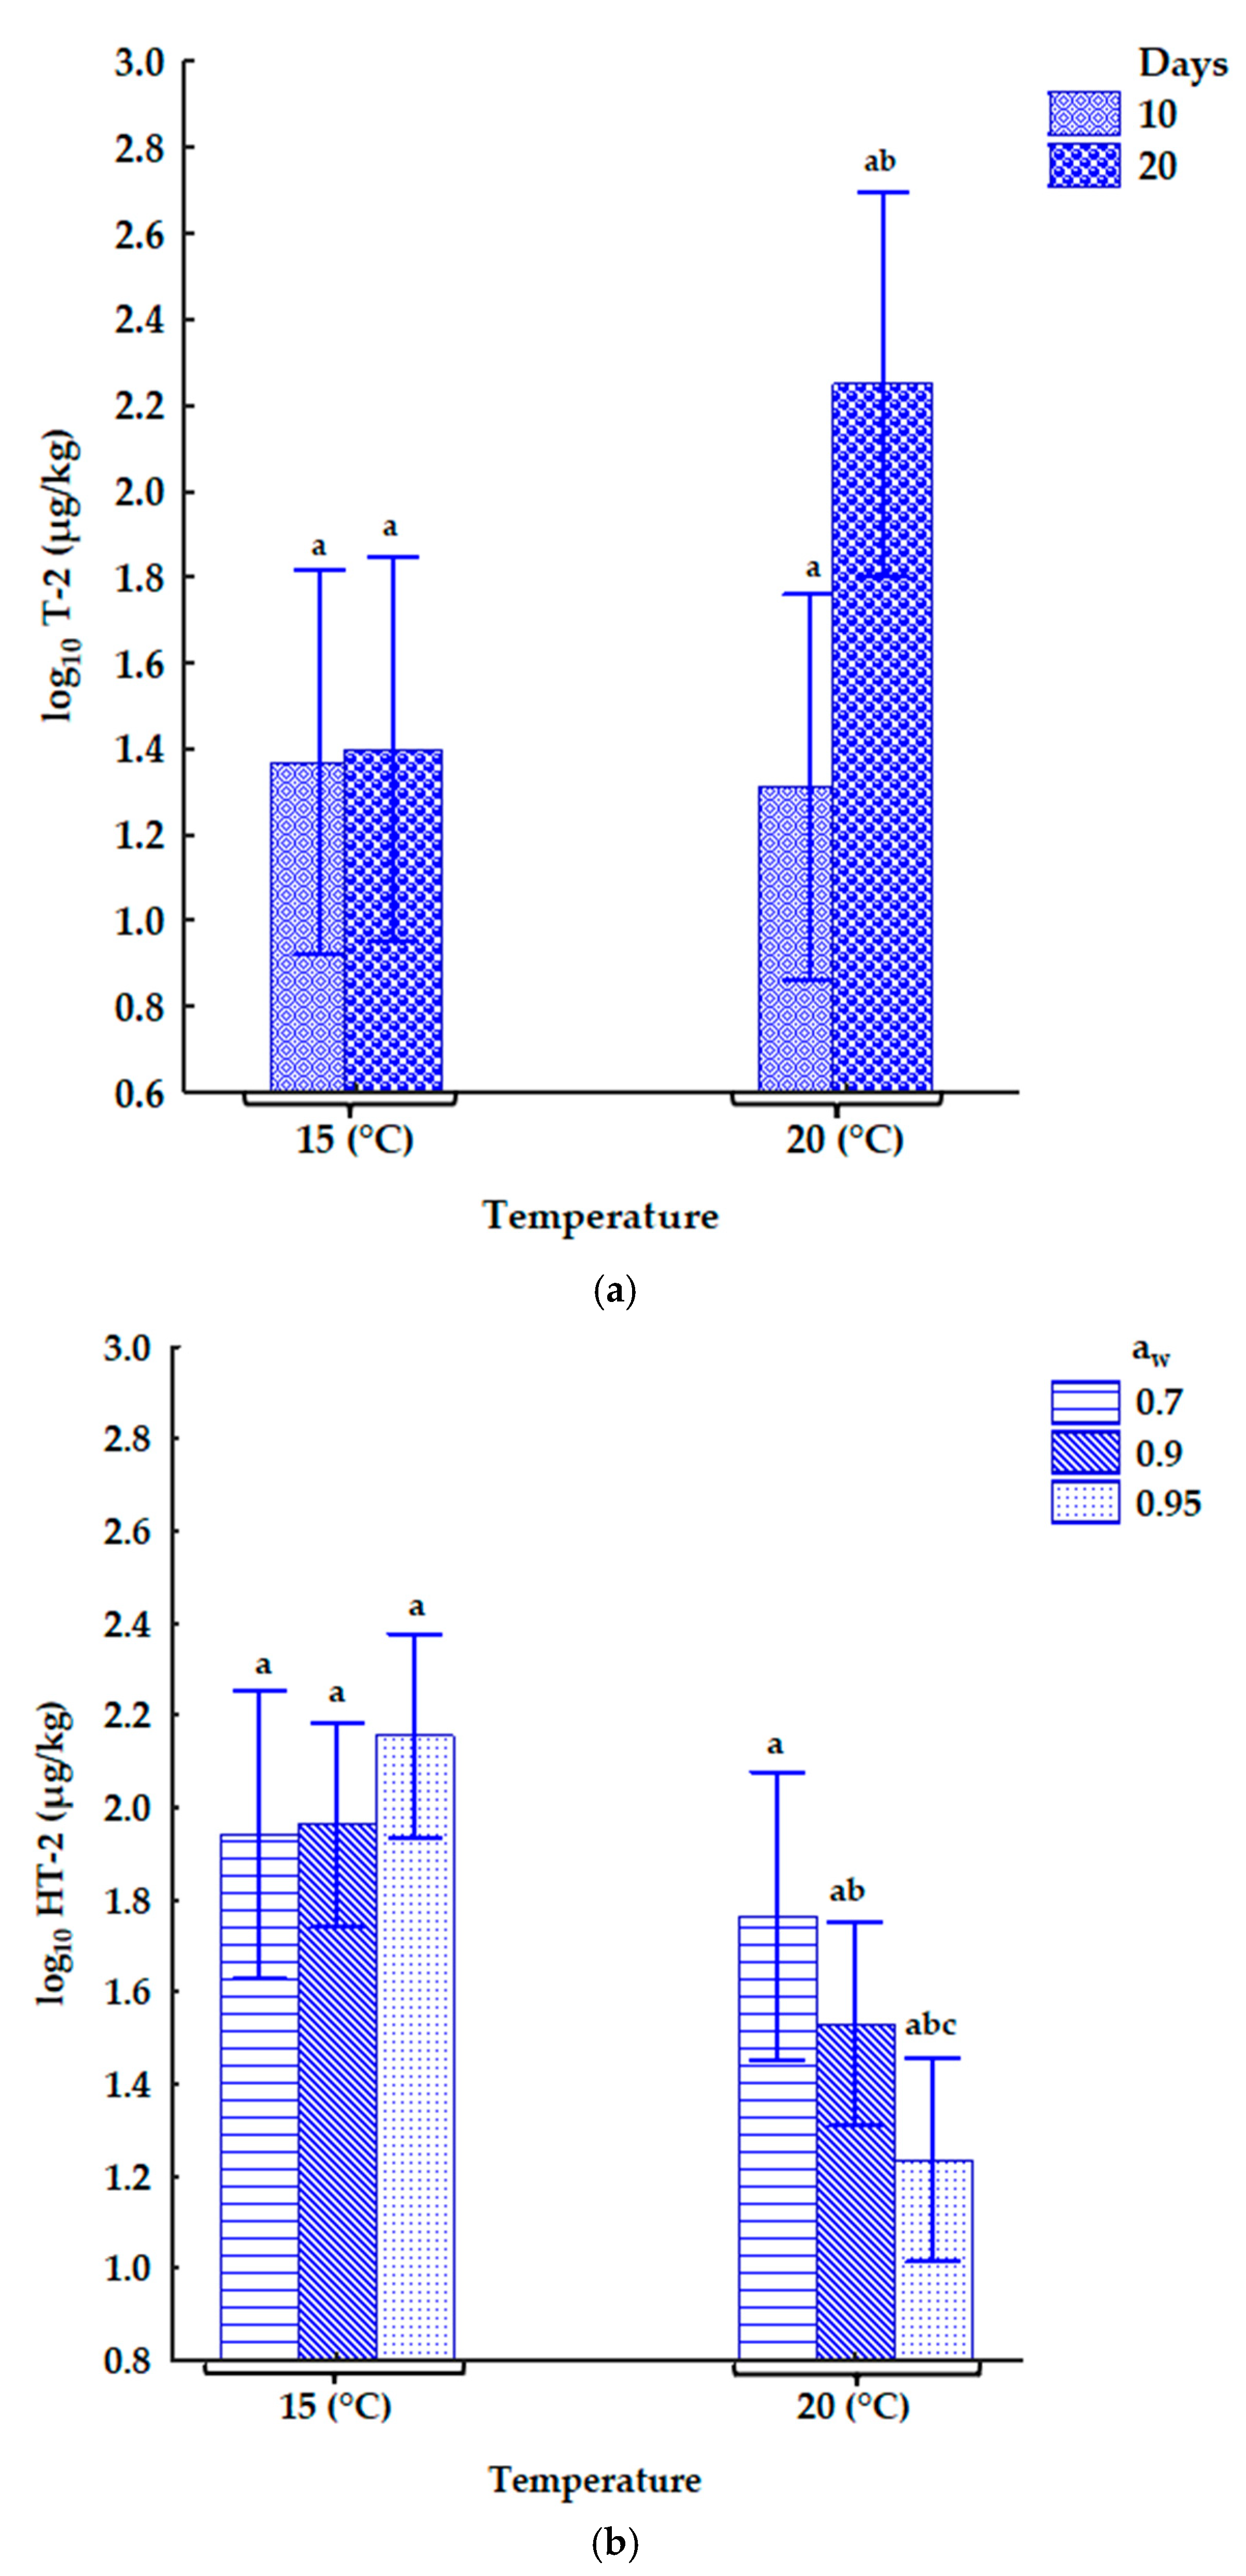
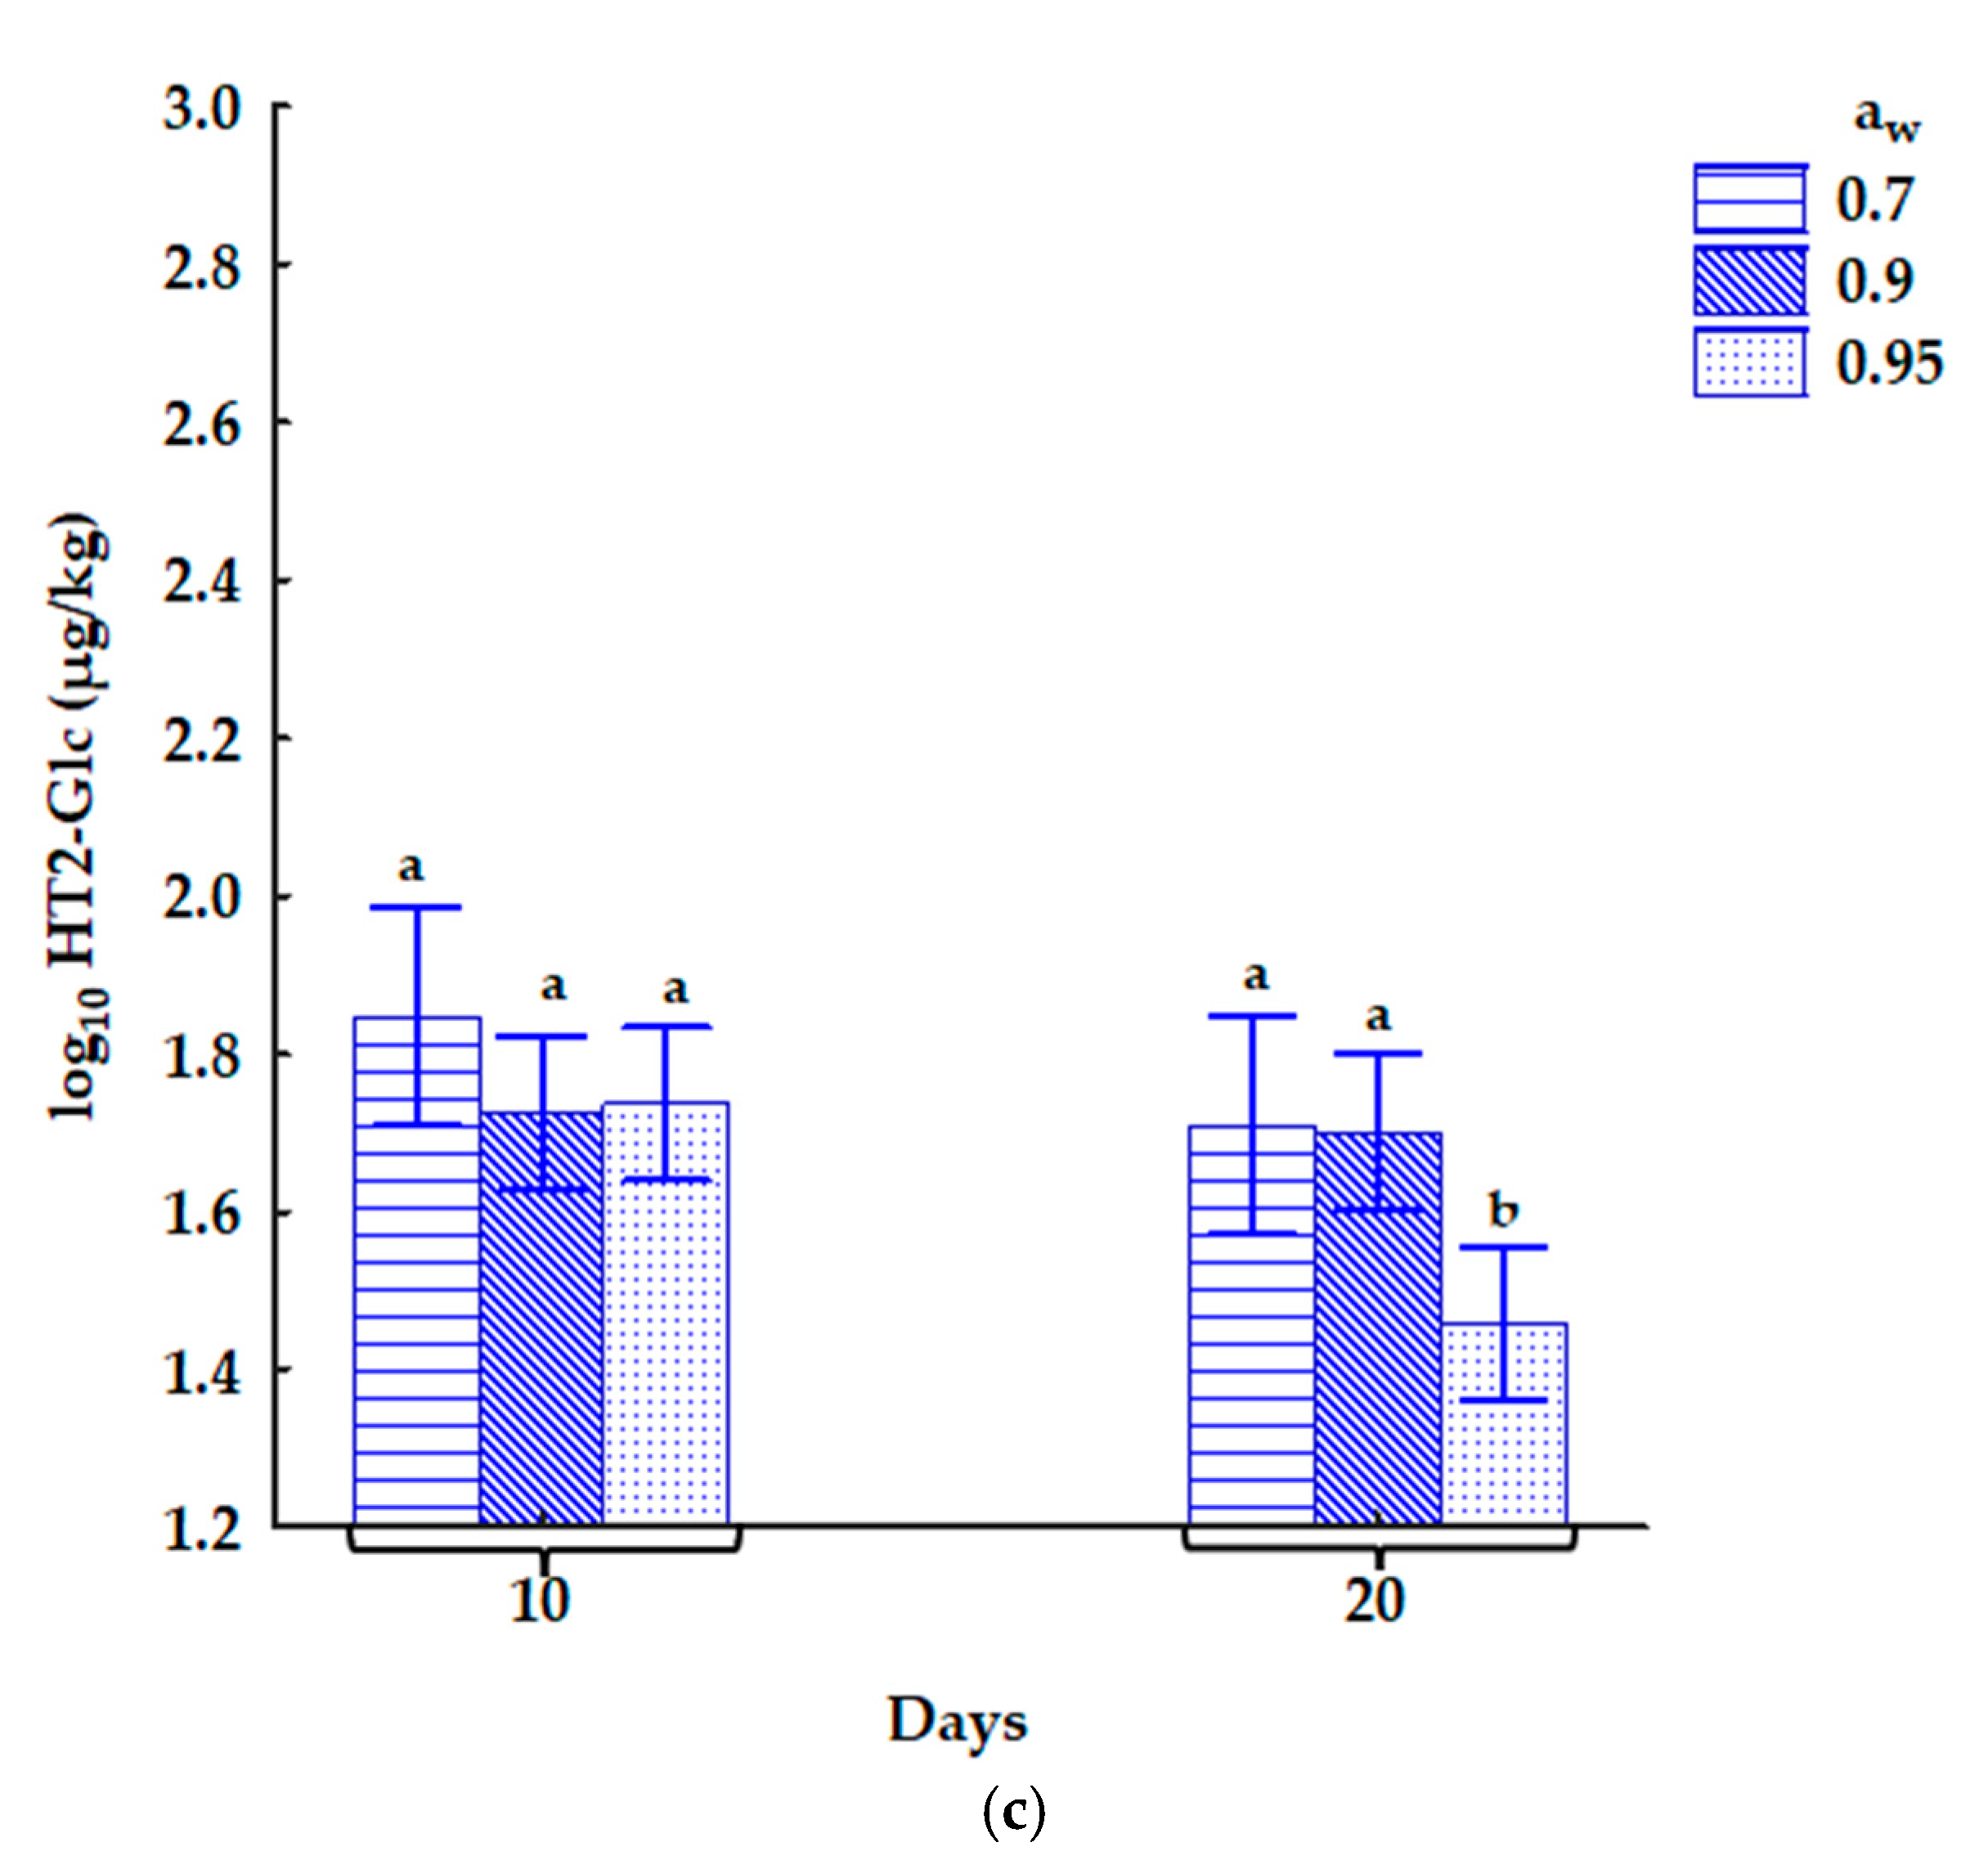
3.2. Type A Trichothecenes in Naturally Contaminated Oats

In the contaminated oats, T-2 toxin levels were at least 1.4 times lower as aw increased. However, on day 20 at 20 °C, T-2 concentrations were 6 times higher as aw increased from 0.70 aw to 0.90 aw and with a 48% increase from 0.90 to 0.95 aw. Under low and medium conditions, the concentrations of HT-2-Glc were higher than those of T-2. However, in the wettest conditions with high levels of T-2, this pattern was reversed, suggesting that the plants may have been overwhelmed by the toxin, preventing them from detoxifying it effectively. The significant levels of HT-2-Glc highlight the necessity of measuring it to ensure accurate assessments of the total mycotoxin content in grains.
Additionally, HT-2 concentrations were more than twice significantly higher than T-2 concentrations in wet conditions (0.90–0.95 aw) at 15 °C. Some studies have reported higher levels of HT-2 than T-2 toxins in oats, although without considering the impact of different environmental factors [43,44]. The higher concentrations of HT-2 than T-2 could be due to the deacetylation of T-2 to HT-2 by oat grains or the rapid hydrolysis of T-2 to HT-2 by the natural mycobiota in response to ecological stress. Further investigation is needed to understand the metabolic pathways of HT-2 in F. langsethiae [45].
In contaminated oats, it is expected that the concentrations of type A trichothecenes will increase under wet conditions, as most Fusarium species thrive in such environments. However, F. langsethiae has been noted to have slow colonization rates, having an inability to compete with other phyllosphere Fusarium species, such as F. poae, in colonizing oats [11]. Kahla et al. [46] reported variations in the effect of the acclimatisation of a range of F. langsethiae strains on growth rates and toxin production under ambient (400 ppm) and elevated (1000 ppm) CO2 on oat-based media. Further research is necessary to clarify the interactions of F. langsethiae with other mycobiota, and the implications of such competition for dominance in the oat phyllosphere and its influence on toxin production.

3.3. OTA in Naturally Contaminated Oats

Ochratoxin A is generally considered a storage toxin produced mostly by Penicillium or Aspergillus species. OTA increased with temperature rise except at 0.95 aw on day 20 in the contaminated oats. The highest OTA level was at 15 °C and 0.95 aw, exceeding the maximum limit (5 µg/kg). This can be linked to the high prevalence of Penicillium populations or isolations in the oats at 0.95 aw and 15 °C where Fusarium populations were least observed. However, the concentrations of OTA were lower than those of type A trichothecenes under these storage conditions. A similar study reported OTA production to be highest at 0.95 aw and 15 °C in stored wheat grains [28], supporting that Penicillium thrives well in temperate conditions. Cairns-Fuller et al. [47] reported that P. verrucosum growth and OTA production can occur at ≥0.85 aw in wheat grains. Our findings observed measurable values of OTA ≥ 0.90 aw. Other studies have reported high OTA levels at ≥0.90 aw [48,49,50]. It is important to stress that the effect of the interaction of aw × storage days significantly increased OTA concentrations in the stored oats. Similar to our findings, Dhungana et al. [50] reported a significant impact of the interaction of the aw × incubation period on OTA accumulation. The highest OTA level was at 0.90 aw and it increased with a prolonged incubation period.

3.4. Relationship Between CO2 and Mycotoxins in Naturally Contaminated Oats

The sum of type A trichothecenes and ochratoxins concentrations were not strongly correlated with RR in the stored oats. This is because the RR was produced by the entire fungal community and the oat grains, not only by Fusarium and Penicillium species. Moreover, a direct correlation of RR with these mycotoxins may not be feasible as other storage conditions influence changes in the RR and the mycotoxins produced. Our findings suggest that at ≥0.90 aw and an RR of ≥25 µg CO2 kg−1 h−1, the sum of type A trichothecenes and ochratoxins will exceed their legislative maximum limits in stored oats. Therefore, monitoring environmental factors during oat storage is important to minimise mould growth and mycotoxin contamination.

3.5. Conclusions

This study shows the behaviour of F. langsethiae within a natural mycobiota in stored oats, producing high levels of T-2 toxins under the wettest condition of 0.95 aw despite appearing to be outgrown by Penicillium species. Water activity and storage days significantly affected RR and the concentrations of type A trichothecenes and OTA. The linear regression model shows a moderate positive relationship between the CO2 RR and OTA concentrations. Mycotoxin exceeded legislative limits at ≥25 µg CO2 kg−1 h−1 at ≥0.90 aw. These findings support the potential use of CO2 RR as an indication of the relative risks of oats’ contamination by these mycotoxins and present preliminary results that can be integrated with field and agronomic data to develop decision support systems for improving oats’ storage management. Further experiments in larger scale storage facilities that consider additional parameters (e.g., shape and size of silos, position of the sensors to capture CO2 production) could provide more “at scale” results to support industrial uptake of these monitoring systems.

4. Materials and Methodology

4.1. Oat Grains and Moisture Adsorption Curve Analysis

Mascani oats harvested in England (2022 harvest) were stored at 4 °C for 2 weeks before the experiment. AquaLab water activity meter 4TE Decagon devices, Inc. (Pullman, WA, USA) were used to analyse the initial aw of grains. The grains’ moisture content (MC) was analysed by drying grains in the oven at 105 °C overnight. The MC values were calculated on a dry weight basis. The moisture adsorption curve was adapted from Oluwakayode et al. [16]. The relationship between the MC (dry weight basis) and aw values was plotted and noted (Figure S5 in Supplementary Data).

4.2. Mini-Silo CO2 Sensing Storage Experiment

Targeted water activities (0.70, 0.90, 0.95 aw) were achieved in 2.5 kg of oat grains weighed into a 12-litre box mixed with a known amount of water. The grains were vigorously mixed and stored at 4 °C overnight. Grains were then equilibrated at the targeted temperature (15 and 20 °C) in rooms for 3 h, and the equilibrated grains’ aw values were measured. Grains were transferred into a coffee flask with a centrally placed ATEX-compliant sensor probe. Gaseous movement in and out of the flask was minimised by placing cotton wool in the headspace of the flasks. There were three flasks (replicates) for each aw level and the nine flasks were stored at each temperature condition. The probe is made of CO2, temperature, and relative humidity sensors connected to a computer system where their respective real-time monitoring readings from the stored grains were collected for 20 days. In total, 60 g of the contaminated samples was collected on days 10 and 20 from each flask with a sterile probe into sterile jars. Multiple small sizes of grains were taken from different spots to have a good representation of the bulk sample. The aw of the grains was monitored before and after sampling. In total, 20 g of the sub-sample grains was analysed for fungal populations and isolations, while the remaining 40 g was oven dried at 50–55 °C overnight, ground, and stored at −20 °C before further analysis. The CO2 sensors were calibrated before each experiment for each treatment and temperature studied. After sampling on day 10, the grain inside the flask is 60 g less; the new weight is considered for calculating the respiration rates for day 20. The respiration rate was calculated using the diffusion formula in Equation (1) adapted from Raudienė et al. [27].
R e s p i r a t i o n   r a t e s = C O 2 × M C O 2 × V h V m × m × t
where ΔCO2 is the change in CO2 volumetric concentration in ppm, MCO2 is the molar mass of CO2 gas = 44.01 (gmol1), Vh is the volume of headspace in the jar (L), Vm is the molar volume of a gas (Lmol−1), m is the mass of the oat sample (kg), and Δt is the duration (h) of ΔCO2.
The molar volume was determined by analysing the storage temperatures.
V m = R × T P
where R is the gas constant (Jmol1 K1), T is temperature (K), and P is pressure (atm)

4.3. Fungal Populations and Isolations

According to the manufacturer’s instructions, 15 g of peptone agar was mixed in one litre of distilled water. A total of 9 mL was dispensed into 25 mL universal glass bottles, autoclaved at 121 °C for 15 min, and allowed to cool.
One gram of contaminated oat kernels was soaked in sterile 9 mL peptone water in a 25 mL universal bottle for 3 h. One ml of this bottle was serially diluted (by ten-fold dilution) to the 0.0001 M solution bottle. Sterile tips were used between each dilution and the universal bottle’s content was shaken using a vortex. 100 µL of the dilution aliquots was pipetted and reversely plated onto Dichloran Glycerol 18 agar (DG18+: Oxoid CM0729) and Malt Extract Agar (MEA+: Oxoid CM59) media in 3 replicates and spread out with a sterile metal spreader. The plates were incubated at 25 °C for 7 days. Fungi genera were identified visually with a stereoscope (Olympus 308136, Wild M7A, Heerbrugg, Switzerland) based on morphological characteristics [51]. Colonies were counted with a colony counter (Gallenkamp, Cambridge, UK) and expressed as log10 CFUs/g-dry weight.

4.4. Fungal Isolations

A total of 25 grains were directly inoculated on DG18+ and MEA + media to identify the dominant fungal genera in the contaminated grains. Five grains were placed equidistantly on each medium plate of five replicates and incubated at 25 °C for 7 days. Fungal genera were identified visually with a stereoscope based on morphological characteristics. The frequency of isolation was calculated using Equation (2) below.
%   F r e q u e n c y   o f   i s o l a t i o n = T o t a l   c o n t a m i n a t e d   g r a i n s T o t a l   g r a i n s   i n   p l a t e s   ( 25   g r a i n s ) × 100

4.5. Mycotoxin Analysis

4.5.1. Chemical Reagents

T-2 toxin, HT-2 toxin, and ochratoxin A standard solutions were purchased from Romer Labs (Tulln, Austria), and HT-2-toxin-3-O-β-D-glucoside was synthesized by Michlmayr et al. [52]. LC-MS/MS-grade methanol, acetonitrile (ACN), and formic acid (Honeywell, Seelze, Germany); ammonium acetate (MS grade, Sigma-Aldrich, Darmstadt, Germany); and glacial acetic acid (HAc, Sigma-Aldrich, Burlington, MA, USA) were used. Water was purified successively by reverse osmosis and using a Pure LAB water system (VEOLIA, High Wycombe, UK).

4.5.2. LC-MS/MS

The liquid chromatography–tandem mass spectrometry (LC-MS/MS) machine used in this study was an LQTRAP 5500+ MS/MS system (SCIEX) equipped with a Turbo V electrospray ionization (ESI) source, coupled to an ExionLC AD System (SCIEX, Framingham, MA, USA). Chromatographic separation was performed at 27 °C on a Gemini C18 Column, 100 × 4.6 mm (Phenomenex, Torrance, CA, USA).
LC-MS/MS was performed in the time-scheduled MRM mode in positive and negative polarities in one chromatographic run per sample by scanning two fragmentation reactions per analyte. Elution was carried out in binary gradient mode. Both mobile phases contained 5 mM of ammonium acetate and were composed of water/methanol/acetic acid at 89:10:1 (v/v/v; eluent A) and 2:97:1 (v/v/v; eluent B), respectively, with a sample injection volume set at 5 µL, with a total runtime of 21 min. The gradient elution program for the elution of mycotoxins was as follows: 0 min 5% B, 0.5 min 5% B, 2.5 min 70% B, 3.5 min 95% B, 5 min 95% B, and 7.5 min 5% B. The mass spectrometry parameters used are outlined in Table 7.

4.5.3. Method Validation

The acceptable performance criteria of analytical methods set and updated by European Commission regulation No. 2021/808/EC [29] were used to validate the optimised LC-MS/MS method for mycotoxin analysis in the oat samples. The performance characteristics evaluated were linearity (r2), limit of detection (LOD), limit of quantification (LOQ), matrix effect or the signal suppression/enhancement (SSE), recovery of the extraction process (RE), absolute recovery (RA), and repeatability.
Working standard solutions were prepared to contain 25 µL each of stock solutions of T-2 toxin, HT-2 toxin, HT-2-Glucoside, and Ochratoxin A mixed in an ACN solution. In total, 50 mg of three lots of homogenised oat samples was spiked at the working solution concentration and a 10-fold dilution level. This was performed in duplicate. Spiked samples were placed in the dark overnight for solvent evaporation and analyte–matrix interaction. The spiked and unspiked samples were extracted with ACN:H2O:HAc (79: 20:1, v/v/v) for 90 min using a VWR DVX-2500 shaker (VMR International Ltd., Leicestershire, UK). After extraction, the extract of the unspiked samples was spiked and 500 µL of the extract was diluted with 500 µL of the diluent ACN:H2O:HAc (20:79:1, v/v/v). Five µL of each diluted extract was injected twice into the LC-MS/MS system for analysis. A total of 500 µL of the working standard solution was diluted with ACN:H2O (50:50, v/v) to achieve the desired concentration of each analyte in the working standard. Quantification was performed via external calibration using a nine-point calibration curve achieved by serial dilutions of the multi-analyte working standard solution. Data were further processed using Analyst® 1.7.1 and SCIEX OS-Q 3.0.
The apparent recovery (RA), matrix effect (SSE), and extraction efficiency (RE) were calculated using Equations (3)–(5) below.
R A = a r e a   o f   s a m p l e   s p i k e d   b e f o r e   e x t r a c t i o n a r e a   o f   n e a t   s o l v e n t   s t a n d a r d × 100
S S E = a r e a   o f   s a m p l e   s p i k e d   a f t e r   e x t r a c t i o n a r e a   o f   n e a t   s o l v e n t   s t a n d a r d × 100
R E = R A S S E × 100

4.5.4. Sample Preparation and Extraction

The initial mycotoxin concentrations of the oat grains were analysed. Following the storage experiment, 120 contaminated oat samples (including replicates) were analysed for mycotoxins. The oats were ground with a high-power 1000 W blender (Geroge, Watford, UK). A volume of 20 mL of extraction solvent (ACN:H2O:HAc, 79:20:1, v/v/v) was added to 5 g of ground oat grains. Extraction was carried out for 90 min using a multitube vortex (VWR DVX-2500, VMR International Ltd., Leicestershire, UK), followed by centrifugation for 15 min at 5000 rpm on a Rotina 380R centrifuge (Hettich, Tuttlingen, Germany Zentrifuge). Then, 500 µL of the extract was diluted with 500 µL of dilution solvent (ACN/H2O/HAc, 20:79:1, v/v/v). A total of 5 µL of the diluted extract was injected into the LC-MS/MS system for analysis.

4.6. Statistical Analyses

The datasets were analysed with Statistica 14.0.1, JMP® Pro 17, and RStudio 2024.04 in R 4.4.1. The normal distribution of data was examined with the normal plots of the residuals. When data failed the normality test, they were transformed to square root or logarithm values to achieve normality. Transformed data were normally distributed; therefore, factorial ANOVA was used to analyse the effect of the interactions between the storage conditions on respiration rates and mycotoxin concentrations. The Tukey Honest Significant Difference (HSD) post hoc test was used to evaluate differences among means for the interactions of storage conditions. The non-parametric comparison for each pair (Wilcoxon method) evaluates significant differences in fungal populations and mycotoxin concentrations for each storage condition. Statistical analyses performed were considered significant when p-values were <0.05. The concentrations of mycotoxins below the limit of detection and quantitation were assigned with values of LOD/2 and LOQ/2, respectively, for statistical analysis [34].

Supplementary Materials

The following supporting information can be downloaded at: https://www.mdpi.com/article/10.3390/toxins17030132/s1, Figure S1: Pictorial representation of fungal populations/isolations in contaminated oats on MEA+ media at all water activity (aw) levels at 15 °C for direct plating (DP) and serial dilution (SD) methods; Figure S2: Mean values of CO2 respiration rates in contaminated oats at 15 and 20 °C for 20 days with standard error bars (n = 3). Bars represent respiration rates at each storage day (day 0, day 10, and day 20). * shows significant differences between each water activity level at each temperature using the Wilcoxon test (p < 0.05). aw—water activity; Figure S3: Plot of the predicted against the known values of T-2 + HT-2 with residuals and normal Q-Q plots.; Figure S4: Plot of the predicted against the known values of ochratoxin A with residuals and normal Q-Q plots; Table S1: Pearson correlation coefficient (r) and p-values of respiration rates and mycotoxin concentrations in contaminated oats; Figure S5: Moisture adsorption curves for oat grains.

Author Contributions

Conceptualization, A.M., A.O. and R.K.; methodology, A.O. and A.M.; validation: A.O. and M.S.; metabolomic analysis: A.O.; statistics A.O.; writing—original draft preparation, A.O.; writing—review and editing, A.M., F.B., C.V.-V., M.S. and R.K.; supervision, R.K. and A.M.; funding acquisition, A.M. and R.K. All authors have read and agreed to the published version of the manuscript.

Funding

This research was funded by the United Kingdom Research and Innovation (UKRI), the Biotechnology and Biological Sciences Research Council (BBSRC), and the FoodBioSystem Doctoral Training Programme (FBSDTP); grant reference: BB/T008776/1.

Institutional Review Board Statement

Not Applicable.

Informed Consent Statement

Not applicable.

Data Availability Statement

The original contributions presented in this study are included in the article/Supplementary Material. Further inquiries can be directed to the corresponding author.

Acknowledgments

We would like to acknowledge Naresh Magan (Decd) who contributed to the planning and methodology of the experiments and the funding acquisition of this project.

Conflicts of Interest

The authors declare no conflicts of interest.

Correction Statement

This article has been republished with a minor correction to last sentence of the 2nd paragraph of the Introduction information by deleting "," and adding ". Other fungal genera produce" before "ochratoxin A (OTA),". This change does not affect the scientific content of the article.

References

  1. FMI. Future Market Insights. Oats Market Is Projected to Reach USD 10.8 Billion by 2032-Comprehensive Research Report by FMI. 2022. Available online: https://www.globenewswire.com/en/news-release/2022/02/09/2382216/0/en/Oats-Market-is-projected-to-reach-USD-10-8-Billion-by-2032-Comprehensive-Research-Report-by-FMI.htmL (accessed on 30 October 2024).
  2. Barcchiya, J.; Meena, R.K.; Lal, N. Oat is a multifunctional cereal crop. Innov. Farming 2017, 2, 114–116. [Google Scholar]
  3. FAO–Food and Agricultural Organization of the United Nations. Global Food Loss Index. 2018. Available online: https://openknowledge.fao.org/server/api/core/bitstreams/a551b26f-6d33-4e3e-ba29-122725ebe464/content (accessed on 30 October 2024).
  4. Cinar, A.; Onbaşı, E. Mycotoxins: The hidden danger in foods. In Mycotoxins and Food Safety; IntechOpen: London, UK, 2019; pp. 1–21. [Google Scholar]
  5. Sacchi, C.; González, H.H.L.; Broggi, L.E.; Pacin, A.; Resnik, S.L.; Cano, G.; Taglieri, D. Fungal contamination and mycotoxin natural occurrence in oats for race horses feeding in Argentina. Anim. Feed. Sci. Technol. 2009, 152, 330–335. [Google Scholar] [CrossRef]
  6. Cabañes, F.J.; Bragulat, M.R.; Castellá, G. Ochratoxin A producing species in the genus Penicillium. Toxins 2010, 2, 1111–1120. [Google Scholar] [CrossRef]
  7. Božik, M.; Císarová, M.; Tančinová, D.; Kouřimská, L.; Hleba, L.; Klouček, P. Selected essential oil vapours inhibit growth of Aspergillus spp. in oats with improved consumer acceptability. Ind. Crops Prod. 2017, 98, 146–152. [Google Scholar] [CrossRef]
  8. Hautsalo, J.; Jauhiainen, L.; Hannukkala, A.; Manninen, O.; Veteläinen, M.; Pietilä, L.; Peltoniemi, K.; Jalli, M. Resistance to Fusarium head blight in oats based on analyses of multiple field and greenhouse studies. Eur. J. Plant Pathol. 2020, 158, 15–33. [Google Scholar] [CrossRef]
  9. Hofgaard, I.S.; Aamot, H.U.; Seehusen, T.; Riley, H.; Dill-Macky, R.; Holen, B.M.; Brodal, G. Fusarium and mycotoxin content of harvested grain was not related to tillage intensity in Norwegian spring wheat fields. World Mycotoxin J. 2020, 13, 473–486. [Google Scholar] [CrossRef]
  10. Imathiu, S.M.; Edwards, S.G.; Ray, R.V.; Back, M.A. Fusarium langsethiae—A HT-2 and T-2 toxins producer that needs more attention. J. Phytopathol. 2013, 161, 1–10. [Google Scholar] [CrossRef]
  11. Dhungana, B.; Ali, S.; Byamukama, E.; Krishnan, P.; Caffe-TremL, M. Incidence of Penicillium verrucosum in grain samples from oat varieties commonly grown in South Dakota. J. Food Prot. 2018, 81, 898–902. [Google Scholar] [CrossRef]
  12. Tarazona, A.; Gómez, J.V.; Mateo, F.; Jiménez, M.; Mateo, E.M. Potential health risk associated with mycotoxins in oat grains consumed in Spain. Toxins 2021, 13, 421. [Google Scholar] [CrossRef]
  13. Lattanzio, V.M.; Visconti, A.; Haidukowski, M.; Pascale, M. Identification, and characterization of new Fusarium masked mycotoxins, T2 and HT2 glycosyl derivatives, in naturally contaminated wheat and oats by liquid chromatography–high-resolution mass spectrometry. J. Mass. Spectrom. 2012, 47, 466–475. [Google Scholar] [CrossRef]
  14. Berthiller, F.; Crews, C.; Dall’Asta, C.; Saeger, S.D.; Haesaert, G.; Karlovsky, P.; Oswald, I.P.; Seefelder, W.; Speijers, G.; Stroka, J. Masked mycotoxins: A review. Mol. Nutr. Food Res. 2013, 57, 165–186. [Google Scholar] [CrossRef] [PubMed]
  15. European Commission. Commission Regulation (EU) 2024/1038 of 9 April 2024 amending Regulation (EU) 2023/915 as regards maximum levels of T-2 and HT-2 toxins in food. Off. J. Eur. Union 2024, L 94, 1–7. Available online: https://eur-lex.europa.eu/eli/reg/2024/1038/oj (accessed on 5 July 2024).
  16. Coradi, P.C.; Maldaner, V.; Lutz, É.; da Silva Daí, P.V.; Teodoro, P.E. Influences of drying temperature and storage conditions for preserving the quality of maize postharvest on laboratory and field scales. Sci. Rep. 2020, 10, 22006. [Google Scholar] [CrossRef]
  17. Taher, H.; San Martino, S.; Abadia, M.B.; Bartosik, R.E. Respiration of barley seeds (Hordeum vulgare L.) under different storage conditions. J. Stored Prod. Res. 2023, 104, 102178. [Google Scholar] [CrossRef]
  18. Medina, A.; Magan, N. Comparisons of water activity and temperature impacts on growth of Fusarium langsethiae strains from northern Europe on oat-based media. Int. J. Food Microbiol. 2010, 142, 365–369. [Google Scholar] [CrossRef] [PubMed]
  19. Yu, S.; Jia, B.; Li, K.; Zhou, H.; Lai, W.; Tang, Y.; Yan, Z.; Sun, W.; Liu, N.; Yu, D.; et al. Pre-warning of abiotic factors in maize required for potential contamination of Fusarium mycotoxins via response surface analysis. Food Control 2021, 121, 107570. [Google Scholar] [CrossRef]
  20. Foulongne-Oriol, M.; Garcia, M.A.; Mahmoud, R.; Bancal, M.O.; Bancal, P.; Bernillon, S.; Pinson-Gadais, L.; Richard-Forget, F. Ecophysiological Behaviour of Major Fusarium Species In Response To Combinations Of Temperature And Water Activity Constraints. bioRxiv 2024. [Google Scholar] [CrossRef]
  21. Ramachandran, R.P. Integrated approach on stored grain quality management with CO2 monitoring—A review. J. Stored Prod. Res. 2022, 96, 101950. [Google Scholar] [CrossRef]
  22. Gonzales, H.B.; Armstrong, P.R.; Maghirang, R.G. Simultaneous monitoring of stored grain with relative humidity, temperature, and carbon dioxide sensors. Appl. Eng. Agric. 2009, 25, 595–604. [Google Scholar] [CrossRef]
  23. Huang, H.; Danao, M.G.; Rausch, K.; Singh, V. Diffusion and production of carbon dioxide in bulk corn at various temperatures and moisture content. In Proceedings of the 2013, Kansas City, MI, USA, 21–24 July 2013; American Society of Agricultural and Biological Engineers: St. Joseph, MI, USA, 2013; p. 1. [Google Scholar]
  24. Danao, M.G.C.; Zandonadi, R.S.; Gates, R.S. Development of a grain monitoring probe to measure temperature, relative humidity, carbon dioxide levels and logistical information during handling and transportation of soybeans. Comput. Electron. Agric. 2015, 119, 74–82. [Google Scholar] [CrossRef]
  25. Raudienė, E.; Rušinskas, D.; Balčiūnas, G.; Juodeikienė, G.; Gailius, D. Carbon dioxide respiration rates in wheat at various temperatures and moisture contents. Mapan 2017, 32, 51–58. [Google Scholar] [CrossRef]
  26. Mylona, K.; Sulyok, M.; Magan, N. Relationship between environmental factors, dry matter loss and mycotoxin levels in stored wheat and maize infected with Fusarium species. Food Addit. Contam. Part A 2012, 29, 1118–1128. [Google Scholar] [CrossRef] [PubMed]
  27. Garcia-Cela, E.; Kiaitsi, E.; Sulyok, M.; Medina, A.; Magan, N. Fusarium graminearum in stored wheat: Use of CO2 production to quantify dry matter losses and relate this to relative risks of zearalenone contamination under interacting environmental conditions. Toxins 2018, 10, 86. [Google Scholar] [CrossRef] [PubMed]
  28. Oluwakayode, A.; Sulyok, M.; Krska, R.; Medina, A. The effect of the interactions of water activity, and temperature on OTA, OTB, and OTα produced by Penicillium verrucosum in a mini silo of natural and inoculated wheat using CO2 production as fungal activity sentinel. Food Chem. 2024, 460, 140590. [Google Scholar] [CrossRef]
  29. European Commission. Commission Implementing Regulation (EU) 2021/808 of 22 March 2021 on the performance of analytical methods for residues of pharmacologically active substances used in food-producing animals and on the interpretation of results as well as on the methods. Off. J. Eur. Union 2021, 180, 84–109. [Google Scholar]
  30. European Commission. Commission Regulation (EU) 2023/915 of 25 April 2023 on maximum levels for certain contaminants in food and repealing Regulation (EC) No 1881/2006. Off. J. Eur. Union 2023, 119, 103–157. Available online: https://eur-lex.europa.eu/eli/reg/2023/915/oj/eng (accessed on 5 July 2024).
  31. European Food Safety Authority (EFSA); Arcella, D.; Gómez Ruiz, J.A. Use of cut-off values on the limits of quantification reported in datasets used to estimate dietary exposure to chemical contaminants. EFSA Support. Publ. 2018, 15, 1452E. [Google Scholar]
  32. Oluwakayode, A.; Greer, B.; He, Q.; Sulyok, M.; Meneely, J.; Krska, R.; Medina, A. The influence of different abiotic conditions on the concentrations of free and conjugated deoxynivalenol and zearalenone in stored wheat. Mycotoxin Res. 2024, 40, 591–603. [Google Scholar] [CrossRef]
  33. Chulze, S.N.; Palazzini, J.M.; Lullien-Pellerin, V.; Ramirez, M.L.; Cuniberti, M.; Magan, N. Fusarium species infection in wheat: Impact on quality and mycotoxin accumulation. In Wheat Quality for Improving Processing and Human Health; Igrejas, G., Ikeda, T., Guzmán, C., Eds.; Springer: Cham, Switzerland, 2020; pp. 421–452. [Google Scholar]
  34. Verheecke-Vaessen, C.; Garcia-Cela, E.; Lopez-Prieto, A.; Jonsdottir, I.O.; Medina, A.; Magan, N. Water and temperature relations of Fusarium langsethiae strains and modelling of growth and T-2 and HT-2 mycotoxin production on oat-based matrices. Int. J. Food Microbiol. 2021, 348, 109203. [Google Scholar] [CrossRef]
  35. Audenaert, K.; Vanheule, A.; Höfte, M.; Haesaert, G. Deoxynivalenol: A major player in the multifaceted response of Fusarium to its environment. Toxins 2013, 6, 1–19. [Google Scholar] [CrossRef]
  36. Dijksterhuis, J. Fungal spores: Highly variable and stress-resistant vehicles for distribution and spoilage. Food Microbiol. 2019, 81, 2–11. [Google Scholar] [CrossRef]
  37. Cuperlovic-Culf, M.; Vaughan, M.M.; Vermillion, K.; Surendra, A.; Teresi, J.; McCormick, S.P. Effects of atmospheric CO2 level on the metabolic response of resistant and susceptible wheat to Fusarium graminearum infection. Mol. Plant-Microbe Interact. 2019, 32, 379–391. [Google Scholar] [CrossRef] [PubMed]
  38. Robertson, D.W.; Lute, A.M.; Gardner, R. Effect of relative humidity on viability, moisture content, and respiration of wheat, oats, and barley seed in storage. J. Agric. Res. 1939, 59, 281–291. [Google Scholar]
  39. Ramstad, P.E. The Relative Respiratory Rates and Hygroscopic Equilibria of Common And Hull-Less Oats. J. Agric. Res. 1942, 64, 237. [Google Scholar]
  40. Christensen, C.M. Deterioration of stored grains by fungi. Bot. Rev. 1957, 23, 108–134. [Google Scholar] [CrossRef]
  41. Sweeney, M.J.; Dobson, A.D. Molecular biology of mycotoxin biosynthesis. FEMS Microbiol. Lett. 1999, 175, 149–163. [Google Scholar] [CrossRef]
  42. Desjardins, A.E. Fusarium Mycotoxins: Chemistry, Genetics and Biology; The American Phytopathological Society: Saint Paul, MN, USA, 2006; 260p. [Google Scholar]
  43. Edwards, S.G. Investigation of Fusarium mycotoxins in UK Barley and Oat Production. Project Report No.415; AHDB Cereals & Oilseeds: Stoneleigh, UK, 2007; Available online: https://ahdb.org.uk/investigation-of-fusarium-mycotoxins-in-uk-barley-and-oat-production (accessed on 7 March 2025).
  44. Daud, N.; Currie, V.; Duncan, G.; Filipe, J.A.; Yoshinari, T.; Stoddart, G.; Roberts, D.; Gratz, S.W. Free and modified mycotoxins in organic and conventional oats (Avena sativa L.) grown in Scotland. Toxins 2023, 15, 247. [Google Scholar] [CrossRef]
  45. Lattanzio, V.M.; Solfrizzo, M.; Visconti, A. Enzymatic hydrolysis of T-2 toxin for the quantitative determination of total T-2 and HT-2 toxins in cereals. Anal. Bioanal. Chem. 2009, 395, 1325–1334. [Google Scholar] [CrossRef]
  46. Kahla, A.; Verheecke-Vaessen, C.; Delpino-Deelias, M.; Gutierrez-Pozo, M.; Medina, A.; Magan, N.; Doohan, F. Acclimatisation of Fusarium langsethiae, F. poae and F. sporotrichioides to elevated CO2: Impact on fungal growth and mycotoxin production on oat-based media. Int. J. Food Microbiol. 2023, 394, 110176. [Google Scholar] [CrossRef]
  47. Cairns-Fuller, V.; Aldred, D.; Magan, N. Water, temperature and gas composition interactions affect growth and ochratoxin A production by isolates of Penicillium verrucosum on wheat grain. J. Appl. Microbiol. 2005, 99, 1215–1221. [Google Scholar] [CrossRef]
  48. Pardo, E.; Malet, M.; Marín, S.; Sanchis, V.; Ramos, A.J. Effects of water activity and temperature on germination and growth profiles of ochratoxigenic Penicillium verrucosum isolates on barley meal extract agar. International J. Food Microbiol. 2006, 106, 25–31. [Google Scholar] [CrossRef]
  49. Lahouar, A.; Marin, S.; Crespo-Sempere, A.; Saïd, S.; Sanchis, V. Influence of temperature, water activity and incubation time on fungal growth and production of ochratoxin A and zearalenone by toxigenic Aspergillus tubingensis and Fusarium incarnatum isolates in sorghum seeds. Int. J. Food Microbiol. 2017, 242, 53–60. [Google Scholar] [CrossRef] [PubMed]
  50. Dhungana, B.; Ali, S.; Byamukama, E.; Krishnan, P.; Wu, J.; Caffe-Treml, M. Effects of temperature, water activity, and fungal isolate on ochratoxin A accumulation in oat grain inoculated with Penicillium verrucosum and development of a methodology to screen oat cultivars for ochratoxin A accumulation. Cereal Chem. 2019, 96, 950–957. [Google Scholar] [CrossRef]
  51. Samson, R.A.; Houbraken, J.; Thrane, U.; Frisvad, J.C.; Andersen, B. Food and Indoor Fungi, 2nd ed.; Westerdijk Fungal Biodiversity Institute: Utrecht, The Netherlands, 2019. [Google Scholar]
  52. Michlmayr, H.; Varga, E.; Malachová, A.; Fruhmann, P.; Piątkowska, M.; Hametner, C.; Šofrová, J.; Jaunecker, G.; Häubl, G.; Lemmens, M.; et al. UDP-glucosyltransferases from rice, Brachypodium, and barley: Substrate specificities and synthesis of type A and B trichothecene-3-O-β-D-glucosides. Toxins 2018, 10, 111. [Google Scholar] [CrossRef] [PubMed]
Figure 1. The effect of the interactions of aw × temperature on the respiration rates in contaminated oats. Using the Tukey HSD test, different letters show significant differences in respiration rates. aw—water activity.
Toxins 17 00132 g001
Figure 2. The effect of the interactions of (a) storage days × temperature on T-2 toxin, (b) aw × temperature on HT-2 toxin, and (c) aw × storage days on HT2-Glc. Using the Tukey HSD test, the same letters show no significant differences in type A trichothecenes concentrations. The vertical bar denotes 95% confidence intervals. aw—water activity.
Toxins 17 00132 g002aToxins 17 00132 g002b
Figure 3. The effect of aw on OTA concentrations in contaminated oats. Different letters show significant differences in OTA concentrations among aw levels.
Toxins 17 00132 g003
Figure 4. The relationship between the RR and the concentrations of (a) the sum of T-2 + HT-2 + HT-2-Glc and (b) OTA in the contaminated oats at all storage conditions. a[w]—water activity. Vertical lines indicate maximum levels of 1250 μg/kg for T-2 + HT-2 and 5 μg/kg for OTA concentrations. Temperature unit: °C.
Toxins 17 00132 g004aToxins 17 00132 g004b
Table 1. Mean values (n = 9 ± SD) of Fusarium and Penicillium populations (log10 CFUs/g) in naturally contaminated oats at all storage conditions.
Fungal GeneraT (°C)Days0.70 aw0.90 aw0.95 aw
MEA+DG18+MEA+DG18+MEA+DG18+
Fusarium1510---2.9 ± 2.7--
203.3 ± 3.42.1 ± 2.33.3 ± 3.32.7 ± 2.6--
2010-2.8 ± 2.82.1 ± 2.32.6 ± 2.56.2 ± 6.4-
204.1 ± 4.0-----
Penicillium15103.1 ± 2.9-2.9 ± 3.12.8 ± 2.76.7 ± 6.26.8 ± 0.0
202.9 ± 0.02.1 ± 2.33.3 ± 3.42.9 ± 37.0 ± 6.66.9 ± 6.4
20103.5 ± 3.43.6 ± 3.52.9 ± 3.03.2 ± 3.16.9 ± 6.26.9 ± 6.1
203.1 ± 2.82.9 ± 2.65.3 ± 5.25.6 ± 0.07.0 ± 6.97.0 ± 6.9
SD: standard deviation. “-” represents no growth. T: temperature. aw: water activity. DG18+: Dichloran Glycerol 18 agar + Chloramphenicol. MEA+: Malt Extract Agar + Chloramphenicol. An amount of 0.70 aw was used as the control condition. Non-parametric comparison for each pair using the Wilcoxon method shows no significant differences in the fungal populations among the three aw levels for each media for each day and each temperature (within each row).
Table 2. Frequency of isolation (%) of Fusarium, Penicillium, and Aspergillus in naturally contaminated oats at all storage conditions.
Fungal GeneraT (°C)Days0.70 aw0.90 aw0.95 aw
MEA+DG18+MEA+DG18+MEA+DG18+
Fusarium15107451224--
20443152011-
2010-49-3911-
20-49-641-
Penicillium151085968396100100
2077878191100100
20107999819789100
20729769976896
Aspergillus. sect. Nigri1510-3----
2031----
2010---1179
203--13329
Aspergillus. sect. Flavi1510------
20------
2010----5129
20----7371
“-” represents no growth. T: temperature. aw: water activity. DG18+: Dichloran Glycerol 18 agar + Chloramphenicol. MEA+: Malt Extract Agar + Chloramphenicol.
Table 3. Mean values (n = 3 ± SD) of respiration rates (µg CO2 kg−1 h−1) in naturally contaminated oats.
T °CDays0.70 aw0.90 aw0.95 aw
Naturally contaminated oats1500.4 ± 0.3 a1.9 ± 0.5 b8.4 ± 2.3 c
100.2 ± 0.6 a1.9 ± 0.6 b34.2 ± 4.0 c
200.2 ± 0.6 a2.1 ± 1.9 b29.8 ± 0.1 c
2001.3 ± 0.4 a10.8 ± 1.0 b11.7 ± 2.3 b
102.0 ± 1.0 a63.0 ± 11.7 b133.0 ± 0.0 c
203.4 ± 2.6 a48.0 ± 11.1 b111.2 ± 28.4 c
SD—standard deviation. T—temperature. aw—water activity. Different letters show significant differences in the RRs for each aw and days in each row.
Table 4. Mean values (n = 48) of the inter-day precision within-lab reproducibility (WLR) method validation for oat grains.
ComponentsRA (%)RSD (%)RE (%)SSE (%)LOD (µg/kg)LOQ (µg/kg)
HT-2 toxin88792964.113.6
HT-2-glucoside976104933.913.2
T-2 toxin819791023.712.4
Ochratoxin A9717105920.92.9
RA—apparent recovery, RE—extraction efficiency, RSD—relative standard deviation, SSE—signal suppression/enhancement, LOD—limit of detection, LOQ—limit of quantitation.
Table 5. The mean values (n = 4 ± SD) of the mycotoxin concentrations in the naturally contaminated oats.
Mycotoxins (µg/kg)
OchratoxinType A Trichothecenes
TreatmentT (°C)DaysawOTAHT-2-GlcHT-2T-2
Naturally
contaminated
oats
15100.7<LOQ *86.4 ± 41.8 a68.4 ± 34.6 a71.3 ± 67.1 a
0.9<LOQ *73.0 ± 24.7 a134 ± 35 b41.1 ± 22.7 c
0.9517.1 ± 16.8 *67.2 ± 14.5 a231 ± 154 a16.9 ± 16.8 b
200.7<LOQ *61.5 ± 6.5 a142 ± 93 a62.3 ± 47.3 a
0.924.5 ± 31.2 *60.0 ± 14.8 a102 ± 73 a44.9 ± 24.8 a
0.95187 ± 131 *44.8 ± 19.2 a130 ± 72 b18.6 ± 19.1 c
20100.7<LOQ *62.7 ± 11.3 a91.6 ± 54.5 a66.5 ± 9.1 a
0.95.4 ± 4.9 *43.8 ± 17.9 a41.3 ± 25.7 a27.1 ± 23.5 a
0.9519.0 ± 19.5 **47.5 ± 18.4 a58.0 ± 43.1 a18.1 ± 16.7 b
200.7<LOD *47.9 ± 27.4 a46.8 ± 21.7 a224 ± 268 a
0.948.2 ± 65.3 *46.1 ± 10.6 a36.7 ± 11.1 a1281 ± 1335 a
0.9586.2 ± 66.7 *22.8 ± 11.6 a<LOD b1471 ± 1131 a
SD—standard deviation. T-2—T-2 toxin. HT-2—HT-2 toxin. HT-2-glucoside. OTA—ochratoxin A. aw—water activity. T—temperature. LOD: limit of detection. LOQ: limit of quantitation. Concentrations of analytes <LOD and <LOQ are assigned with values of LOD/2 and LOQ/2 [31], respectively. Using non-parametric comparison for each pair (Wilcoxon method), different * show significant differences in OTA concentrations among aw for each day and each temperature (within the column). The same letters show no significant differences among the type A trichothecenes concentrations at each aw, each day, and each temperature (within each row).
Table 6. Pearson correlation coefficient (r) and p-values of respiration rates and mycotoxin concentrations in contaminated oats.
VariableCorrelations. Marked Correlations Are Significant at p < 0.05000 N = 60
CO2OTAHT-2 ToxinT-2 ToxinHT-2-GlcSum T2HT2HT2GLcSum T2HT-2
CO21.00000.5322−0.0916−0.1931−0.29020.0039−0.0192
p = ---p = 0.000p = 0.486p = 0.139p = 0.025p = 0.976p = 0.884
OTA0.53221.0000−0.0917−0.0763−0.2946−0.00090.0483
p = 0.000p = ---p = 0.486p = 0.562p = 0.022p = 0.995p = 0.714
HT-2 toxin−0.0916−0.09171.0000−0.16460.62740.01810.1194
p = 0.486p = 0.486p = ---p = 0.209p = 0.000p = 0.891p = 0.364
T-2 toxin−0.1931−0.0763−0.16461.0000−0.17160.87760.8708
p = 0.139p = 0.562p = 0.209p = ---p = 0.190p = 0.00p = 0.00
HT-2-Glc−0.2902−0.29460.6274−0.17161.0000−0.0807−0.0963
p = 0.025p = 0.022p = 0.000p = 0.190p = ---p = 0.540p = 0.464
Sum T2HT2HT2Glc0.0039−0.00090.01810.8776−0.08071.00000.9799
p = 0.976p = 0.995p = 0.891p = 0.00p = 0.540p = ---p = 0.00
Sum t2ht2−0.01920.04830.11940.8708−0.09630.97991.0000
p = 0.884p = 0.714p = 0.364p = 0.00p = 0.464p = 0.00p = ---
Table 7. Optimised MS/MS parameters for the analysed mycotoxins, including precursor ions, product ions, declustering potential (DP), collision energy (CE), and collision cell exit potential (CXP).
MycotoxinsPrecursor Ion (m/z) Product Ion (m/z)DP (V)CE (V)CXP (V)
T-2 toxin484.3215.2572917
484.3185.1273311
HT-2 toxin447.4345.11312720
442.2323.2501516
HT-2-Glucoside604.3323.11011716
604.3263.11012314
Ochratoxin A404.0239.0913716
404.0102.010210514
Disclaimer/Publisher’s Note: The statements, opinions and data contained in all publications are solely those of the individual author(s) and contributor(s) and not of MDPI and/or the editor(s). MDPI and/or the editor(s) disclaim responsibility for any injury to people or property resulting from any ideas, methods, instructions or products referred to in the content.

