Article

Toxicokinetics of a Single Oral Dose of Aflatoxin B1 in Plasma, Feces, and Urine of Male Donkeys

1
College of Animal Science and Technology, Shihezi University, Shihezi 832003, China
2
Shandong Key Laboratory of Gelatine Medicines Research and Development, Dong’e Ejiao Co., Ltd., Liaocheng 252201, China
3
State Key Laboratory of Animal Nutrition and Feeding, College of Animal Science and Technology, China Agricultural University, Beijing 100193, China
*
Authors to whom correspondence should be addressed.
These authors contributed equally to this work.
Toxins 2025, 17(4), 206; https://doi.org/10.3390/toxins17040206
Submission received: 7 March 2025 / Revised: 3 April 2025 / Accepted: 16 April 2025 / Published: 20 April 2025
(This article belongs to the Section Mycotoxins)

Abstract

:
Aflatoxin B1 (AFB1) is widely present in raw materials for food and feedstock, posing a significant threat to the health of humans and animals. This study explored the toxicokinetics of a single oral administration of AFB1 at a dose of 100 µg·kg−1 BW (body weight). Donkey blood samples were gathered at 0, 5, 10, 15, 20, 30, 45, and 60 min and at 1.5 h, 2 h, 2.5 h, 3 h, 3.5 h, 4 h, 4.5 h, 6 h, 9 h, 12 h, 24 h, 48 h, 72 h, 96 h, and 120 h through jugular vein sampling needles at intervals. Fecal and urinary samples were collected at 0 h and every 6 h thereafter until 120 h. The concentrations of AFB1 and AFM1 in plasma, urine, and feces were quantitatively analyzed using LC-MS/MS. The maximum concentrations of AFB1 and AFM1 in plasma were 13.10 ± 6.35 µg·L−1 and 0.72 ± 0.33 µg·L−1, occurring at 1.38 ± 0.89 h and 2.25 ± 1.57 h after oral administration, respectively. The AFB1 and AFM1 elimination half-lives (T1/2Elim) were 6.65 ± 2.84 h and 5.85 ± 3.00 h, respectively. The total clearances (CL) of AFB1 and AFM1 were 163 ± 52.2 L·kg−1 BW−1·h−1 and 3210 ± 2450 L·kg−1 BW−1·h−1, and the volumes of distribution (Vd) for AFB1 were 1440 ± 417 L·kg−1·BW and 22,400 ± 14,800 L·kg−1·BW, respectively. In addition, the total amounts of AFB1 and AFM1 excreted over 120 h through urine and feces accounted for 3.38 ± 0.92% and 3.44 ± 1.45% of the total intake, respectively (calculated by material mass). Furthermore, the research showed that the absorption and metabolism of AFB1 were rapid in male donkeys, with the tissue exhibiting a wide distribution and long duration.
Key Contribution: The toxicokinetics of aflatoxin B1 were studied after a single-dose oral administration in male Dezhou donkeys. Subsequently, the pharmacokinetic parameters of AFB1 in vivo were assessed, and the impact on the male donkeys was explored.

1. Introduction

Aflatoxin B1 (AFB1) was first discovered in the 1960s and caused the deaths of hundreds of thousands of turkeys in the UK [1,2]. AFB1 is produced by Aspergillus flavus and Aspergillus parasiticus during growth, storage, and processing and is widely present in corn, wheat, sorghum, rice, oats, rye, barley, soya, peanuts, and milk [3,4,5]. AFB1 poses a real threat to animal and human health [6]. Generally, the main route of AFB1 exposure is dietary, with minimal dermal and inhalation exposure [7]. AFB1 is transported to the liver through blood circulation for metabolism [8]. When the P450 enzyme system metabolizes AFB1, it produces the final carcinogen, AFB1-8,9-epoxide (AFBO). AFBO covalently bonds to proteins and DNA to form adducts and causes DNA mutations that can lead to tumorigenesis [9].
After entering the body orally, AFB1 is rapidly absorbed through the intestine. It then enters the bloodstream through hepatic–intestinal circulation and is metabolized and excreted as AFB1 and AFM1 through urine. Another portion is metabolized through the intestine and microbiota and excreted as AFB1 and AFM1 through feces.
Many animal diseases are caused by the consequences of AFB1 exposure, and it can affect vaccine-induced immunity [10,11]. Studies have reported that AFB1 causes hazardous toxicity and leads to several changes in plasma biochemical parameters [12]. Furthermore, the toxicokinetics of AFB1 have been studied in different kinds of animals, including ewes [13], rats [14], cows [3], monkeys [15], and equines [16]. Among different species, the toxicokinetic parameters of AFB1, including the peak time, half-life, and clearance rate, are significantly diverse. Previous research has shown that equines are sensitive to AFB1, with clinical signs and biochemical changes observed at various doses [16]. AFB1 can be metabolized into aflatoxin M1 (AFM1), AFB1-DNA, AFB1-lysine, and other metabolites. AFM1 is commonly present in cattle, milk, and humans, leading to many potential dietary exposure pathways [17]. According to reports, the incidence and contamination levels of AFM1 in milk samples were high [18,19,20]. Since 2002, the International Agency for Research on Cancer (IARC) has upregulated AFM1 from a Class 2B carcinogen to a Class 1 carcinogen [21]. AFB1-DNA [22] and AFB1-lysine are often used as biomarkers for AFB1 exposure [23,24]. AFB1-DNA adducts are considered the only intermediate product involved in AFB1-induced liver cancer [25]. The AFB1-lysine adduct in the blood is believed to reflect prolonged exposure, based on the longer half-life of human albumin compared to urinary metabolites, which reflects short-term excretion. Therefore, simultaneous exposure to these toxins poses a significant hazard [26].
Donkey meat and dairy products are increasingly favored by people in China due to their high nutritional value [27,28,29,30,31]. In addition, to our knowledge, there have been studies on the toxicokinetics of vomitoxins [32], ochratoxin [33], and zearalenone in donkeys [34]. Compared to other species, there are few reports on donkeys in terms of of AFB1. This study investigates the toxicokinetics of AFB1 after administering a single oral dose of aflatoxin B1 in male donkeys to estimate the metabolic degradation time of AFB1 in donkeys. Based on the results, suggestions can be provided to ensure food security.

2. Results

2.1. Detection Method Validation

A six-point, 1/x-weighted calibration curve (ACE/water, 50:50, v/v) was prepared from the mixture of target analytes (0.1~200 ng·mL−1) with 5 ng·mL−1 of 13C17-AFB1, and the determination coefficient (R2) for each analyte was greater than 0.99. The isotope internal standard dilution method was utilized for quantification, and sensitivity, accuracy, and precision tests were performed on each sample matrix. The limit of quantification (LOQ, 10 × signal-to-noise) for AFB1 and AFM1 was 0.5 ng·mL−1 for urine, 0.1 ng·mL−1 for plasma, and 1.0 ng·g−1 for fecal samples, respectively. The recovery rates of standard samples in various matrices were higher than 80.8%, with the relative standard deviation (RSD) lower than 13.6%. The detailed verification results are shown in Table 1 and Figure 1. Additionally, a chromatogram for the analytes in a plasma sample is presented in Figure 1.
The recovery and relative standard deviation (RSD) in plasma, feces, and urine were validated at low, medium, and high concentrations of AFB1.

2.2. Plasma Toxicokinetic Parameters of AFB1 and AFM1

None of the donkeys employed showed noticeable adverse effects on their health during the experimental period. As shown in Table 2, the average weight of the male donkeys was 124.25 ± 2.75 kg. After a single oral administration of AFB1 (100 µg·kg−1·BW), AFB1 entered the circulatory system and was absorbed.
Plasma samples were collected regularly to detect the concentrations of AFB1 and AFM1. Non-compartmental methods were used to evaluate the toxicokinetic parameters of AFB1. The concentration of AFB1 in plasma reached its peak concentration (Cmax = 15.6 ± 6.88 µg·L−1) at 1.38 ± 0.89 h (Tmax) after administration. The elimination half-life (T1/2Elim) was 6.65 ± 2.84 h. The area under the plasma concentration–time curve (AUC0-inf) was 82.6 ± 24.3 µg·L−1·h. The total plasma clearance rate was 163 ± 52.2 L·kg·BW−1·h−1. In addition, the volume of distribution was 1440 ± 417 L·kg−1·BW.
The AFM1 concentration in plasma reached a peak concentration (Cmax = 0.72 ± 0.33 µg·L−1) at 2.25 ± 1.57 h after oral administration (Table 2). The elimination half-life of AFM1 was calculated as 5.85 ± 3.00 h, the area under the plasma concentration–time curve (AUC0-inf) was 5.50 ± 2.93 µg·L−1·h, and the total plasma clearance (Cl) was 3210 ± 2450 L·kg·BW−1·h−1. The volume of distribution (Vd) was 22,400 ± 14,800 L·kg−1·BW.

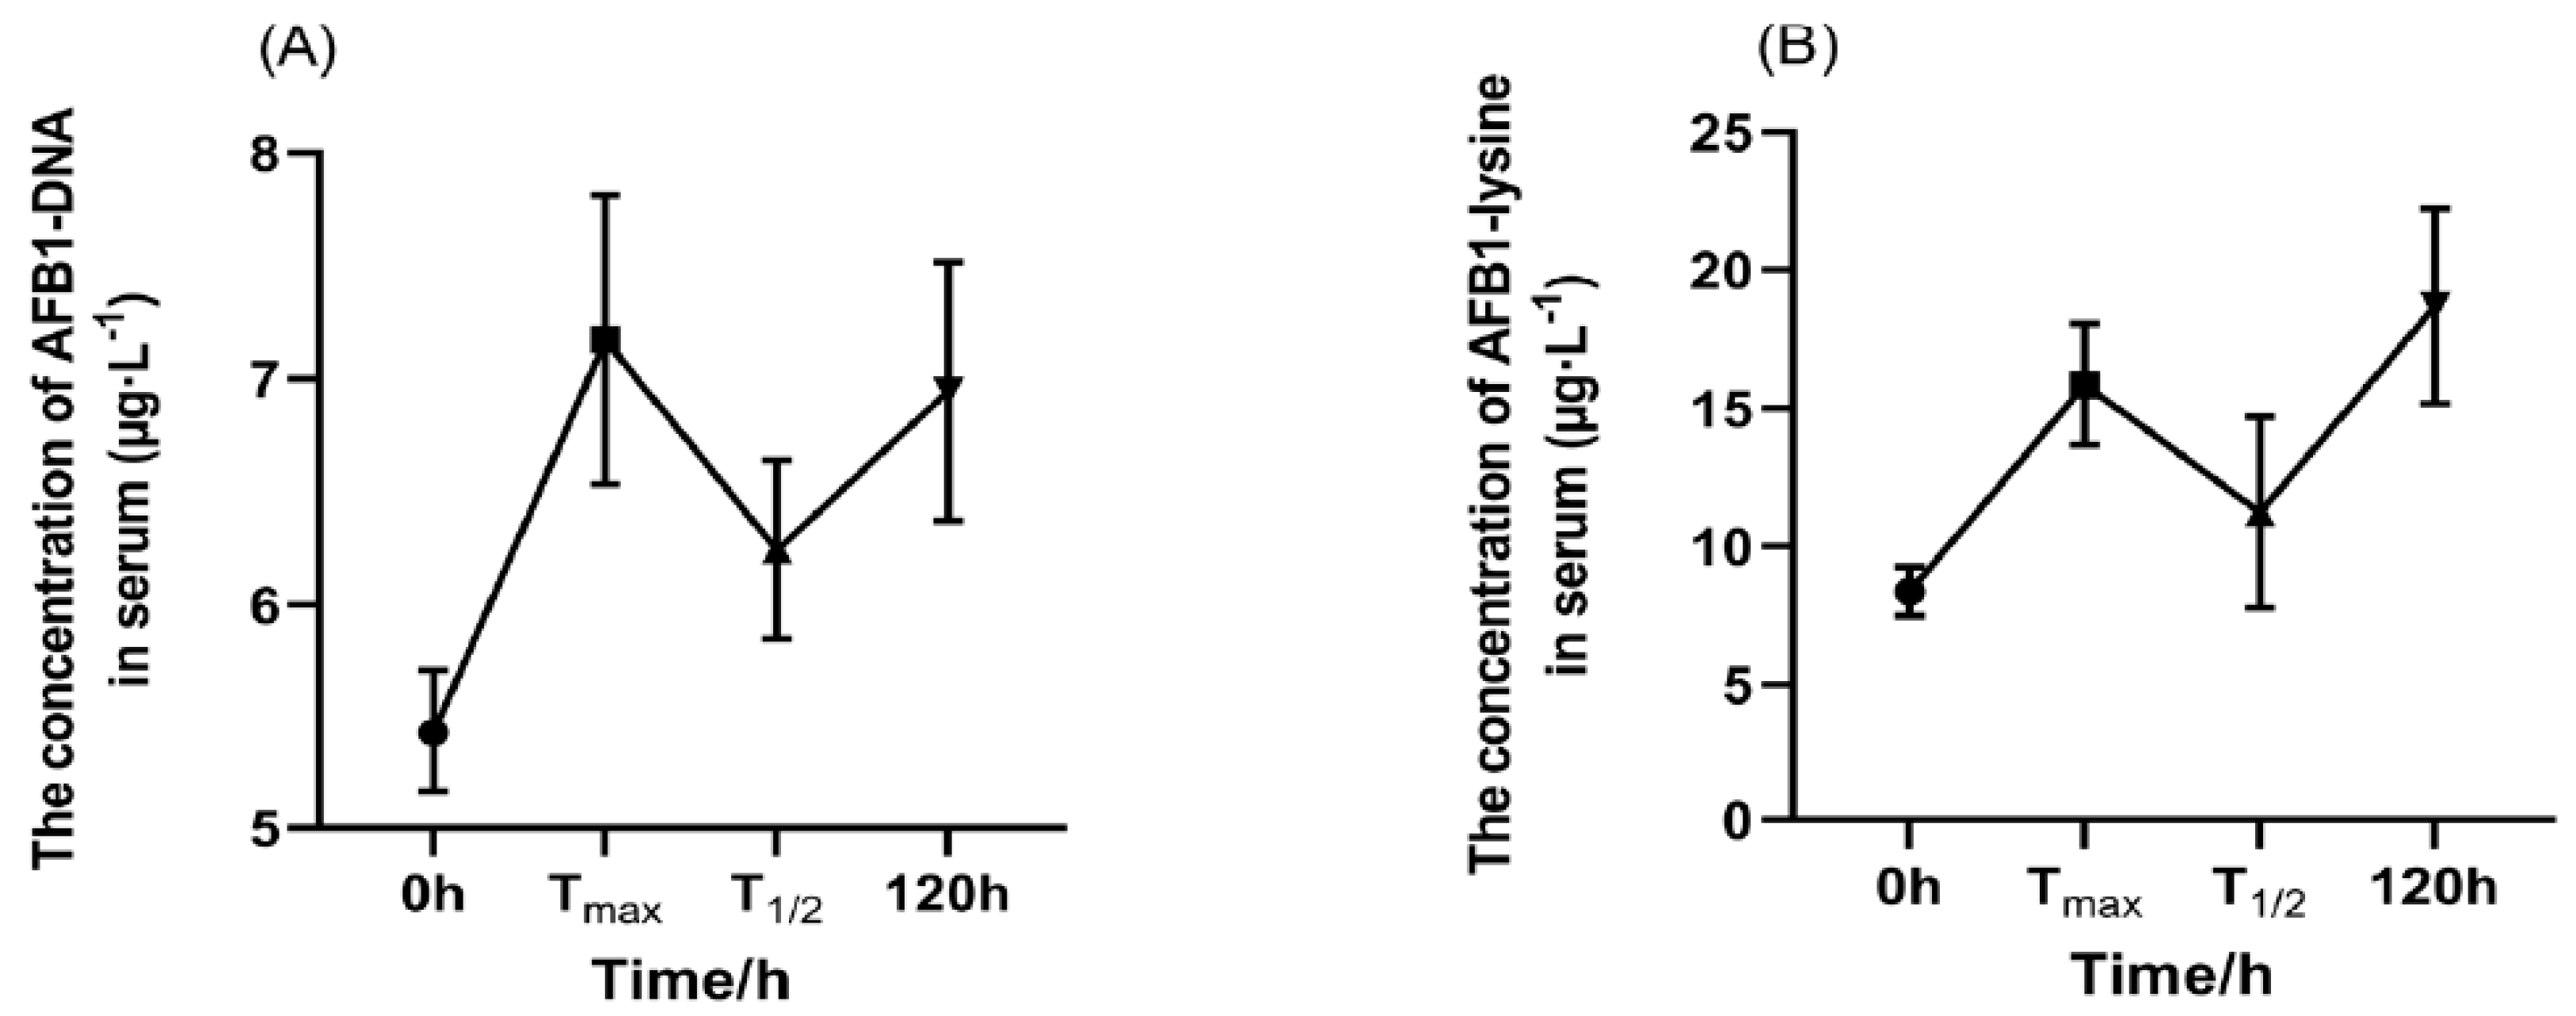
2.3. Plasma Concentration of AFB1 and AFM1

AFB1 and AFM1 were detected in plasma samples just 5 min after a single dose of gavage administration of AFB1 (100 µg·kg−1·BW). As shown in Figure 2A, the concentration of AFB1 increased, leading to a peak concentration (Cmax) of 15.6 ± 6.88 µg·L−1, while the time to reach the peak concentration (Tmax) was 1.38 ± 0.89 h. Meanwhile, as depicted in Figure 2B, the concentration of AFM1 in plasma was lower compared to that of AFB1, with a maximum concentration (Cmax) of 0.72 ± 0.33 µg·L−1, and it reached the peak (Tmax) at 2.25 ± 1.57 h.

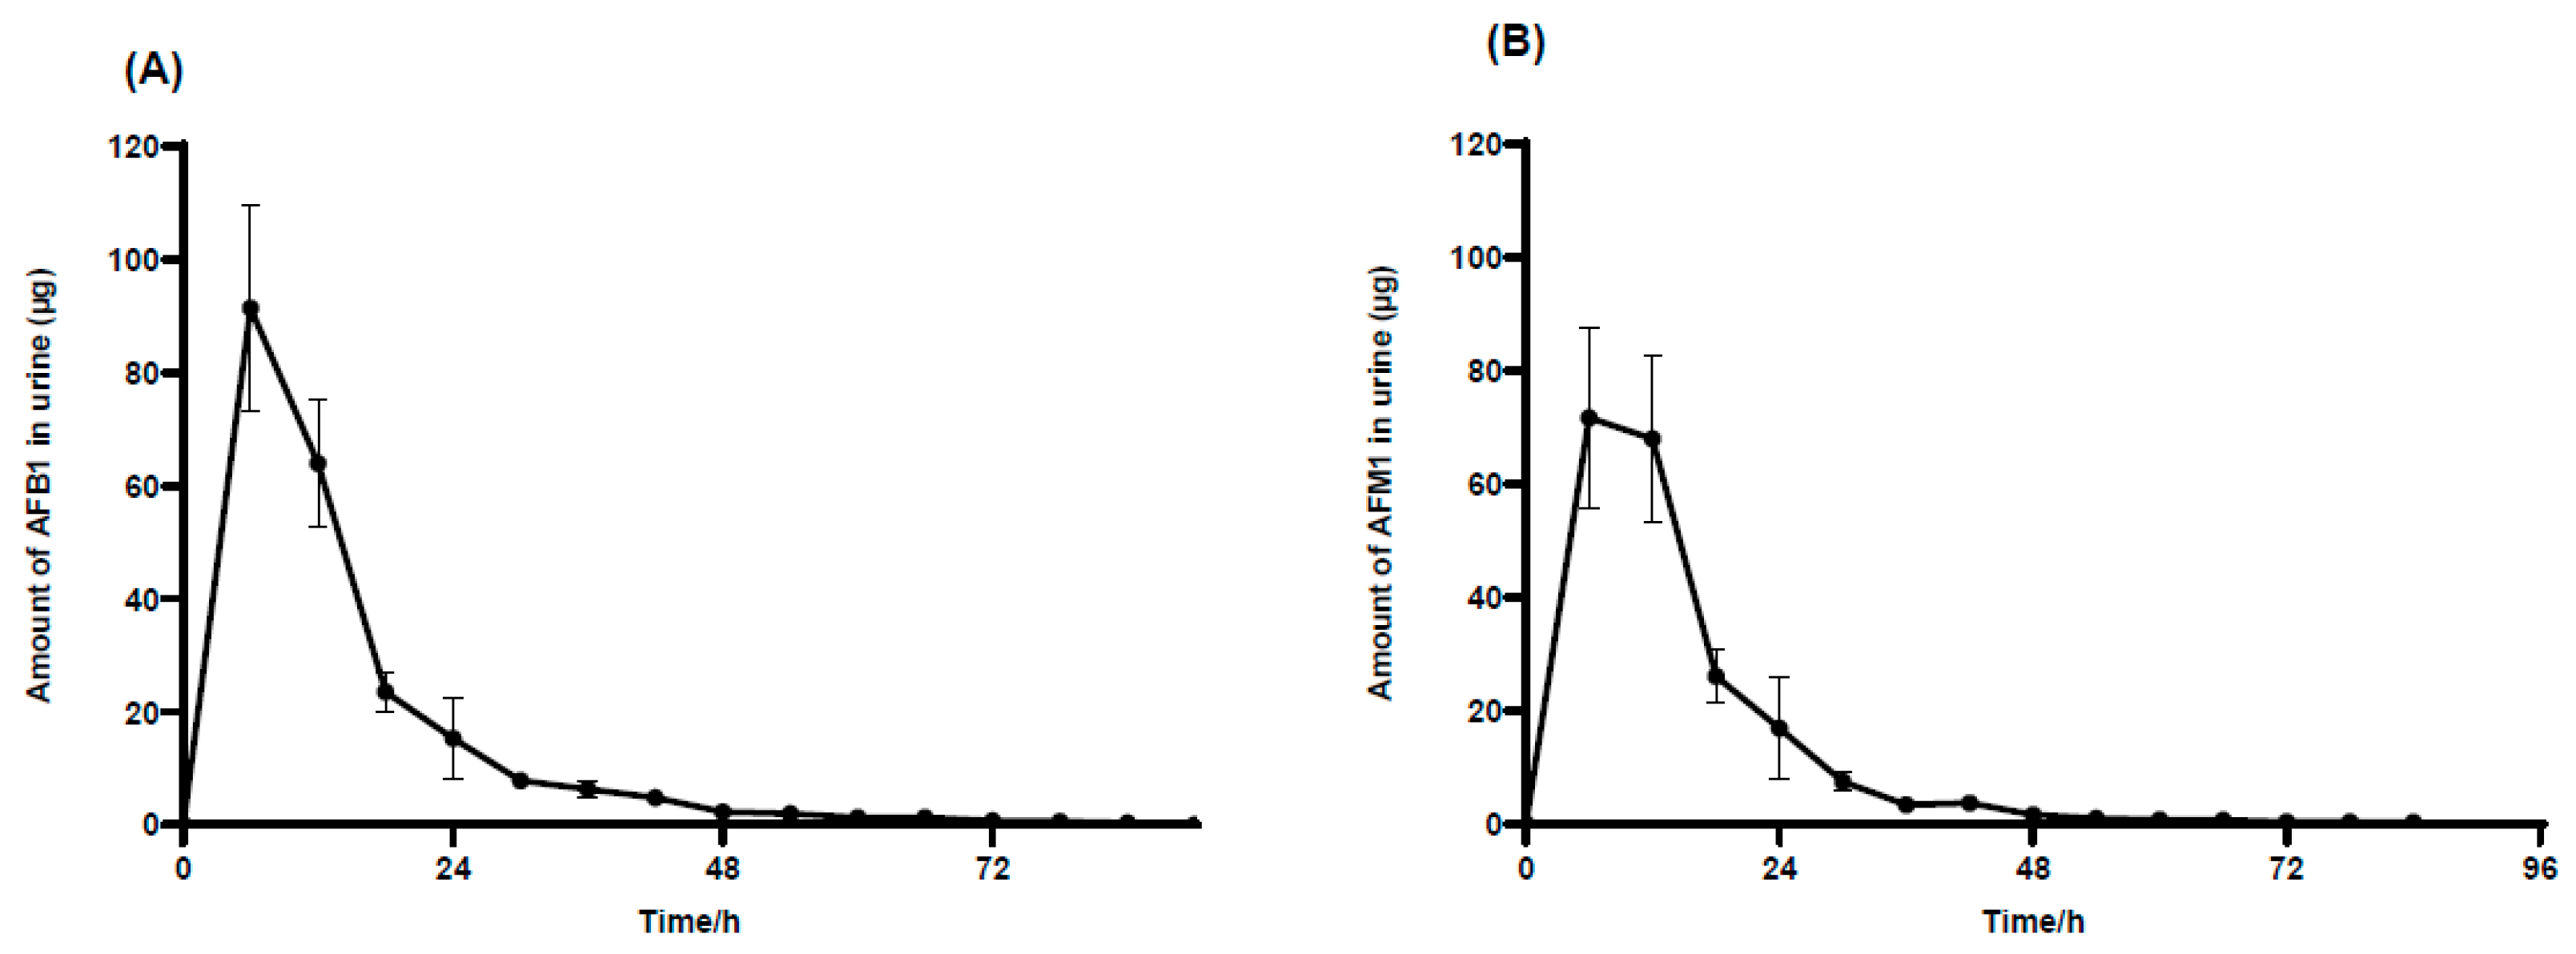
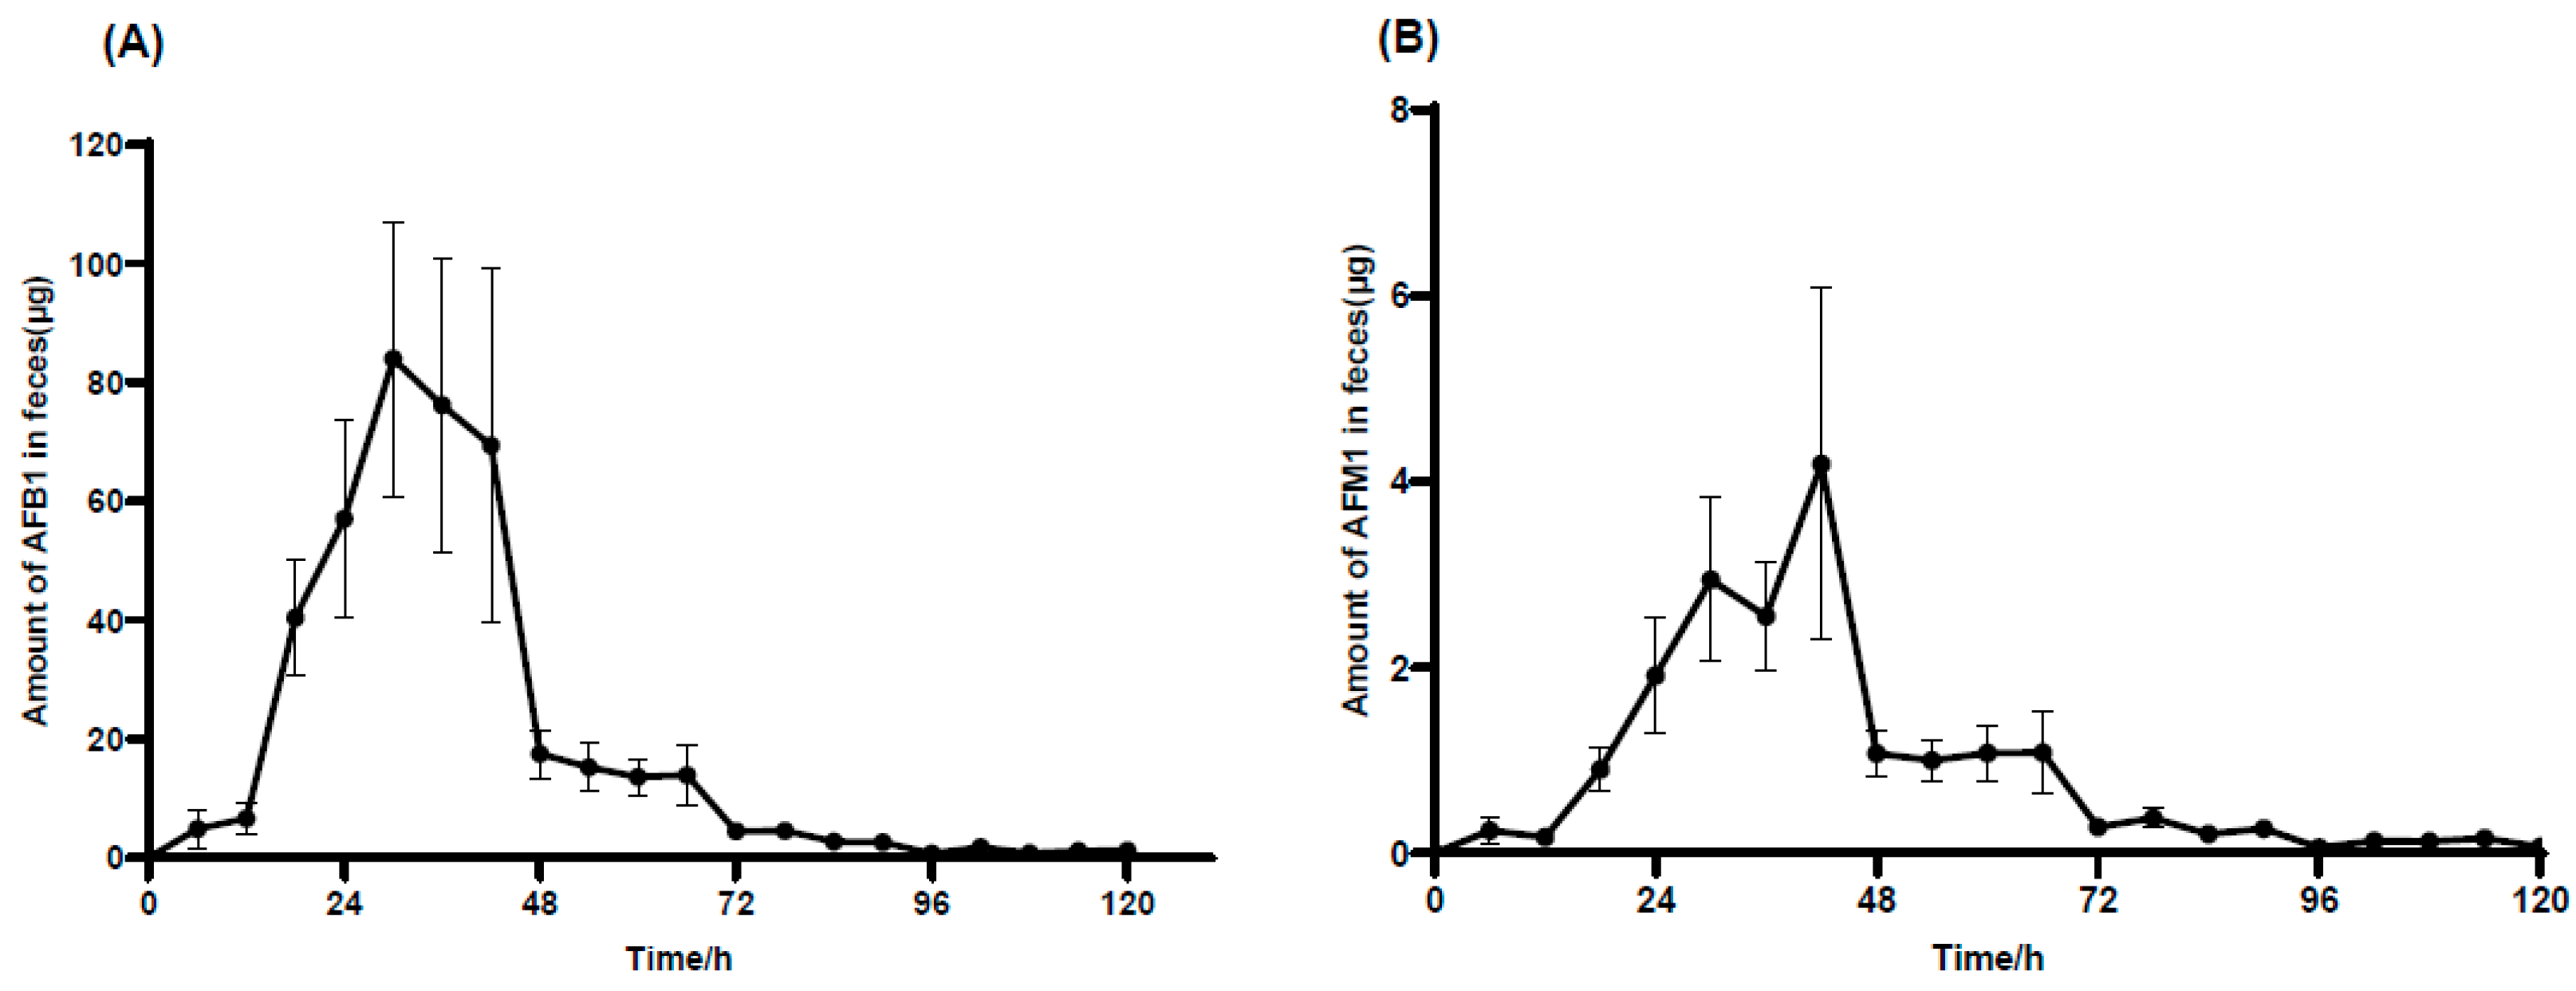
2.4. Recovery of AFB1 and AFM1 in Urine and Feces

As depicted in Figure 3A, AFB1 was detected 6 h after oral administration, and the excretion subsequently peaked in urine. Thereafter, AFB1 excretion significantly decreased from 6 to 24 h, and only trace levels of AFB1 were detected after 48 h. Ultimately, AFB1 was not detected after 90 h. Figure 3B illustrates that the metabolite AFM1 reached its maximum excretion at 6 h post-administration. The excretion of AFM1 then slightly decreased from 6 to 12 h, followed by a significant drop from 12 to 30 h. Finally, AFM1 was no longer detectable by 84 h.
Figure 4A shows that the excretion of AFB1 in feces was detected at 6 h and peaked at 30 h. Subsequently, the excretion declined slowly from 30 to 42 h, followed by a sharp decrease in AFB1 excretion after 42 h. The excretion of AFB1 was detected in trace levels at 120 h. As shown in Figure 4B, AFM1 was detected at 6 h and reached its peak at 42 h in feces. It then began to decrease, experiencing a rapid decline from 42 to 72 h. By 120 h, only tiny quantities of AFM1 were detected in feces.
According to Table 3, the single dose of AFB1 that was given to the donkeys amounted to 12,420 ± 270 µg. Subsequently, AFB1 and AFM1 were excreted through both urine and feces. The results indicated that the fecal excretion rate of AFB1 and AFM1 constituted 3.44 ± 1.45% of the total AFB1 intake, whereas the absorption rate was 96.56 ± 1.45%. In contrast, the total amount of AFB1 and AFM1 that was excreted in the urine accounted for 3.28 ± 0.92% of the total intake.
The concentrations of AFB1-DNA and AFB1-lysine in blood were also found with some fluctuation. According to Figure 5A,B, these concentrations reached their first peak at the test Tmax and subsequently decreased. At T1/2Elim, the concentration of AFB1-DNA and AFB1-lysine in blood was the lowest at 6.24 µg·L−1 and 11.24 µg·L−1, respectively. The concentrations once again reached 6.95 µg·L−1 and 18.69 µg·L−1 at 120 h.

3. Discussion

Historically, donkeys were a source of agricultural labor and pet companions and provided high-quality meat, dairy products, and raw materials for traditional Chinese medicine [35,36]. Previous studies have shown that the toxicokinetics of AFB1 significantly vary among animals, including the process of absorption, clearance, and excretion. At present, there has been no research on the toxicokinetics of AFB1 ingestion in donkeys, whether through oral or other administration methods. This study utilized donkeys as subjects to investigate the toxicokinetics of AFB1 and aimed to clarify its pharmacokinetics following ingestion. As indicated in Table 4, the donkeys exhibited more extensive and pronounced toxicokinetic parameters compared to other animals.
After being orally administered a 100 µg·kg−1·BW AFB1 dose, it was quickly absorbed into the body and reached its peak concentration rapidly. The peak concentration of AFB1 in this study was 15.6 ± 6.88 µg·L−1 (Cmax), and the peak time occurred at 1.38 ± 0.89 h (Tmax). Compared to humans (Tmax = 1.02 ± 0.31 h) [37], broilers (Tmax = 0.3 ± 0.1 h) [38], rats (Tmax = 0.17 h) [14], and cows (Tmax = 0.42 h, Tmax = 0.58 ± 0.17 h) [3], the peak concentration for donkeys (Tmax = 1.38 ± 0.89 h) was longer and reflected a slower rate of absorption. The AFB1 levels in plasma were different and might have been caused by highly individual variability, probably related to differences in plasma volume or the other passage of toxins through the gastrointestinal mucosa [39]. In addition, studies on cows have shown a terminal elimination half-life (T1/2) of 15.5 ± 0.51 h and 1.28 h in pregnant mice [40]. These findings indicated a longer T1/2 (6.65 ± 2.84 h) in donkeys compared to pregnant mice but a significantly shorter one than in cows. Previous studies have shown that cows, beef, and cattle were more susceptible to AFB1 than sheep or equines, which was consistent with the results of this study [41].
Many published papers have shown that when cows were fed with 4 μg·kg−1·BW of AFB1, AFM1 reached its peak concentration (0.5 ± 0.1 µg·L−1) at 4 h [42]. In contrast, in this study, the AFM1 peak time for male donkey plasma was 2.25 ± 1.57 h (0.72 ± 0.33 µg·L−1). Compared to cows, donkeys exhibited a longer Tmax for AFM1 concentration in the plasma. Additionally, the plasma ratio of AFM1 to AFB1 increased from 0 at 0.08 h to 0.07 at 0.16 h and reached 0.09 at 9 h. When the plasma AFB1 concentration was below 2.4 µg·L−1, AFM1 was not detected in the plasma. The phenomenon resulted from the ffact that the conversion of AFB1 to AFM1 was lower than the body’s ability to clear AFM1 through feces and urine, preventing metabolite accumulation in the bloodstream [8]. Furthermore, the donkeys had a lower rate of AFB1 conversion to AFM1 [3]. The differences in plasma Cmax can be attributed to factors such as species, AFB1 intake, gastrointestinal absorption, and health status, particularly the activity of cytochrome P450 (CYP450) enzymes, which play an important role in the conversion of AFB1 to AFM1 in the liver [43,44].
This study also conducted relevant research on the biomarkers AFB1-DNA and AFB1-lys adducts in serum [45]. According to previous studies, AFB1-DNA was produced by the P450 enzyme system and was metabolized into AFB1-8,9-epoxide, which covalently bound to DNA and lysines to form AFB1-DNA and AFB1-lys, respectively [46]. Furthermore, AFB1-DNA adducts were considered the only intermediate products involved in the development of liver cancer [25], while AFB1-lys served as a valuable biomarker for long-term exposure [47,48]. In this experiment, AFB1-DNA adducts were detected at 0 h, Tmax, half-life, and 120 h. The results showed that the first peak appeared at Tmax and that the half-life was the lowest, but the concentration remained high at 120 h. Additionally, the growing-stage male donkeys exhibited a higher absorption rate of AFB1. In this study, the total amount of AFB1 excreted in feces and urine was 833.25 μg, and most of the AFB1 entered the body and was transported to various parts of the body through body fluids. This research demonstrated that it was bound with serum proteins to form various adducts that remained between tissues and were slowly metabolized.
AFB1 is absorbed into the blood through the gastrointestinal tract and then transported by the bloodstream to various tissues. The existing literature has shown that the apparent distribution volume (Vd) of broiler chickens was 18.4 ± 7.7 L·kg−1 [38]. Researchers explored the Vd values for toxicokinetics in OTA (0.15 ± 0.036 L·kg−1·BW) [33], DON (2.82 ± 0.35 L−1·kg·BW) [32], and ZEN (216.17 ± 58.71 L−1·kg·BW) on donkeys [34]. In this study, the Vd value was determined to be 1440 ± 417 L·kg−1·BW when compared to OTA, ZEN, and DON, suggesting a significantly wider tissue distribution of AFB1 in the body. However, this finding needs to be supported by further validation.
Previous studies have shown that AFB1 was absorbed through the gastrointestinal tract, was mainly metabolized in the liver, and was excreted through the urine [13]. Moreover, undigested substances in the gastrointestinal tract were excreted through the feces [49]. In this research, the outputs of AFB1 and AFM1 in the feces and urine were 409.30 ± 172.57 μg and 17.89 ± 8.40 μg, while the figures for lambs and ewes were 210.86 ± 46.39 μg and 195.20 ± 66.62 μg, respectively [50,51]. However, the AFB1 excretion rate in male donkeys (6.72%) was higher than in ewes (5.3%). This result may be related to the type and size of the animal, the method of digestion, and the dosage of the toxin.

4. Conclusions

In summary, male donkeys demonstrated a high absorption rate of 93.28% following a single oral dose of 100 µg·kg−1 BW of AFB1, with plasma levels peaking at 1.38 ± 0.89 h and maximum fecal and urinary excretion at 6 h. By 120 h post-administration, the cumulative excretion rates of AFB1 and AFM1 were 3.44% and 3.28%, respectively. The complex elimination process indicated that AFB1 was primarily metabolized in donkeys by rapidly forming other metabolites in the liver, with only a small fraction excreted as AFB1 and AFM1 in feces and urine.

5. Materials and Methods

5.1. Chemicals, Products, and Reagents

The standard samples of aflatoxin B1 (AFB1) and aflatoxin M1 (AFM1) were acquired from Fermentek (Jerusalem, Israel) for analysis. The 13C17-aflatoxin B1 (13C17-AFB1) isotope-labeled internal standard (IS) was purchased from Romer Labs (Tulln, NÖ, Austria). Additionally, the above standard chemicals were appropriately diluted with acetonitrile (ACN) to prepare 5 µg·mL−1 stock solutions, which were then stored in brown glass bottles at temperatures below −18 °C. LC-MS grade ACN, methanol (MeOH), and formic acid (FA) were bought from Thermo Fisher Scientific (Pittsburgh, PA, USA). Moreover, ultrapure water (18.2 MΩ cm) was self-made using the Bedford Millipore Milli-Q system (Bedford, OH, USA). Analytical-grade anhydrous magnesium sulfate (MgSO4) and sodium chloride (NaCl) were obtained from Sinopharm Chemical Reagent Co., Ltd. (Beijing, China). Octadecyl-bonded silica (C18, 50 μm) and primary–secondary amine (PSA, 40–60 μm) were also acquired from Bonna-Agela Technologies (Tianjin, China). Furthermore, the ELISA quantitative detection kits for AFB1-DNA and AFB1-lysine adducts were purchased from Hengyuan Biological (Shanghai, China).

5.2. Animal and Treatment

This study was conducted according to the Guidelines for Experimental Animals of the Ministry of Science and Technology (Beijing, China) and was approved by the Bioethics Committee of Shihezi University (NO.A 2023-201, 6 March 2023). Six healthy 9-month-old male donkeys, weighing 124.25 ± 2.75 kg, were chosen and were fed in metabolic cages individually to collect fecal and urine samples accurately. Additionally, the metabolic cages provided suitable movement space for the donkeys. After a 5-day acclimation period, overnight fasting was performed, and blood, feces, and urine samples were collected 4 h before the test. AFB1 standards were dissolved in DMSO (stock 1 mg·mL−1) and were then diluted with normal saline to a working solution at a concentration of 0.5 mg·mL−1 [40]. This working concentration was administered as a single dose of 100 µg·kg−1·BW and was infused into the donkeys’ pharynx through an oral catheter [52].

5.3. Sample Collection

Each time, 10 mL blood samples were gathered from the jugular vein of the donkeys using heparin sodium vacuum tubes before administration (0 min) and then at 5, 10, 15, 20, 30, 45, and 60 min and at 1.5 h, 2 h, 2.5 h, 3 h, 3.5 h, 4 h, 4.5 h, 6 h, 9 h, 12 h, 24 h, 48 h, 72 h, 96 h, and 120 h after oral administration. The blood was then centrifuged at 4500 rpm for 10 min, after which the plasma was separated into 1 mL EP tubes using a pipetting gun. These plasma samples were labeled and then placed in the refrigerator at −20 °C. Additionally, urine volumes and feces weights were collected individually before administration (0 h) and at 6 h, 12 h, 18 h, 24 h, 30 h, 36 h, 42 h, 48 h, 54 h, 60 h, 66 h, 72 h, 78 h, 84 h, 90 h, 96 h, 102 h, 108 h, 114 h, and 120 h after the gavage of the AFB1 working solution. Urine samples were then loaded into 15 mL gauge centrifuge tubes, and the feces were mixed and collected into ziplock bags. These samples were then stored at −20 °C. All samples were carefully marked and recorded for further detection and analysis.

5.4. Sample Treatment

Mycotoxin extraction and cleanup procedures were conducted as previously reported with a few modifications [53]. Initially, a 500 μL plasma sample was spiked with 10 μL of IS working solution (100 ng·mL−1 in ACN) and 1.5 mL of 0.5% FA-ACN (v/v), followed by vortex mixing for 30 s. Subsequently, 0.2 g of MgSO4 and 0.2 g of NaCl were added, and the mixture was shaken for 2 min. The test samples were then centrifuged at 8000 rpm for 5 min. After centrifugation, the entire liquid supernatant was desiccated under a mild nitrogen flow at 50 °C, and the residue was subsequently dissolved in 200 μL of ACN/water (50:50, v/v).
Next, a 200 μL urine sample was treated with 40 μL of IS working solution (100 ng·mL−1 in ACN), followed by the addition of 560 μL of 0.5% FA-ACN (v/v). This mixture was mixed using a vortex for 30 s and centrifuged at 10,000 rpm for 2 min.
The freeze-dried fecal sample was ground into a fine powder, and then 200 mg was weighed into a 10 mL plastic centrifuge tube. This sample was spiked with 4 μL of IS stock solution (5 μg·mL−1 in ACN) and sonicated with 2 mL of 0.5% FA-ACN (v/v) for 20 min. After sonication, the mixture was centrifuged at 8000 rpm for 5 min at room temperature, yielding a supernatant of 0.5 mL.
Finally, the levels of AFB1-DNA and AFB1-lys adducts in serum were determined using competitive ELISA kits. The absorbance (OD) value was read at a wavelength of 450 nm, and the adduct content was calculated according to the standard curve.

5.5. Standard Solutions

The AFB1 and AFM1 mixed standard solution working liquid was prepared as follows: with 50% acetonitrile water (ACE/water, 50:50, v/v) as the solvent, an appropriate amount of AFB1 and AFM1 single standard solution (100 μg·mL−1) was accurately removed and prepared into a AFB1 and AFM1 mixed standard solution working liquid with a mass concentration of 1 μg·mL−1.
The 13C17-AFB1 standard solution working liquid was prepared as follows: with 50% acetonitrile water as the solvent, an appropriate amount of 13C17-AFB1 single standard solution was accurately removed and prepared into a 13C17-AFB1 standard solution working liquid with a mass concentration of 0.1 μg/mL.
The AFB1 and AFM1 series calibration standard solutions were prepared as follows: With AFB1 and AFM1 as the targets, 13C17-AFB1 as the internal quantitative standard, 50% acetonitrile water as the solvent, an AFB1 and AFM1 mixed standard solution working solution, and a 13C17-AFB1 standard solution working solution, the solvent dilution method was adopted. AFB1 and AFM1 series calibration standard solutions with target concentrations of 0.1, 1, 5, 10, 50, and 200 ng·mL−1 and an internal isotope standard fixed at 5 ng·mL−1 were prepared.

5.6. Method Validation

The quantitative analytical methods were validated according to the validation protocol of Wang et al. The analytes in the samples were qualitatively identified by comparing the abundance ratio of the qualitative ion pairs (±20%) and the retention time (±0.1) with those in standard solutions. 13C17-AFB1 was used as the IS for the quantitation analysis of all target compounds. The concentration corresponding to 3 times the signal-to-noise ratio (S/N) was used as the instrument detection limit (LOD), and the concentration corresponding to 10 times the signal-to-noise ratio (S/N) was used as the instrument quantitative limit (LOQ). Three different levels of mixed toxin standards, i.e., low concentration (2 µg·L−1 or 2 µg·kg−1), medium concentration (10 µg·L−1 or 10 µg·kg−1), and high concentration (100 µg·L−1 or 100 µg·kg−1), were added to blank plasma, urine and fecal samples were used for recovery validation, according to the 5.4 sample pretreatment method, with 5 parallel samples for each concentration, and the recovery rate and precision were calculated.

5.7. UPLC-MS/MS Analysis

AFB1 and its metabolite AFM1 were identified and quantified using a Waters ACQUITY UPLC system coupled with a XEVO TQ-S electrospray triple-quadrupole mass spectrometer (LC-MS/MS) (Milford, CT, USA) operating with negative ESI and in the multiple reactions monitoring (MRM) mode. Detailed instrumental parameters are provided in Table 5.

5.8. Statistical Analysis

Statistical analysis was conducted using the standardized concentration of AFB1. Subsequently, the toxicokinetic parameters of AFB1 in the plasma were calculated using the non-compartmental model of the WinNonlin 5.2.1 software (Certara, Inc., Princeton, NJ, USA). Next, concentration–time curves were drawn based on the mean concentrations of AFB1 and its metabolite AFM1 in the plasma of the experimental donkeys at different times. Similarly, corresponding excrement curves were also drawn based on the total excretion of AFB1 and its metabolite AFM1 in urine and feces at various times using GraphPad Prism 9.4.1 (GraphPad Software, Inc., San Diego, CA, USA). Finally, the mean value of the data was represented by ± SEM (the standard error of the mean).

Author Contributions

Conceptualization, Q.M. and B.J.; funding acquisition, Q.M.; formal analysis, Y.F., B.D. and H.Q.; methodology, Y.F., P.L. and Y.Z.; project administration, Y.W.; software, Y.F. and H.Q.; supervision, Q.M., B.J. and G.L.; validation, Y.F., H.Q. and M.L.; writing—original draft preparation, Y.F.; writing—review and editing, Q.M. and B.J. All authors have read and agreed to the published version of the manuscript.

Funding

This research was funded by Hebei Province Modern Agricultural Industry Technology System (HBCT2024280203), National Key R&D Program of China (2023YFD1302000), and Taishan Leading Industry Talents—Agricultural Science of Shandong Province (LJNY202022).

Institutional Review Board Statement

This study was conducted following the Guidelines for Experimental Animals of the Ministry of Science and Technology (Beijing, China) and was approved by the Bioethics Committee of Shihezi University (NO.A2023-201, 6 March 2023).

Informed Consent Statement

Not applicable.

Data Availability Statement

The original contributions presented in this study are included in the article. Further inquiries can be directed to the corresponding authors.

Acknowledgments

We are grateful to the staff of the donkey farm for their support and assistance.

Conflicts of Interest

Min Li, Honglei Qu, Boying Dong, Yantao Wang, Guangyuan Liu and Qiugang Ma were employed by the company Dong-E-E-Jiao Co., Ltd. The remaining authors declare that the research was conducted in the absence of any commercial or financial relationships that could be construed as a potential conflict of interest.

References

  1. Asao, T.; Büchi, G.; Abdel-Kader, M.M.; Chang, S.B.; Wick, E.L.; Wogan, G.N.; Asao, T.; Büchi, G.; Abdel-Kader, M.M.; Chang, S.B. Aflatoxins B and G. J. Am. Chem. Soc. 1963, 85, 1706–1707. [Google Scholar] [CrossRef]
  2. Asao, T.; Buechi, G.; Abdelkader, M.; Chang, S.; Wick, E.; Wogan, G.; Kader, M.A.; Agerwick, E. The Structures of Aflatoxins B and G. J. Am. Chem. Soc. 1965, 87, 882. [Google Scholar] [CrossRef]
  3. Gallo, A.; Moschini, M.; Masoero, F. Aflatoxins absorption in the gastro-intestinal tract and in the vaginal mucosa in lactating dairy cows. Ital. J. Anim. Sci. 2016, 7, 53–63. [Google Scholar] [CrossRef]
  4. Khodaei, D.; Javanmardi, F.; Khaneghah, A.M. The global overview of the occurrence of mycotoxins in cereals: A three-year survey. Curr. Opin. Food Sci. 2021, 39, 36–42. [Google Scholar] [CrossRef]
  5. Busby, W.F.; Wogan, G.N. Food-borne mycotoxins and alimentary mycotoxicoses. In Food-Borne Infections and Intoxications; Academic Press: New York, NY, USA, 1979. [Google Scholar]
  6. Congcong, L.; Xiangdong, L.; Jiao, W.; Xiangbo, J.; Qiuliang, X. Research progress in toxicological effects and mechanism of aflatoxin B1 toxin. PeerJ 2022, 10, e13850. [Google Scholar]
  7. Capriotti, A.L.; Caruso, G.; Cavaliere, C.; Foglia, P.; Samperi, R.; Laganà, A. Multiclass mycotoxin analysis in food, environmental and biological matrices with chromatography/mass spectrometry. Mass Spectrom. Rev. 2012, 31, 466–503. [Google Scholar] [CrossRef] [PubMed]
  8. Yiannikouris, A.; Jouany, J.P. Mycotoxins in feeds and their fate in animals: A review. Anim. Res. 2002, 51, 81–99. [Google Scholar] [CrossRef]
  9. Chen, L.; Wen, T.; Cao, A.; Wang, J.; Pan, H.; Zhao, R. Bile Acids Promote Hepatic Biotransformation and Excretion of Aflatoxin B1 in Broiler Chickens. Toxins 2023, 15, 694. [Google Scholar] [CrossRef]
  10. Desjardins, A. Mycotoxins: Risks in plant, animal and human systems. AAHE-ERIC/High. Educ. Res. Rep. 2003, 9, 48–50. [Google Scholar]
  11. Zhang, K.; Lian, S.; Shen, X.; Zhao, X.; Zhao, W.; Li, C. Recombinant porcine beta defensin 2 alleviates inflammatory responses induced by Escherichia coli in IPEC-J2 cells. Int. J. Biol. Macromol. 2022, 208, 890–900. [Google Scholar] [CrossRef]
  12. Vaziriyan, M.; Banaee, M.; Haghi, B.N.; Mohiseni, M. Effects of dietary exposure to aflatoxins on some plasma biochemical indices of common carp (Cyprinus carpio). Iran. J. Fish. Sci. 2018, 17, 487–502. [Google Scholar]
  13. Battacone, G.; Nudda, A.; Cannas, A.; Borlino, A.C.; Bomboi, G.; Pulina, G. Excretion of Aflatoxin M1 in Milk of Dairy Ewes Treated with Different Doses of Aflatoxin B1. J. Dairy Sci. 2003, 86, 2667–2675. [Google Scholar] [CrossRef]
  14. Corcuera, L.A.; Vettorazzi, A.; Arbillaga, L.; González-Peñas, E.; López de Cerain, A. An approach to the toxicity and toxicokinetics of aflatoxin B1 and ochratoxin A after simultaneous oral administration to fasted F344 rats. Food Chem. Toxicol. 2012, 50, 3440–3446. [Google Scholar] [CrossRef] [PubMed]
  15. Wong, Z.A.; Hsieh, D.P.H. The comparative metabolism and toxicokinetics of aflatoxin B1 in the monkey, rat, and mouse. Toxicol. Appl. Pharmacol. 1980, 55, 115–125. [Google Scholar] [CrossRef]
  16. Cysewski, S.J.; Pier, A.C.; Baetz, A.L.; Cheville, N.F. Experimental equine aflatoxicosis. Toxicol. Appl. Pharmacol. 1982, 65, 354–365. [Google Scholar] [CrossRef]
  17. Laura, G.; Walter, M.; Tecla, C.; Claudia, S.; Stefania, C.; Luciano, P. AFM1 in Milk: Physical, Biological, and Prophylactic Methods to Mitigate Contamination. Toxins 2015, 7, 4330–4349. [Google Scholar] [CrossRef] [PubMed]
  18. Iqbal, S.Z.; Jinap, S.; Pirouz, A.A.; Faizal, A.R.A. Aflatoxin M1 in milk and dairy products, occurrence and recent challenges: A review. Trends Food Sci. Technol. 2015, 46, 110–119. [Google Scholar] [CrossRef]
  19. Londoño, V.A.G.; Boasso, A.C.; Paula, M.C.Z.d.; Garcia, L.P.; Scussel, V.M.; Resnik, S.; Pacín, A. Aflatoxin M1 survey on randomly collected milk powder commercialized in Argentina and Brazil. Food Control 2013, 34, 752–755. [Google Scholar] [CrossRef]
  20. Suriyasathaporn, W.; Nakprasert, W. Seasonal patterns of aflatoxin Ml contamination in commercial pasteurised milk from different areas in Thailand. Food Addit. Contam. 2012, 5, 145–149. [Google Scholar] [CrossRef]
  21. Ostry, V.; Malir, F.; Toman, J.; Grosse, Y. Mycotoxins as human carcinogens—The IARC Monographs classification. Mycotoxin Res. 2017, 33, 65–73. [Google Scholar] [CrossRef]
  22. Strosnider, H.; Azziz-Baumgartner, E.; Banziger, M.; Bhat, R.V.; Breiman, R.; Brune, M.N.; DeCock, K.; Dilley, A.; Groopman, J.; Hell, K.; et al. Workgroup report: Public health strategies for reducing aflatoxin exposure in developing countries. Environ. Health Perspect. 2006, 114, 1898–1903. [Google Scholar] [CrossRef] [PubMed]
  23. Kensler, T.W.; Roebuck, B.D.; Wogan, G.N.; Groopman, J.D. Aflatoxin: A 50-Year Odyssey of Mechanistic and Translational Toxicology. Toxicol. Sci. 2011, 120, S28–S48. [Google Scholar] [CrossRef]
  24. Shuaib, F.M.; Jolly, P.E.; Ehiri, J.E.; Jiang, Y.; Ellis, W.O.; Stiles, J.K.; Yatich, N.J.; Funkhouser, E.; Person, S.D.; Wilson, C.; et al. Association between Anemia and Aflatoxin B1 Biomarker Levels among Pregnant Women in Kumasi, Ghana. Am. J. Trop. Med. Hyg. 2010, 83, 1077. [Google Scholar] [CrossRef]
  25. Eaton, D.; Gallagher, E.P. Mechanisms of Aflatoxin Carcinogenesis. Annu. Rev. Pharmacol. 1994, 34, 135–172. [Google Scholar] [CrossRef]
  26. Zitomer, N.C.; Awuor, A.O.; Widdowson, M.A.; Daniel, J.H.; Sternberg, M.R.; Rybak, M.E.; Mbidde, E.K. Human aflatoxin exposure in Uganda: Estimates from a subset of the 2011 Uganda AIDS indicator survey (UAIS). Food Addit. Contam. Part A 2021, 38, 136–147. [Google Scholar] [CrossRef] [PubMed]
  27. Keeton, J.T.; Eddy, S. Chemical and physical characteristics of meat. In Encyclopedia of Meat Sciences; Academic Press: Cambridge, MA, USA, 2004. [Google Scholar]
  28. Mohammed, H.Z.; Grace, M.T.; Ndivho, N.; Nthabiseng, S.A.; Letlhogonolo, S.; Monnye, M. The Possibility of Including Donkey Meat and Milk in the Food Chain: A Southern African Scenario. Animals 2022, 12, 1073. [Google Scholar] [CrossRef] [PubMed]
  29. Wenqiong, C.; Jing, X.; Honglei, Q.; Qiugang, M.; Mingxia, Z.; Mengmeng, L.; Yandong, Z.; Tianqi, W.; Jingrong, G.; Huanfen, Y.; et al. Differential proteomic analysis to identify potential biomarkers associated with quality traits of Dezhou donkey meat using a data-independent acquisition (DIA) strategy. LWT 2022, 166, 113792. [Google Scholar]
  30. Chai, W.; Wang, L.; Li, T.; Wang, T.; Wang, X.; Yan, M.; Zhu, M.; Gao, J.; Wang, C.; Ma, Q.; et al. Liquid Chromatography–Mass Spectrometry-Based Metabolomics Reveals Dynamic Metabolite Changes during Early Postmortem Aging of Donkey Meat. Foods 2024, 13, 1466. [Google Scholar] [CrossRef]
  31. Meena, S.; Meena, G.S.; Gautam, P.B.; Rai, D.C.; Kumari, S. A comprehensive review on donkey milk and its products: Composition, functionality and processing aspects. Food Chem. Adv. 2024, 4, 100647. [Google Scholar] [CrossRef]
  32. Kang, R.; Qu, H.; Guo, Y.; Ji, C.; Cheng, J.; Wang, Y.; Huang, S.; Zhao, L.; Ji, C.; Ma, Q. Toxicokinetics of Deoxynivalenol in Dezhou Male Donkeys after Oral Administration. Toxins 2023, 15, 426. [Google Scholar] [CrossRef]
  33. Kang, R.; Qu, H.; Guo, Y.; Zhang, M.; Fu, T.; Huang, S.; Zhao, L.; Zhang, J.; Ji, C.; Ma, Q. Toxicokinetics of a Single Oral Dose of OTA on Dezhou Male Donkeys. Toxins 2023, 15, 88. [Google Scholar] [CrossRef] [PubMed]
  34. Qu, H.; Zheng, Y.; Kang, R.; Feng, Y.; Li, P.; Wang, Y.; Cheng, J.; Ji, C.; Chai, W.; Ma, Q. Toxicokinetics of Zearalenone following Oral Administration in Female Dezhou Donkeys. Toxins 2024, 16, 51. [Google Scholar] [CrossRef] [PubMed]
  35. Wang, Y.C.; Chiang, J.H.; Hsu, H.C.; Tsai, C.H. Decreased fracture incidence with traditional Chinese medicine therapy in patients with osteoporosis: A nationwide population-based cohort study. BMC Complement. Altern. Med. 2019, 19, 42. [Google Scholar] [CrossRef]
  36. Xue, L.; Feng, S.; Liping, G.; Baojian, H.; Daoyuan, L.; Lianli, C. Species-specific identification of collagen components in Colla corii asini using a nano-liquid chromatography tandem mass spectrometry proteomics approach. Int. J. Nanomed. 2017, 12, 4443–4454. [Google Scholar]
  37. Jubert, C.; Mata, J.; Bench, G.; Dashwood, R.; Pereira, C.; Tracewell, W.; Turteltaub, K.; Williams, D.; Bailey, G. Effects of Chlorophyll and Chlorophyllin on Low-Dose Aflatoxin B1 Pharmacokinetics in Human Volunteers. Cancer Prev. Res. 2009, 2, 1015–1022. [Google Scholar] [CrossRef] [PubMed]
  38. Sun, P.; Lootens, O.; Kabeta, T.; Reckelbus, D.; Furman, N.; Cao, X.; Zhang, S.; Antonissen, G.; Croubels, S.; De Boevre, M.; et al. Exploration of Cytochrome P450-Related Interactions between Aflatoxin B1 and Tiamulin in Broiler Chickens. Toxins 2024, 16, 160. [Google Scholar] [CrossRef]
  39. Masoero, F.; Gallo, A.; Moschini, M.; Piva, G.; Diaz, D. Carryover of aflatoxin from feed to milk in dairy cows with low or high somatic cell counts. Anim. Int. J. Anim. Biosci. 2007, 1, 1344–1350. [Google Scholar] [CrossRef]
  40. Bastaki, S.A.; Osman, N.; Kochiyil, J.; Shafiullah, M.; Padmanabhan, R.; Abdulrazzaq, Y.M. Toxicokinetics of Aflatoxin in Pregnant Mice. Int. J. Toxicol. 2010, 29, 425–431. [Google Scholar] [CrossRef]
  41. Saunders, E. A textbook of the diseases of cattle, horses, sheep, pigs and goats. In Veterinary Medicine, 10th ed.; Elsevier: Amsterdam, The Netherlands, 2006. [Google Scholar]
  42. Applebaum, R.S.; Brackett, R.E.; Wiseman, D.W.; Marth, E.H. Responses of Dairy Cows to Dietary Aflatoxin: Feed Intake and Yield, Toxin Content, and Quality of Milk of Cows Treated with Pure and Impure Aflatoxin. J. Dairy Sci. 1982, 65, 1503–1508. [Google Scholar] [CrossRef]
  43. Gross-Steinmeyer, K.; Eaton, D.L. Dietary modulation of the biotransformation and genotoxicity of aflatoxin B1. Toxicology 2012, 299, 69–79. [Google Scholar] [CrossRef]
  44. Lakritz, J.; Winder, B.S.; Noorouz-Zadeh, J.; Huang, T.L.; Buckpitt, A.R.; Hammock, B.D.; Plopper, C.G. Hepatic and pulmonary enzyme activities in horses. Am. J. Vet. Res. 2000, 61, 152–157. [Google Scholar] [CrossRef]
  45. Wild, C.; Garner, R.; Montesano, R.; Tursi, F. Aflatoxin B1 binding to plasma albumin and liver DNA upon chronic administration to rats. Carcinogenesis 1986, 7, 853–858. [Google Scholar] [CrossRef]
  46. Jager, A.; Tonin, F.; Souto, P.; Privatti, R.; Oliveira, C. Determination of Urinary Biomarkers for Assessment of Short-Term Human Exposure to Aflatoxins in So Paulo, Brazil. Toxins 2011, 6, 1996–2007. [Google Scholar] [CrossRef]
  47. Mccoy, L.F.; Scholl, P.F.; Schleicher, R.L.; Groopman, J.D.; Powers, C.D.; Pfeiffer, C.M. Analysis of aflatoxin B1-lysine adduct in serum using isotope-dilution liquid chromatography/tandem mass spectrometry. Rapid Commun. Mass Spectrom. 2010, 19, 2203–2210. [Google Scholar] [CrossRef] [PubMed]
  48. Rustemeyer, S.M.; Lamberson, W.R.; Ledoux, D.R.; Rottinghaus, G.E.; Cammack, K.M. Effects of dietary aflatoxin on the health and performance of growing barrows. J. Anim. Sci. 2010, 88, 3624–3630. [Google Scholar] [CrossRef] [PubMed]
  49. Gratz, S.; Taubel, M.; Juvonen, R.O.; Viluksela, M.; Turner, P.C.; Mykkanen, H.; El-Nezami, H. Lactobacillus rhamnosus Strain GG Modulates Intestinal Absorption, Fecal Excretion, and Toxicity of Aflatoxin B1 in Rats. Appl. Environ. Microbiol. 2006, 72, 7398–7400. [Google Scholar] [CrossRef] [PubMed]
  50. Fernández, A.; Belío, R.; Ramos, J.J.; Sanz, M.C.; Sáez, T. Aflatoxins and their Metabolites in the Tissues, Faeces and Urine from Lambs Feeding on an Aflatoxin-Contaminated Diet. J. Sci. Food Agric. 1997, 74, 161–168. [Google Scholar] [CrossRef]
  51. Firmin, S.; Morgavi, D.P.; Yiannikouris, A.; Boudra, H. Effectiveness of modified yeast cell wall extracts to reduce aflatoxin B1 absorption in dairy ewes. J. Dairy Sci. 2011, 94, 5611–5619. [Google Scholar] [CrossRef]
  52. Caloni, F.; Cortinovis, C. Toxicological effects of aflatoxins in horses. Vet. J. 2011, 188, 270–273. [Google Scholar] [CrossRef]
  53. Wang, R.; Su, X.; Wang, P.; Zhang, W.; Xue, Y.; Li, Y. Simultaneous detection of 21 kinds of mycotoxins and their metabolites in animal plasma with impurity adsorption purification followed by liquid chromatography-tandem mass spectrometry. Chin. J. Anal. Chem. 2017, 45, 231–237. (In Chinese) [Google Scholar]
Figure 1. The MRM chromatogram of the plasma samples for AFB1, AFM1, and 13C17-AFB1.
Toxins 17 00206 g001
Figure 2. The average concentration time distribution of AFB1 and AFM1 in the plasma. This graph shows the concentration–time curves of AFB1 (A) and AFM1 (B) in plasma over time after orally taking 100 µg·kg−1·BW; n = 6.
Toxins 17 00206 g002
Figure 3. The average excretion of AFB1 and AFM1 in the urine of male donkeys. This graph explains the average excretion of unbound AFB1 (A) and AFM1 (B) in urine with time in male donkeys orally taking AFB1 at 100 µg·kg−1·BW, n = 6.
Toxins 17 00206 g003
Figure 4. Average AFB1 and AFM1 excretion in feces of male donkeys. This diagram interprets the mean egestion of unconjugated AFB1 (A) and AFM1 (B) in feces with time in male donkeys orally taking AFB1 at 100 µg·kg−1·BW, n = 6.
Toxins 17 00206 g004
Figure 5. The average concentration of AFB1-DNA (A) and AFB1-lys (B) changed in the serum of male donkeys after oral administration of 100 µg·kg−1·BW of AFB1, n = 6.
Toxins 17 00206 g005
Table 1. Recoveries and precisions (n = 5) of the method.
MatrixSpiked Concentration (µg·L−1)/(µg·kg−1)Items (%)AFB1 (%)AFM1 (%)
Urine2Rrecovery85.680.8
RSD10.37.6
10Rrecovery92.781.8
RSD9.95.5
100Rrecovery101.7100.9
RSD6.93.7
Feces2Rrecovery88.590.8
RSD11.413.6
10Rrecovery90.193.7
RSD9.68.2
100Rrecovery86.683.3
RSD11.46.4
Plasma1Rrecovery81.796.2
RSD9.610.3
10Rrecovery88.783.7
RSD5.47.2
50Rrecovery92.697.5
RSD4.87.6
Table 2. Plasma toxicokinetic parameters of donkeys after oral administration of single-dose AFB1.
Toxicokinetic ParametersValue of AFB1Value of AFM1
Body weight (kg)124.25 ± 2.75
AFB1 (µg·kg−1·BW)100
Cmax (µg·L−1)15.6 ± 6.880.72 ± 0.33
Tmax (h)1.38 ± 0.892.25 ± 1.57
T1/2Elim (h)6.65 ± 2.845.85 ± 3.00
AUC0-t (µg·L−1·h)79.6 ± 23.93.84 ±1.98
AUC0-inf (µg·L−1·h)82.6 ± 24.35.50 ± 2.93
Cl (L·kg·BW−1·h−1)163 ± 52.23210 ± 2450
Vd (L·kg−1·BW)1440 ± 41722,400 ± 14,800
Tmax: time to reach maximum concentration of AFB1 in plasma. Cmax: maximum plasma concentration. T1/2Elim: terminal elimination half-life. AUC: area under the plasma concentration–time curve. Cl: total plasma clearance. Vd: volume of distribution.
Table 3. The total content of AFB1 and AFM1 in both feces and urine of male donkeys.
ParametersMass Value (µg)
AFB1 intake12,420 ± 270
Absorption rate (%)96.56 ± 1.45
AFB1 excretion via urine210.86 ± 46.39
AFM1 excretion via urine195.20 ± 66.62
Total AFB1 excretion through urine (%)3.28 ± 0.92
AFB1 excretion via feces409.30 ± 172.57
AFM1 excretion via feces17.89 ± 8.40
Total AFB1 excretion through feces (%)3.44 ± 1.45
Absorption rate (%) = (AFB1 intake—total AFB1 egestion through feces)/AFB1 intake × 100. AFB1 egestion through urine (%) = total AFB1 egestion through urine/AFB1 intake × 100. Total AFB1 egestion through urine = sum of AFB1 + AFM1 egestion via urine. AFB1 egestion through feces (%) = total AFB1 egestion through feces/AFB1 intake × 100. Total AFB1 egestion through feces = sum of AFB1 + AFM1 excretion via feces.
Table 4. Comparison of toxicokinetic parameters between donkeys and other animals.
Toxicokinetic ParametersDonkeyCowRhesus MonkeyBroiler
Chickens
AFB1(µg·kg−1·BW)10040502000
Cmax (µg·L−1)15.6 ± 6.8813.8 ± 0.9-9.8
Tmax (h)1.38 ± 0.890.58 ± 0.1740.25
T1/2Elim (h)6.65 ± 2.8415.52 ± 0.510.61-
AUC0-inf (µg·L−1·h)82.6 ± 24.32.16 ± 0.36-1.6
Cl (L·kg·BW−1·h−1)163 ± 52.2-1.25-
Vd (L·kg−1·BW)1440 ± 417---
Tmax: time to reach maximum concentration of AFB1 in plasma. Cmax: maximum plasma concentration. T1/2Elim: terminal elimination half-life. AUC: area under the plasma concentration–time curve. Cl: total plasma clearance. Vd: volume of distribution.
Table 5. Analytical conditions for the LC-MS/MS analyses used to determine AFB1, AFM1, and 13C17-AFB1.
InstrumentUPLC; Waters ACQUITY
Chromatographic columnBEH Shield RP18 column
100 mm × 2.1 mm i.d., dp 1.7 µm
Gradient elution programTime (min)A: 0.1% FA and 0.1 mM AmAc in water (%)B: MeOH containing 0.1% FA (%)
0955
0.5955
1.55050
2.52080
3.52080
4298
52--
5.5955
6955
Oven temperature40 °C
Flow velocity0.3 mL·min−1
Inoculability quantity1 μL
Ion sourceESI+
Capillary voltage0.6 kV
Cone voltage42 V
MRM transitions313.1 > 285.0 * and 313.1 > 241.2 for AFB1 (CE 22 and 36)
329.2 > 229.1 * and 329.2 > 259.0 for AFM1 (CE 26 and 24)
330.1 > 301.0 * and 330.1 > 255.1 for 13C17-AFB1 (CE 25 and 36)
Source temperature150 °C
Desolvation temperature500 °C
Desolvation gas flow900 L·h−1
Cone gas150 L·h−1
* Quantification transition.
Disclaimer/Publisher’s Note: The statements, opinions and data contained in all publications are solely those of the individual author(s) and contributor(s) and not of MDPI and/or the editor(s). MDPI and/or the editor(s) disclaim responsibility for any injury to people or property resulting from any ideas, methods, instructions or products referred to in the content.

