Article

Determinants of pH-Dependent Modulation of Translocation in Dermonecrotic G-Protein-Deamidating Toxins

Department of Microbiology, School of Molecular and Cell Biology, University of Illinois at Urbana-Champaign, Urbana, IL 61801, USA
*
Author to whom correspondence should be addressed.
Toxins 2013, 5(6), 1167-1179; https://doi.org/10.3390/toxins5061167
Submission received: 17 May 2013 / Revised: 28 May 2013 / Accepted: 4 June 2013 / Published: 14 June 2013
(This article belongs to the Special Issue Novel Properties of Well-Characterized Toxins)

Abstract

:
Cytotoxic necrotizing factors from E. coli (CNF1, CNF2) and Yersinia (CNFy) share N-terminal sequence similarity with Pasteurella multocida toxin (PMT). This common N-terminal region harbors the receptor-binding and translocation domains that mediate uptake and delivery of the C-terminal catalytic cargo domains into the host cytosol. Subtle variations in the N-terminal ~500 amino acids of CNFs and PMT could allow for selective recognition of cellular receptors and thus, selective target cell specificity. Through studies with cellular inhibitors, we have identified an additional novel function for this region in modulating responses of these toxin proteins to changes in pH during intoxication and delivery of the catalytic cargo domain into the cytosol.

1. Introduction

Dermonecrotic toxins are members of the single-chain AB toxin family, and include the cytotoxic necrotizing factors (CNF1, CNF2, and CNF3 from E. coli and CNFy from Yersinia pseudotuberculosis), Bordetella sp. dermonecrotic toxin (DNT), and Pasteurella multocida toxin (PMT) [1,2]. Intracellular activities of dermonecrotic toxins activate G-protein-dependent, downstream mitogenic signaling pathways [3,4], which ultimately lead to activation of genes under the control of serum-response element (SRE). All dermonecrotic toxins carry a glutamine deamidase activity at their C-terminus that activates their G-protein target substrates and use their N-terminus as the machinery for binding to cells and facilitating membrane translocation of their cargo (activity domains) out of the endosomes and into the cytosol.
CNF1 shares overall sequence homology with CNF2 (85%), CNF3 (70%) and CNFy (61%) [1]. The CNFs and DNT share sequence homology in their C-terminal cargo domains, which deamidate an active-site glutamine of small GTPases of the Rho family [1,3]. Although PMT does not share any C-terminal sequence homology with the CNFs or DNT, its C-terminal cargo domain also deamidates an active-site glutamine of the α subunit of heterotrimeric G proteins [2]. The CNFs and PMT also share sequence homology in their N-terminal domains. Receptor specificity has been shown for CNF1 and CNFy [1]. CNF1 binds to the 37-kDa laminin receptor precursor [5], which promotes internalization through the 67-kDa laminin receptor [6,7], whereas CNFy binds to heparan sulfate proteoglycan, which is also a co-receptor for CNF1 [8]. PMT binds sphingomyelin and an unidentified protein receptor [9]. It is conceivable that sequence differences in the N-terminus of these proteins allow for selective receptor binding and internalization.
For many bacterial protein toxins that enter the cytosol through acidic compartments, acidification of the early endosome by a vacuolar type H+-ATPase (v-ATPase) is an essential step in toxin translocation and delivery of the toxic cargo into the cytosol [10]. Inhibition of acidification by reagents, such as the weak bases, methylamine or ammonium chloride, or the v-ATPase inhibitor bafilomycin A1, blocks internalization, and thereby, the cellular activity of many toxins, including CNF1 [8,11], CNF2 [12], CNFy [8], and PMT [13,14,15]. In our studies comparing the intoxication properties and cellular activities of CNF1, CNF2, and CNFy with our previous results for PMT using the SRE-luciferase reporter assay [14], we found differential responses among these toxins to endosomal acidification inhibitors. Our results, described herein, revealed additional properties in the N-terminal region of the toxins that could modulate the translocation efficiency of toxic cargos from acidic compartments.

2. Results and Discussion

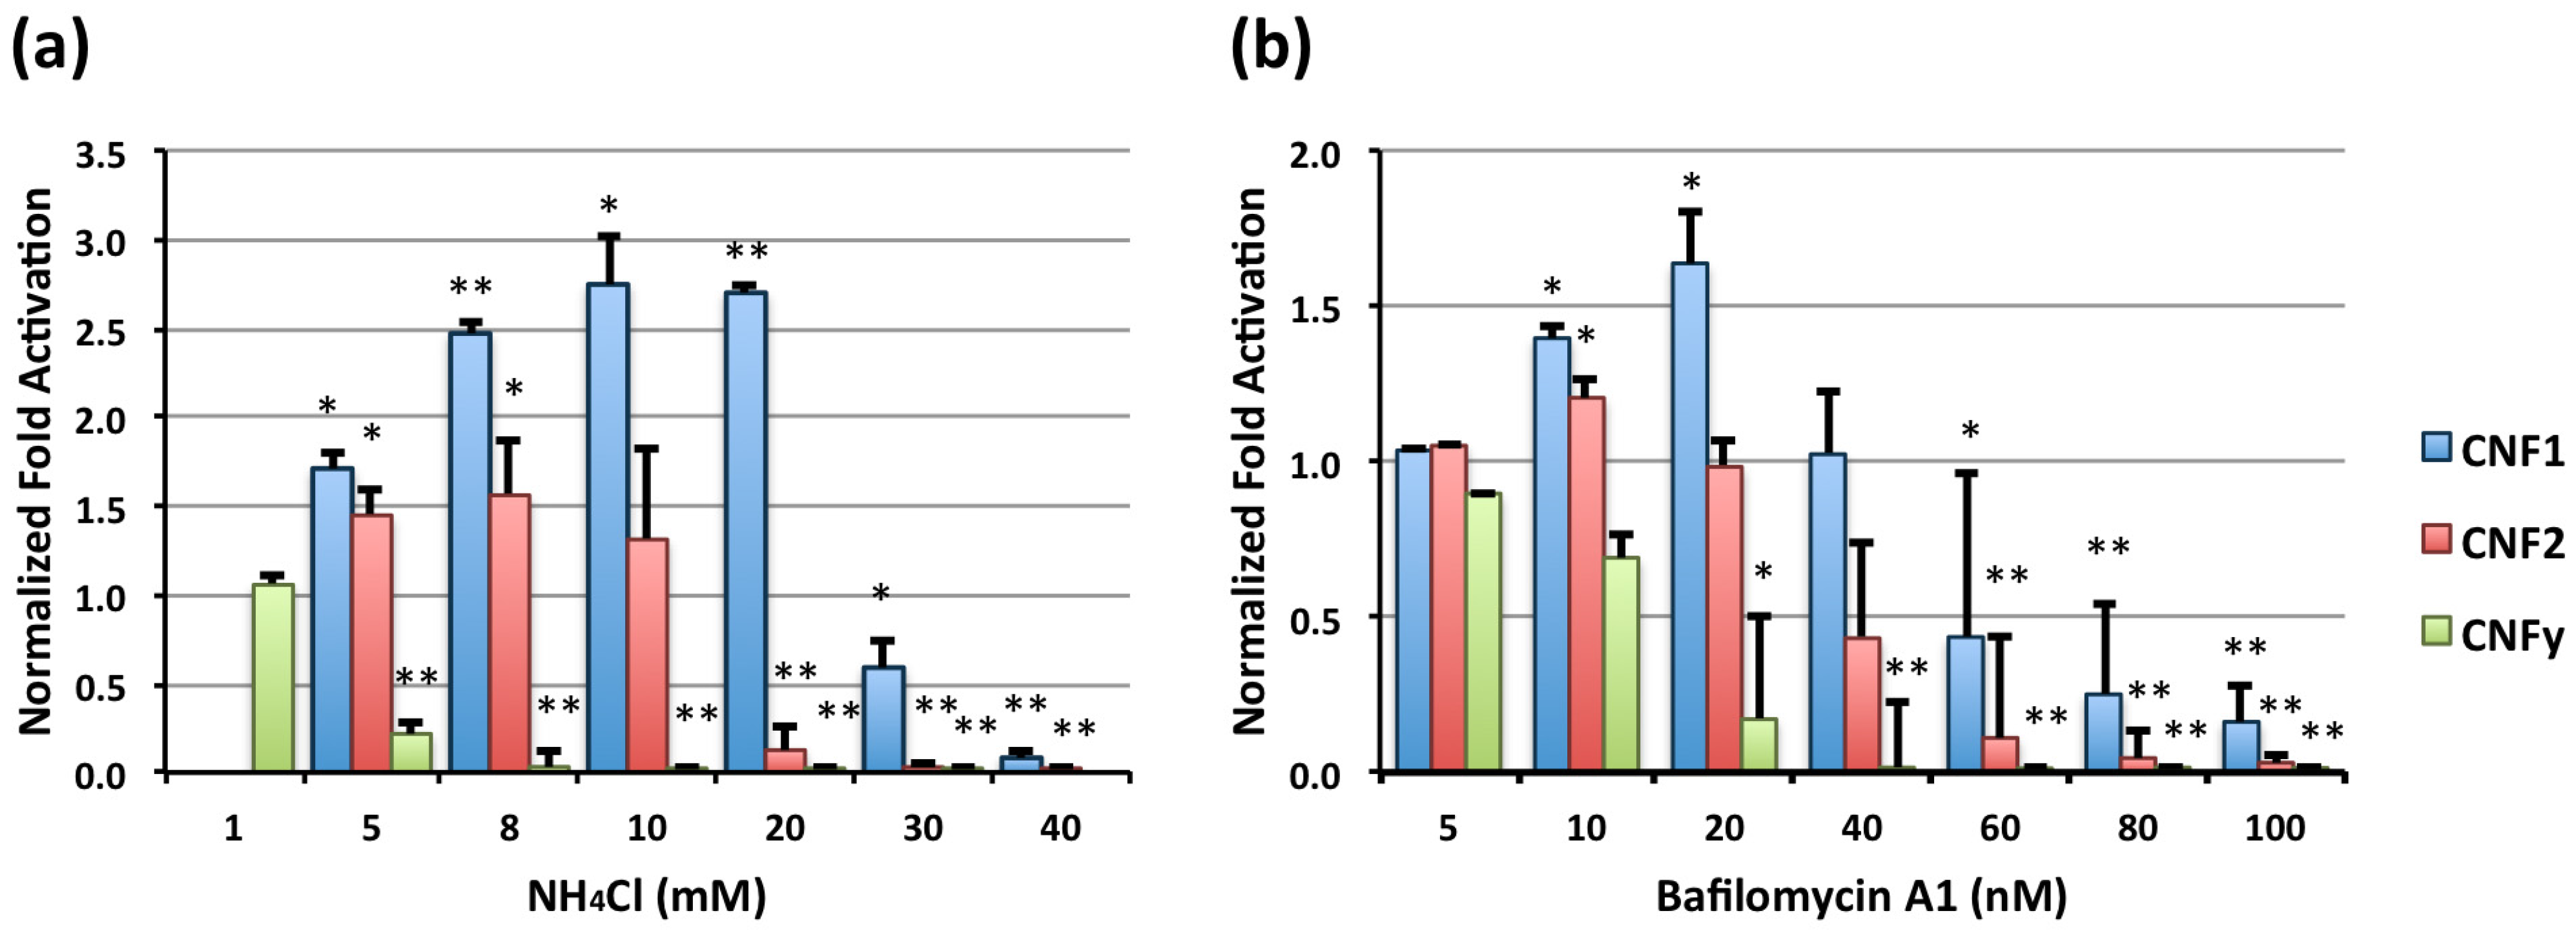
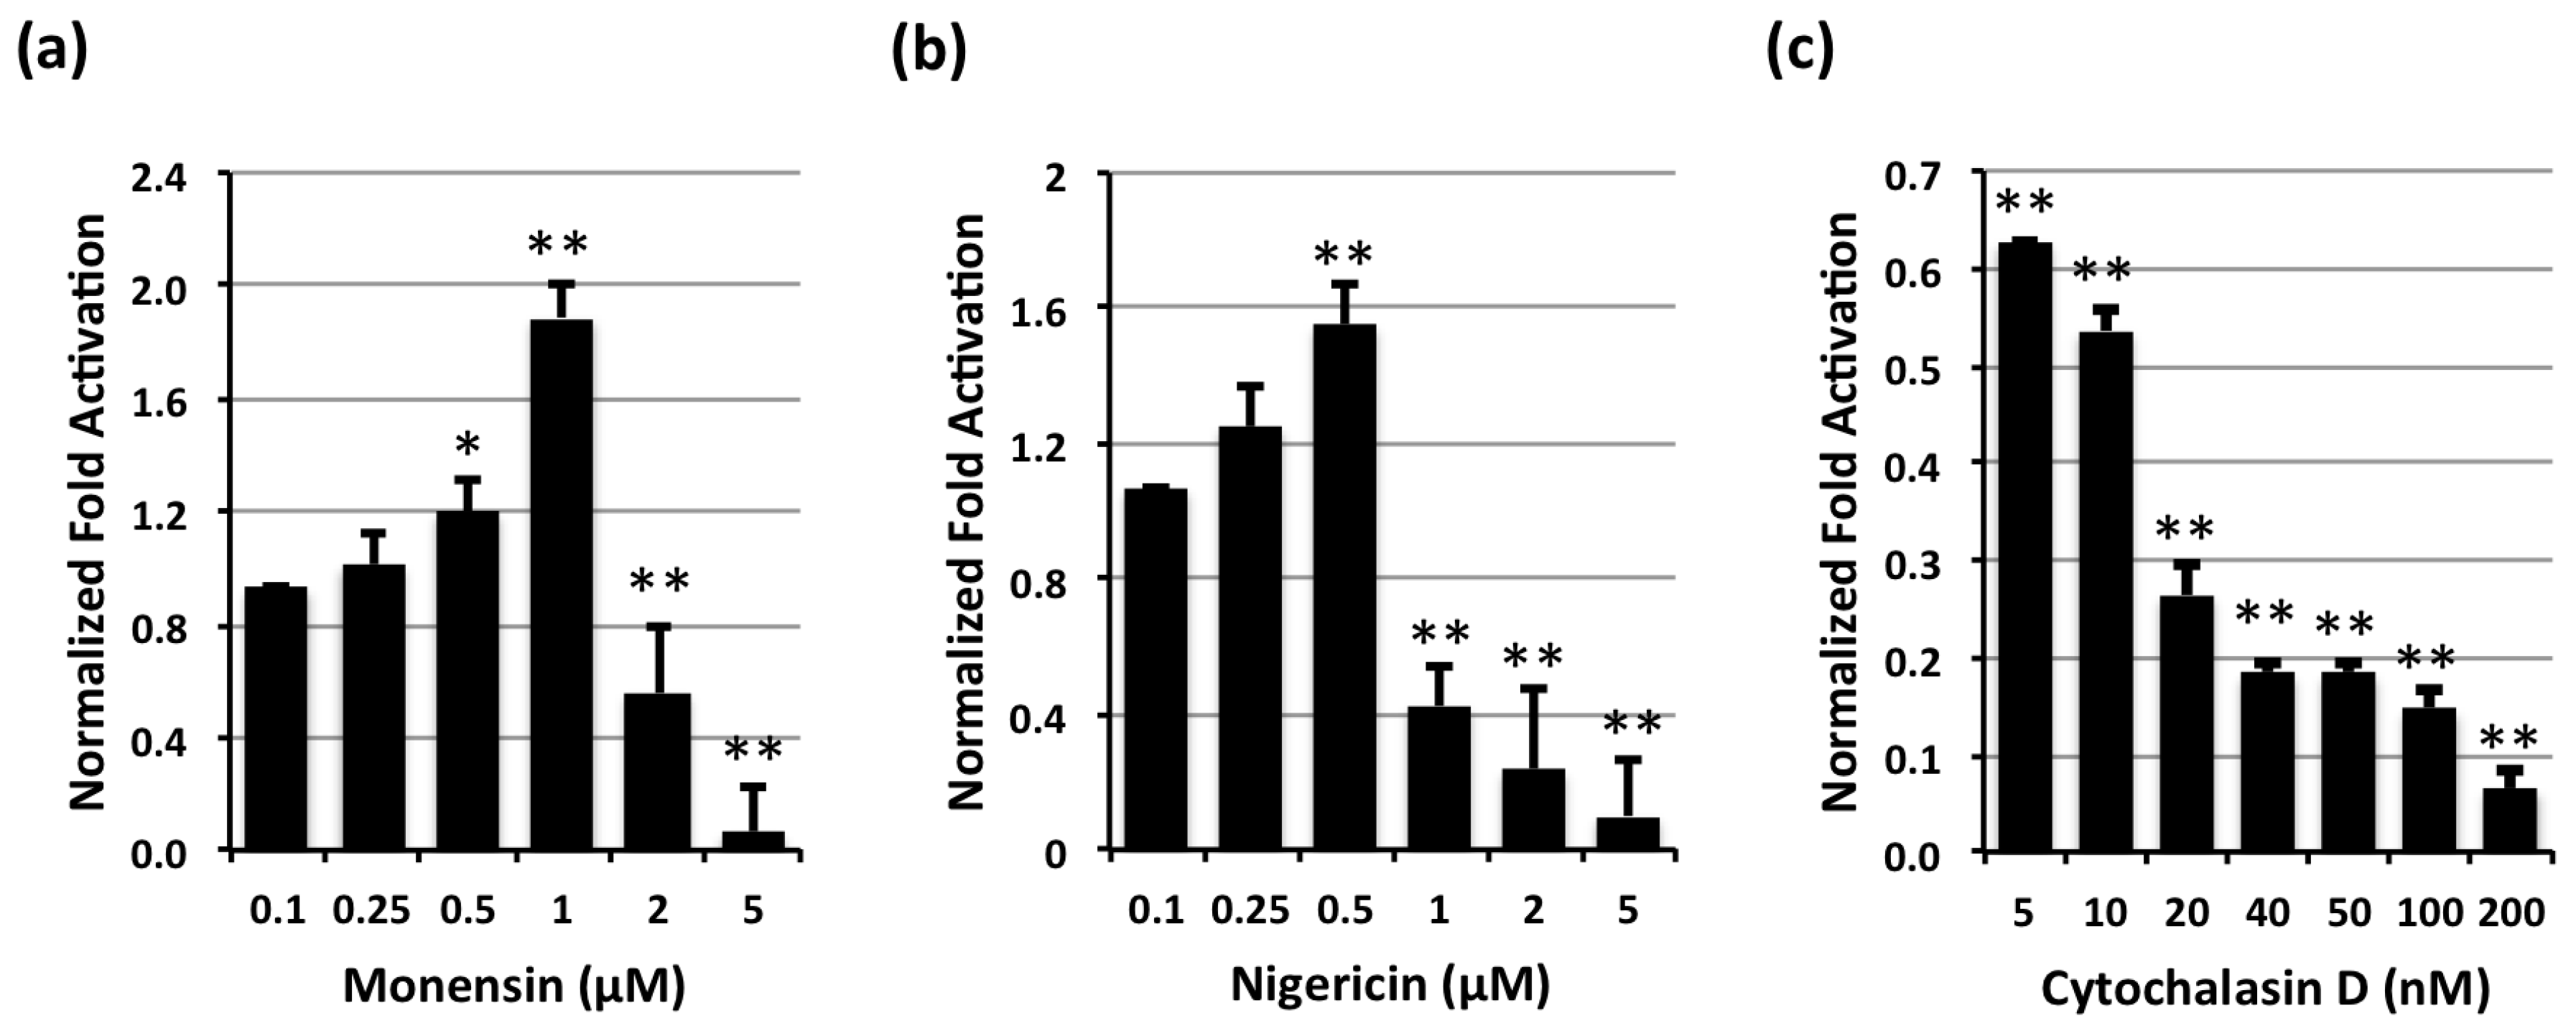
2.1. Effect of Endosomal Acidification Inhibitors on CNF-Mediated SRE-Luciferase Activity

Endosomal acidification inhibitors, NH4Cl and bafilomycin A1, showed dose-dependent differential effects on toxin-mediated SRE-luciferase activity by CNF1, CNF2, and CNFy (Figure 1a,b, respectively). Similar to what was reported previously for PMT (IC50 value for NH4Cl ~2 mM, IC50 value for bafilomycin A1 ~40 nM) [14], CNFy was more sensitive to both acidification inhibitors than the other two toxins and showed dose-dependent decreases in SRE-luciferase activity with increasing inhibitor concentrations. Interestingly, CNF1, and to a lesser extent CNF2, showed an enhancement of toxin-mediated SRE-luciferase activity at lower inhibitor concentrations (maximizing around 10–20 mM NH4Cl or 20 nM bafilomycin A1), which was overcome at higher inhibitor concentrations. The enhanced activity observed for CNF1 was independent of incubation time for inhibitor pretreatment, as similar effects were observed with pre-incubation for 15 min as was observed for 30 min (data not shown).
Figure 1. Effects of NH4Cl or bafilomycin A1 on cytotoxic necrotizing factor (CNF)-mediated serum response element (SRE)-luciferase activity. HEK-293T/17 cells transiently transfected with dual SRE-luciferase reporter genes were treated with the indicated concentrations of (a) NH4Cl or (b) bafilomycin A1 for 30 min, and then treated without or with CNF1, CNF2 or CNFy at a concentration of 100 ng/mL. After 8 h incubation cells were assayed for SRE-luciferase reporter gene activity, as described in the Experimental section. Fold activation was determined by dividing the luciferase activity measured in CNF-treated cells by the activity in untreated cells. Fold activation was then normalized to control cells that were not treated with acidification inhibitor. (*) denotes p value < 0.05 and (**) denotes p value < 0.005. In addition, Tukey’s HSD test gave p values of <0.0041 for CNF2-CNF1, <0.0000001 for CNFy-CNF1 and <0.0051 for CNFy-CNF2 in (a) and <0.000001 for CNF2-CNF1, <0.0000001 for CNFy-CNF1 and <0.00019 for CNFy-CNF2 in (b).
Toxins 05 01167 g001
Similar dose-dependent enhancement of CNF1-mediated SRE-luciferase activity was observed for other endosomal acidification inhibitors, such as monensin and nigericin (Figure 2a,b, respectively). Monensin is an ionophore that acts as a Na+/H+ antiporter [16], while the related ionophore nigericin acts as a K+/H+ antiporter. Both increase the pH of intracellular compartments and have been shown to block translocation of toxins requiring an acidic endosome step, such as diphtheria toxin [17]. However, other types of internalization inhibitors that do not affect pH, such as cytochalasin D, which blocks actin polymerization [18], did not cause the enhanced response of CNF1 (Figure 2c). These results support a model whereby some acidification of the endosome is required for translocation but moderate inhibition of the acidification process that maintains a particular pH promotes translocation of CNF1.
Figure 2. Effects of monensin, nigericin or cytochalasin D on CNF1-mediated SRE-luciferase activity. HEK-293T/17 cells transfected with SRE-luciferase reporter genes were treated without or with 100 ng/mL CNF1 and/or inhibitors at the indicated concentrations and analyzed, as described above. (*) denotes p value < 0.05 and (**) denotes p value < 0.005. (a) Dose effect of monensin on CNF1-mediated SRE-luciferase activity; (b) Dose effect of nigericin on CNF1-mediated SRE-luciferase activity; (c) Dose effect of cytochalasin D on CNF1-mediated SRE-luciferase activity.
Toxins 05 01167 g002
Potentiation of toxin activity by weak bases (nicotine, methylamine, NH4Cl) has been reported before for the vacuolating toxin VacA from Helicobacter pylori [19,20]. However, in this case it appears that the potentiation of VacA-mediated vacuolation by weak bases most likely occurred through a mechanism independent of changes in endosomal pH, since monensin inhibited VacA-induced vacuolation. Weak bases also reportedly maintain and even slightly stimulate the activity of other toxins, such as ricin, abrin, modeccin and Shiga toxin [21,22,23], but after receptor-mediated uptake into endosomes these toxins are trafficked through retrograde transport pathways to the Golgi and/or ER and translocation does not occur in acidified endosomes [23,24,25,26]. It was previously reported that in Hep-2 cells 5 mM of NH4Cl blocked CNF1-induced nuclear fragmentation [11], but there was no report of enhancement in CNF1-induced activity. We rationalize the discrepancy may be due to differences in experimental conditions. CNF1 is unique in that the enhanced response can be achieved with different types of acidification inhibitors, including a weak base NH4Cl, a proton pump inhibitor bafilomycin A, and ionophores, monensin or nigericin. These results also suggest that the source of this enhancement is related to the acid-base properties of the toxin protein itself.

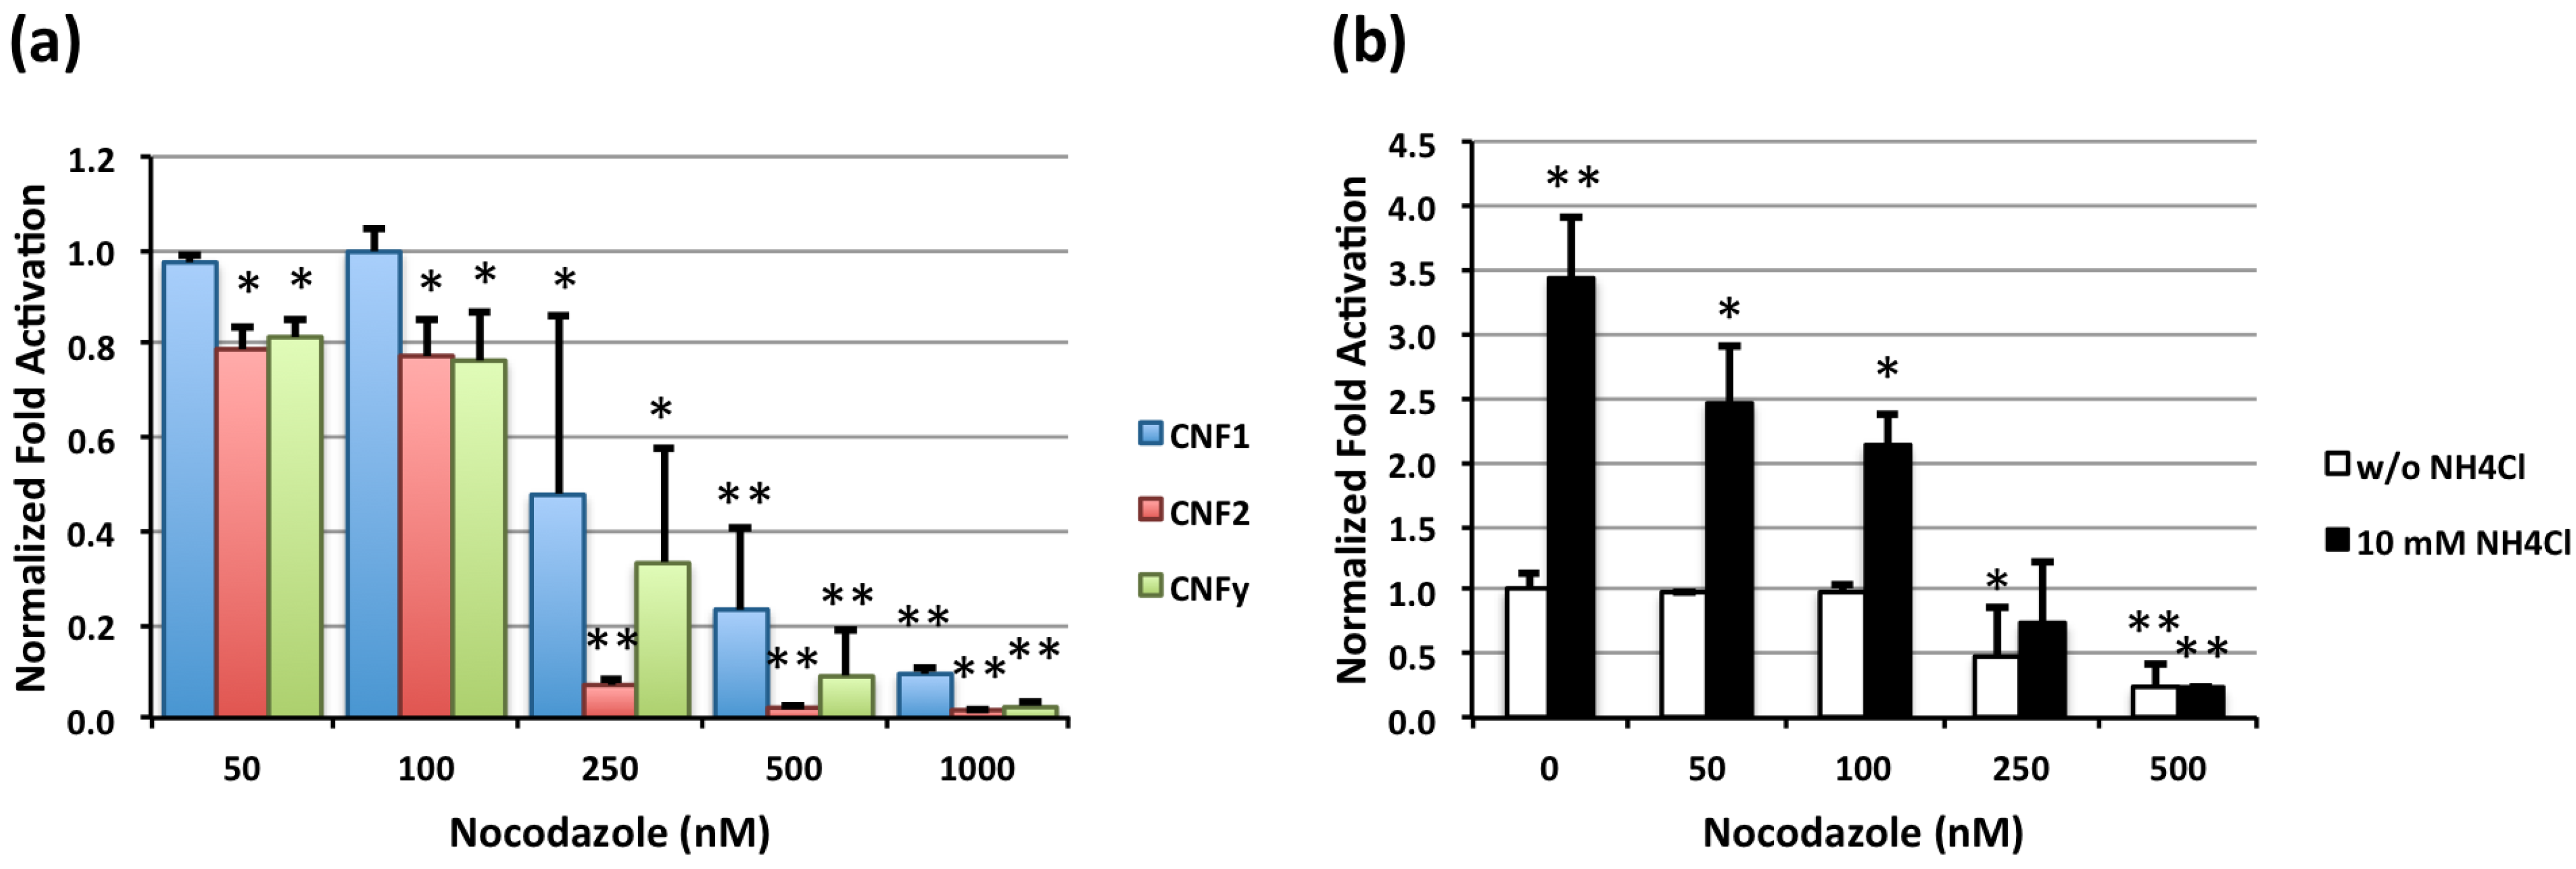
2.2. Effect of Nocodazole on CNF-Mediated SRE-Luciferase Activity and NH4Cl Enhancement of CNF1-Mediated SRE-Luciferase Activity

Nocodazole, a microtubule-depolymerizing agent that disrupts microtubule dynamics and vesicle trafficking of early endosomes to late endosomes [27,28,29,30], differentially blocked toxin-mediated SRE-luciferase activity by each of the toxins in a dose-dependent manner (Figure 3a). CNF2 was more sensitive than CNF1 or CNFy, showing near complete inhibition at 250 nM nocodazole compared to >500 nM for the others; but, all three CNFs were more sensitive than PMT, which was previously shown to require concentrations > 1 µM [14]. Nocodazole also blocked the enhanced CNF1-mediated SRE-luciferase activity observed in the presence of 10 mM NH4Cl (Figure 3b), suggesting that the enhancement of translocation activity of CNF1 (and CNF2) occurs at the late endosome stage. However, in the absence of NH4Cl, the concentration required for nocodazole blockage of CNF1 activity is >100 nM, and the NH4Cl-induced enhancement is partially blocked at lower nocodazole concentrations. This suggests that there may be two separate pathways (or mechanisms) for CNF1 translocation defined by nocodazole action. This is further supported by the greater sensitivity to nocodazole observed for CNF2, which suggests that CNF2 may be more dependent on transport to the late endosome for translocation activity.
Figure 3. Effect of nocodazole on CNF-mediated SRE-luciferase activity and enhancement of CNF1-mediated SRE-luciferase activity by NH4Cl. SRE-luciferase reporter-transfected HEK-293T/17 cells were treated with the indicated toxins and inhibitors at the indicated concentrations and analyzed, similarly as described above. (*) denotes p value < 0.05 and (**) denotes p value < 0.005. (a) Dose effects of nocodazole on CNF-mediated SRE-luciferase activity. Tukey’s HSD test showed p values of <0.0000044 for CNF2-CNF1, <0.000082 for CNFy-CNF1 and <0.71 CNFy-CNF2; (b) Dose effect of nocodazole on the enhancement of CNF1-mediated SRE-luciferase activity by NH4Cl. Tukey’s HSD test showed a p value of <0.00005 between groups with and without NH4Cl.
Toxins 05 01167 g003

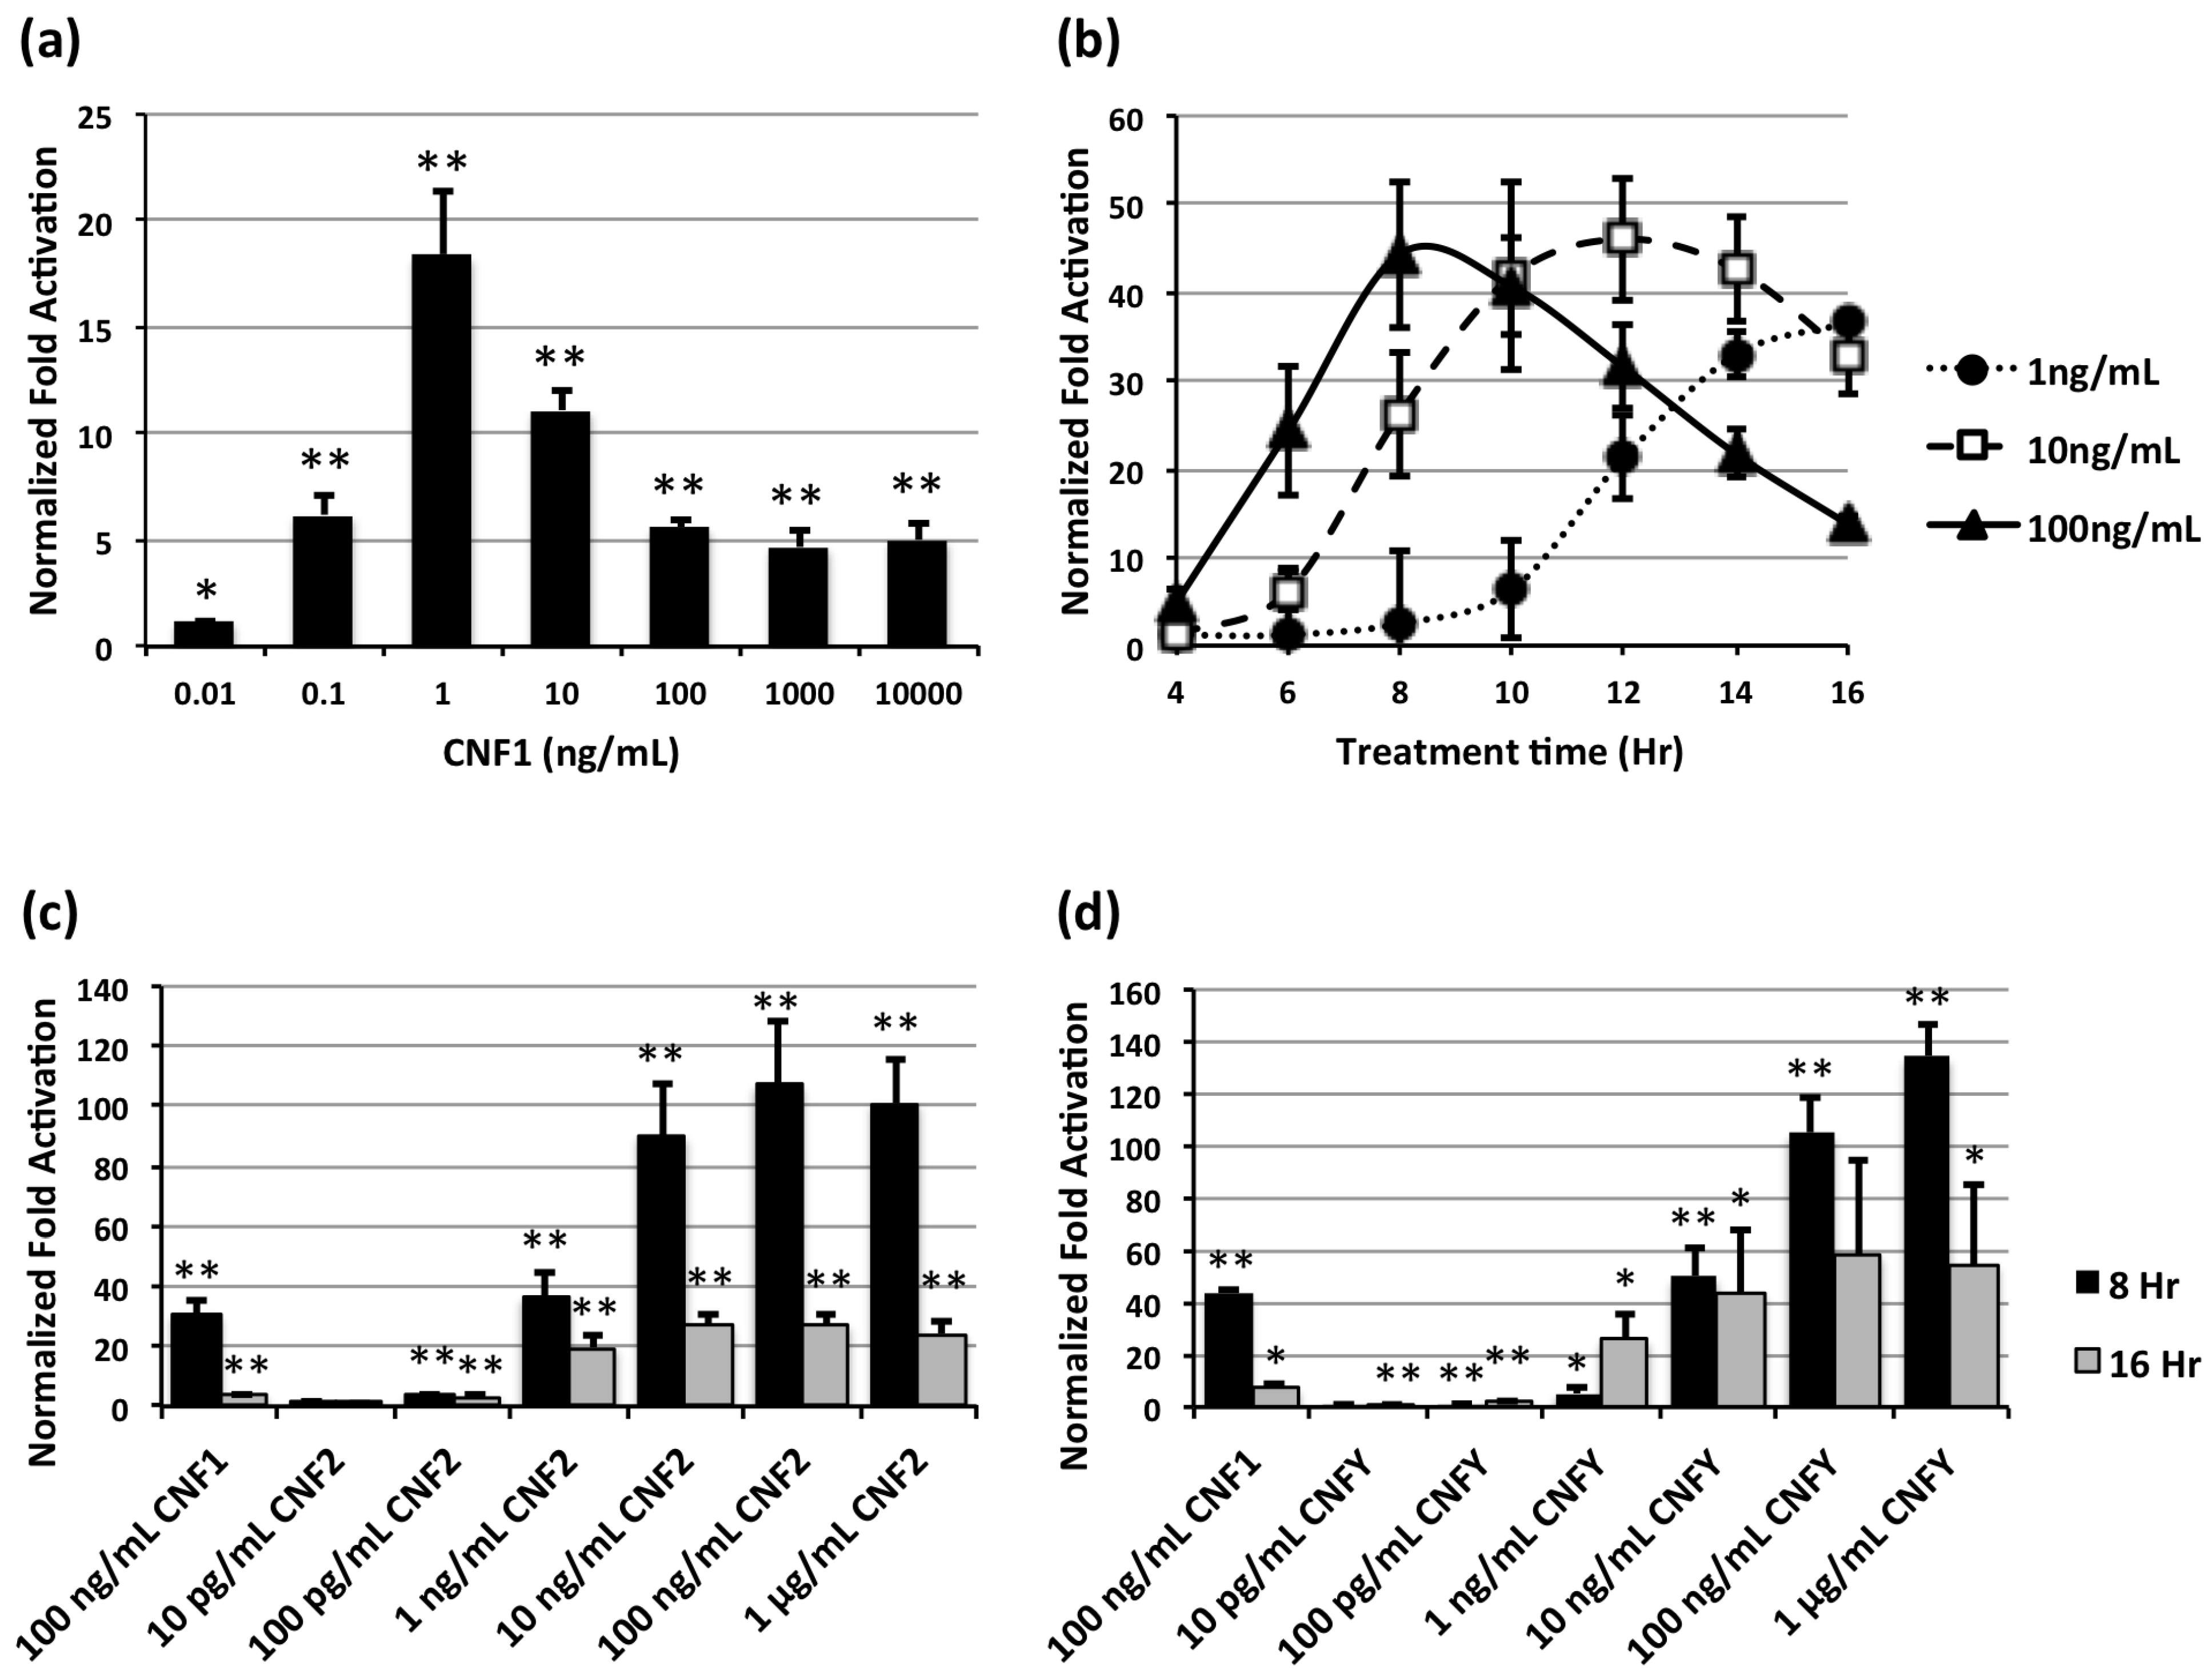
2.3. Comparison of CNF-Mediated SRE-Luciferase Activity

We considered the possibility that the observed differences in SRE-luciferase activity for each of the toxins might be attributed to differences in potency or optimal cell receptor interactions. To address this, we determined the time- and dose-dependencies of the SRE-luciferase activity for CNF1 (Figure 4a,b) and compared at two different times (8 h and 16 h) the responses to CNF1 at a fixed dose of 100 ng/mL with varying doses of CNF2 or CNFy (Figure 4c,d, respectively). For each toxin the responses were both time- and dose-dependent. We first noticed that after treatment with CNF1 for 16 h, the SRE-luciferase activity peaked at 1 ng/mL (Figure 4a). It was determined that at 100 ng/mL of CNF1, the SRE-luciferase activity peaked at 8 h, and the peak time for 10 ng/mL and 1 ng/mL was 12 and 16 h, correspondingly. In comparing the three toxins under optimal experimental conditions for CNF1, CNF2 was the most potent of the toxins, requiring 100-fold less toxin than CNF1 to achieve the equivalent fold activation of reporter activity as mediated by CNF1 at 100 ng/mL for 8 hrs exposure (Figure 4c). Similarly, CNFy was found to be 10-fold more active than CNF1 (Figure 4d).
Figure 4. Time- and dose-dependent responses of CNF-mediated SRE-luciferase activity. SRE-luciferase reporter-transfected HEK-293T/17 cells were treated with the indicated toxins for the indicated times and concentrations and analyzed, similarly as described above. (*) denotes p value < 0.05 and (**) denotes p value < 0.005. (a) Dose response of CNF1-mediated SRE-luciferase activity after 16 h; (b) Time course of dose response of CNF1-mediated SRE-luciferase activity; (c) Dose response of CNF2-mediated SRE-luciferase activity after 8 or 16 h of toxin treatment, compared to CNF1; (d) Dose response of CNFy-mediated SRE-luciferase activity after 8 or 16 h of toxin treatment, compared to CNF1.
Toxins 05 01167 g004

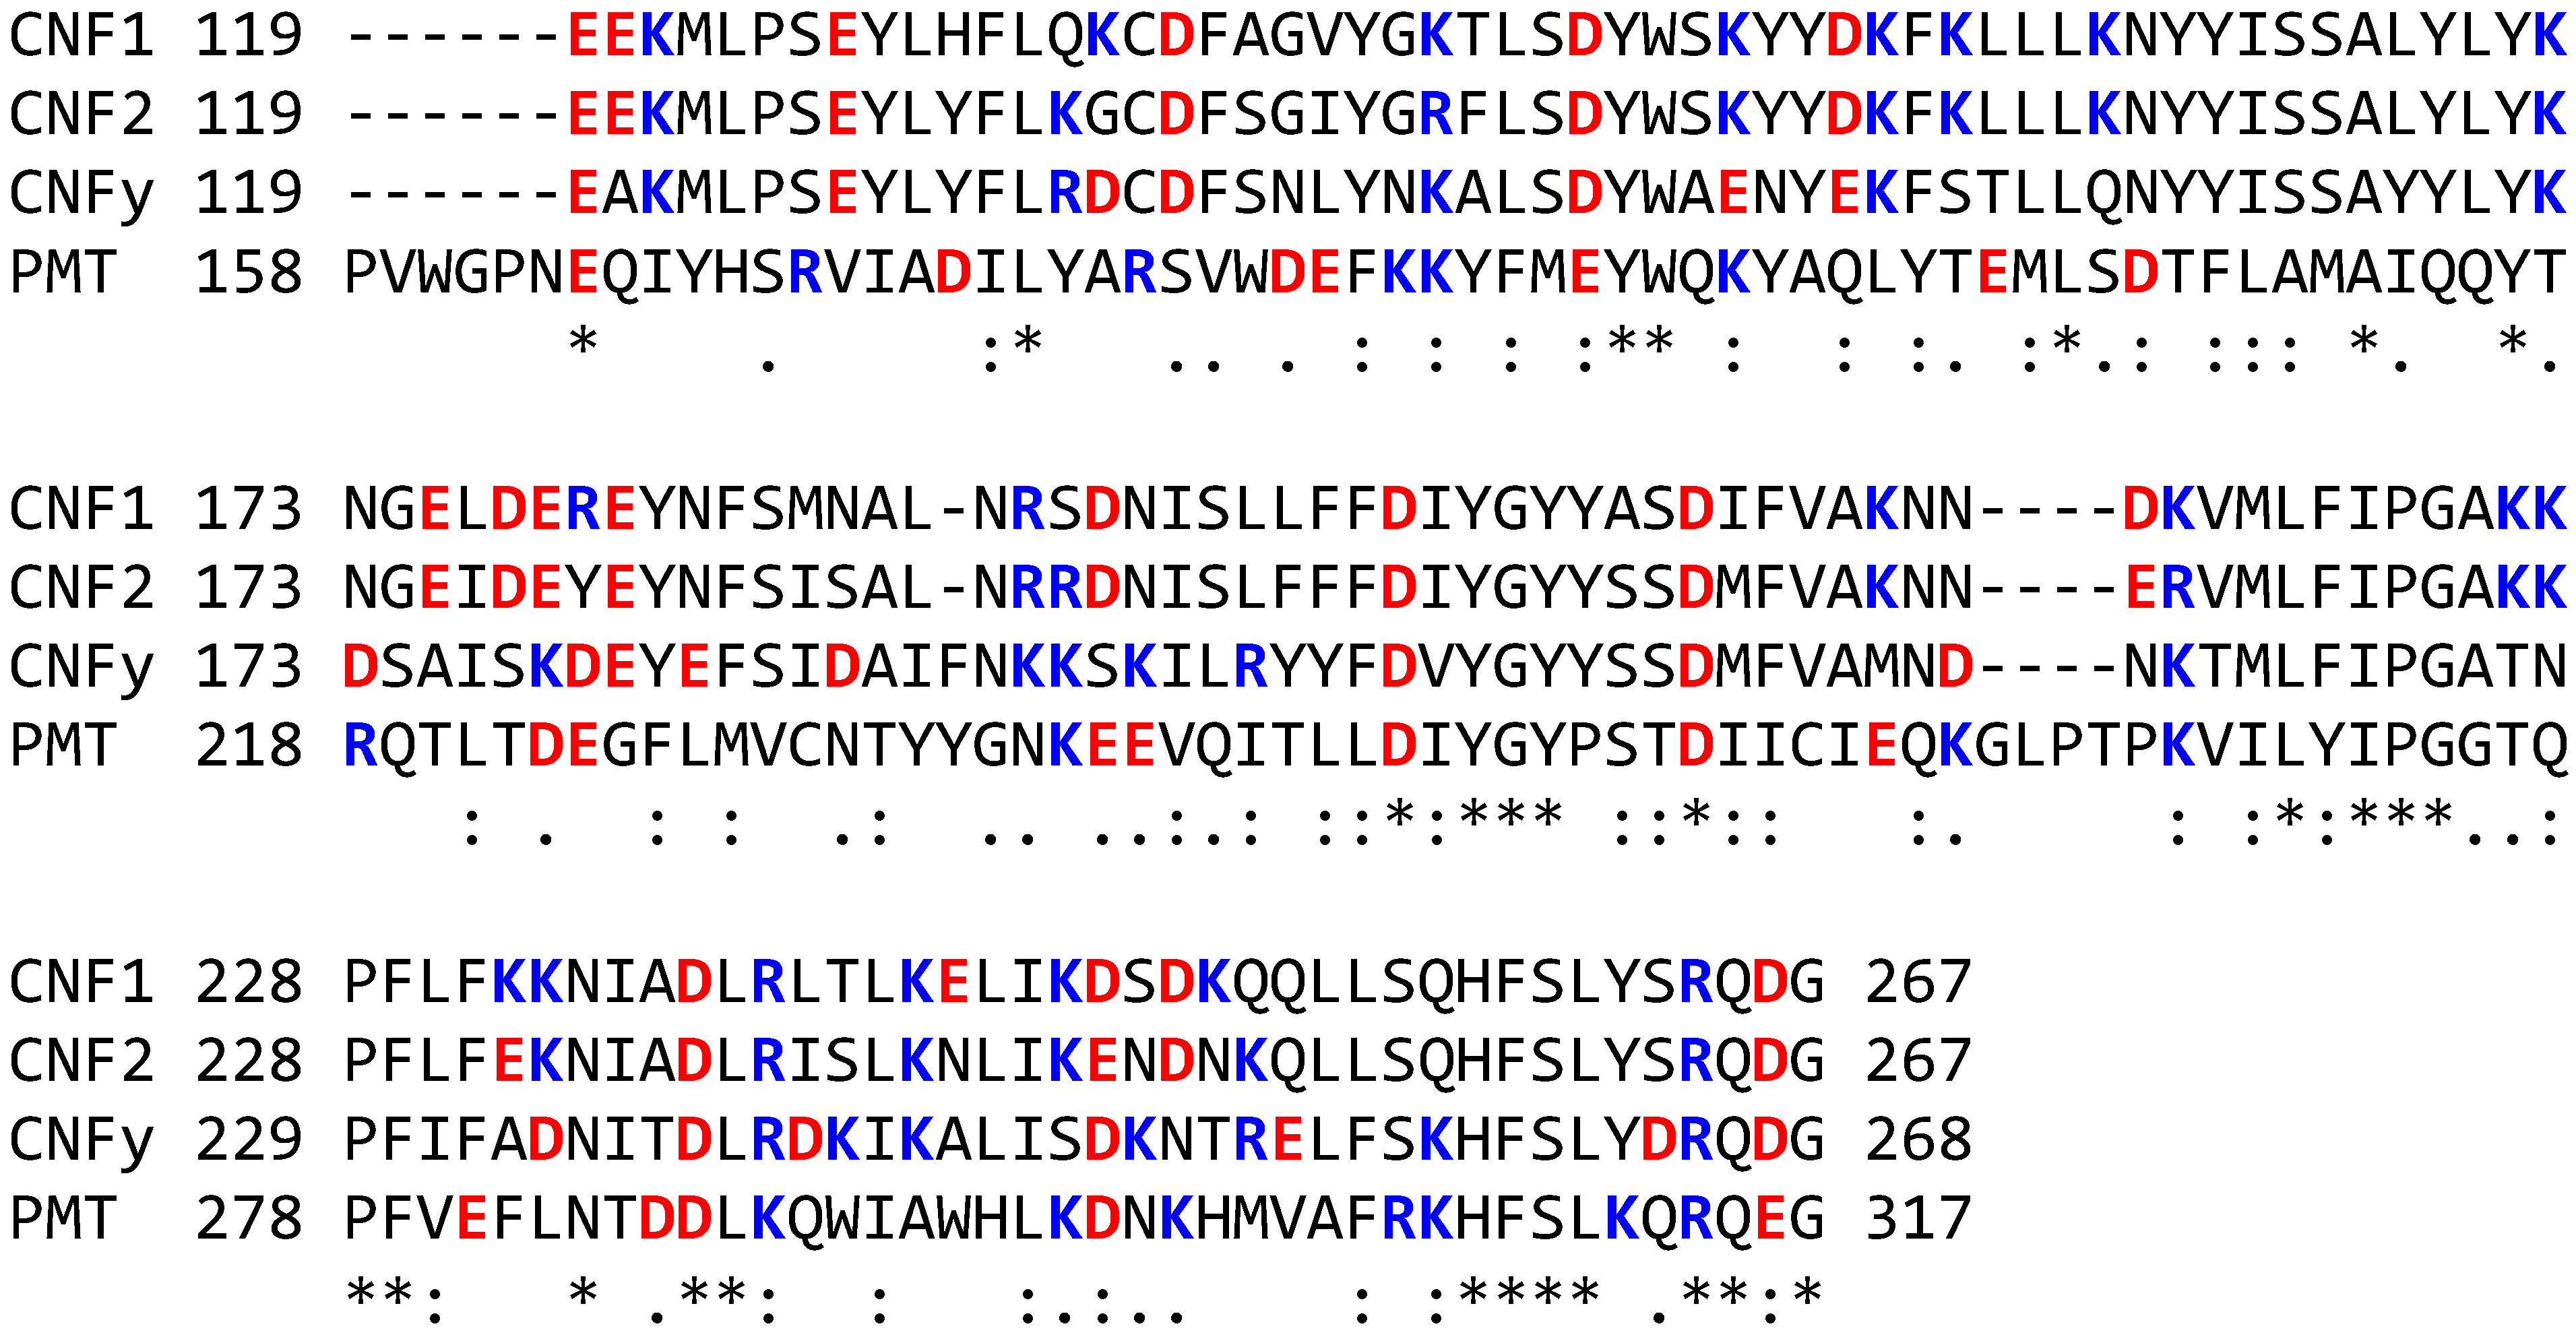
2.4. Comparison of Selected N-Terminal Regions of CNFs and PMT

One possible explanation for the observed potentiation of CNF1 (and CNF2) responses at lower concentrations of acidification inhibitors might be that they provide an endosomal pH environment that is more favorable for translocation during trafficking to the late endosome and then the lysosome. On the other hand, higher concentrations of these acidification inhibitors might raise the pH to a point where translocation itself is unfavorable, and thereby blocking toxin-mediated reporter gene activity. Examination of the protein sequences of the CNFs and PMT revealed differences in the net number of positively and negatively charged amino acid residues in the N-terminal regions of CNF1 and CNF2 compared to CNFy and PMT (Figure 5). The most drastic contrast in charges can be found between residues corresponding to 119 and 267 of CNF1. For this putative activity-modulating domain (119–267), there is a net charge of +2 for CNF1 and +1 for CNF2, while for CNFy and PMT there is a net negative charge of −4 and −3, correspondingly (Table 1). This differentially charged, putative activity-modulating domain is upstream of the proposed translocation-initiating twin hydrophobic helices (residues 330–420) [11,31]. It is conceivable that some interaction exists between the negatively charged twin helices and the positively charged activity-modulating domain (in CNF1 and CNF2). Unlike for CNFy or PMT, where both regions are negatively charged, moderate acidification (pH > 6) might be more favorable than the normal late endosomal environment (pH < 5.5) for allowing conformational changes for optimal translocation of CNF1. However, application of an external pH pulse was reported to induce direct transfer of CNF1 activity from the plasma membrane into the cytosol [11], and was shown to have a preference for pH < 5.2. The source of this discrepancy may lie in differences between the environment of membrane-bound toxin and that of endosome-localized toxin. It also suggests the possibility of multiple acidification-dependent translocation determinants for CNF1.
Figure 5. Comparison of selected N-terminal sequences of the CNFs and PMT. Shown in red are acidic residues (D, E), in blue are basic residues (K, R). (*) denotes identical residues, (:) denotes conserved residues with highly similar properties, (.) denotes residues with weakly similar properties.
Toxins 05 01167 g005
Table 1. Comparison of selected N-terminal regions of the CNFs and PMT.
Calc. pI value aResidues 119–267 b
1–536 b1–267267–5361–119Number R/KNumber D/ENet ChargeCalc. pI
CNF15.056.344.604.88211928.48
CNF25.666.845.155.58201917.97
CNFy4.805.174.575.201822−45.00
PMT4.995.344.705.181619−35.80
a pI values were calculated using ExPASy pI/MW calculator [32]; b Numbers correspond to CNF1 amino acid residues.

3. Experimental Section

3.1. Expression, Purification and Quantification of CNF Proteins

Recombinant CNF proteins were expressed and purified as previously described for PMT [14,33]. CNF1 was expressed under the induction of IPTG in Escherichia coli XL1-Blue containing the plasmid vector pQE-CNF1, obtained as a generous gift from Dr. Alison O’Brien at the Uniform Services University. CNF2 was expressed under the induction of IPTG in E. coli XL1-Blue containing the plasmid vector pProEx-CNF2, obtained as a generous gift from Dr. Eric Oswald at the Centre de Physiopathologie de Toulouse-Purpan. CNFy was expressed under the induction of IPTG in E. coli BL21 containing the plasmid vector pQE-CNFy. The pQE-CNFy was generated by PCR amplification of the CNFy gene from genomic DNA isolated from Yersinia pseudotuberculosis strain YPIII, which was obtained as a generous gift from Dr. James Bliska at SUNY/Stonybrook, and fragment exchanged into the pQE-CNF1 plasmid vector.
Briefly, the recombinant proteins were purified from their respective cell extracts by Ni2+-NTA-agarose chromatography (Qiagen, Valencia, CA, USA). Fractions containing toxin were further purified by FPLC using HiTrapQ anion exchange chromatography (Amersham-GE Healthcare Life Sciences, Pittsburgh, PA, USA) and desalted with a PD-10 column (Amersham-GE Healthcare Life Sciences, Pittsburgh, PA, USA). The toxins were further purified by FPLC using a HiTrapQ anion exchange column and a Superdex 200 sizing column (GE Healthcare Life Sciences, Pittsburgh, PA, USA). Fractions containing toxin were concentrated using Centricon filter units (Millipore, Billerica, MA, USA) and desalted using a PD-10 column (GE Healthcare Life Sciences, Pittsburgh, PA, USA) with phosphate-buffered saline (PBS) containing 10% glycerol. The concentration of toxin was determined by NIH Image J digital image analysis of SDS-PAGE gels stained with Pierce GelCode Blue (Thermo Scientific, Rockford, IL, USA), using bovine serum albumin (BSA) as the standard. Toxin samples were stored at −80 °C until use.

3.2. Cell Culture

HEK 293-T cells (ATCC # CRL-11268) were cultured and maintained at 37 °C and 5% CO2 in DMEM (Gibco-Invitrogen, Grand Island, NY, USA) with 10% fetal bovine serum (FBS, Atlanta Biologicals, Lawrenceville, GA, USA), 100 U/mL penicillin G, and 100 µg/mL streptomycin.

3.3. SRE-Luciferase Assay

HEK 293-T cells at 80% confluence were replated at a 1:7 ratio in 24-well plates. The next day the medium was changed to DMEM with 2% FBS, penicillin and streptomycin, and cells were transfected using the calcium phosphate method [34]. The plasmid DNA (0.25 µg/mL of pSRE-luc (Stratagene-Agilent Technologies, La Jolla, CA, USA) plus 0.025 µg/mL p-Renilla-TK (pGL 7.4 hRluc/TK, Promega, Madison, WI, USA)) in a solution of 250 mM CaCl2 was added dropwise to a solution of 2× HEPES-buffered saline while vortexing. The solution was incubated at room temperature for 20 min and then added dropwise to each well. Cells were incubated for 7 h, after which the indicated toxin was added at the indicated final concentration. After treatment for the indicated time, the medium was removed, and cells were lysed by adding 150 µL of 1× Passive Lysis Buffer (Promega, Madison, WI, USA) and incubating for 15 min on a rotary shaker. Cell lysates were analyzed using the Dual Luciferase Assay System (Promega, Madison, WI, USA), according to manufacturer’s protocol. Luminescence was measured using a Synergy-HT multi-detection microplate reader (BioTek, Winooski, VT, USA) and results were reported as relative light units (sensitivity = 100, integration time = 1 s).

3.4. Data Analysis

SRE-luciferase activity was determined by dividing the firefly luciferase activity by the Renilla luciferase activity. Within each experiment triplicates of SRE-luciferase activity was averaged and the average of the toxin-treated SRE-luciferase activity was divided by the average of the untreated SRE-luciferase activity to determine the fold activation. In the inhibitor experiments the fold activation for the inhibitor-treated groups was divided by the fold activation of the untreated groups to obtain the fold activation, normalized to control. Data is expressed as the mean ± S.D. of results from at least three independent experiments repeated in triplicate. Student’s t-test, calculated in Microsoft Excel, was then used to compare the normalized fold-activation values of the treated and untreated samples in the experiments using chemical inhibitors. Where indicated, (*) denotes p value < 0.05 and (**) denotes p value < 0.005. For some experimental series, two-way ANOVA analysis, followed by Tukey’s honestly significant difference (HSD) test was performed using R Package, aov and Tukey HSD.

3.5. Treatment of Cells with Toxins and Inhibitors

HEK 293-T cells at 80% confluence, maintained as described above, were plated at a 1:7 ratio in 24-well plates. The next day the medium was changed to DMEM with 2% FBS, penicillin and streptomycin, and cells were transfected, as described above. Cells were incubated for 7 h at 37 °C after which medium containing the indicated inhibitor at the indicated final concentration was added to the wells. Stock solutions of 700 nM bafilomycin A1 (Alexis Biochemicals, San Diego, CA, USA), 100 µM nocodazole (Sigma, St. Louis, MO, USA) and 200 µM cytochalasin D (Sigma, St. Louis, MO, USA) were generated by dissolving the inhibitor in dimethyl sulfoxide (DMSO). Stock solutions of 70 µM monensin (Sigma, St. Louis, MO, USA) and 35 µM nigericin (Sigma, St. Louis, MO, USA) were generated by dissolving the inhibitor in methanol. A stock solution of 350 mM NH4Cl (J. T. Baker-Avantor, Center Valley, PA, USA) was generated by dissolving NH4Cl in water. After 15 min incubation with the inhibitor, the indicated toxin was added to the wells at a final concentration of 100 ng/mL. After 8 h of toxin treatment, the medium was removed and the cells were lysed by adding 150 µL of 1× Passive Lysis Buffer (Promega, Madison, WI, USA) and incubating for 15 min on a rotary shaker. Cell lysates were analyzed using the Dual Luciferase Assay System (Promega, Madison, WI, USA), according to the manufacturer’s protocol. Luminescence was measured using a Synergy-HT multi-detection microplate reader (BioTek, Winooski, VT, USA). SRE-luciferase activity was determined as described above, and the data were expressed as the mean ± S.D. of results from three independent experiments repeated in triplicate.

4. Conclusions

We report here differential toxin responses to acidification inhibitors among three closely related toxins. Namely, we found that moderate concentrations of inhibitor enhanced the activity of CNF1 and to a lesser extent CNF2, whereas this potentiation of activity was not observed for CNFy or for PMT, as previously reported [14]. Notably, this potentiation of toxin activity was pH-dependent, as similar responses were observed for acidification inhibitors that work through different mechanisms: a weak base NH4Cl, a v-ATPase pump inhibitor bafilomycin A1, and two ionophores monensin and nigericin. This suggests that the observed differential responses could be attributed to differences in the acid-base properties of the toxin proteins. Sequence comparison among the toxins identified a putative activity-modulating domain, corresponding to CNF amino acids residues 119–267, that might be responsible for the observed potentiation. Further structure-activity studies are required to verify the mechanism for the observed properties of this activity-modulating domain.
Our findings point to the possibility that modulation of protein translocation properties could be achieved through structural determinants that alter acidification responses and enhance translocation efficiency. This paradigm has potential application in designing improved protein-based therapeutic delivery systems, such as immunotoxins [35,36,37] and other toxin-based strategies [38,39].

Acknowledgments

This work was supported by NIH/NIAID grant AI038395 (to B.A.W.).

Conflict of Interest

The authors declare no conflict of interest.

References

  1. Knust, Z.; Schmidt, G. Cytotoxic necrotizing factors (CNFs)—A growing toxin family. Toxins 2010, 2, 116–127. [Google Scholar] [CrossRef]
  2. Wilson, B.A.; Ho, M. Cellular and molecular action of the mitogenic protein-deamidating toxin from Pasteurella multocida. FEBS J. 2011, 278, 4616–4632. [Google Scholar] [CrossRef]
  3. Aktories, K. Bacterial protein toxins that modify host regulatory GTPases. Nat. Rev. Microbiol. 2011, 9, 487–498. [Google Scholar] [CrossRef]
  4. Wilson, B.A.; Ho, M. Recent insights into Pasteurella multocida toxin and other G-protein-modulating bacterial toxins. Future Microbiol. 2010, 5, 1185–1201. [Google Scholar] [CrossRef]
  5. Chung, J.W.; Hong, S.J.; Kim, K.J.; Goti, D.; Stins, M.F.; Shin, S.; Dawson, V.L.; Dawson, T.M.; Kim, K.S. 37-kDa laminin receptor precursor modulates cytotoxic necrotizing factor 1-mediated RhoA activation and bacterial uptake. J. Biol. Chem. 2003, 278, 16857–16862. [Google Scholar] [CrossRef]
  6. Kim, K.J.; Chung, J.W.; Kim, K.S. 67-kDa laminin receptor promotes internalization of cytotoxic necrotizing factor 1-expressing Escherichia coli K1 into human brain microvascular endothelial cells. J. Biol. Chem. 2005, 280, 1360–1368. [Google Scholar]
  7. McNichol, B.A.; Rasmussen, S.B.; Carvalho, H.M.; Meysick, K.C.; O’Brien, A.D. Two domains of cytotoxic necrotizing factor type 1 bind the cellular receptor, laminin receptor precursor protein. Infect. Immun. 2007, 75, 5095–5104. [Google Scholar] [CrossRef]
  8. Blumenthal, B.; Hoffmann, C.; Aktories, K.; Backert, S.; Schmidt, G. The cytotoxic necrotizing factors from Yersinia pseudotuberculosis and from Escherichia coli bind to different cellular receptors but take the same route to the cytosol. Infect. Immun. 2007, 75, 3344–3353. [Google Scholar] [CrossRef]
  9. Brothers, M.C.; Ho, M.; Maharjan, R.; Clemons, N.C.; Bannai, Y.; Waites, M.A.; Faulkner, M.J.; Kuhlenschmidt, T.B.; Kuhlenschmidt, M.S.; Blanke, S.R.; et al. Membrane interaction of Pasteurella multocida toxin involves sphingomyelin. FEBS J. 2011, 278, 4633–4648. [Google Scholar] [CrossRef]
  10. Hinton, A.; Bond, S.; Forgac, M. V-ATPase functions in normal and disease processes. Pflugers Archiv. Eur. J. Physiol. 2009, 457, 589–598. [Google Scholar] [CrossRef]
  11. Contamin, S.; Galmiche, A.; Doye, A.; Flatau, G.; Benmerah, A.; Boquet, P. The p21 Rho-activating toxin cytotoxic necrotizing factor 1 is endocytosed by a clathrin-independent mechanism and enters the cytosol by an acidic-dependent membrane translocation step. Mol. Biol. Cell 2000, 11, 1775–1787. [Google Scholar]
  12. Oswald, E.; Sugai, M.; Labigne, A.; Wu, H.C.; Fiorentini, C.; Boquet, P.; O’Brien, A.D. Cytotoxic necrotizing factor type 2 produced by virulent Escherichia coli modifies the small GTP-binding proteins Rho involved in assembly of actin stress fibers. Proc. Natl. Acad. Sci. USA 1994, 91, 3814–3818. [Google Scholar] [CrossRef]
  13. Baldwin, M.R.; Lakey, J.H.; Lax, A.J. Identification and characterization of the Pasteurella multocida toxin translocation domain. Mol. Microbiol. 2004, 54, 239–250. [Google Scholar] [CrossRef]
  14. Repella, T.L.; Ho, M.; Chong, T.P.; Bannai, Y.; Wilson, B.A. Arf6-dependent intracellular trafficking of Pasteurella multocida toxin and pH-dependent translocation from late endosomes. Toxins 2011, 3, 218–241. [Google Scholar] [CrossRef]
  15. Rozengurt, E.; Higgins, T.; Chanter, N.; Lax, A.J.; Staddon, J.M. Pasteurella multocida toxin: Potent mitogen for cultured fibroblasts. Proc. Natl. Acad. Sci. USA 1990, 87, 123–127. [Google Scholar] [CrossRef]
  16. Mollenhauer, H.H.; Morre, D.J.; Rowe, L.D. Alteration of intracellular traffic by monensin; mechanism, specificity and relationship to toxicity. Biochim. Biophys. Acta 1990, 1031, 225–246. [Google Scholar] [CrossRef]
  17. Marnell, M.H.; Stookey, M.; Draper, R.K. Monensin blocks the transport of diphtheria toxin to the cell cytoplasm. J. Cell Biol. 1982, 93, 57–62. [Google Scholar] [CrossRef]
  18. Cooper, J.A. Effects of cytochalasin and phalloidin on actin. J. Cell Biol. 1987, 105, 1473–1478. [Google Scholar] [CrossRef]
  19. Cover, T.L.; Vaughn, S.G.; Cao, P.; Blaser, M.J. Potentiation of Helicobacter pylori vacuolating toxin activity by nicotine and other weak bases. J. Infect. Dis. 1992, 166, 1073–1078. [Google Scholar] [CrossRef]
  20. Cover, T.L.; Reddy, L.Y.; Blaser, M.J. Effects of ATPase inhibitors on the response of HeLa cells to Helicobacter pylori vacuolating toxin. Infect. Immun. 1993, 61, 1427–1431. [Google Scholar]
  21. Mekada, E.; Uchida, T.; Okada, Y. Methylamine stimulates the action of ricin toxin but inhibits that of diphtheria toxin. J. Biol. Chem. 1981, 256, 1225–1228. [Google Scholar]
  22. Sandvig, K.; Olsnes, S. Entry of the toxic proteins abrin, modeccin, ricin, and diphtheria toxin into cells. II. Effect of pH, metabolic inhibitors, and ionophores and evidence for toxin penetration from endocytotic vesicles. J. Biol. Chem. 1982, 257, 7504–7513. [Google Scholar]
  23. Dyve Lingelem, A.B.; Bergan, J.; Sandvig, K. Inhibitors of intravesicular acidification protect against Shiga toxin in a pH-independent manner. Traffic 2012, 13, 443–454. [Google Scholar] [CrossRef]
  24. Hudson, T.H.; Grillo, F.G. Brefeldin-A enhancement of ricin A-chain immunotoxins and blockade of intact ricin, modeccin, and abrin. J. Biol. Chem. 1991, 266, 18586–18592. [Google Scholar]
  25. Rapak, A.; Falnes, P.O.; Olsnes, S. Retrograde transport of mutant ricin to the endoplasmic reticulum with subsequent translocation to cytosol. Proc. Natl. Acad. Sci. USA 1997, 94, 3783–3788. [Google Scholar] [CrossRef]
  26. Yoshida, T.; Chen, C.C.; Zhang, M.S.; Wu, H.C. Disruption of the Golgi apparatus by brefeldin A inhibits the cytotoxicity of ricin, modeccin, and Pseudomonas toxin. Exp. Cell Res. 1991, 192, 389–395. [Google Scholar] [CrossRef]
  27. Bomsel, M.; Parton, R.; Kuznetsov, S.A.; Schroer, T.A.; Gruenberg, J. Microtubule- and motor-dependent fusion in vitro between apical and basolateral endocytic vesicles from MDCK cells. Cell 1990, 62, 719–731. [Google Scholar]
  28. Gruenberg, J.; Griffiths, G.; Howell, K.E. Characterization of the early endosome and putative endocytic carrier vesicles in vivo and with an assay of vesicle fusion in vitro. J. Cell Biol. 1989, 108, 1301–1316. [Google Scholar] [CrossRef]
  29. Breitfeld, P.P.; McKinnon, W.C.; Mostov, K.E. Effect of nocodazole on vesicular traffic to the apical and basolateral surfaces of polarized MDCK cells. J. Cell Biol. 1990, 111, 2365–2373. [Google Scholar] [CrossRef]
  30. Maples, C.J.; Ruiz, W.G.; Apodaca, G. Both microtubules and actin filaments are required for efficient postendocytotic traffic of the polymeric immunoglobulin receptor in polarized Madin-Darby canine kidney cells. J. Biol. Chem. 1997, 272, 6741–6751. [Google Scholar] [CrossRef]
  31. Pei, S.; Doye, A.; Boquet, P. Mutation of specific acidic residues of the CNF1 T domain into lysine alters cell membrane translocation of the toxin. Mol. Microbiol. 2001, 41, 1237–1247. [Google Scholar] [CrossRef]
  32. Gasteiger, E.; Hoogland, C.; Gattiker, A.; Duvaud, S.; Wilkins, M.R.; Appel, R.D.; Bairoch, A. Compute pI/MW Tool, Excerpt from Chapter: Protein Identification and Analysis Tools on the ExPASy Server. In The Proteomics Protocols Handbook; Walker, J.M., Ed.; Humana Press: Clifton, NJ, USA, 2013. [Google Scholar]
  33. Aminova, L.R.; Luo, S.; Bannai, Y.; Ho, M.; Wilson, B.A. The C3 domain of Pasteurella multocida toxin is the minimal domain responsible for activation of Gq-dependent calcium and mitogenic signaling. Protein Sci. 2008, 17, 945–949. [Google Scholar] [CrossRef]
  34. Kingston, R.E.; Chen, C.A.; Okayama, H. Calcium phosphate transfection. Curr. Protoc. Cell Biol. 2003. [Google Scholar] [CrossRef]
  35. Madhumathi, J.; Verma, R.S. Therapeutic targets and recent advances in protein immunotoxins. Curr. Opin. Microbiol. 2012, 15, 300–309. [Google Scholar] [CrossRef]
  36. Adkins, I.; Holubova, J.; Kosova, M.; Sadilkova, L. Bacteria and their toxins tamed for immunotherapy. Curr. Pharm. Biotechnol. 2012, 13, 1446–1473. [Google Scholar] [CrossRef]
  37. Pastan, I.; Hassan, R.; Fitzgerald, D.J.; Kreitman, R.J. Immunotoxin therapy of cancer. Nat. Rev. Cancer 2006, 6, 559–565. [Google Scholar] [CrossRef]
  38. Ho, M.; Chang, L.H.; Pires-Alves, M.; Thyagarajan, B.; Bloom, J.E.; Gu, Z.; Aberle, K.K.; Teymorian, S.A.; Bannai, Y.; Johnson, S.C.; et al. Recombinant botulinum neurotoxin A heavy chain-based delivery vehicles for neuronal cell targeting. Protein Eng. Des. Sel. 2011, 24, 247–253. [Google Scholar] [CrossRef]
  39. Krautz-Peterson, G.; Zhang, Y.; Chen, K.; Oyler, G.A.; Feng, H.; Shoemaker, C.B. Retargeting Clostridium difficile toxin B to neuronal cells as a potential vehicle for cytosolic delivery of therapeutic biomolecules to treat botulism. J. Toxicol. 2012, 2012, 760142. [Google Scholar]

