2.1. Levels of Cross-Resistance
The LC
50 values for the susceptible (ACB-BtS) and Cry1Ab-selected colonies (ACB-AbR) when exposed to Cry1Ab were significantly different (0.12 and 4.73 μg/g Cry1Ab toxin, respectively), with a resistance ratio of 39.42 (
Table 1). LC
50 values for both sets of F
1 offspring produced from reciprocal crosses between ACB-AbR and ACB-BtS were intermediate to those of the parents, and were not significantly different from each other (
Table 1).
Table 1.
Susceptibility of Cry1Ab-selected (ACB-AbR, R) and susceptible (ACB-BtS, S) strains of O. furnacalis and their F1 progenies of reciprocal crosses to 4 Bt toxins.
Table 1.
Susceptibility of Cry1Ab-selected (ACB-AbR, R) and susceptible (ACB-BtS, S) strains of O. furnacalis and their F1 progenies of reciprocal crosses to 4 Bt toxins.
| Bt toxins | Colony | LC50 (95%FL) μg/g | Resistance ratio RR50 | χ2 | Slope ± SE |
|---|
| Cry1Ab | ACB-BtS | 0.12 (0.05–0.21) | - | 8.19 | 1.05 ± 0.11 |
| ACB-AbR | 4.73 (2.67–8.07) | 39.42 | 19.91 | 1.0 ± 0.06 |
| F1 (S×R) | 1.40 (0.86–2.36) | 11.67 | 6.78 | 0.85 ± 0.08 |
| F1 (R×S) | 2.01 (1.25–3.34) | 16.75 | 2.19 | 0.77 ± 0.07 |
| Cry1Ac | ACB-BtS | 0.10 (0.07–0.15) | - | 8.44 | 1.05 ± 0.06 |
| ACB-AbR | 11.34 (6.88–23.77) | 113.40 | 3.34 | 0.86 ± 0.24 |
| F1 (S×R) | 1.29 (0.88–1.89) | 12.90 | 9.03 | 0.89 ± 0.08 |
| F1 (R×S) | 1.82 (1.12–3.05) | 18.20 | 5.52 | 0.82 ± 0.07 |
| Cry1F | ACB-BtS | 0.64 (0.46–1.05) | - | 3.60 | 0.90 ± 0.09 |
| ACB-AbR | 31.20 (17.98–114.40) | 48.75 | 12.10 | 0.88 ± 0.19 |
| F1 (S×R) | 1.99 (1.24–3.31) | 3.11 | 5.78 | 0.81 ± 0.07 |
| F1 (R×S) | 2.97 (1.87–4.95) | 4.64 | 4.08 | 0.70 ± 0.07 |
| Cry1Ie | ACB-BtS | 1.36 (0.54–2.83) | - | 15.77 | 1.80 ± 0.13 |
| ACB-AbR | 1.95 (1.23–3.14) | 1.60 | 12.20 | 1.08 ± 0.10 |
| F1 (S×R) | 1.00 (0.58–1.76) | 0.74 | 7.09 | 0.90 ± 0.08 |
| F1 (R×S) | 1.10 (0.74–1.64) | 0.81 | 3.50 | 0.87 ± 0.08 |
When exposed to Cry1Ac toxin, the LC
50 values for ACB-BtS and ACB-AbR again were significantly different; but the resistance ratio was numerically higher (113.40) than when they were exposed to Cry1Ab toxin (
Table 1), which indicated cross-resistance. The LC
50 values for both sets of offspring produced from the reciprocal crosses were intermediate to the parents, and were not significantly different from each other (
Table 1).
When exposed to Cry1F toxin, the LC
50 values for ACB-BtS and ACB-AbR once again were significantly different, producing a resistance ratio of 48.75 (
Table 1). This too indicates cross-resistance. The LC
50 values for both sets of offspring produced from the reciprocal crosses were intermediate to the parents, and were not significantly different from each other (
Table 1). However, when exposed to Cry1Ie toxin, none of the LC
50 values produced from ACB-BtS and ACB-AbR nor the F
1 offspring were significantly different from each other. Exposure of ACB-AbR larvae to Cry1Ie showed resistance ratios of 1.95 at the LC
50 (
Table 1); similarly, the LC
50 of the F
1 offspring from the reciprocal crosses were 1.00 and 1.10, indicating no cross-resistance to Cry1Ie.
By contrast, the LC
50 values for ACB-BtS and the Cry1Ac-selected colony ACB-AcR were significantly different (0.10 and 7.88 μg/g Cry1Ab toxin, respectively). The resistance ratio was 78.8 (
Table 2). LC
50 values for both sets of F
1 offspring produced from reciprocal crosses between ACB-AbR and BtS were intermediate to the parents, and were not significantly different from each other (
Table 2).
Table 2.
Susceptibility of ACB-AcR and ACB-BtS strains and their F1 progenies from reciprocal crosses to four Bt toxins.
Table 2.
Susceptibility of ACB-AcR and ACB-BtS strains and their F1 progenies from reciprocal crosses to four Bt toxins.
| Bt Toxins | Colony | LC50 (95% FL) μg/g | Resistance Ratio RR50 | χ2 | Slope ± SE |
|---|
| Cry1Ab | ACB-BtS | 0.12 (0.05–0.21) | - | 8.19 | 1.05 ± 0.11 |
| ACB-AcR | 1.17 (0.65–1.96) | 9.75 | 18.85 | 0.95 ± 0.06 |
| S×R | 1.20 (0.82–1.74) | 10.00 | 4.70 | 0.94 ± 0.08 |
| R×S | 1.51 (1.03–2.23) | 12.58 | 3.16 | 0.91 ± 0.08 |
| Cry1Ac | ACB-BtS | 0.10 (0.07–0.15) | - | 8.44 | 1.05 ± 0.06 |
| ACB-AcR | 7.88 (3.59–18.61) | 78.80 | 28.94 | 0.79 ± 0.06 |
| S×R | 1.28 (0.89–1.84) | 12.80 | 4.89 | 1.99 ± 0.08 |
| R×S | 2.63 (1.71–4.19) | 26.30 | 3.11 | 0.76 ± 0.07 |
| Cry1F | ACB-BtS | 0.64 (0.46–1.05) | - | 3.60 | 0.90 ± 0.09 |
| ACB-AcR | 11.61 (6.70–23.28) | 18.14 | 8.54 | 0.61 ± 0.05 |
| S×R | 2.70 (1.57–5.09) | 4.22 | 6.72 | 0.84 ± 0.08 |
| R×S | 4.76 (2.45–10.70) | 7.44 | 8.39 | 0.75 ± 0.07 |
| Cry1Ie | ACB-BtS | 1.36 (0.54–2.83) | - | 15.77 | 1.8 ± 0.13 |
| ACB-AcR | 1.88 (0.98–3.42) | 1.38 | 23.60 | 0.96 ± 0.06 |
| S×R | 1.34 (0.73–2.44) | 0.99 | 9.80 | 0.98 ± 0.08 |
| R×S | 1.73 (1.11–2.77) | 1.27 | 5.96 | 0.92 ± 0.08 |
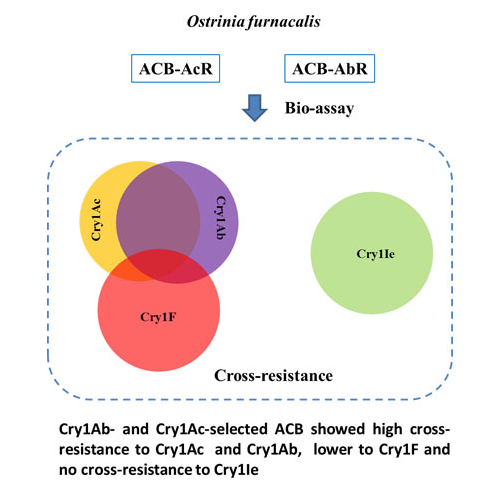
Cross-resistance to Cry1Ab within the ACB-AcR colony showed a resistance ratio of 9.75, which was much lower than the resistance ratio with colony ACB-AbR. The F1 offspring from the reciprocal crosses showed a slightly greater level of cross-resistance to Cry1Ab than their resistant parent, with resistance ratios of 10.00 and 12.58.
When challenged with Cry1F, the ACB-AcR colony revealed a cross-resistance level higher than that seen with Cry1Ab, with a resistance ratio of 18.14. In contrast, the F1 offspring of the reciprocal crosses to Cry1F showed a reduced level of cross-resistance in comparison to Cry1Ab, with cross-resistance ratios of 4.22 and 7.44 at the LC50.
The ACB-AcR colony responded to Cry1Ie with a similar trend to that seen with the ACB-AbR colony, showing no cross-resistance. Again the F1 offspring from the reciprocal crosses between the ACB-AcR colony gave no significant differences in cross-resistance from those seen with the susceptible and resistant parents upon exposure to Cry1Ie.
2.2. Estimation of Dominance
Dominance estimations at different concentrations of the Cry1 Bt toxin revealed that resistance of the F
1 offspring was generally dominant at low treatment concentrations, but that dominance decreased as the treatment concentrations increased (
Table 3). For example, for F
1 offspring from reciprocal crosses between ACB-AbR and ACB-BtS, treatment with Cry1Ab showed complete dominance (1.00) at 0.1 µg/g, but when the concentration reached the maximum 10.00 µg/g, dominance declined to a semirecessive state. Similarly, with F
1 offspring from reciprocal crosses between ACB-AcR and ACB-BtS, tests with Cry1Ab showed complete dominance (1.00) at 0.10 µg/g, but at a concentration of 10.00 µg/g, dominance shifted from dominant to semidominant.
Table 3.
Estimation of dominance for F1 progenies of reciprocal crosses between ACB-AbR and ACB-BtS or ACB-AcR and ACB-BtS.
Table 3.
Estimation of dominance for F1 progenies of reciprocal crosses between ACB-AbR and ACB-BtS or ACB-AcR and ACB-BtS.
| Toxin | Concentration (µg/g) | h value (Crosses) |
|---|
| ACB-AbRS | ACB-SAbR | ACB-AcRS | ACB-SAcR |
|---|
| Cry1Ab | 0.10 | 1.00 | 1.00 | 1.00 | 1.00 |
| 1.00 | 0.90 | 0.78 | 1.00 | 1.00 |
| 10.00 | 0.44 | 0.35 | 0.80 | 0.74 |
| Cry1Ac | 0.10 | 1.00 | 1.00 | 1.00 | 1.00 |
| 1.00 | 0.98 | 0.79 | 0.83 | 0.67 |
| 10.00 | 0.52 | 0.20 | 0.43 | 0.20 |
| Cry1F | 0.10 | 1.00 | 1.00 | 1.00 | 1.00 |
| 1.00 | 0.90 | 0.80 | 0.70 | 1.00 |
| 10.00 | 0.60 | 0.40 | 0.40 | 0.50 |
| 100.00 | 0.30 | 0.10 | 0.15 | 0.06 |
Thus colonies of ACB-AbR and ACB-AcR showed the same mode of resistance inheritance, both from complete dominance to semi-recessive as treatment concentration increased. Cross-resistance to Cry1F also ranged from dominant to semi-recessive as treatment concentration increased.
Both resistant colonies, and the offspring from the reciprocal crosses between ACB-AbR and ACB-AcR were also evaluated for their resistance to the different Cry1 toxins (
Table 4). Exposure to Cry1Ab resulted in no significant differences between each of the hybrid crosses and the homozygous resistant parents; these results are synonymous with autosomal inheritance and with no maternal effects. However, when exposed to Cry1Ac and Cry1F, the hybrid offspring from both crosses were more resistant than the individual homozygous resistant parents, indicating resistance and cross-resistance alleles were strongly complementary. The resistance ratios were 0.82–1.60 to Cry1Ie in ACB-AbR, ACB-AcR and the hybrid offspring of the reciprocal crosses, indicating that cross-resistance was not observed.
Table 4.
Susceptibility of ACB-AbR and ACB-AcR strains and their progenies of reciprocal crosses toward four Bt toxins.
Table 4.
Susceptibility of ACB-AbR and ACB-AcR strains and their progenies of reciprocal crosses toward four Bt toxins.
| Toxins | Colony | LC50 (95% FL) µg/g | Resistance ratio | χ2 | Slope ± SE |
|---|
| Cry1Ab | ACB-AbR | 4.73 (2.67–8.07) | 39.42 | 19.91 | 1.00 ± 0.06 |
| ACB-AcR | 1.17 (0.65–1.96) | 9.75 | 18.85 | 0.95 ± 0.06 |
| ACB-AbcR | 2.85 (1.96–4.01) | 23.75 | 11.87 | 1.30 ± 0.08 |
| ACB-AcbR | 1.55 (0.93–2.43) | 12.92 | 18.80 | 1.24 ± 0.07 |
| Cry1Ac | ACB-AbR | 11.34 (6.88–23.77) | 113.40 | 3.34 | 0.86 ± 0.24 |
| ACB-AcR | 7.88 (3.59–18.61) | 78.80 | 28.94 | 0.79 ± 0.06 |
| ACB-AbcR | 10.25 (7.94–13.35) | 102.50 | 5.14 | 0.88 ± 0.06 |
| ACB-AcbR | 19.81 (15.41–25.87) | 198.10 | 3.90 | 0.99 ± 0.08 |
| Cry1F | ACB-AbR | 31.20 (17.98–114.40) | 48.75 | 12.10 | 0.88 ± 0.19 |
| ACB-AcR | 11.61 (6.70–23.28) | 18.14 | 8.54 | 0.61 ± 0.05 |
| ACB-AbcR | 35.80 (22.00–67.61) | 55.94 | 1.24 | 0.59 ± 0.06 |
| ACB-AcbR | 47.78 (29.56–91.45) | 74.66 | 4.13 | 0.66 ± 0.07 |
| Cry1Ie | ACB-AbR | 1.95 (1.23–3.14) | 1.60 | 12.20 | 1.08 ± 0.10 |
| ACB-AcR | 1.88 (0.98–3.42) | 1.38 | 23.60 | 0.96 ± 0.06 |
| ACB-AbcR | 1.66 (1.00–2.57) | 1.22 | 16.69 | 1.16 ± 0.08 |
| ACB-AcbR | 1.12 (0.61–1.94) | 0.82 | 21.65 | 0.99 ± 0.06 |
2.3. Inheritance of Resistance
The offspring from the backcross ACB-AbRS×ACB-AbR and the F
1 colony backcrossed to the original parental colony, were tested against Cry1Ab. All interactions were significant across the range of concentrations used (
P < 0.05); the results also showed that the average difference between actual mortality and expected mortality was 17.20% (
Table 5). These results are not significantly different from the monofactorial model, and, thus, indicated the inheritance of ACB-AbR to Cry1Ab does not fit the monogenic model but can be explained by the polygenic model. In contrast, the results for response of ACB-AcRS×ACB-BtS to Cry1Ab showed no significant difference to the monogenic model across the range of concentrations of 0.05–50.00 µg/g (
P > 0.05), indicating that inheritance is monogenic.
Table 5.
Indirect tests for deviation between observed and expected mortality for monogenic and additive polygenic models in ACB-AbR and ACB-AcR to Cry1Ab.
Table 5.
Indirect tests for deviation between observed and expected mortality for monogenic and additive polygenic models in ACB-AbR and ACB-AcR to Cry1Ab.
| Strains | Concentration (µg/g) |
|---|
| 0.05 | 0.25 | 0.50 | 2.50 | 5.00 | 25.00 | 50.00 |
|---|
| ACB-AbRS×ACBAbR | Actual mortality (%) | 18.06 | 27.08 | 41.67 | 70.14 | 78.47 | 93.75 | 97.22 |
| Expected mortality (%) | 11.63 | 16.03 | 23.09 | 42.71 | 53.47 | 73.44 | 85.59 |
| χ2 | 5.78 | 13.06 | 27.98 | 44.28 | 36.17 | 30.46 | 15.80 |
| P | 0.02 | 0.00 | 0.00 | 0.00 | 0.00 | 0.00 | 0.00 |
| Mean difference (%) | 17.20 |
| ACB-AcRS×ACB-BtS | Actual mortality (%) | 21.53 | 40.97 | 48.61 | 79.17 | 86.11 | 95.14 | 97.92 |
| Expected mortality (%) | 14.49 | 21.70 | 32.46 | 49.13 | 64.97 | 87.67 | 93.23 |
| χ2 | 1.21 | 2.92 | 3.26 | 2.70 | 1.82 | 0.83 | 1.00 |
| P | 0.27 | 0.09 | 0.07 | 0.10 | 0.18 | 0.36 | 0.32 |
| Mean difference (%) | 4.64 |
The backcross ACB-AbRS×ACBAbR showed that under low Cry1Ac concentrations inheritance of resistance was not significantly different to the monofactorial model (0.05–2.50 µg/g,
P > 0.05). However, as the concentration of the toxin was increased (5.00, 25.00, 50.00 µg/g), the data showed a significant level of difference to the monofactorial model (
P > 0.05), synonymous with polygenic inheritance (
Table 6). A similar trend was observed with the ACB-AcRS×BtS backcross to Cry1Ac, with no difference to the monofactorial model under low concentrations but significance differences under high concentrations, again consistent with polygenic inheritance.
Table 6.
Indirect tests for deviation between observed and expected mortality for monogenic and additive polygenic models in ACB-AbR and ACB-AcR to Cry1Ac.
Table 6.
Indirect tests for deviation between observed and expected mortality for monogenic and additive polygenic models in ACB-AbR and ACB-AcR to Cry1Ac.
| Strains | Concentration (µg/g) |
|---|
| 0.05 | 0.25 | 0.50 | 2.50 | 5.00 | 25.00 | 50.00 |
|---|
| ACB-AbRS×ACB-AbR | Actual mortality (%) | 17.36 | 21.53 | 28.47 | 43.06 | 59.72 | 77.78 | 94.44 |
| Expected mortality (%) | 19.30 | 24.10 | 28.82 | 41.15 | 51.22 | 69.79 | 83.16 |
| χ2 | 0.35 | 0.52 | 0.01 | 0.22 | 4.17 | 4.36 | 13.09 |
| P | 0.56 | 0.47 | 0.93 | 0.64 | 0.04 | 0.04 | 0.00 |
| Mean difference (%) | 4.93 |
| ACB-AcRS×ACB-BtS | Actual mortality (%) | 20.83 | 40.28 | 49.31 | 72.22 | 83.33 | 90.97 | 95.14 |
| Expected mortality (%) | 10.42 | 16.27 | 21.98 | 38.54 | 48.09 | 68.89 | 80.21 |
| χ2 | 1.52 | 0.93 | 1.09 | 7.72 | 4.78 | 6.67 | 5.78 |
| P | 0.22 | 0.34 | 0.30 | 0.01 | 0.03 | 0.01 | 0.02 |
| Mean difference (%) | 3.89 |


