Article

In Situ Image Acquisition and Measurement of Microdroplets Based on Delay Triggering

1
School of Mechanical and Automotive Engineering, Xiamen University of Technology, Xiamen 361024, China
2
Key Laboratory of Precision Actuation and Transmission, Fujian Province University, Xiamen 361024, China
3
Program for Innovative Research Team in Science and Technology in Fujian Province University, Fujian Province University, Xiamen 361024, China
*
Authors to whom correspondence should be addressed.
Micromachines 2019, 10(2), 148; https://doi.org/10.3390/mi10020148
Submission received: 19 January 2019 / Revised: 14 February 2019 / Accepted: 20 February 2019 / Published: 22 February 2019

Abstract

:
An in situ image acquisition apparatus based on delay triggering for visualizing microdroplets formation is described. The imaging system includes a charge-coupled device camera, a motion control card, a driving circuit, a time delay triggering circuit, and a light source. By adjusting the varying trigger delay time which is synchronized with respect to the signal for jetting, the steady sequential images of the droplet flying in free space can be captured real-time by the system. Several image processing steps are taken to measure the diameters and coordinates of the droplets. Also, the jetting speeds can be calculated according to the delay time interval. For glycerin/water (60:40, mass ratio), under the given conditions of the self-made pneumatically diaphragm-driven drop-on-demand inkjet apparatus, the average of diameter and volume are measured as 266.8 μm and 9944 pL, respectively, and the maximum average velocity of the microdroplets is 0.689 m/s. Finally, the imaging system is applied to measure the volume of 200 microsolder balls generated from the inkjet apparatus. The average diameter is 87.96 μm, and the relative standard deviation is 0.83%. The results show good reproducibility. Unlike previous stroboscopic techniques, the present in situ imaging system which is absence of instantaneous high intensity light employs two control signals to stimulate the microdroplet generator and the charge-coupled device (CCD) camera. Hence, the system can avoid the desynchronization problem of signals which control the strobe light-emitting diode (LED) light source and the camera in previous equipment. This technology is a reliable and cost-effective approach for capturing and measuring microdroplets.

1. Introduction

Drop-on-demand microjetting is a noncontact printing method for depositing microdroplets on various substrates. This technology has been widely used in a variety of applications including solders, ceramics, polymers, biopolymers arrays, and so on [1,2]. In order to be a reliable production technology, the jetting performance should be captured and controlled accurately. Then, the approach to obtain the sequential images of the microdroplet formation process and measure the droplet characteristics including size and speed are two essential crucial factors. However, the whole stages during drop formation last less than 3 ms. In this process, even a 104 FPS (frames per second) camera can capture only one or two images. Therefore, the common high-speed camera simply cannot capture the details of the microdroplet formation processes. The ultrahigh-speed camera can directly implement sequential photograph for jetting process. But the price is extremely expensive [3,4]. Accordingly, a reliable and low-cost image system for visualizing the microdroplet formation dynamic motion is necessary.
In recent years, the emergence of stroboscopic technique provided an effective approach to record microjetting. Along with this technology was put forward, many image acquisition systems of microdroplets based on delay triggering have been proposed, and their components and features are illustrated in Table 1. Dong et al. [5] described a visualizing apparatus based on flash photography including a pulsed laser, a charge-coupled camera, and signal generators. Sharp images with sufficient temporal resolution had been obtained. Hutchings et al. [6] described a technique which had been developed for analyzing the shape and development of ink jets and drops. Kwon et al. [7] proposed an image measurement system to observe and analyze the image of the droplet. The components were the multifunction I/O unit, a strobe light-emitting diode (LED) light and a charge-coupled device (CCD). The two counters in multifunction I/O unit could generate two digital pulse trains. The first digital pulse was to stimulate the waveform for the jetting. The second was used as a trigger signal for controlling a strobe LED light which was synchronized with the signal used to produce the ink jet. By adjusting the delay time, the microdrop formation process could be obtained. The in situ measurement system built by Fan et al. [8] was composed of a CCD camera, a zoom lens, and a stroboscopic light. The strobe light was simultaneously triggered by the same frequency as the function generator which actuated the piezoelectric ceramic film. By selecting a proper shutter speed, a steady image of the droplet could clearly be viewed and captured by the camera. Jo et al. [9] also employed the stroboscopic method to get the pictures of drop deformation by changing the delay time between the pulse inception and the flash of LED light. The precise real-time measurement technology proposed by Thurow et al. [10] was implemented in most appliances with the aid of a stroboscope camera system. The hardware was made up of a camera with an enlarging lens and a LED stroboscope. In the international standards of IEC 62899-302-1:2017 Printed electronics Part 302-1 and IEC 62899-302-2:2018 Printed electronics Part 302-2, the imaging based measurement of jetted drop speeds and drop volume was described [11,12]. By means of the above techniques, the speed and diameter of the microdroplet could be calculated based on the CCD camera image and the delay time [13,14,15]. Martin et al. published analysis of inkjet droplet image processing techniques and errors [16,17]. Laser holographic methods in 3D are described by Martin et al. [18] Hsiao et al. has published imaging work on solder balls [19]. Jung described a high-speed imaging which was used to analyze the impact and spreading the drops onto smooth glass surfaces [20]. Jiang et al. used a low-cost microcontroller board (typical cost is less than a hundred US dollars) as the pulse generator in a flash photographic system [21]. Martin et al. also described the measurement of the volumes of small (10–100 µm) liquid drops is important in a number of fields including inkjet printing, liquid dispensing, and spraying [22].
Among these systems, the print heads are all piezoelectric transducers and the image systems include the stroboscopic illumination source and CCD camera. Then, three control signals are applied to operate the ejection of the microdroplet, fire the strobe, and trigger the CCD. Therefore, the camera exposure moment must strictly coincide with the firing time of the LED light because photographing needs instantaneous high intensity light. Otherwise, the microdroplet image will be blurred due to insufficient illumination. However, the desynchronization problem about the signals will inevitably affect measurement quality and accuracy. Consequently, reducing the number of control signals and employing continuous intense light source of stable luminous flux are ideal techniques to improve the reliability and precision of this type of low-cost image system.
This paper proposed a novel in situ image acquisition and measurement of microdroplets based on delay triggering. Using a high-speed CCD camera, a motion control card, a driving circuit, a time delay triggering circuit, and a light source, an imaging system was built to obtain the sequential images of microdroplets generated through the pneumatically diaphragm-driven actuator. By adjusting the delay time, stable microdroplet fabrication process could be captured. The image processing methods have been adapted to measure the diameters, coordinates, and speeds of the microdroplets in real-time.

2. Experimental Set-Up

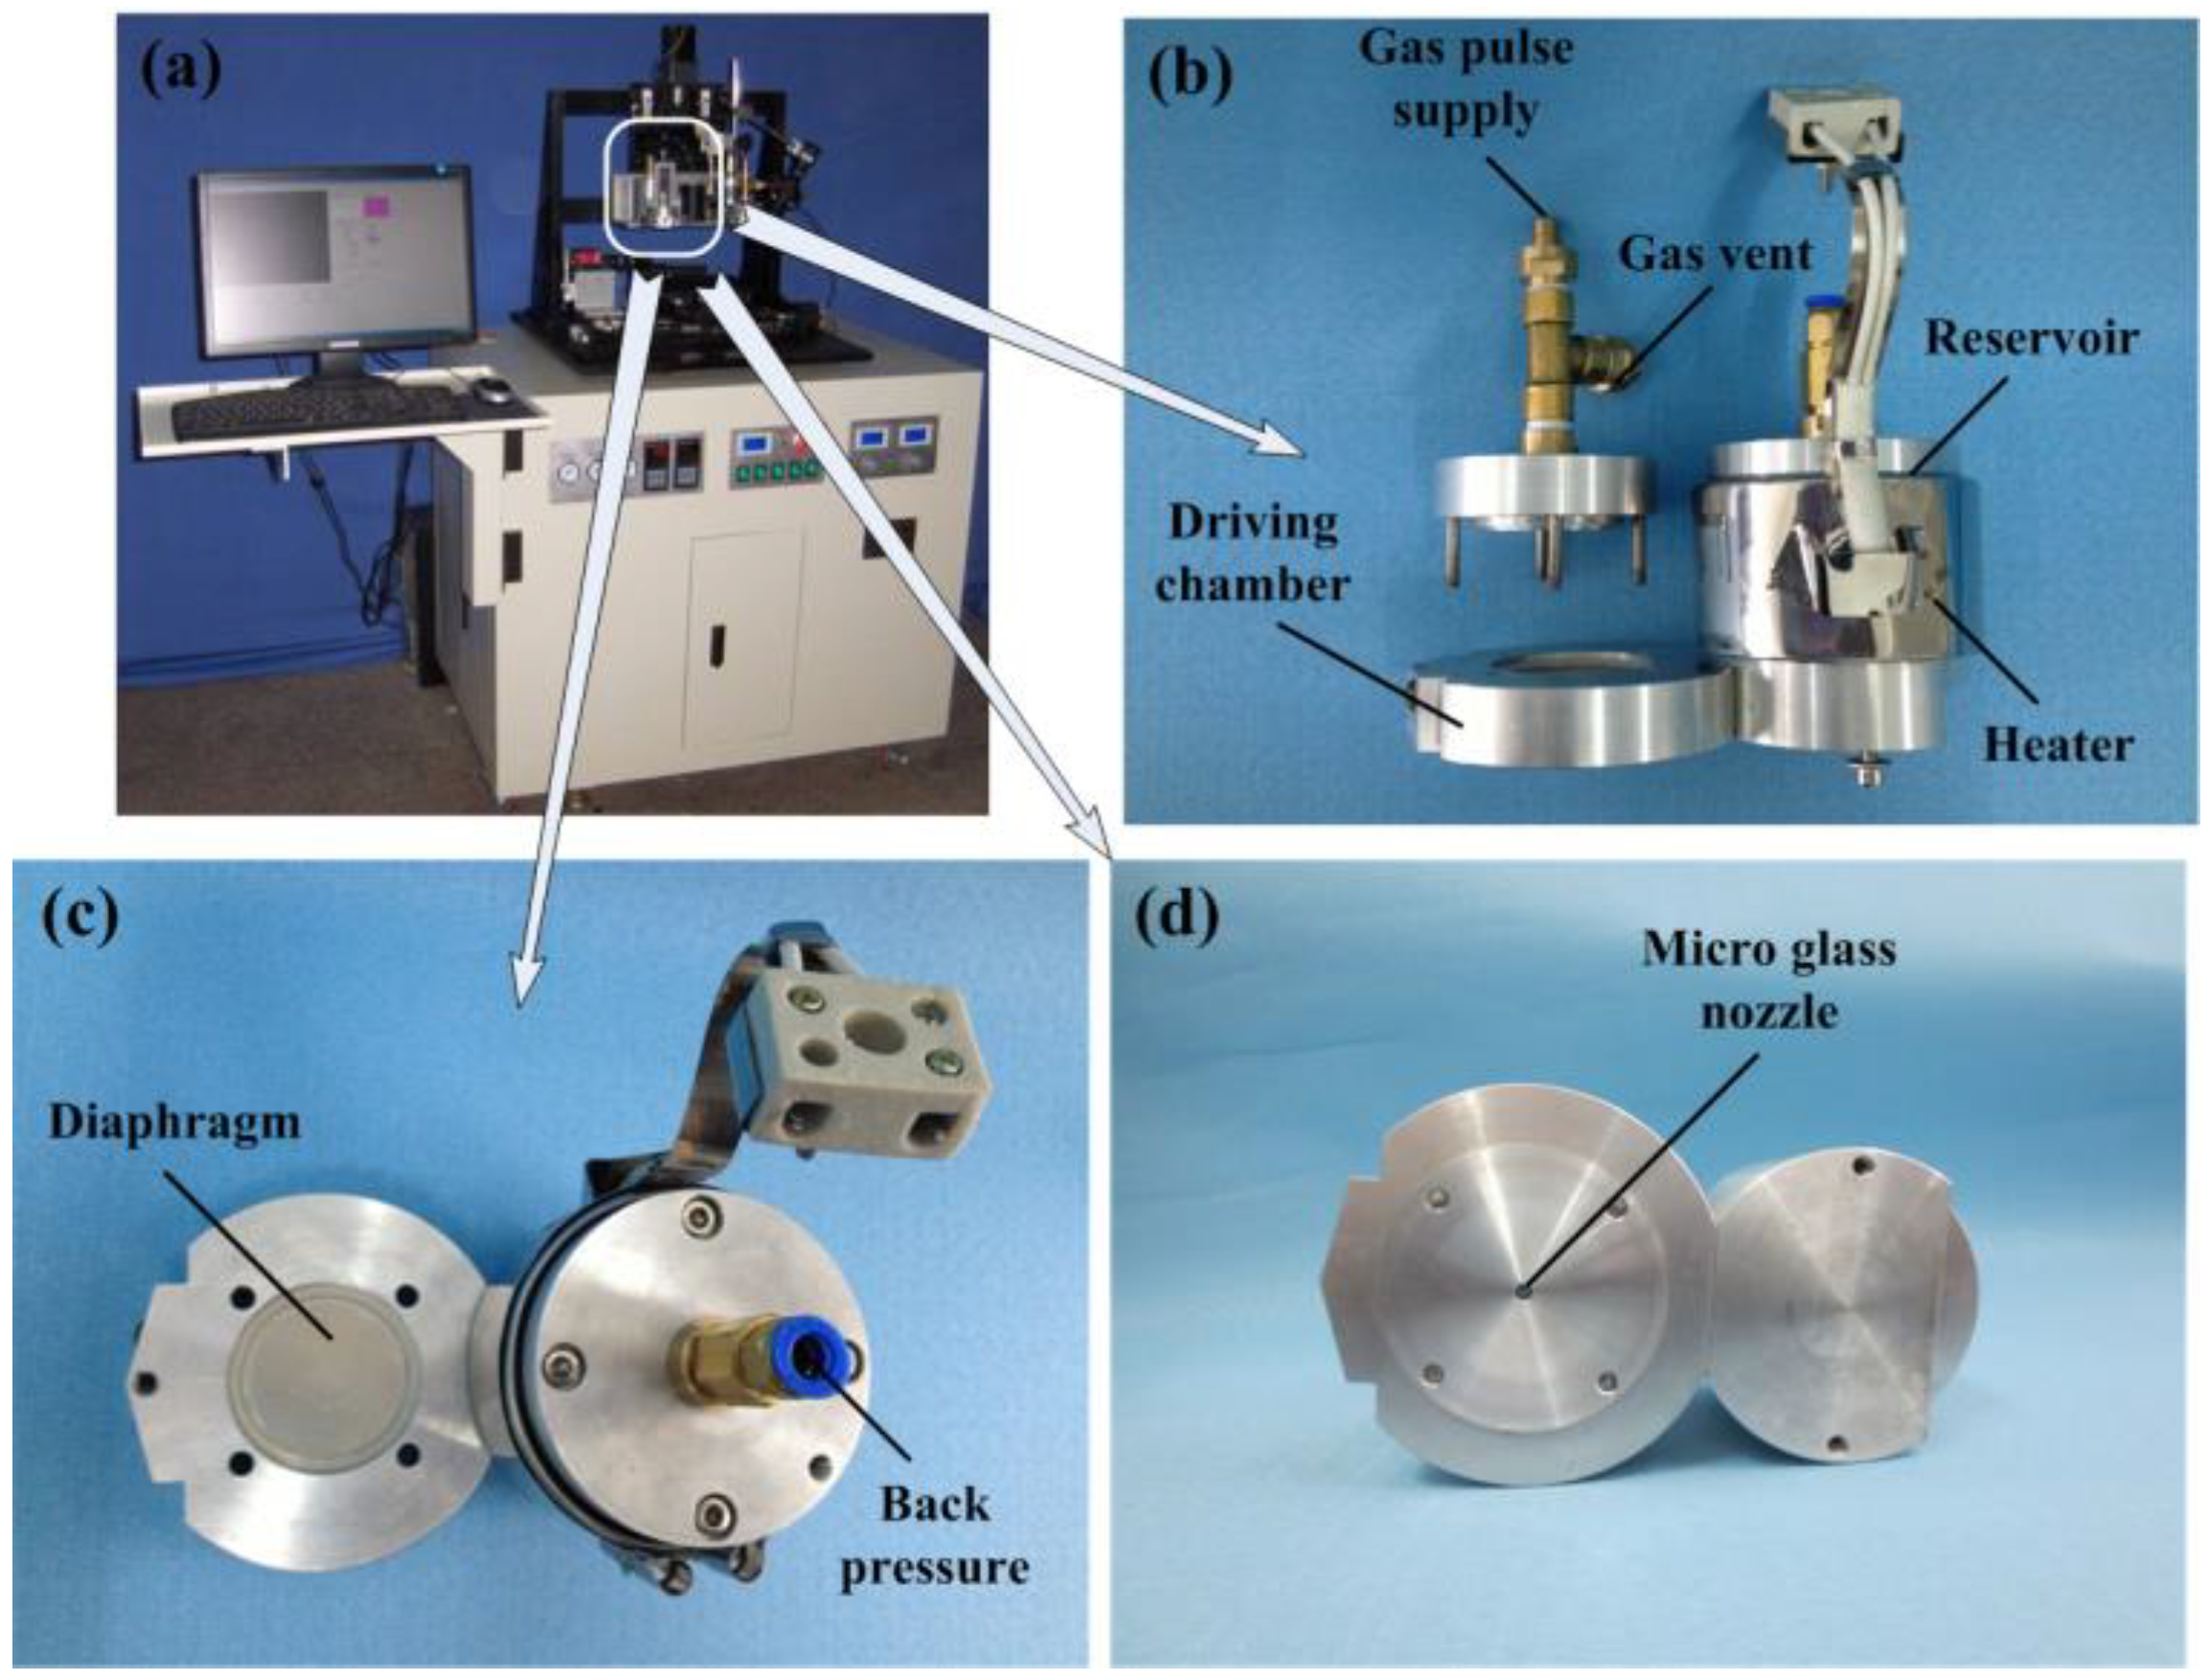
2.1. Pneumatically Diaphragm-Driven Actuator

Figure 1 shows photos of drop-on-demand microjetting system and pneumatic diaphragm microdroplet actuator. The actuator consists of a reservoir, a pneumatic chamber connecting with a solenoid valve, a driving chamber separated by a diaphragm made of stainless steel, and a microglass nozzle. When a voltage pulse is applied to the solenoid valve, the generated pneumatic pressure pulse will act on the diaphragm. Then, the diaphragm will bend and its deformation will push a certain amount of liquid out of the nozzle and form the microdroplet.

2.2. In Situ Imaging System

Figure 2 shows the in situ imaging system setup used for observing the microdroplet performance. The system is composed of a high-speed CCD camera, a 4× zoom lens, a light source with the accessory of the fiber light guide, a motion control card, a driving circuit, and a time delay circuit. The Volpi Intralux series light source provides a reliable, dependable, high-intensity cold halogen light. The Intralux includes infrared reflecting filters to ensure the coldest light and the unique crescent shaped diaphragm, which provides constant color temperature, light-emitting angle, and continuous intensity adjustment. The selected model is IX 4000-1, and the specifications are shown in Table 2. The external trigger signal is simultaneously stimulated by the same frequency as the generator which actuates the solenoid valve. Although the measured microdroplets are fast moving objects, a steady image of the microdroplet can clearly be captured by the system. When the time of exposure is too long, the image edge will be blurred. The time of CCD exposure has been set to 35 μs, and the brightness and the contrast are both adjustable on demand.
For the CCD camera, a Photonfocus MV-D750E with resolution of 1024 × 760 pixels is used. The camera includes free running and external trigger mode. When the acquisition of an image needs to be synchronized to an external event, a trigger mode can be used. As seen in Figure 3, camera control signals (CC-signals) can be defined by the camera manufacturer to provide certain signals to the camera. There are four CC-signals available and are all unidirectional with data flowing from the frame grabber to the camera. For example, the external trigger is provided by a CC-signal.
In this work, the motion control card and the time delay circuit are used to generate digital pulse trains as Figure 4 shown. Pulse I is generated from motion card. Pulse II is used as pulse signal for solenoid valve in order to generate the waveform for the jetting. Pulse III is used as external trigger signal for controlling CCD. The delay time can the modulated manually via an adjustable resistance in the time delay circuit. Due to the time delay in Pulse III, the droplet at the delayed time can appear to be steady. When setting a certain minimal interval time step, we can get the combination pictures of the ejecting process. Because the ejecting process pictures are captured at different times, reproducibility is the prerequisite for the technology. By the imaging system, the ejected trajectory can be captured and the droplet diameters and velocities can be measured from these pictures. The actual time delays between the drop ejection pulses and the external trigger pulses can be captured with an oscilloscope, as Figure 5 shown. Figure 6 is the operation interface of microjetting system developed by Visual C++ 6.0. The camera image can be imported into the software using the frame grabber.

3. Image Acquisition

Time-lapse images of microdroplet generation can be easily acquired by the in situ imaging system. When setting the minimal interval time step as 100 μs, though adjusting the variable resistance in the time delay circuit, we can get the combination pictures of the ejecting process by adjusting the interval from 0 to 5000 μs or more. In our experiment, 50 samples of the microdroplet are captured and evaluated at each moment. And 5 sets of sequence diagram are obtained to illustrate the flight and formation process of microdroplets, as the Supplementary Materials shown. Figure 7 describes the time-lapse images of microdroplet generation with one primary droplet. The solution is glycerin/water (60:40, mass ratio). The viscosity and surface tension are 10 MPa·s and 69 mN/m, respectively. When the driving pressure was 0.39 Mpa, the time of high level for input pulse was 1.7 ms and the operating frequency was 2 Hz; the ejecting process from 900 μs to 3800 μs is shown in Figure 7. It can be clearly seen the steps of ejection, elongation, necking, breakup, oscillation, and formation; only one primary droplet came into being under these conditions. Since the ejected trajectory can be captured, the droplet diameters and velocities can be measured from these pictures through the method of image processing.

4. Image Processing

The digital image signals captured directly by CCD generally contain a variety of noise and distortion. The typical defects include gray concentration caused by insufficient illumination and noisy signal during the transmission process from CCD to the computer. Although the improvement of image capture hardware can effectively reduce the defects, image processing technology on the initial image for correction, enhancement, noise reduction, and so on, it is an essential way to get a distinct image and obtain the accurate data. The image processing algorithms and extraction methods of microdroplet are described as follows.

4.1. Pretreatment of Droplet Images

Because the collected original images have salt-and-pepper noise, and the target (droplet) and background contrast are not high, the acquired image needs to be enhanced. The purpose of image enhancement is as follows. Firstly, the visual effect of the image and the clarity of the image can be improved. Secondly, the image can be converted into a more suitable form for human or machine analysis and processing. According to the purpose and effect of enhancement, there are many methods for image enhancement. Image enhancement can be divided into grayscale correction, image smoothing, image sharpening, image enhancement, and color enhancement according to processing space. The median filtering method is used to preprocess the collected images. The reasons why the median filtering method is an appropriate method are as follows.
(1) Median filtering is a typical nonlinear filtering technique, which can overcome the image detail blur caused by linear filters (such as the mean filter) under certain conditions.
(2) Median filter is a typical low-pass filter, which is mainly used to suppress impulse noise. It can completely filter out the interference noise of sharp wave, and at the same time has the characteristics of better protection of the edge of the target image.
(3) The median filter is nonlinear and has a strong filtering effect on salt-and-pepper noise or pulsed interference.
The three characteristics of the median filter method are exactly in line with the requirements of “protecting the edge of the target image and eliminating salt-and-pepper noise”. The image preprocessing achieved good results. Subsequently, in order to further the contrast between the droplet and the background, a grayscale linear transformation was performed on the median-filtered picture. Finally, the small area where the droplets are located is obtained by means of threshold segmentation, feature extraction, and morphology.
The purpose of the above method is to reduce the scope of image processing to a range of radius (R + Δr) (R refers to the droplet radius, Δr > 0 is the droplet radius extension value), so that only the next step is to deal with the small area where the droplets are located. The specific steps are shown as Figure 8. Figure 9 shows the steps of droplet image preprocessing.

4.2. Segmentation of Droplet Images

Image segmentation is the technique and process of segmenting an image into a number of specific regions with unique properties and extracting the target of interest. It is a crucial step from image processing to image analysis. After the previous preprocessing, a small range of regions containing only droplets can be obtained, which reduces the interference factor of the subsequent segmentation of the droplet image and simplifies the difficulty of droplet contour extraction.
The existing image segmentation methods are mainly divided into the following categories: threshold-based segmentation methods, region-based segmentation methods, edge-based segmentation methods, and segmentation methods based on specific theories.
Based on the advantages of the Canny algorithm and the characteristics of the droplet image, the Canny operator in the direction operator is used to detect the edge. The direction operator is based on the differentiation in a particular direction to detect the edge. In the following three standard senses, the Canny operator is optimal for step edges that are affected by white noise.
(1) Testing standards: no important edges are lost, and there should be no false edges.
(2) Positioning criteria: the deviation between the actual edge and the detected edge position is the minimum.
(3) Single response criteria: reduce multiple responses to a single edge response.
The edge detection is performed by using the canny operator of Figure 9 to obtain the sub-pixel outline of the droplet, as shown in Figure 10.

4.3. Circle Fitting of the Droplet Profile

Since the image was acquired under steady-state conditions, the droplets gradually became stable during the flight until a standard sphere was formed (assuming the droplets were flying far enough). Therefore, the outline of the droplets in the steady state is approximately circular. If the contour of the droplet extracted in Section 4.2 has a roundness of 0.98 or more, it can be considered that the droplet under this condition is in a stable state, and that its morphology can be approximated as a standard sphere. However, due to the presence of the reflective surface of the droplet and the presence of salt-and-pepper noise, the extracted edges are not smooth. In order to facilitate the calculation of the liquid volume and the accuracy of the edge extraction, the shape of the sub-pixel edge obtained above is fitted. A circle-fit image of the droplet profile as shown in Figure 11 was obtained.

5. Measurement of Micro-Drops

5.1. The Volume of the Drops

As shown in Figure 11, the fitted curve is an accurate circle; the microdroplet can be described as a sphere. For a spherical model, its volume derives directly from the radius of the two-dimensional contour profile. In this study, the droplet volume is calculated by the radius, the estimated volume is
V = 4 3 π R 3
According to the results of the circle fitting in Section 4.3, we can easily get the pixel coordinates and radius of the droplet. In this study, one pixel corresponds to ~2.01 μm. The obtained center coordinates and radius are shown in Figure 12.
Therefore, the diameter and volume of the droplet under this condition can be calculated as
D = 66.379 × 2.01 × 2 ≈ 266.8 µm
V = (4/3) × 3.14 × (66.379 × 2.01)3 × 10⁻³ ≈ 9944 pL
The canny algorithm is used for droplet contour extraction, which achieves the sub-pixel accuracy, then the radius deviation value is approximately ±1 pixel (1 pixel = 2.01 μm). Compared with barycentric coordinates and center coordinates extracted from the fitting circle, the coordinate deviation value is approximately ±3 pixels (1 pixel = 2.01 μm). Then, the error range of radius is ±1.5% and the error range of center coordinate is ±2.26%. These shows that the errors were nearly all less than ±3%.

5.2. The Speed of the Drops

The microdroplet speed is calculated by varying trigger delay time of CCD which is synchronized in regard to the stimulating signal for jetting. The droplet speed can be calculated from the two CCD camera images with the trigger delay time of CCD. The analyzed results need to be converted to distance in micrometers in order to calculate the speed of a droplet. Therefore, the velocity of the droplet can be calculated according to the following formula.
ν = p y 2 p y 1 t 2 t 1 × μ m / pixel
where, py is pixel location of the droplet’s center in y direction and t1 and t2 are the respective trigger delay times according to the two CCD images.
In order to calculate the velocity change of the process in which droplets are ejected from the nozzle until a stable sphere is formed in the air, the steps to calculate the velocity of the liquid at different times are as follows.
(a) Collecting an image at the nozzle where no droplets are generated and obtaining the area where the nozzle is located by image processing, the red area as shown in Figure 13 at t = 900 μs.
(b) Collecting images of different time delays and obtaining the area of the nozzle and liquid through image processing, the extracted area is shown in the red area in Figure 14.
It should be noted that the images acquired in steps (a) and (b) need to be in the same lighting environment and the image processing parameters should be consistent.
(c) Subtracting the region obtained in the step (b) and the region obtained in (a), respectively. Obtaining a region of the liquid outside the nozzle at different times, the results obtained after the regional subtraction are shown in Figure 15.
(d) Calculating the barycentric coordinates of each region by the operator in HALCON, the results are shown in Table 3.
When t = 3500 μs, there are two barycentric coordinates and, meanwhile, only one droplet is formed. When calculating the velocity of the droplet at this moment, the generated droplet and the liquid column below the nozzle are regarded as a whole; the reference point is calculated using the overall center of barycentric coordinate as the velocity.
(e) By substituting the barycentric coordinates obtained in step (d) into formula (2), the velocity of the liquid at different time delays can be obtained, as shown in Table 3.
According to Table 3, a line chart of average velocity, average abscissa, and ordinate varying with time can be plotted. In addition, in order to reflect the droplet barycentric coordinates (pixel coordinates, including horizontal and longitudinal coordinates) and the fluctuation size of velocity at each moment more clearly, the error bars of velocity, horizontal, and longitudinal coordinates are obtained according to Table 3 and are shown in Figure 16. The technique has higher accuracy compared with the method of calculating velocity with the microdroplet terminal coordinate as the reference point.
Figure 16 describes the variation relationship between droplet velocity and coordinates over time. The velocity of the droplet just ejected from the nozzle is relatively large, reaching ~0.68 m/s, then rapidly decrease under the influence of the viscous resistance and surface tension of the solution and reaches a relatively stable speed (0.18 m/s). After that, the liquid column is necked and fractured to form a droplet, and the velocity of the process is gradually reduced to zero and accompanied by the rebound phenomenon of the droplet. This is the reason why the velocity has a negative value. Finally, the droplets are in flight. According to Figure 16, the conclusions can be drawn as follows.
(1) The variation trend of velocity is basically consistent with the formation process of droplets. That is, in the initial stage, the droplets are rapidly reduced by a larger velocity, and then enter the necking and breaking stage at a relatively stable velocity. Finally, the broken droplets are in flight.
(2) The variation trend of droplet velocity–time curve in five groups is approximately the same, which indicates that the jetting condition is stable under the setting parameters (see Supplementary Material).
(3) During the formation of the droplet, the ratio of the maximum offset of the droplet in the horizontal direction (taking the central axis of the nozzle as the reference) to the total height of the drop is ~1.6%, which indicates that the nozzle is absence from the disturbance of surrounding airflow. Therefore, the influence is almost negligible.
In addition, Figure 16 also shows error bars of velocity and the horizontal and longitudinal coordinates of the droplets at each moment.
Horizontal coordinate error bar: in the process of formation and flight of droplets, there is a tendency of “small middle and big ends”. The reason is that the droplets are greatly influenced by the accumulation of liquid from the end surface of the nozzles when the droplets are just ejected from the nozzles. Since then, as the droplets continue to stretch, the influence of the accumulated fluid is getting smaller and smaller, and the value is kept within a smaller range. At approximately t = 3500 μs, one droplet is generated. At this time, the droplet is out of the binding of the liquid column, and is more susceptible to the disturbance of the airflow, and its value is slightly increased. However, the droplets in flight gradually achieve a balance under the coaction of kinetic energy, gravitational potential energy, surface free energy and heat generated from air resistance. Thus, the error bar value is getting smaller and smaller. Until t = 3800 μs, the relative standard deviation of the abscissa is 0.22% (standard deviation/average value), indicating that the position oscillation of the droplet in the horizontal direction is very small at this moment.
Longitudinal coordinate error bar: during the entire injection process, the longitudinal coordinate error bar of the droplet is maintained in a small range, which indicates that the droplet position in vertical direction is almost constant at the same delay time. This is another illustration for demonstrating jetting stability.
Velocity error bar: there is a great fluctuation approximately t = 3500 μs. At this moment, the velocity of the droplet reveals a significant change (reduces to zero or even a negative velocity) because the rebound phenomenon occurs after the droplet breaks. After that, the droplets in flight gradually achieve a balance in the mutual conversion of various kinds of energy. The shape of droplets is increasingly closer to the standard sphere; meanwhile, the velocity error bar will decrease rapidly. When t = 3800 μs, the relative standard deviation of the droplet velocity is reduced to 1.4%, which indicates that the state of the droplet is very stable at this moment.
In summary, just at t = 3800 μs, the shape of the droplet and the jetting behavior have reached to a stable state. Then, the working position of the substrate can be set near the height point at this moment, so as to fabricate a good quality pattern on the substrate.

5.3. Microsolder Ball Volume Measurement

The pneumatically diaphragm-driven actuator is also applied to generate microsolder balls. The solder brand is 63/37, with 63% tin and 37% lead. The melting point is 183 °C. At 200 °C and the viscosity and surface tension are 2.88 mPa·s and 0.435 N/m. Figure 17a shows microsolder balls in silicone oil and Figure 17b shows microsolder balls array (20 × 20) on stainless steel plate. The detailed volume data of 200 microsolder balls in Figure 17a are plotted in Figure 18. The average diameter is 87.96 μm, the standard deviation is 0.7265 μm, and the relative standard deviation is 0.83%. The average volume is 356.36 pL, the mean standard deviation is 8.8218 pL, and the relative standard deviation is 2.5%.

6. Conclusions

This paper proposed a novel in situ image acquisition and measurement of microdroplets based on delay triggering. Using a high-speed CCD camera, a motion control card, a driving circuit, a time delay triggering circuit, and a light source, an imaging system is built to obtain the sequential images of microdroplets generated through the pneumatically diaphragm-driven actuator. By adjusting the delay time, the stable microdroplet fabrication process can be captured. The image processing methods have been adapted to measure the coordinates, diameters and speeds of the microdroplets real-time. For glycerin/water (60:40, mass ratio), under the given condition, the average of diameter and volume are 266.8 μm and 9944 pL, respectively. The maximum average velocity of the microdroplets is 0.689 m/s. Finally, the pneumatically diaphragm-driven actuator is applied to generate microsolder balls. The results show the system processes good reproducibility. The average diameter is 87.96 μm, the standard deviation is 0.7265 μm, and the relative standard deviation is 0.83%. The in situ imaging system employs two control signals to stimulate the microdroplet generator and the CCD camera and is absence of instantaneous high intensity light. Hence, the system can avoid the desynchronization problem of signals which control the strobe LED light source and the camera in previous techniques. The system with low cost and simple configuration is especially applicable to capture and analyze the flight process of microdroplets involving fairly large sizes (~200 μm) moving at low speed (~1 m/s). This technology is a reliable and cost-effective for acquiring and measuring microdroplets.

Supplementary Materials

The following are available online at https://www.mdpi.com/2072-666X/10/2/148/s1.

Author Contributions

D.X., X.S., and X.C. conceived and designed the experiments; K.Z., K.X., and B.L. performed the experiments; K.Z. conducted image processing optimization; W.C. analyzed the data; C.W. contributed reagents; and X.C. wrote the paper. All authors discussed the results and commented on the manuscript.

Funding

This work was supported by the Natural National Science Foundation of China (NSFC) (Grant No. 51875491, No. 51475400), the Natural Science Foundation of Fujian Province (Grant No. 2017J01492), and the Xiamen Municipal Science and Technology Plan Project (Grant No. 3502Z20179030, No. 3502Z20183049). This work was also supported by the Program for Innovative Research Team in Science and Technology in Fujian Province University. The experimental work is mainly carried out at the Institute of Micro-Systems in School of Mechanical Science and Engineering in Huazhong University of Science and Technology. The financial and technique supports are gratefully acknowledged.

Conflicts of Interest

The authors declare no conflict of interest.

References

  1. Dong, H.; Carr, W.W.; Morris, J.F. An experimental study of drop-on-demand drop formation. Phys. Fluids 2006, 18, 51–59. [Google Scholar] [CrossRef]
  2. Khalil, A.; Puel, F.; Chevalier, Y.; Galvan, J.M.; Rivoire, A.; Klein, J.P. Study of droplet size distribution during an emulsification process using in situ video probe coupled with an automatic image analysis. Chem. Eng. J. 2010, 165, 946–957. [Google Scholar] [CrossRef]
  3. Kwon, K.S.; Kim, W. A waveform design method for high-speed inkjet printing based on self-sensing measurement. Sens. Actuators A 2007, 140, 75–83. [Google Scholar] [CrossRef]
  4. Shin, Y.J.; Lee, J.B. Machine vision for digital microfluidics. Rev. Sci. Instrum. 2010, 81, 014302. [Google Scholar] [CrossRef] [PubMed]
  5. Dong, H.; Carr, W.W.; Morris, J.F. Visualization of drop-on-demand inkjet: Drop formation and deposition. Rev. Sci. Instrum. 2006, 77, 085101. [Google Scholar] [CrossRef]
  6. Hutchings, I.; Martin, G.; Hoath, S. High speed imaging and analysis of jet and drop formation. J. Imaging Sci. Technol. 2007, 51, 438–444. [Google Scholar] [CrossRef]
  7. Kwon, K.S. Speed measurement of ink droplet by using edge detection techniques. Measurement 2009, 42, 44–50. [Google Scholar] [CrossRef]
  8. Fan, K.C.; Chen, J.Y.; Wang, C.H.; Pan, W.C. Precision in situ volume measurement of micro droplets. J. Opt. A Pure Appl. Opt. 2008, 11, 015503. [Google Scholar] [CrossRef]
  9. Jo, B.W.; Lee, A.; Ahn, K.H.; Lee, S.J. Evaluation of jet performance indrop-on-demand (DOD) inkjet printing. Korean J. Chem. Eng. 2009, 26, 339–348. [Google Scholar] [CrossRef]
  10. Thurow, K.; Krü, T.; Stoll, N. An optical approach for the determination of droplet volumes in nanodispensing. J. Anal. Methods Chem. 2009, 2009, 1–9. [Google Scholar] [CrossRef] [PubMed]
  11. IEC 62899-302-1:2017 Printed Electronics—Part 302-1: Equipment—Inkjet—Imaging Based Measurement of Jetting Speed. Available online: https://webstore.iec.ch/preview/info_iec62899-302-1%7Bed1.0%7Den.pdf (accessed on 21 February 2019).
  12. IEC 62899-302-2:2018 Printed Electronics—Part 302-2: Equipment—Inkjet—Imaging-Based Measurement of Droplet Volume. Available online: https://webstore.iec.ch/preview/info_iec62899-302-2%7Bed1.0%7Den.pdf (accessed on 21 February 2019).
  13. Jia, C.; Chen, G.; Li, X.; Liu, J.; Zhao, L. Droplet Surface Tension Calculation Method Based on Contour Fitting. J. Comput. Inf. Syst. 2013, 9, 2075–2082. [Google Scholar]
  14. Fan, K.C.; Wang, N.; Wang, Z.W.; Zhang, H. Development of a roundness measuring system for microspheres. Meas. Sci. Technol. 2014, 25, 064009. [Google Scholar] [CrossRef]
  15. King, B.A.; Winward, T.W.; Bjorneberg, D.L. Comparison of drop size and velocity measurements by a laser precipitation meter and low-speed photography for an agricultural sprinkler. Appl. Eng. Agric. 2014, 30, 413–421. [Google Scholar]
  16. Ravasio, C.S.; Hoath, S.D.; Martin, G.D.; Boltryk, P.; Dorrestijn, M. Meniscus Motion Inside A DoD Inkjet Print-Head Nozzle. In Proceedings of the 32nd International Conference on Digital Printing Technologies (NIP): Printing for Fabrication 2016, Manchester, UK, 12–16 September 2016. [Google Scholar]
  17. Martin, G.D.; Castrejónpita, J.R.; Hutchings, I.M. Holographic Measurement of Drop-on-Demand Drops in Flight. In Proceedings of the 27th International Conference on Digital Printing Technologies, Minneapolis, MN, USA, 2–6 October 2011. [Google Scholar]
  18. Castrejón-García, R.; Castrejón-Pita, J.R.; Martin, G.D.; Hutchings, I.M. The shadowgraph imaging technique and its modern application to fluid jets and drops. Rev. Mex. Fis. 2011, 57, 266–275. [Google Scholar]
  19. Hsiao, W.K.; Chun, J.H.; Saka, N. The Effects of Wetting and Surface Roughness on Liquid Metal Droplet Bouncing. J. Manuf. Sci. Eng. 2009, 131, 267–272. [Google Scholar] [CrossRef]
  20. Jung, S. Fluid Characterisation and Drop Impact in Inkjet Printing for Organic Semiconductor Devices. Ph.D. Thesis, University of Cambridge, Cambridge, UK, April 2011. [Google Scholar]
  21. Jiang, H.; Merritt, B.A.; Tan, H. A Low-Cost Flash Photographic System for Visualization of Droplets in Drop-on-Demand Inkjet. J. Imaging Sci. Technol. 2018, 62, 60502-1–60502-9. [Google Scholar] [CrossRef]
  22. Martin, G.D.; Price, W.C.; Hutchings, I.M. Measurement of Inkjet Drop Volume Estimation—The Role of Image Processing. In Proceedings of the 32nd International Conference on Digital Printing Technologies (NIP): Printing for Fabrication 2016, Manchester, UK, 12–16 September 2016. [Google Scholar]
Figure 1. (a) Drop-on-demand microjetting system, (b) side view, (c) top view, and (d) bottom view of pneumatic diaphragm microdroplet actuator.
Micromachines 10 00148 g001
Figure 2. In situ image acquisition and measurement system.
Micromachines 10 00148 g002
Figure 3. Trigger delay visualization from the trigger source to the camera.
Micromachines 10 00148 g003
Figure 4. (a) Pulse signal flow chart, (b) pulse signal timing sequence diagram.
Micromachines 10 00148 g004
Figure 5. Pulse signal for solenoid valve and external trigger signal for charge-coupled device (CCD).
Micromachines 10 00148 g005
Figure 6. Operation interface of microjetting system.
Micromachines 10 00148 g006
Figure 7. Time-lapse images of microdroplet generation (one primary droplet).
Micromachines 10 00148 g007
Figure 8. Image preprocessing flow chart.
Micromachines 10 00148 g008
Figure 9. Droplet image preprocessing. (a) original image, (b) median filter, (c) binarization, (d) connection, (e) feature selection, (f) region fill, (g) region dilation, and (h) image difference.
Micromachines 10 00148 g009
Figure 10. Droplet contour extraction (sub-pixel accuracy).
Micromachines 10 00148 g010
Figure 11. Circle fitting of the droplet profile (sub-pixel accuracy).
Micromachines 10 00148 g011
Figure 12. Center coordinates and radius of the droplet (unit: pixel).
Micromachines 10 00148 g012
Figure 13. The area where the nozzle is located when there is no injection.
Micromachines 10 00148 g013
Figure 14. The area where the nozzle and droplet are located at different times.
Micromachines 10 00148 g014
Figure 15. The shape of the droplets outside the nozzle at different times.
Micromachines 10 00148 g015
Figure 16. The speed and ordinate of the microdroplet at different times. (a) speed and horizontal ordinate VS time, (b) speed and vertical ordinate VS time.
Micromachines 10 00148 g016
Figure 17. (a) Microsolder balls in silicone oil, (b) microsolder balls array on stainless steel plate.
Micromachines 10 00148 g017
Figure 18. Measured diameters and volumes of 200 microsolder balls.
Micromachines 10 00148 g018
Table 1. Image acquisition system of microdroplets based on delay triggering and their features.
Ref.Printhead TypeJetting MaterialNumber of SignalsControl Object by Trigger Signals
[5]Trident printhead by piezo transducerGlycerin and water mixture in the weight ratio 48/523Trident printhead by piezo transducerPulsed Cu vapor laserCCD camera
[6]Xaar 126-200 print head with a linear array of 50 µm diameter nozzlesSemi-transparent UV-curable ink3Print headFlash sourceCamera
[7]Piezo inkjet printheadNanoparticles dissolved in DI (deionized) water3Piezo inkjet printheadStrobe LED lightCCD camera
[8]Piezo inkjet printheadLiquid crystal3Piezo inkjet printheadStroboscopic lightCCD camera
[9]Piezoelectric sleeve transducer printheadGlycerol and water mixture3Piezoelectric sleeve transducer printheadStrobe LED lightCCD camera
[10]Piezo inkjet printheadWater, DMSO, NMP, Acetonitrile, Dichloromethane, Methanol3Piezo inkjet printheadStrobe LED lightCCD camera
Proposed articlePneumatically diaphragm-driven actuatorGlycerin and water mixture (60/40, mass ratio)2Pneumatically diaphragm-driven actuator CCD camera
Table 2. The specifications of Volpi Intralux Model 4000-1.
Illumination Intensity at Light Guide ReceptacleUniformly Illuminated Light Guide DiameterRated Lamp LifeColor TemperatureLight AdjustmentMax Housing TempLamp-EPV
320,000 ftc10 mm1000 hrs3150 °K, constantCrescent shaped diaphragm100 °KHalogen reflector, 14.5 V/90 W
Table 3. Average abscissa, ordinate, and velocity of droplets at different times and their corresponding standard deviations.
Time (μs)Average Horizontal Coordinate (pixel)Horizontal Coordinate Standard DeviationAverage Vertical Coordinate (pixel)Vertical Coordinate Standard DeviationAverage Velocity (m/s)Velocity Standard Deviation
900141.60.10021.30.13400
1000138.00.48755.30.4150.6830.008
1100137.70.23964.10.3830.1770.012
1200137.70.27469.00.5030.0970.012
1300138.10.28877.20.5460.1660.017
1400139.30.31983.30.7110.1220.016
1500143.50.23589.80.4600.1310.012
1600143.30.18294.60.5460.0970.018
1700143.10.14899.80.5020.1030.014
1800143.70.055102.70.5550.0600.014
1900143.60.055106.60.3270.0770.006
2000143.50.045114.31.1220.1540.026
2100143.40.055120.30.3490.1220.022
2200143.30.055128.40.3490.1620
2300143.30.055139.12.4720.2170.054
2400143.00.045143.90.3290.0960.046
2500143.00.084152.70.4090.1760.010
2600143.00.130158.21.2420.1110.027
2700142.90.045169.00.3650.2180.020
2800142.90177.60.7850.1720.019
2900142.90.045185.71.4470.1630.045
3000142.80.055194.91.1580.1830.045
3100142.80.045200.80.4040.1200.031
3200142.70.084207.61.5680.1350.036
3300142.80.055219.01.8160.2330.057
3400142.80.055224.10.3770.1010.036
3500142.80.055232.30.2300.1660.007
3500142.50304.10.5180.1660.007
3600141.90.822300.71.055−0.0680.025
3700142.10.418326.20.3210.5130.021
3800142.10.313360.40.5220.6890.010

