Theoretical Design of the Scattering-Based Sensor for Analysis of the Vehicle Tailpipe Emission


Abstract
:1. Introduction
2. Principle of the Optical Particle Counter
2.1. Structure of the Optical Particle Counter
2.2. Observation Volume of Sensing Cells in OPC
2.3. Probability of Coincidence
- Decreasing the observation volume [27],
- Diluting the sampling particle flow to the OPC.
2.4. OPC Device for Detection of the Particulate Matter
2.5. Diesel Particulate Matter Concentration
2.6. Number Concentration and DPF
2.7. OPC-N3 Alphasense Company
2.8. Detection of Particulate Matter after the Exhaust Using OPC
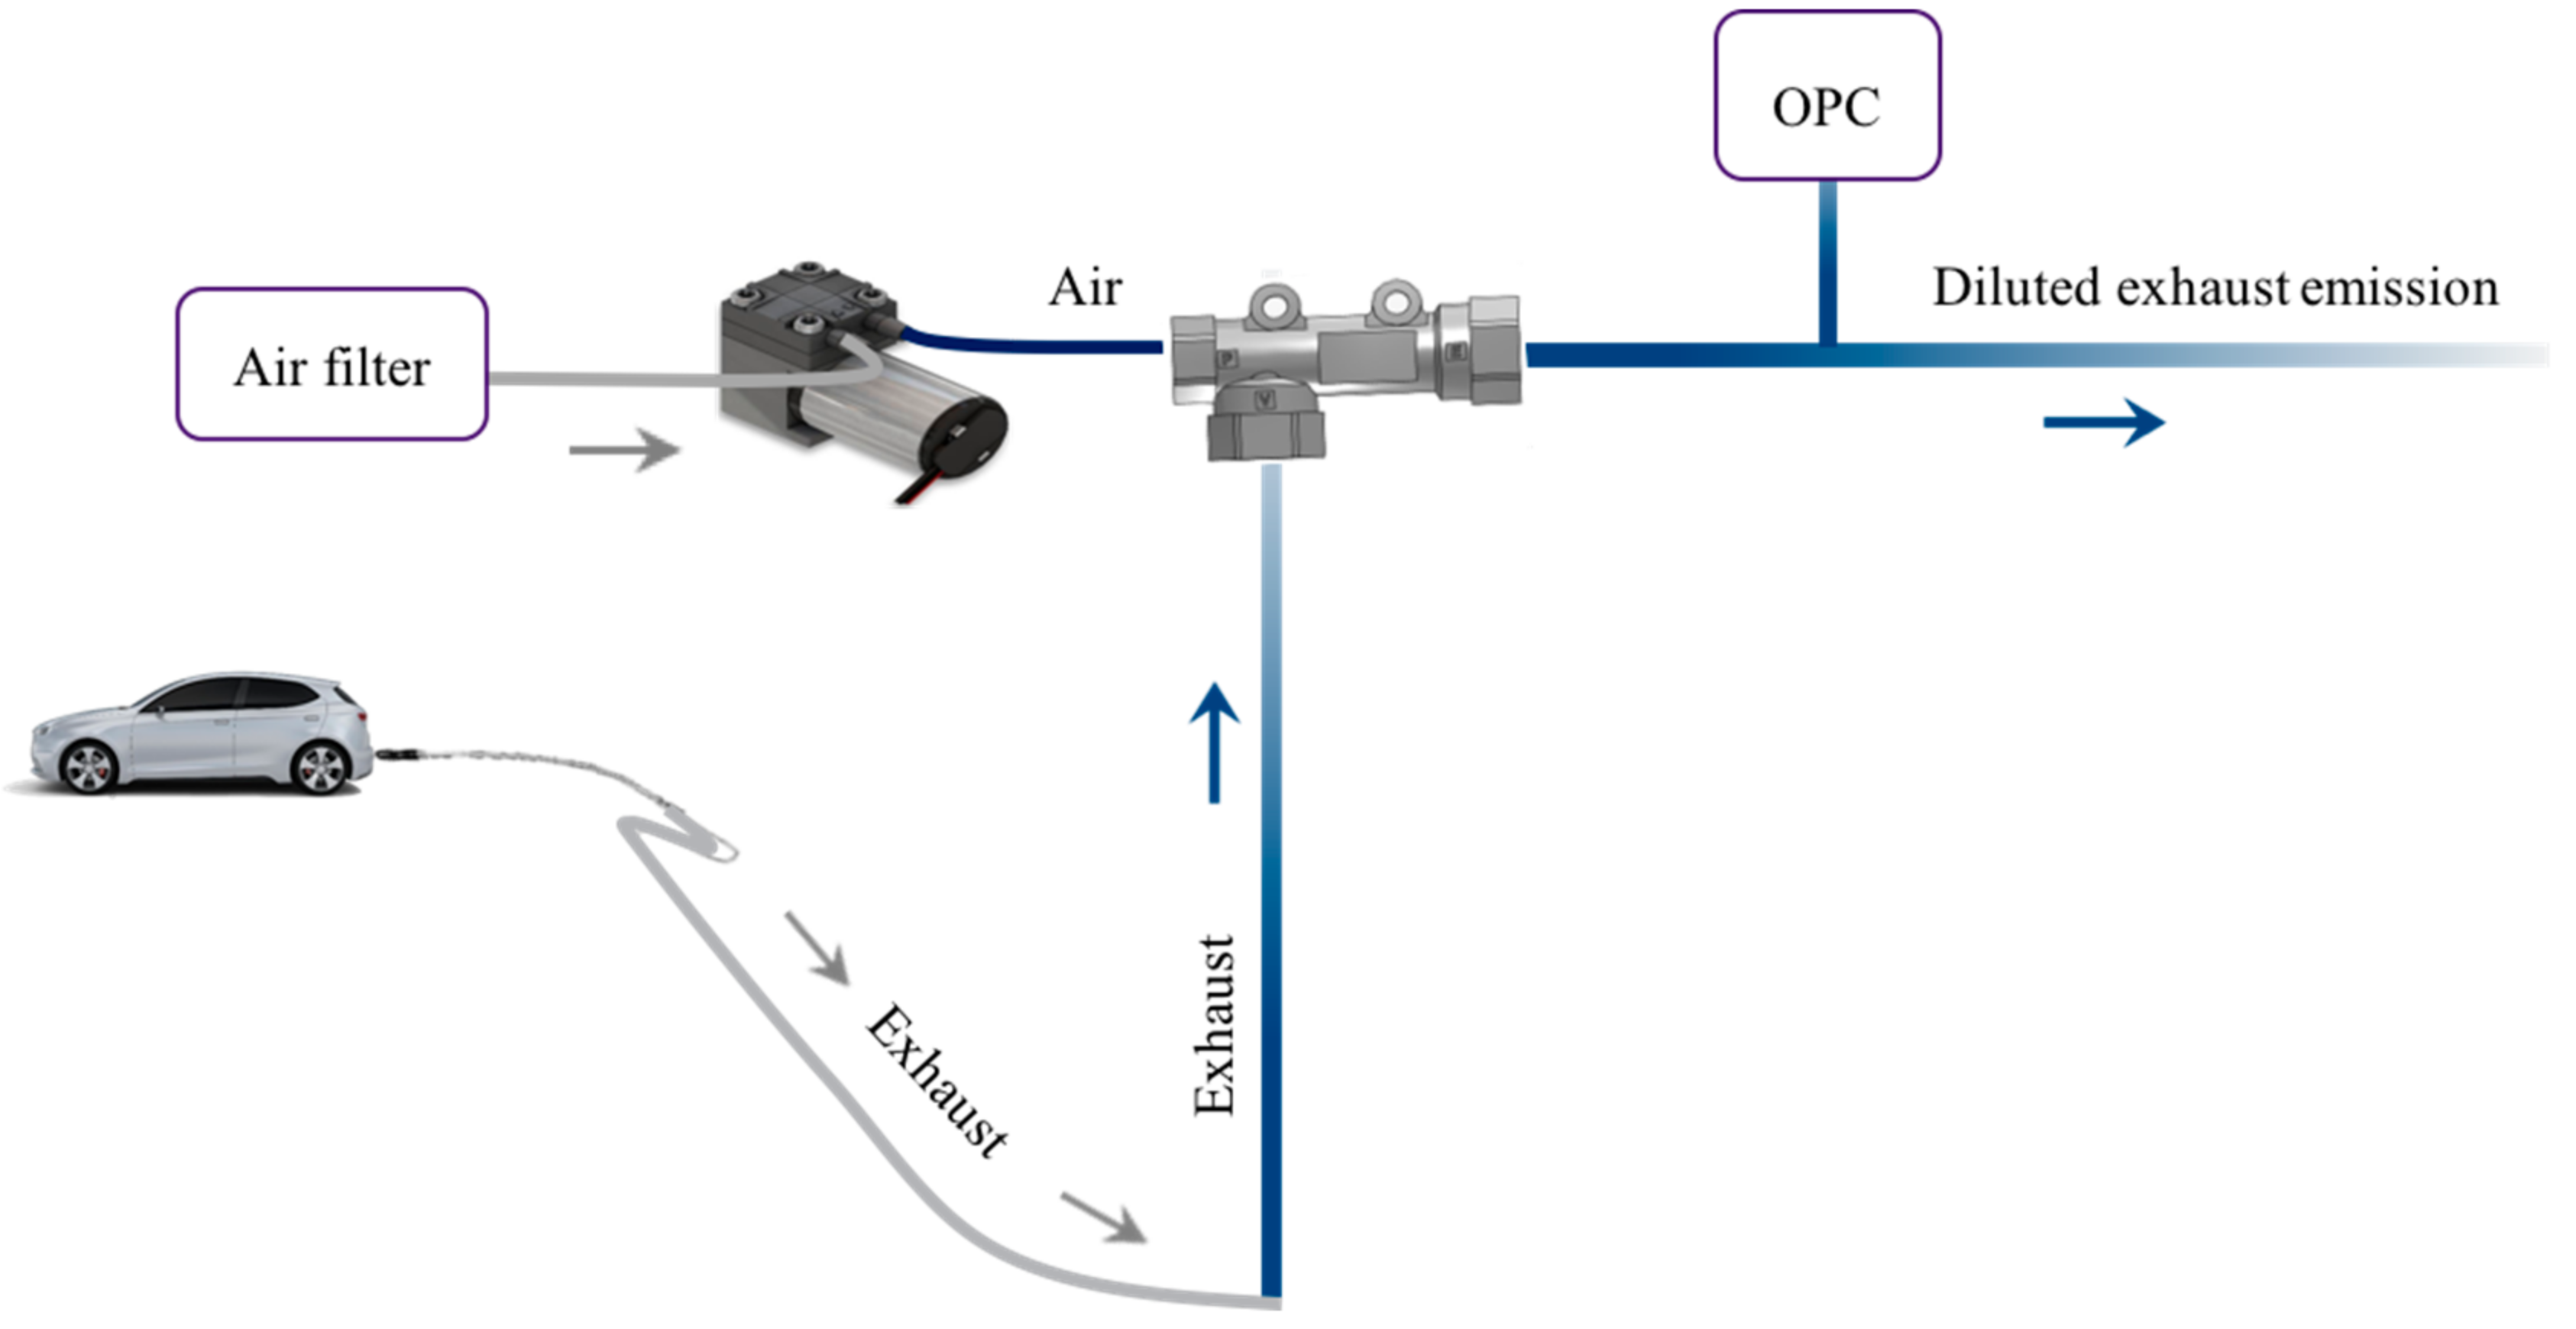
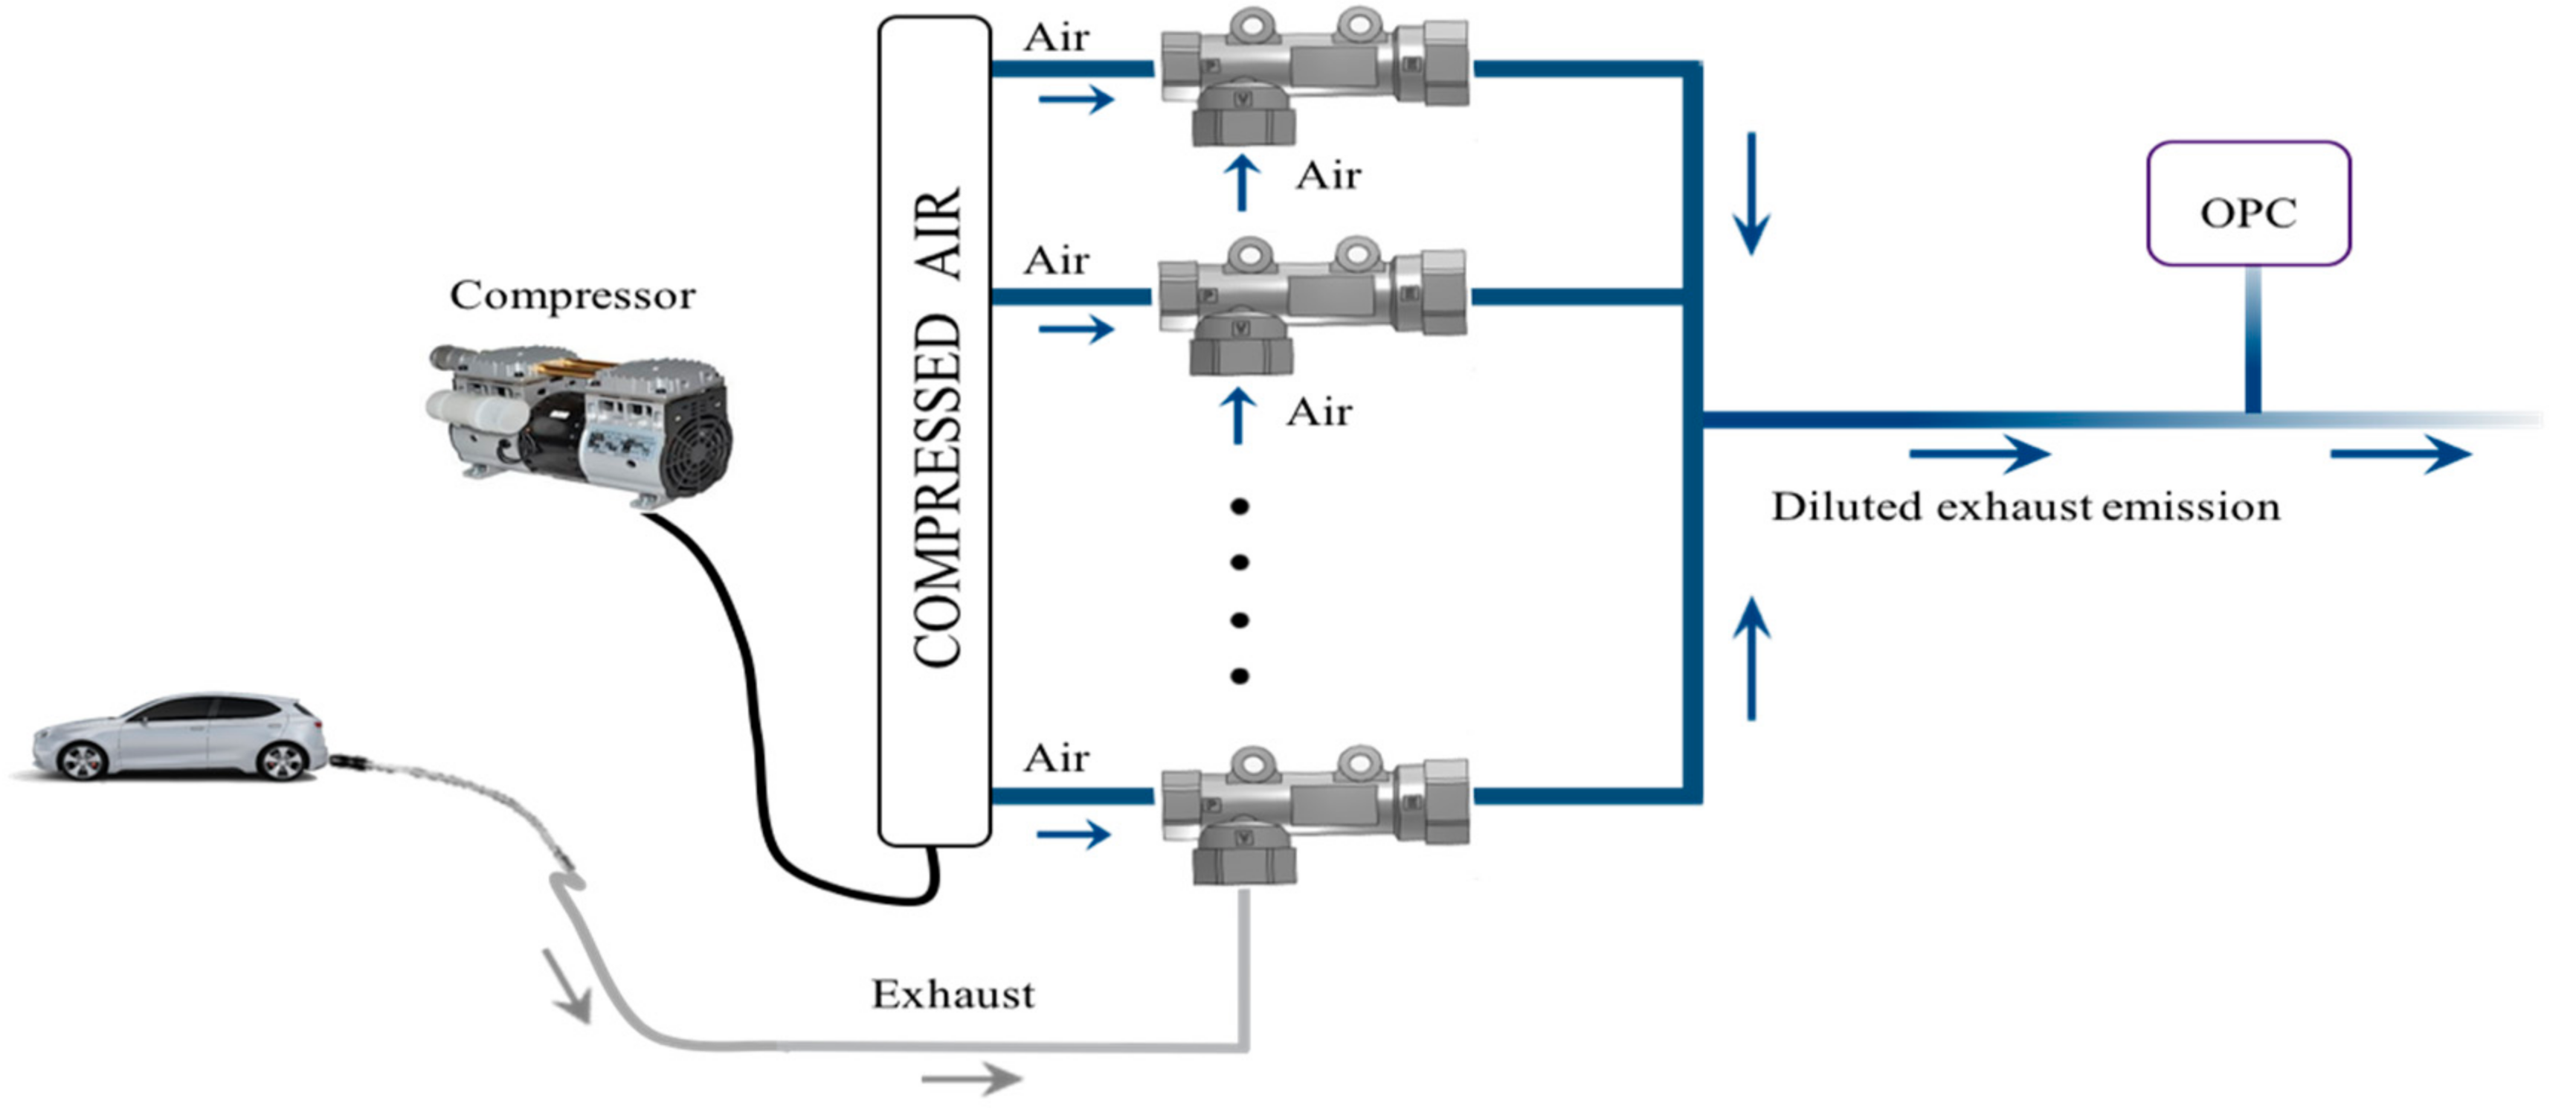
3. Sampling Process
3.1. Ejector and Dilution Factor
3.2. Parameters of the Mix Condition
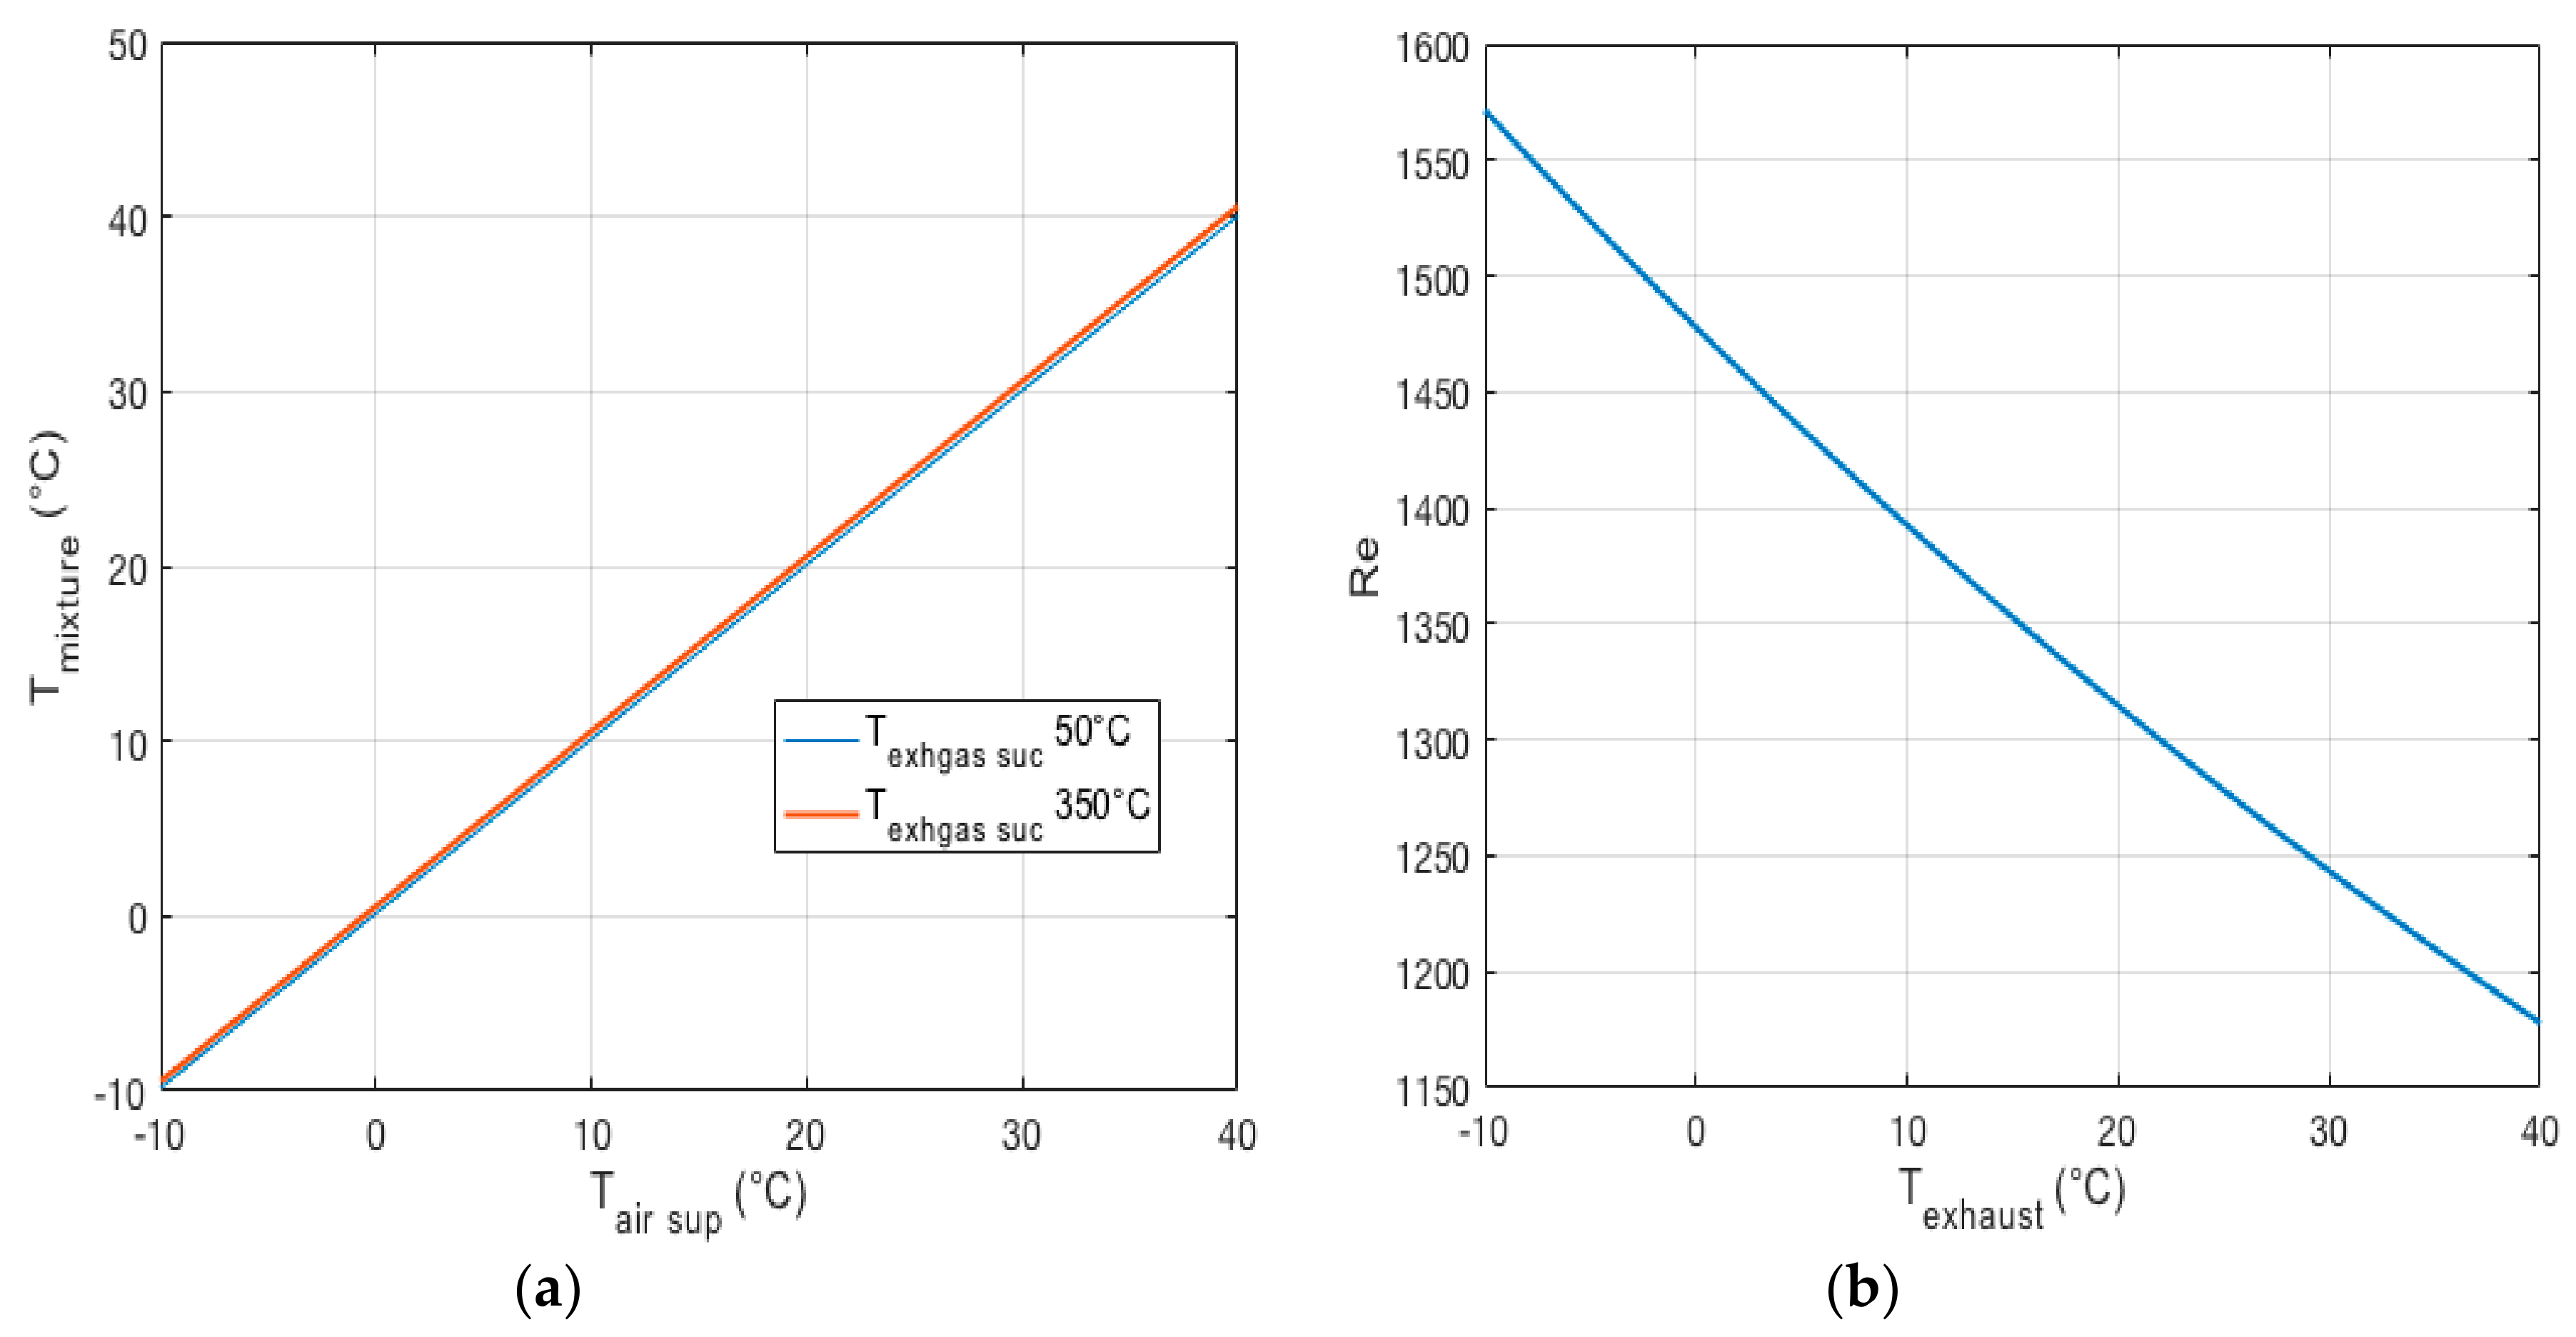
4. Temperature of the Inlet Mixture Emission of the Optical Sensor
Effect of the Temperature on the Laminar Flow of the Inlet Sampling
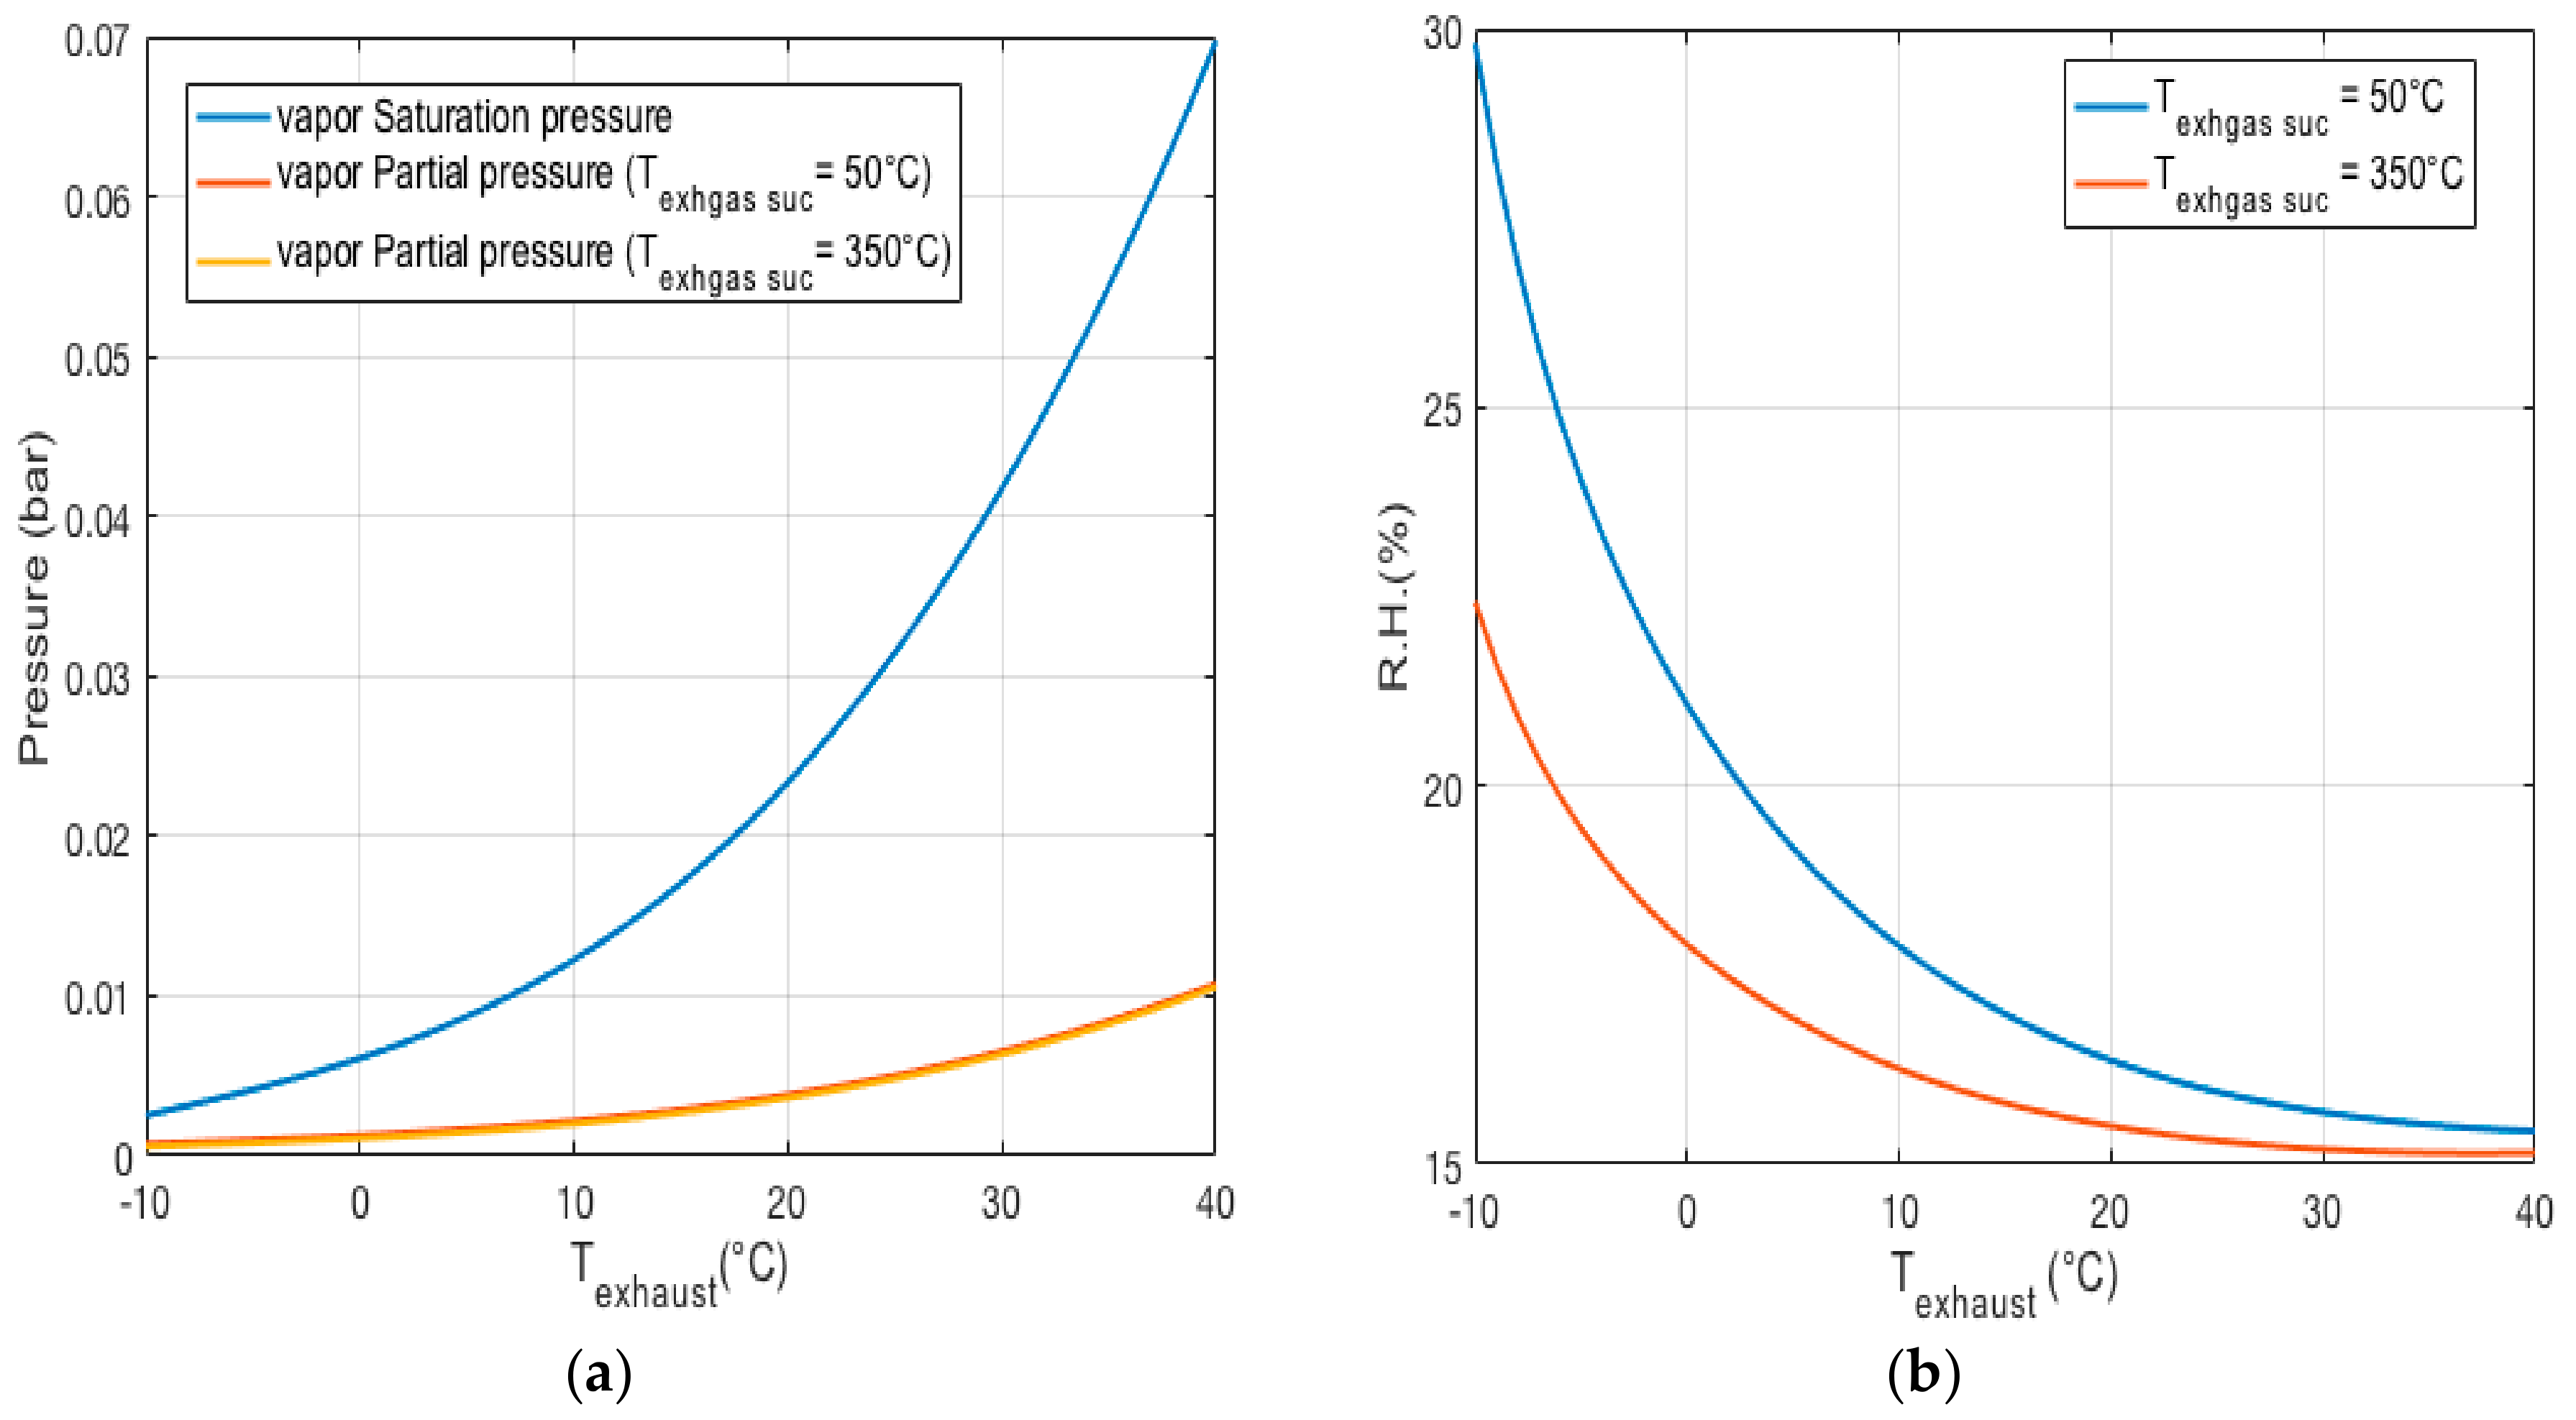
5. Humidity for the Optical Sensor
Calculation of the Partial Pressure and Relative Humidity
6. Calibration Process
7. Conclusions
Author Contributions
Funding
Conflicts of Interest
Nomenclature
| Symbols for general parameters | Definitions |
| Observation volume | |
| Laser beam diameter | |
| Diameter of the inlet nozzle | |
| Concentration of the diluted emission | |
| Real concentration of the exhaust emission | |
| Dilution factor | |
| Number of ejectors in parallel | |
| Mass flow rate after mixing | |
| Mass flow rate at exhaust suction | |
| Mass flow rate of dilution air | |
| Mass flow rate | |
| Volumetric flow rate | |
| Symbols for parameters of the fist layout | Definitions |
| Total volumetric flow rate of diluted sampling | |
| Volumetric flow rate of the raw exhaust | |
| Volumetric flow rate of the environmental air | |
| Total density of the diluted particulate matter | |
| Density of the exhaust emission | |
| Density of the air | |
| Symbols for parameters of the second layout | Definitions |
| Volumetric flow rate of the supply air | |
| Volumetric flow rate of the suction air | |
| Volumetric flow rate of the emission gas | |
| Total volumetric flow rate of air | |
| Volumetric flow rate of the supply (last ejector) | |
| Volumetric flow rate of the supply + suction | |
| Volumetric flow rate of the compressor | |
| Symbols for calculation of the temperature | Definitions |
| Temperature of the gas mixture | |
| Air temperature in the supply ejector | |
| Air temperature in the suction ejector | |
| Exhaust temperature suction emission | |
| Overall supply air mass flow rate of ejectors | |
| Air mass flow rate of the suction (n-1) ejectors | |
| Exhaust mass flow rate of the suction ejector | |
| Symbols for calculation of the humidity | Definitions |
| Total mass of the in the system | |
| Mass flow rate of water vapor in air supply ejectors | |
| Mass flow rate of the in air suction ejectors | |
| Mass flow rate of in the emission suction ejector | |
| Total mass flow rate of the dry air | |
| Mass flow rate of the dry air in supply ejectors | |
| Mass flow rate of the dry air in suction ejectors | |
| Mass flow rate of the dry emission in the suction ejector | |
| Water mixing ratio of the air–exhaust gas mixture | |
| Partial pressure of the vapor in the mix condition | |
| Standard ambient pressure | |
| Relative humidity | |
| Saturation pressure of the vapor |
References
- Ferguson, C.R.; Kirkpatrick, A.T. Internal Combustion Engines: Applied Thermosciences; John Wiley & Sons: Hoboken, NJ, USA, 2015. [Google Scholar]
- Fiebig, M.; Wiartalla, A.; Holderbaum, B.; Kiesow, S. Particulate emissions from diesel engines: Correlation between engine technology and emissions. J. Occup. Med. Toxicol. 2014, 9, 6. [Google Scholar] [CrossRef] [PubMed] [Green Version]
- Sindhu, R.; Rao, G.A.P.; Murthy, K.M. Effective reduction of NOx emissions from diesel engine using split injections. Alex. Eng. J. 2018, 57, 1379–1392. [Google Scholar] [CrossRef]
- Council Directive 92/55/EEC of 22 June 1992 Amending Directive 77/143/EEC on the Approximation of the Laws of the Member States Relating to Roadworthiness Tests for Motor Vehicles and Their Trailers (Exhaust Emission). Available online: https//op.europa.eu/en/publication-detail/-/publication/c1f20307-c7af-4a13-96b3-026237dffae0 (accessed on 18 August 2020).
- Reşitoğlu, İ.A.; Altinişik, K.; Keskin, A. The pollutant emissions from diesel-engine vehicles and exhaust aftertreatment systems. Clean Technol. Environ. Policy 2015, 17, 15–27. [Google Scholar] [CrossRef] [Green Version]
- Mohankumar, S.; Senthilkumar, P. Particulate matter formation and its control methodologies for diesel engine: A comprehensive review. Renew. Sustain. Energy Rev. 2017, 80, 1227–1238. [Google Scholar] [CrossRef]
- New Periodic Technical Inspections (NPTI). Available online: https://dieselnet.com/standards/eu/pti.php (accessed on 10 November 2020).
- Giechaskiel, B.; Maricq, M.M.; Ntziachristos, L.; Dardiotis, C.; Wang, X.; Axmann, H.; Bergmann, A.; Schindler, W. Review of motor vehicle particulate emissions sampling and measurement: From smoke and filter mass to particle number. J. Aerosol Sci. 2014, 67, 48–86. [Google Scholar] [CrossRef]
- Kulkarni, P.; Baron, P.A.; Willeke, K. Aerosol Measurement: Principles, Techniques, and Applications; John Wiley & Sons: Hoboken, NJ, USA, 2011. [Google Scholar]
- Condensation Particle Counters. Available online: https://tsi.com/products/particle-counters-and-detectors/condensation-particle-counters (accessed on 1 October 2020).
- Particle Number Measurment. Available online: http://www.sensors-inc.com/Products/SEMTECH/CPN (accessed on 1 November 2020).
- Bainschab, M.; Schriefl, M.A.; Bergmann, A. Particle number measurements within periodic technical inspections: A first quantitative assessment of the influence of size distributions and the fleet emission reduction. Atmos. Environ. X 2020, 8, 100095. [Google Scholar] [CrossRef]
- Mills, J.B.; Park, J.H.; Peters, T.M. Comparison of the DiSCmini aerosol monitor to a handheld condensation particle counter and a scanning mobility particle sizer for submicrometer sodium chloride and metal aerosols. J. Occup. Environ. Hyg. 2013, 10, 250–258. [Google Scholar] [CrossRef] [Green Version]
- Rostedt, A.; Marjamäki, M.; Yli-Ojanperä, J.; Keskinen, J.; Janka, K.; Niemelä, V.; Ukkonen, A. Non-Collecting Electrical Sensor for Particle Concentration Measurement. Aerosol Air Qual. Res. 2009, 9, 470–477. [Google Scholar] [CrossRef]
- Ntziachristos, L.; Fragkiadoulakis, P.; Samaras, Z.; Janka, K.; Tikkanen, J. Exhaust Particle Sensor for OBD Application; SAE Technical Paper Series; SAE Technical: Warrendale, PA, USA, 2011. [Google Scholar] [CrossRef]
- Papaioannou, E.; Zarvalis, D.; Melas, A.; Baltzopoulou, P.; Konstandopoulos, A.; Zamora, D.; Burtscher, H.; Fierz, M. The SUREAL-23 Project: Understanding and Measuring Sub-23 Nm Particle Emissions from Direct Injection Engines. In The Future of Road Mobility ‘Research with Impact’; Earpa: Brussels, Belgium, 2018; p. 41. [Google Scholar]
- Schriefl, M.A.; Nishida, R.T.; Knoll, M.; Boies, A.M.; Bergmann, A. Characterization of particle number counters based on pulsed-mode diffusion charging. Aerosol Sci. Technol. 2020, 54, 772–789. [Google Scholar] [CrossRef]
- Spielvogel, J.; Bischofi, O.F.; Franken, O.; Booker, D. Challenges of intriducting PN-PTI in Germany and Other Countries. Available online: https://www.tsi.com/getmedia/6d52f6f2-5a37-481a-9c68-8ec05f0a5906/White-Paper_PI_PTI_Feb-2020_A4_Web (accessed on 2 October 2020).
- Cano, M.; Vega, F.; Palomo, D.; Serrano, J.; Navarrete, B. Characterization of Condensable Particulate Matter Emissions in Agricultural Diesel Engines Using a Dilution-Based Sampling Train. Energy Fuels 2019, 33, 779–787. [Google Scholar] [CrossRef]
- Amaral, S.S.; De Carvalho, J.A., Jr.; Costa, M.A.M.; Pinheiro, C. An Overview of Particulate Matter Measurement Instruments. Atmosphere 2015, 6, 1327–1345. [Google Scholar] [CrossRef] [Green Version]
- Puiu, P.D. Microfluidic and Micromachined/MEMS Devices for Separation, Discrimination and Detection of Airborne Particles for Pollution Monitoring. Micromachines 2019, 10, 483. [Google Scholar] [CrossRef] [Green Version]
- Sousan, S.; Koehler, K.; Hallett, L.; Peters, T.M. Evaluation of the Alphasense optical particle counter (OPC-N2) and the Grimm portable aerosol spectrometer (PAS-1.108). Aerosol Sci. Technol. 2016, 50, 1352–1365. [Google Scholar] [CrossRef] [PubMed]
- Markowicz, K.M.; Chiliński, M.T. Evaluation of Two Low-Cost Optical Particle Counters for the Measurement of Ambient Aerosol Scattering Coefficient and Ångström Exponent. Sensors 2020, 20, 2617. [Google Scholar] [CrossRef] [PubMed]
- Lee, H.; Yook, S.-J.; Ahn, K. Effects of exponentially decaying and growing concentrations on particle size distribution from a scanning mobility particle sizer. Aerosol Sci. Technol. 2020, 54, 1135–1143. [Google Scholar] [CrossRef]
- Northcross, A.L.; Edwards, R.; Johnson, M.A.; Wang, Z.-M.; Zhu, K.; Allen, T.; Smith, K.R. A low-cost particle counter as a realtime fine-particle mass monitor. Environ. Sci. Process. Impacts 2013, 15, 433–439. [Google Scholar] [CrossRef]
- Testo DISCMini-Handheld Measuring Instrument for Nanoparticle Counting. Available online: https://www.testo.com/en-SG/testo-discmini/p/133 (accessed on 1 October 2020).
- Pedersini, F. Improving a Commodity Dust Sensor to Enable Particle Size Analysis. IEEE Trans. Instrum. Meas. 2018, 68, 177–188. [Google Scholar] [CrossRef]
- Li, J.; Mattewal, S.K.; Patel, S.; Biswas, P. Evaluation of Nine Low-cost-sensor-based Particulate Matter Monitors. Aerosol Air Qual. Res. 2020, 20, 254–270. [Google Scholar] [CrossRef] [Green Version]
- Donateo, A.; Donateo, A.; Conte, M.; Contini, D.; Contini, D. Comparison of atmospheric particle concentration measurements using different optical detectors: Potentiality and limits for air quality applications. Measurement 2017, 106, 274–282. [Google Scholar] [CrossRef]
- Raasch, J.; Umhauer, H. Errors in the Determination of Particle Size Distributions Caused by coincidences in optical particle counters. Part. Part. Syst. Charact. 1984, 1, 53–58. [Google Scholar] [CrossRef]
- Whitby, K.T.; Willeke, K. Single Particle Optical Counters: Principles and Field Use. In Aerosol Measurement; Lundgren, D.A., Lippmann, M., Harris, F.S., Clark, W.E., Marlow, W.H., Durham, M.D., Eds.; University Presses of Florida: Gainesville, FL, USA, 1979; pp. 145–182. [Google Scholar]
- Carminati, M.; Ferrari, G.; Sampietro, M. Emerging miniaturized technologies for airborne particulate matter pervasive monitoring. Measurement 2017, 101, 250–256. [Google Scholar] [CrossRef]
- Hapidin, D.A.; Saputra, C.; Maulana, D.S.; Munir, M.M.; Khairurrijal, K. Aerosol Chamber Characterization for Commercial Particulate Matter (PM) Sensor Evaluation. Aerosol Air Qual. Res. 2019, 19, 181–194. [Google Scholar] [CrossRef] [Green Version]
- Wang, Y.; Li, J.; Jing, H.; Zhang, Q.; Jiang, J.; Biswas, P. Laboratory Evaluation and Calibration of Three Low-Cost Particle Sensors for Particulate Matter Measurement. Aerosol Sci. Technol. 2015, 49, 1063–1077. [Google Scholar] [CrossRef]
- OPC-N3 Particle Monitor for Use in High Pollution Urban Environments, Technical Specification. Available online: http://www.alphasense.com/WEB1213/wp-content/uploads/2019/03/OPC-N3.pdf (accessed on 18 August 2020).
- Gozzi, F.; Della Ventura, G.; Marcelli, A. Mobile monitoring of particulate matter: State of art and perspectives. Atmos. Pollut. Res. 2016, 7, 228–234. [Google Scholar] [CrossRef]
- Sousan, S.; Koehler, K.; Hallett, L.; Peters, T.M. Evaluation of consumer monitors to measure particulate matter. J. Aerosol Sci. 2017, 107, 123–133. [Google Scholar] [CrossRef] [Green Version]
- Diesel Exhaust Particle Size. Available online: https://dieselnet.com/tech/dpm_size.php (accessed on 18 August 2020).
- Particulate Matter Measurements. Available online: https://dieselnet.com/tech/measure_dpm.php (accessed on 2 October 2020).
- Wang, D.; Liu, Z.C.; Tian, J.; Liu, J.W.; Zhang, J.R. Investigation of particle emission characteristics from a diesel engine with a diesel particulate filter for alternative fuels. Int. J. Automot. Technol. 2012, 13, 1023–1032. [Google Scholar] [CrossRef]
- Eriksson, A.C.; Wittbom, C.; Roldin, P.; Sporre, M.; Öström, E.; Nilsson, P.; Martinsson, J.; Rissler, J.; Nordin, E.Z.; Svenningsson, B.; et al. Diesel soot aging in urban plumes within hours under cold dark and humid conditions. Sci. Rep. 2017, 7, 12364. [Google Scholar] [CrossRef]
- Rosenberg, P.D.; Dean, A.R.; Williams, P.I.; Dorsey, J.R.; Minikin, A.; Pickering, M.A.; Petzold, A. Particle sizing calibration with refractive index correction for light scattering optical particle counters and impacts upon PCASP and CDP data collected during the Fennec campaign. Atmos. Meas. Tech. 2012, 5, 1147–1163. [Google Scholar] [CrossRef] [Green Version]
- Grimm Aerosol. Available online: https://www.grimm-aerosol.com/ (accessed on 1 November 2020).
- Laboratory Evaluation AlphaSense OPC-N3 Sensor. Available online: http://www.aqmd.gov/docs/default-source/aq-spec/laboratory-evaluations/alphasense-opc-n3---lab-evaluation.pdf?sfvrsn=14 (accessed on 1 October 2020).
- Jayaratne, R.; Liu, X.; Thai, P.; Dunbabin, M.; Morawska, L. The influence of humidity on the performance of a low-cost air particle mass sensor and the effect of atmospheric fog. Atmos. Meas. Tech. 2018, 11, 4883–4890. [Google Scholar] [CrossRef] [Green Version]
- Melas, A.D.; Koidi, V.; Deloglou, D.; Daskalos, E.; Zarvalis, D.; Papaioannou, E.; Konstandopoulos, A.G. Development and evaluation of a catalytic stripper for the measurement of solid ultrafine particle emissions from internal combustion engines. Aerosol Sci. Technol. 2020, 54, 704–717. [Google Scholar] [CrossRef]
- Rostedt, A.; Ntziachristos, L.; Simonen, P.; Rönkkö, T.; Samaras, Z.; Hillamo, R.; Janka, K.; Keskinen, J. A New Miniaturized Sensor for Ultra-Fast On-Board Soot Concentration Measurements. SAE Int. J. Engines 2017, 10, 1859–1865. [Google Scholar] [CrossRef]
- Body Ported Type Vacuum Ejector, ZH Series. Available online: https://docs.rs-online.com/8a2f/0900766b81662bda.pdf (accessed on 2 October 2020).
- Rapp, B.E. Microfluidics: Modelling, Mechanics and Mathematics; Elsevier BV: Amsterdam, The Netherlands, 2017. [Google Scholar]
- Crilley, L.R.; Shaw, M.; Pound, R.; Kramer, L.J.; Price, R.; Young, S.; Lewis, A.C.; Pope, F.D. Evaluation of a low-cost optical particle counter (Alphasense OPC-N2) for ambient air monitoring. Atmos. Meas. Tech. 2018, 11, 709–720. [Google Scholar] [CrossRef] [Green Version]
- Di Antonio, A.; Popoola, O.A.M.; Ouyang, B.; Saffell, J.; Jones, R. Developing a Relative Humidity Correction for Low-Cost Sensors Measuring Ambient Particulate Matter. Sensors 2018, 18, 2790. [Google Scholar] [CrossRef] [PubMed] [Green Version]
- Badura, M.; Batog, P.; Drzeniecka-Osiadacz, A.; Modzel, P. Evaluation of Low-Cost Sensors for Ambient PM2.5 Monitoring. J. Sens. 2018, 2018, 5096540. [Google Scholar] [CrossRef] [Green Version]
- Jing, L. Standard Combustion Aerosol Generator (SCAG) for Calibration Purposes. In ETH Workshop “Nanoparticle Measurement”, 3rd ed.; ETH Hönggerberg Zürich: Zürich, Switzerland, 1999. [Google Scholar]
- Budde, M.; El Masri, R.; Riedel, T.; Beigl, M. Enabling low-cost particulate matter measurement for participatory sensing scenarios. In Proceedings of the 12th International Conference on Mobile and Ubiquitous Multimedia, Luleå, Sweden, 2–5 December 2013; pp. 1–10. [Google Scholar] [CrossRef] [Green Version]


| Technical Data | OPC-N3 |
|---|---|
| Number of bins | 24 |
| Size range | 0.35 to 40 |
| Total flow rate | 5.5 |
| Temperature range | −10 to 50 |
| Humidity range | 0–95 |
| Max coincidence probability (concentration at 106 ) | 0.84 |
| Max coincidence probability (concentration at 500) | 0.24 |
| Weight | <105 |
| Technical Data | ZH05DSA-06-06-06 |
|---|---|
| Fluid | Air |
| Operating temperature range | −5 to 50 |
| Operating pressure range | 0.1 to 0.6 |
| Nozzle nominal size | 0.5 |
| Maximum suction flow rate | 8.26 |
| Air consumption | 16 |
| Weight | 5 |
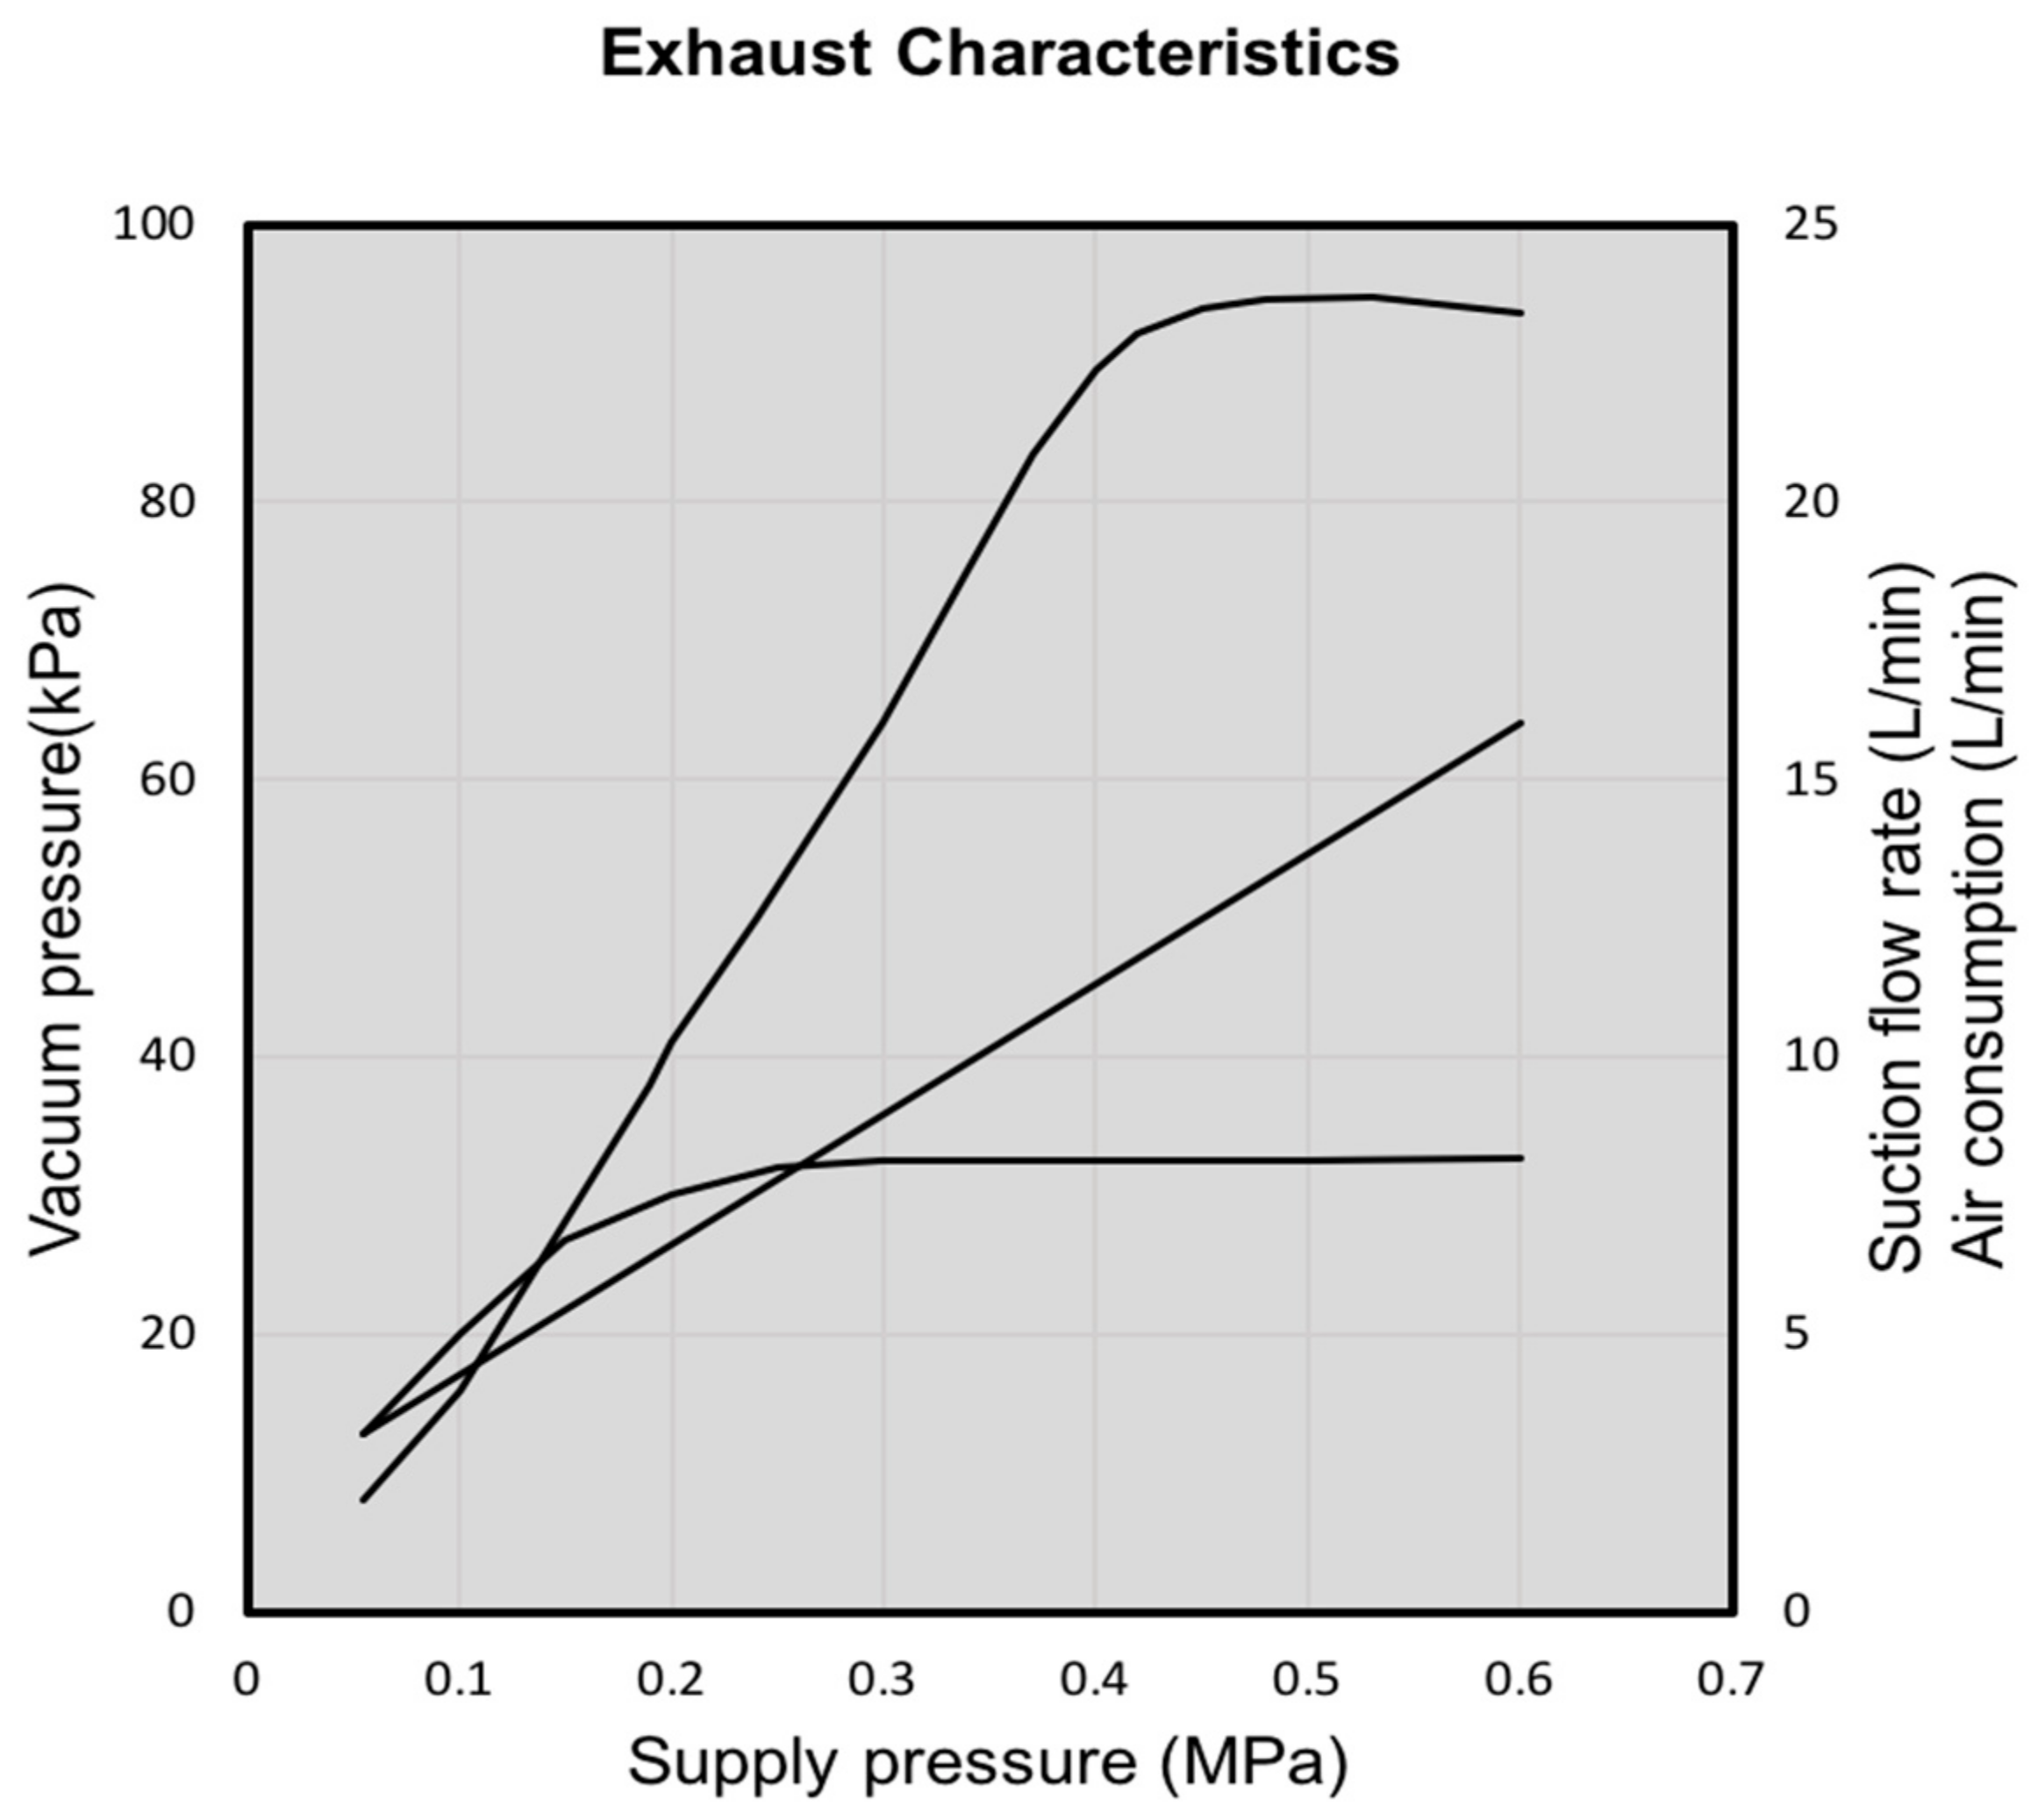
| Parameter | Values | |||||
|---|---|---|---|---|---|---|
| Pressure supply | 0.1 | 0.2 | 0.3 | 0.4 | 0.5 | 0.6 |
| Flow rate of the exhaust | 5 | 7.5 | 8.15 | 8.15 | 8.15 | 8.26 |
| Flow rate of air | 4.25 | 6.60 | 8.95 | 11.30 | 13.65 | 16 |
| Dilution factor | 0.85 | 0.88 | 1.09 | 1.38 | 1.67 | 1.93 |
| Total flow rate after the exhaust | 9.25 | 14.1 | 17.10 | 19.45 | 21.80 | 24.26 |
| Parameters | Values |
|---|---|
| Number of ejectors | 4 |
| 69.66 | |
| 8.15 | |
| 8.54 | |
| 45.21 |
| Optical Layout | List of Components | Numbers | Price [$] |
|---|---|---|---|
| Sampling system | Ejectors and tubes | 4 | 76.6 |
| Pneumatic Double Y tube | 2 | 29.42 | |
| Dilution system | Compressor | 1 | 382.40 |
| Pressure switch | 1 | 51.95 | |
| Pneumatic filter | 2 | 218 | |
| One touch manifold | 1 | 8.68 | |
| Optical sensing system | OPC-N3 | 1 | 340 |
| Conjunction system | Accessories | - | 90.15 |
| Total cost | 1200 |
Publisher’s Note: MDPI stays neutral with regard to jurisdictional claims in published maps and institutional affiliations. |
© 2020 by the authors. Licensee MDPI, Basel, Switzerland. This article is an open access article distributed under the terms and conditions of the Creative Commons Attribution (CC BY) license (http://creativecommons.org/licenses/by/4.0/).
Share and Cite
Molaie, S.; Lino, P. Theoretical Design of the Scattering-Based Sensor for Analysis of the Vehicle Tailpipe Emission. Micromachines 2020, 11, 1085. https://doi.org/10.3390/mi11121085
Molaie S, Lino P. Theoretical Design of the Scattering-Based Sensor for Analysis of the Vehicle Tailpipe Emission. Micromachines. 2020; 11(12):1085. https://doi.org/10.3390/mi11121085
Chicago/Turabian StyleMolaie, Sama, and Paolo Lino. 2020. "Theoretical Design of the Scattering-Based Sensor for Analysis of the Vehicle Tailpipe Emission" Micromachines 11, no. 12: 1085. https://doi.org/10.3390/mi11121085