Application of Miniature FBG-MEMS Pressure Sensor in Penetration Process of Jacked Pile

Abstract
:1. Introduction
2. Development of Miniature Silicon Piezoresistive Sensor
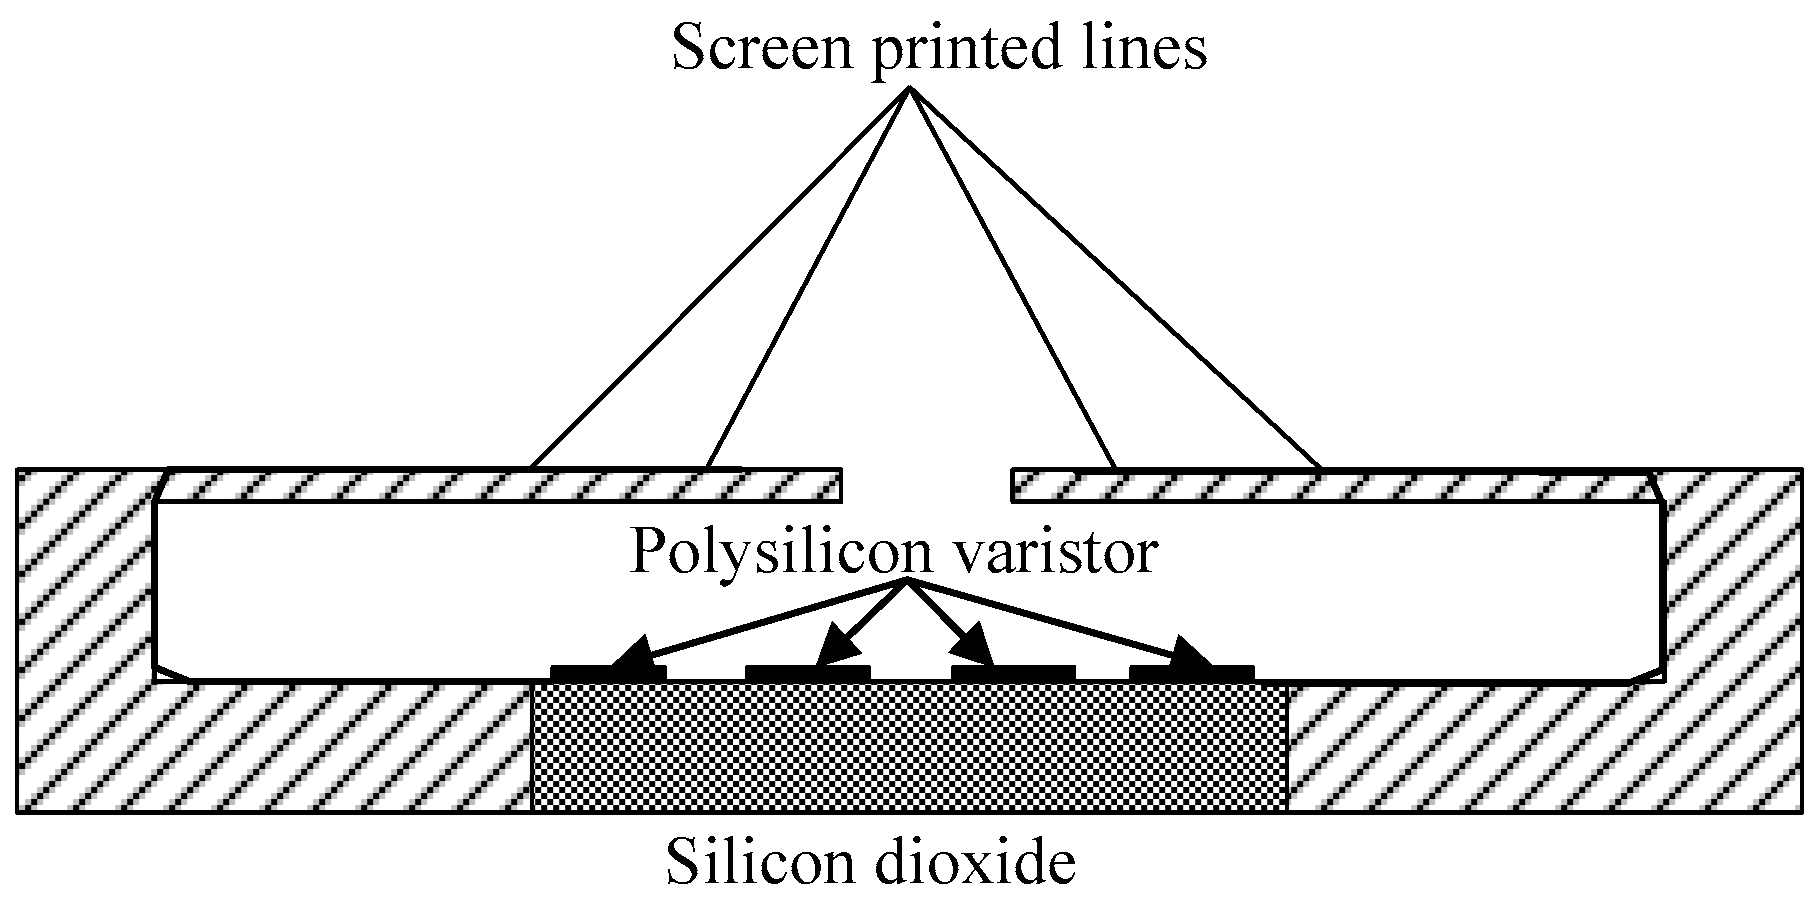
2.1. Working Principle of Silicon Piezoresistive Pressure Sensor
2.2. Design of Silicon Piezoresistive Pressure Sensor
3. Development of Sensitized FBG Strain Sensor
3.1. Working Principle of Fiber Bragg Grating
3.2. Design and Parameters of Sensitized FBG Sensor
4. Overview of Model Test
4.1. Model Test Barrel
4.2. Soil Sample Preparation
4.3. Model Pile
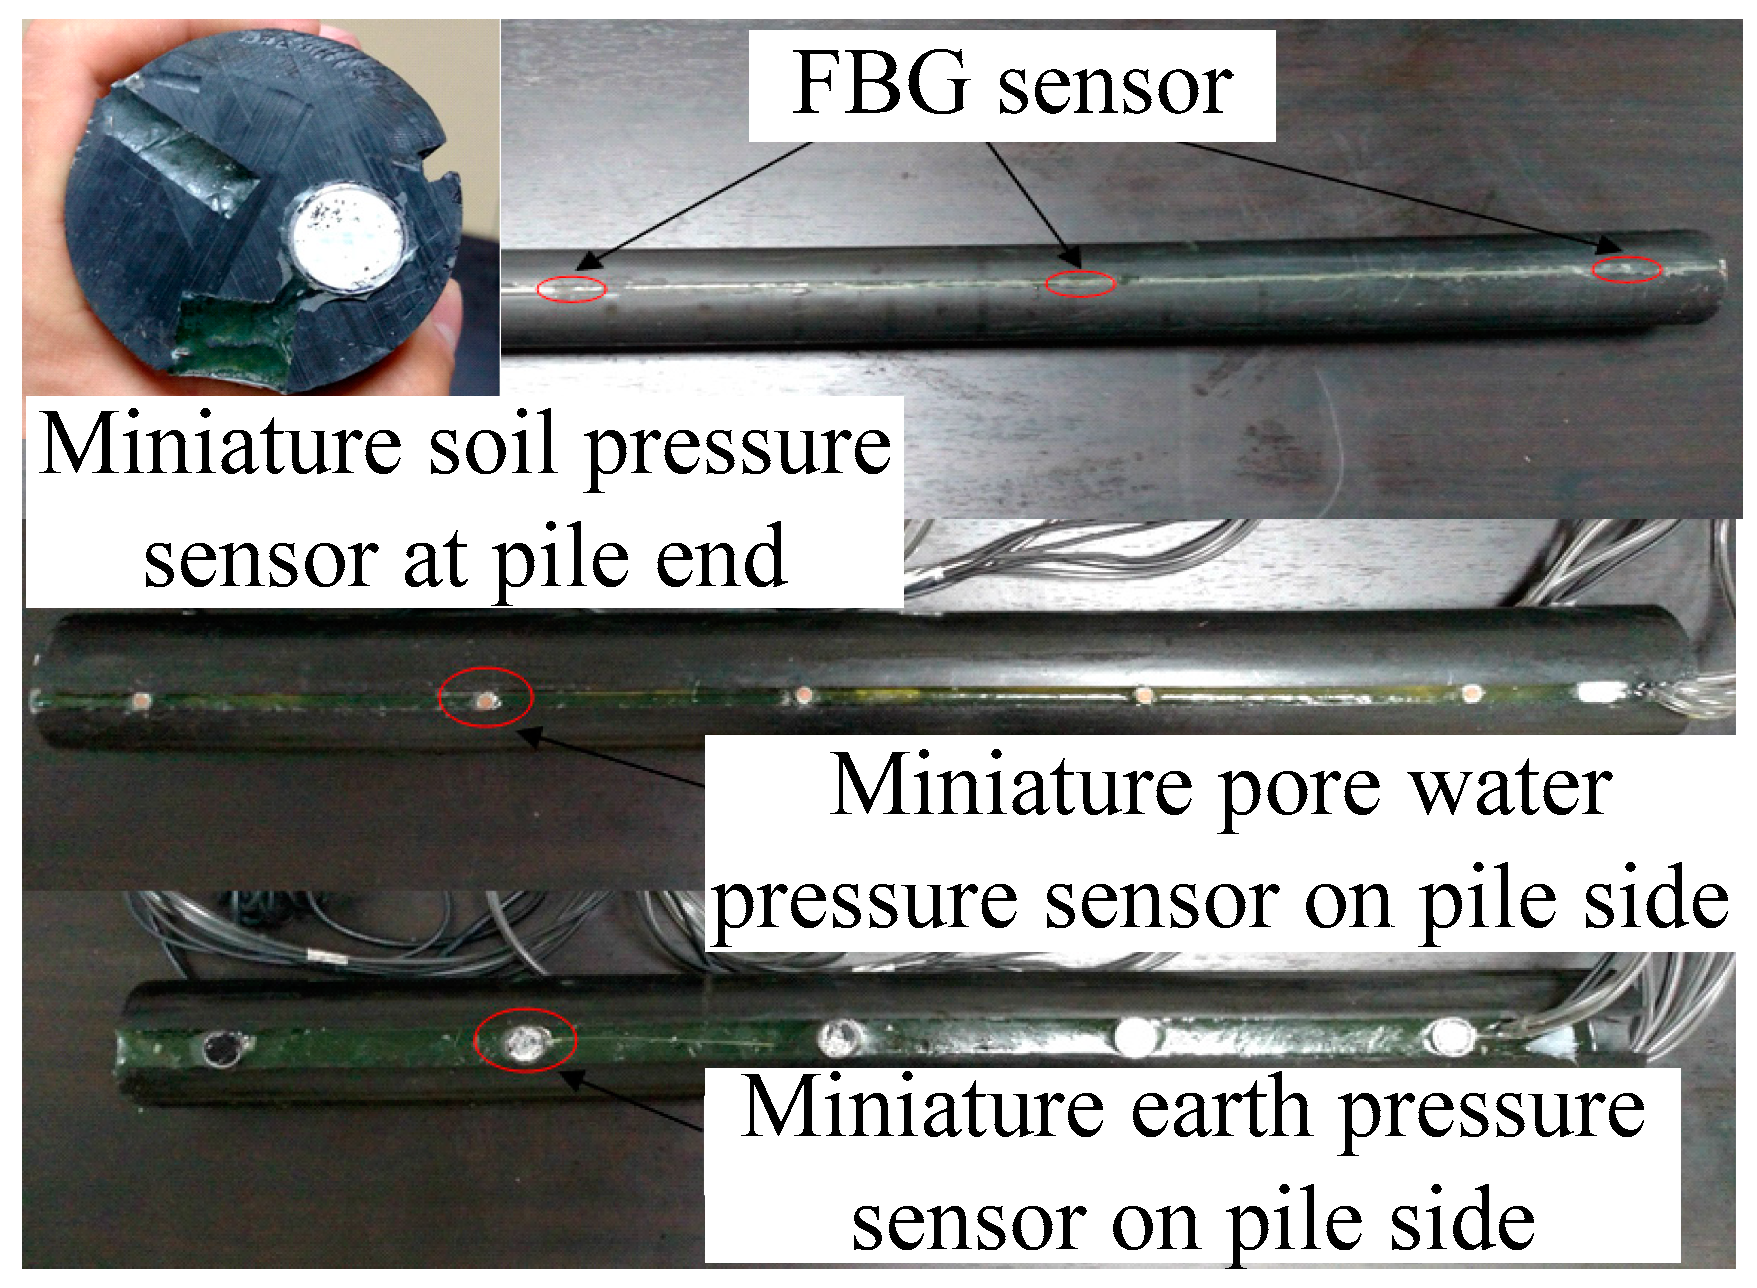
4.4. Test Elements
4.5. Loading System
5. Test Results and Analysis
5.1. Penetration Resistance
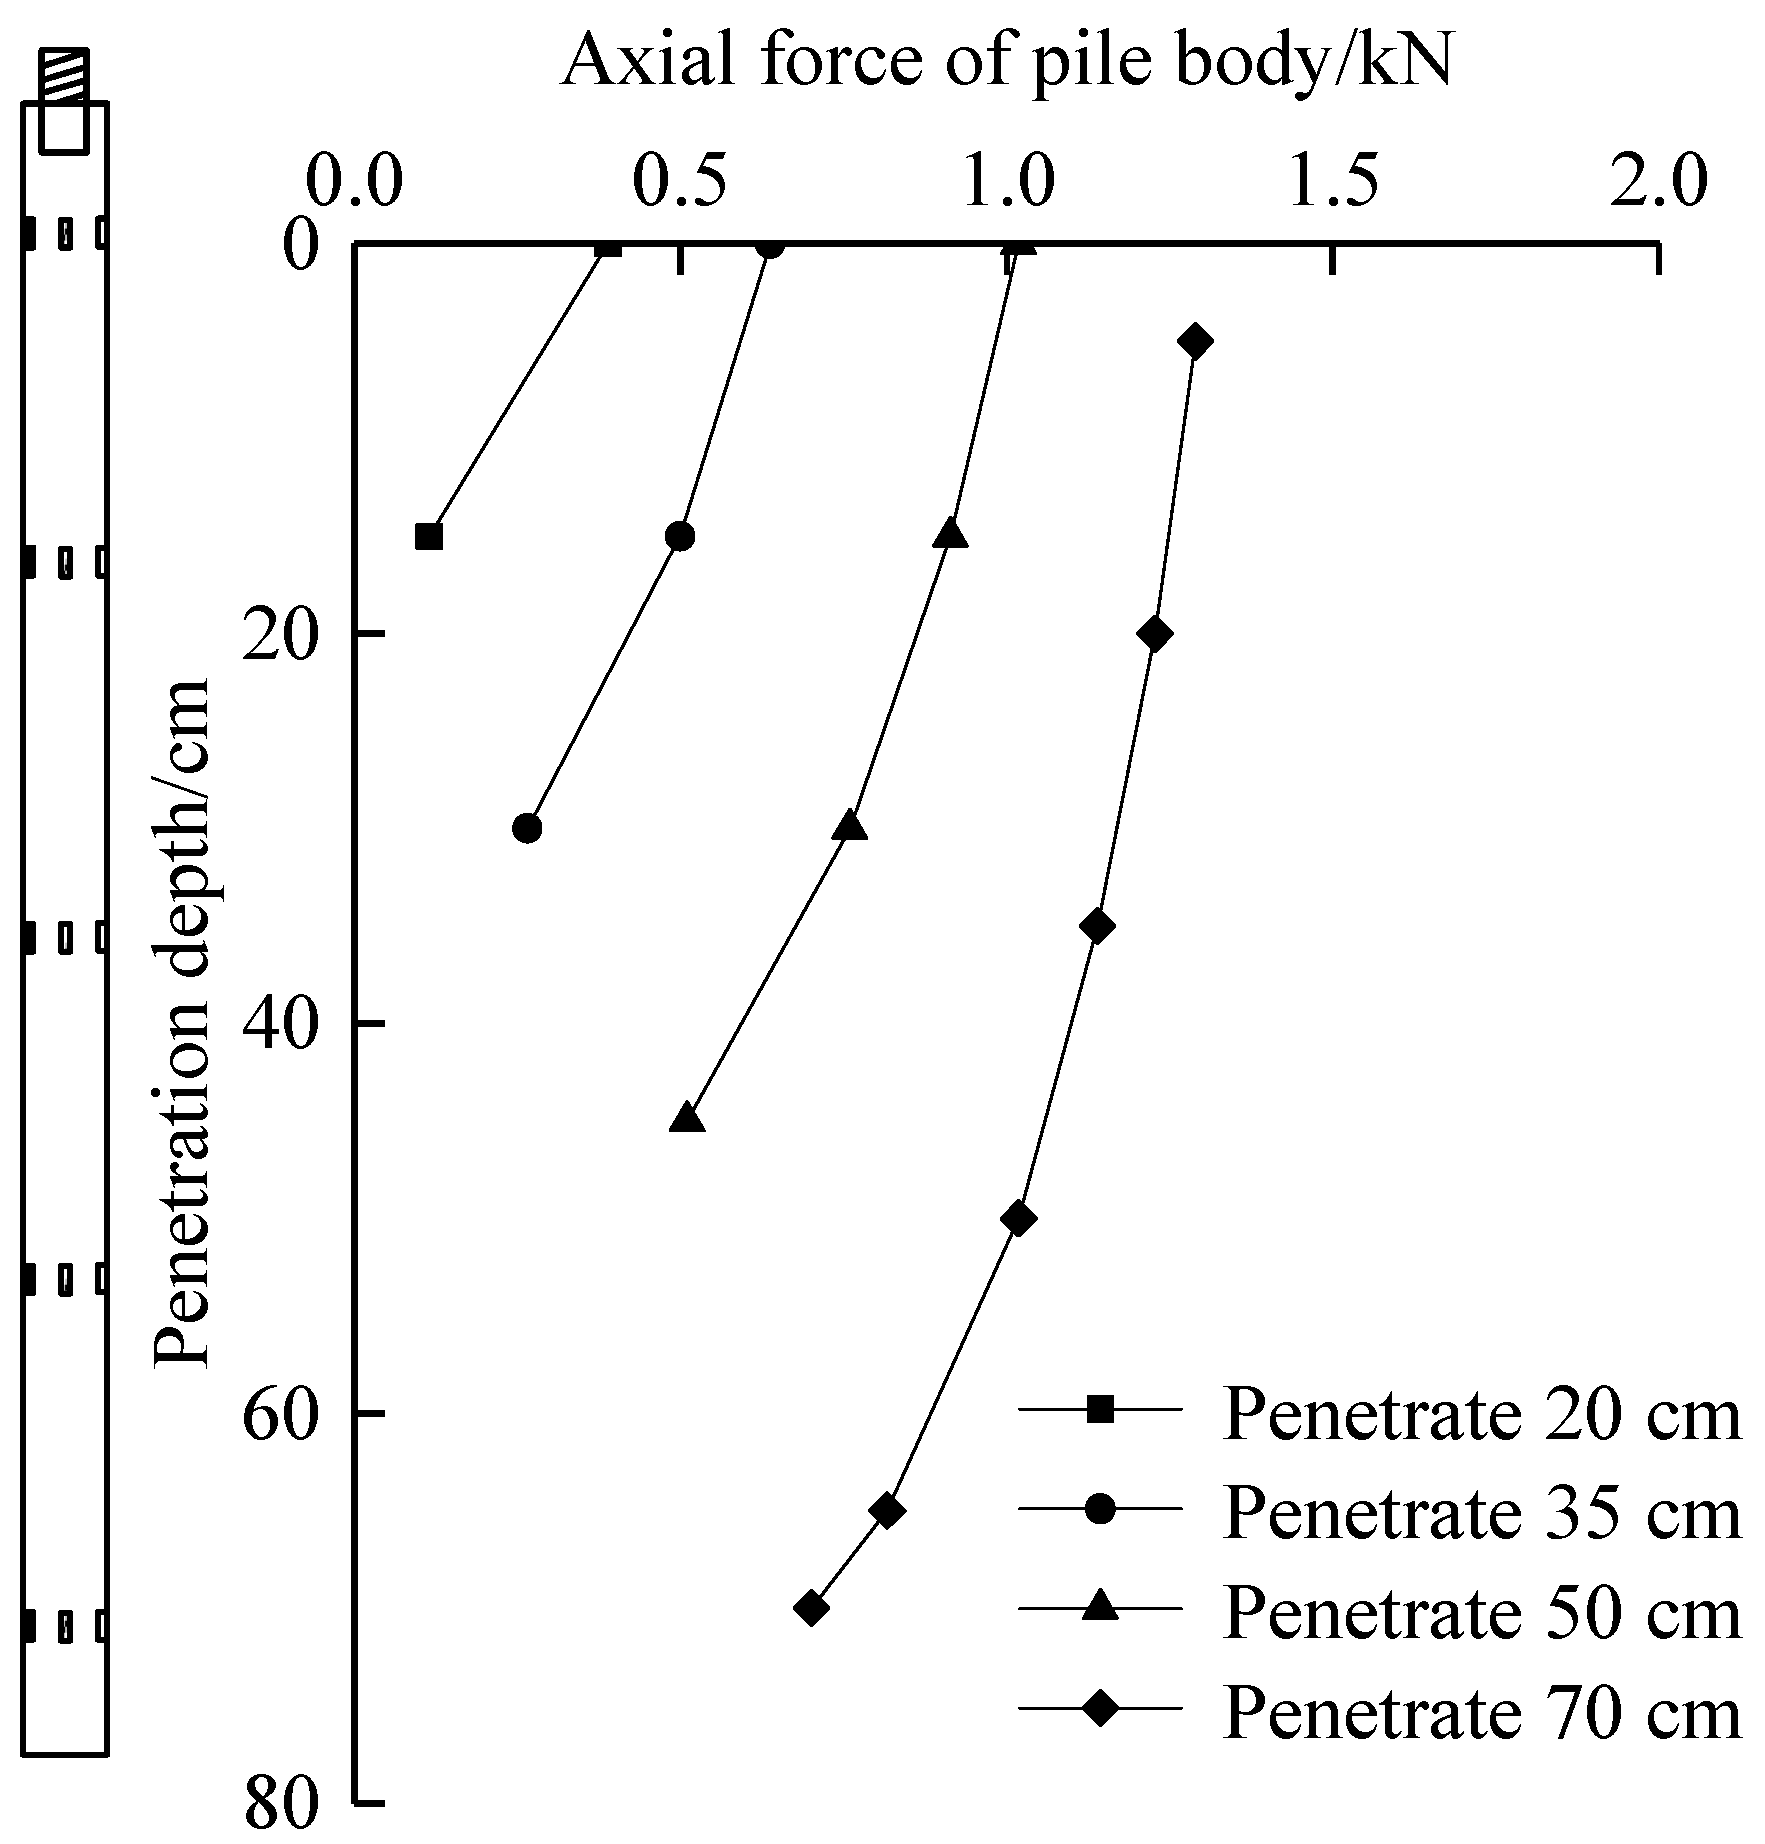
5.2. Pile Axial Force
5.3. Total Radial Stress
5.4. Analysis of Pore Water Pressure at Pile–Soil Interface
5.4.1. Pore Water Pressure
5.4.2. Excess Pore Water Pressure
5.5. Effective Radial Stress
6. Conclusions
- (1)
- Fiber grating sensing technology and MEMS micro-sensing technology can better meet the testing needs of the jacked pile penetration mechanism of clay, and accurately monitor the force status of the pile body during the penetration of the model pile. The sensor installation method used in the test is feasible.
- (2)
- The pile axial force decreases with the increase in penetration depth, and the decreasing amplitude decreases gradually. There is degradation in the pile side resistance. The difference of pile axial force at the same depth decreases gradually and the degradation degree of pileside resistance decreases with the penetration depth.
- (3)
- In the whole penetration process, the ratio of pile end resistance to pile pressure is constantly changing. At the beginning of penetration, the pile end resistance increases rapidly, and its proportion is much higher than the pile lateral resistance. In the middle and late stage of pile penetration, the ratio of pile lateral resistance increases. The growth rate of pile end resistance is relatively stable and its proportion is always high.
- (4)
- The radial effective stress in the process of pile jacking in homogeneous soil increases linearly with the penetration depth. The radial effective stress occupies a high proportion in the total radial stress, and the distribution law of the two is consistent. By comparing the data obtained from sensors at different positions, it can be found that the radial effective stress also degenerates at the same depth. In the process of pile jacking in homogeneous soil, the excess pore water pressure fluctuates with the increase in depth. According to the comparison of data at the same depth, it is found that the excess pore water pressure dissipates, and the degradation range decreases with the increase in depth.
Author Contributions
Funding
Conflicts of Interest
References
- Zhang, L.M.; Wang, H. Field study of construction effects in jacked and driven steel H-piles. Geotechnique 2009, 59, 63–69. [Google Scholar] [CrossRef]
- Chin, J.T.; Poulos, H.G. Tests on model jacked piles in calcareous sand. Geotech. Test. J. 1996, 19, 164–180. [Google Scholar]
- Li, L.; Li, J.P.; Sun, D.A.; Zhang, L. Time-dependent bearing capacity of a jacked pile: An analytical approach based on effective stress method. Ocean. Eng. 2017, 143, 177–185. [Google Scholar] [CrossRef]
- Wang, Z.; Miao, L.; Wang, F. Theoretical and numerical analysis of jacked pile in sand. In GeoCongress 2012: State of the Art and Practice in Geotechnical Engineering; ASC Library: Leiden, The Netherlands, 2012; pp. 245–254. [Google Scholar]
- Zhang, Z.; Huang, Y.; Palek, L.; Strommen, R. Glass fiber-reinforced polymer-packaged fiber Bragg grating sensors for ultra-thin unbonded concrete overlay monitoring. Struct. Health Monit. 2015, 14, 110–123. [Google Scholar] [CrossRef]
- Chen, J.; Cheng, F.; Xiong, F.; Ge, Q.; Zhang, S. An experimental study: Fiber Bragg grating-hydrothermal cycling integration system for seepage monitoring of rockfill dams. Struct. Health Monit. 2017, 16, 50–61. [Google Scholar] [CrossRef]
- Yeager, M.; Todd, M.; Gregory, W.; Key, C. IWSHM 2015: Assessment of embedded fiber Bragg gratings for structural health monitoring of composites. Struct. Health Monit. 2017, 16, 262–275. [Google Scholar] [CrossRef]
- Oromiehie, E.; Prusty, B.G.; Compston, P.; Rajan, G. In situ process monitoring for automated fibre placement using fibre Bragg grating sensors. Struct. Health Monit. 2016, 15, 1–9. [Google Scholar] [CrossRef]
- Cooke, R.W.; Price, G.; Tarr, K. Jacked piles in London Clay: A study of load transfer and settlement under working conditions. Geotechnique 1979, 29, 113–147. [Google Scholar] [CrossRef]
- Weng, X.; Zhao, Y.; Lou, Y.; Zhan, J. Application of fiber bragg grating strain sensors to a centrifuge model of a jacked pile in collapsible loess. Geotech. Test. J. 2016, 39, 362–370. [Google Scholar] [CrossRef]
- Yang, J.; Thamm, L.G.; Lee, P.K.; Chan, S.T.; Yu, F. Behaviour of jacked and driven piles in sandy soil. Geotechnique 2006, 56, 245–259. [Google Scholar] [CrossRef] [Green Version]
- Togliani, G. Pile capacity prediction for in situ tests. In Geotechnical and Geophysical Site Characterization, Proceedings of the 3rd Geotechnical and Geophysical Site Characterization, Taipei, Taiwan, 1–4 April 2008; Taylor and Francis Group: London, UK, 2008; pp. 1187–1192. [Google Scholar]
- Igoe, D.; Gavin, K.; O’Kelly, B. Field tests using an instrumented model pipe pile in sand. In Proceedings of the International Conference on Physical Modelling in Geotechnics, Zurich, Switzerland, 28 June–1 July 2010; pp. 775–780. [Google Scholar]
- Oh, J.H.; Lee, W.; Lee, S.B.; Lee, W. Analysis of pile load transfer using optical fiber sensor. Smart Structures and Materials 2000: Smart Systems for Bridges, Structures, and Highways. In International Society for Optics and Photonics, Proceedings of the SPIE’s 7th Annual International Symposium on Smart Structures and Materials, Newport Beach, CA, USA, 6–9 March 2000; SPIE: Bellingham, WA, USA, 2000; Volume 3988, pp. 349–358. [Google Scholar]
- Lee, W.; Lee, W.J.; Lee, S.B.; Salgado, R. Measurement of pile load transfer using the Fiber Bragg Grating sensor system. Can. Geotech. J. 2004, 41, 1222–1232. [Google Scholar] [CrossRef]
- Klar, A.; Bennett, P.J.; Soga, K.; Mair, R.J.; Tester, P.; Fernie, R.; Torp-Peterson, G. Distributed strain measurement for pile foundations. Proc. Inst. Civ. Eng. Geotech. Eng. 2006, 159, 135–144. [Google Scholar] [CrossRef]
- Pando, M.; Filz, G.; Ealy, C.; Hoppe, E. Axial and lateral load performance of two composite piles and one prestressed concrete pile. Trans. Res. Rec. 2003, 1849, 61–70. [Google Scholar] [CrossRef]
- Weng, X.; Zhu, H.; Chen, J.; Liang, D.; Shi, B.; Zhang, C.C. Experimental investigation of pavement behavior after embankment widening using a fiber optic sensor network. Struct. Health Monit. Int. J. 2015, 14, 46–56. [Google Scholar] [CrossRef]
- Pestana, J.M.; Hunt, C.E.; Bray, J.D. Soil deformation and excess pore pressure field around a closed-ended pile. J. Geotech. Geoenviron. Eng. 2002, 128, 1–12. [Google Scholar] [CrossRef]
- McCabe, B.A.; Lehane, B.M. Behavior of axially loaded pile groups driven in clayey silt. J. Geotech. Geoenviron. Eng. 2006, 132, 401–410. [Google Scholar] [CrossRef]
- Liu, J.W.; Cui, L.; Zhu, N.; Han, B.; Liu, J. Investigation of cyclic pile-sand interface weakening mechanism based on large-scale CNS cyclic direct shear tests. Ocean Eng. 2019, 194, 106650. [Google Scholar] [CrossRef]
- Yu, H.; Huang, J. Design and Application of a High Sensitivity Piezoresistive Pressure Sensor for Low Pressure Conditions. Sensors 2015, 15, 22692–22704. [Google Scholar] [CrossRef] [Green Version]
- Krizsan, A.K.; Lajtos, I.; Dahlbom, M.; Daver, F.; Emri, M.; Kis, S.A.; Kalinka, G. A promising future: Comparable imaging capability of MRI-compatible silicon photomultiplier and conventional photosensor preclinical PET systems. J. Nucl. Med. 2015, 56, 1948–1953. [Google Scholar] [CrossRef]
- Tran, A.V.; Zhang, X.M.; Zhu, B.L. The Development of a New Piezoresistive Pressure Sensor for Low Pressures. IEEE Trans. Ind. Electron. 2018, 65, 6487–6496. [Google Scholar] [CrossRef]
- Ahn, J.; Lee, D. Fabrication of polymer cantilever integrated full-bridge as a piezoresistive sensor. In Proceedings of the IEEE Sensors, Kona, HI, USA, 1–4 November 2010; pp. 1954–1957. [Google Scholar]
- De Bruyker, D.; Cozma, A.; Puers, R. A combined piezoresistive/capacitive pressure sensor with self-test function based on thermal actuation. In Proceedings of the International Solid State Sensors and Actuators Conference, Chicago, IL, USA, 19 June 1997; pp. 1461–1464. [Google Scholar] [CrossRef]
- Caroselli, R.; Poncealcántara, S.; Quilez, F.P.; Sánchez, D.M.; Morán, L.T.; Barres, A.G.; García-Rupérez, J. Experimental study of the sensitivity of a porous silicon ring resonator sensor using continuous in-flow measurements. Optics Express 2017, 25, 31651. [Google Scholar] [CrossRef] [PubMed]
- Hill, K.O.; Meltz, G. Fiber Bragg grating technology fundamentals and overview. J. Lightwave Technol. 1997, 15, 1263–1276. [Google Scholar] [CrossRef] [Green Version]
- Othonos, A. Fiber bragg gratings. Rev. Sci. Instrum. 1997, 68, 4309–4341. [Google Scholar] [CrossRef]
- Meltz, G.; Morey, W.; Glenn, W.H. Formation of Bragg gratings in optical fibers by a transverse holographic method. Opt. Lett. 1989, 14, 823–825. [Google Scholar] [CrossRef]
- Pertsev, N.A.; Zembilgotov, A.G.; Tagantsev, A.K. Effect of mechanical boundary conditions on phase diagrams of epitaxial ferroelectric thin films. Phys. Rev. Lett. 1998, 80, 1988–1991. [Google Scholar] [CrossRef]


| Parameter | Earth Pressure Sensor | Pore Water Pressure Sensor |
|---|---|---|
| Range (kPa) | 500 | 500 |
| Dynamic response (kHz) | 2000 | 2000 |
| Precision | 0.1% | 0.1% |
| Interface means | Built-in locking structure | Built-in locking structure |
| Appearance of size (mm × mm) | 20 × 10 | 8 × 15 |
| Sensor Number | No.1 | No.2 | No.3 |
|---|---|---|---|
| Range () | ±1000 | ±1000 | ±1000 |
| Resolution ratio () | 1 | 1 | 1 |
| Interface means | FC/APC | FC/APC | FC/APC |
| Density (g/cm3) | Moisture Content (%) | Dry density (g/cm3) | Relative Density | Liquid Limit (%) | Plastic Limit (%) | Internal Friction Angle (°) | Cohesion (kPa) | Saturability (%) | Void Ratio | Coefficient of Compressibility (MPa−1) | Modulus of Compression (MPa) |
|---|---|---|---|---|---|---|---|---|---|---|---|
| 1.98 | 25.3 | 1.58 | 2.73 | 31.3 | 16.5 | 8.6 | 14.4 | 94.9 | 0.728 | 0.32 | 5.5 |
| Technical Parameters | Dynamic Response (kHz) | Linearity (%FSO) | Hysteresis (%FSO) | Repeatability (%FSO) | Precision (%) | Interface Means |
|---|---|---|---|---|---|---|
| Numerical value | 2000 | 0.19 | 0.03 | 1.03 | 0.1 | Built-in locking structure |
| Depth of Sensor (cm) | Excess Pore Water Pressure (kPa) | Effective Overburden Weight (kPa) | Ratio (%) |
|---|---|---|---|
| 10 | 0.582 | 0.88 | 66.1 |
| 30 | 2.236 | 2.64 | 84.7 |
| 50 | 2.789 | 4.4 | 63.4 |
| 70 | 2.382 | 6.16 | 38.7 |
| Depth of Sensor (cm) | Effective Radial Stress (kPa) | Total Effective Stress (kPa) | Ratio (%) |
|---|---|---|---|
| 10 | 4.773 | 5.855 | 81.5 |
| 30 | 8.379 | 10.615 | 78.9 |
| 50 | 12.726 | 15.515 | 82.0 |
| 70 | 19.993 | 22.375 | 89.4 |
© 2020 by the authors. Licensee MDPI, Basel, Switzerland. This article is an open access article distributed under the terms and conditions of the Creative Commons Attribution (CC BY) license (http://creativecommons.org/licenses/by/4.0/).
Share and Cite
Liu, X.; Wang, Y.; Zhang, M. Application of Miniature FBG-MEMS Pressure Sensor in Penetration Process of Jacked Pile. Micromachines 2020, 11, 876. https://doi.org/10.3390/mi11090876
Liu X, Wang Y, Zhang M. Application of Miniature FBG-MEMS Pressure Sensor in Penetration Process of Jacked Pile. Micromachines. 2020; 11(9):876. https://doi.org/10.3390/mi11090876
Chicago/Turabian StyleLiu, Xueying, Yonghong Wang, and Mingyi Zhang. 2020. "Application of Miniature FBG-MEMS Pressure Sensor in Penetration Process of Jacked Pile" Micromachines 11, no. 9: 876. https://doi.org/10.3390/mi11090876