Article

Studying Corrosion Using Miniaturized Particle Attached Working Electrodes and the Nafion Membrane

1
Energy and Environment Directorate, Pacific Northwest National Laboratory, Richland, WA 99354, USA
2
Environmental Molecular Sciences Laboratory, Pacific Northwest National Laboratory, Richland, WA 99354, USA
*
Author to whom correspondence should be addressed.
Micromachines 2021, 12(11), 1414; https://doi.org/10.3390/mi12111414
Submission received: 22 October 2021 / Revised: 10 November 2021 / Accepted: 11 November 2021 / Published: 18 November 2021

Abstract

:
We developed a new approach to attach particles onto a conductive layer as a working electrode (WE) in a microfluidic electrochemical cell with three electrodes. Nafion, an efficient proton transfer molecule, is used to form a thin protection layer to secure particle electrodes. Spin coating is used to develop a thin and even layer of Nafion membrane. The effects of Nafion (5 wt% 20 wt%) and spinning rates were evaluated using multiple sets of replicates. The electrochemical performance of various devices was demonstrated. Additionally, the electrochemical performance of the devices is used to select and optimize fabrication conditions. The results show that a higher spinning rate and a lower Nafion concentration (5 wt%) induce a better performance, using cerium oxide (CeO2) particles as a testing model. The WE surfaces were characterized using atomic force microscopy (AFM), scanning electron microscopy-focused ion beam (SEM-FIB), time-of-flight secondary ion mass spectrometry (ToF-SIMS), and X-ray photoelectron spectroscopy (XPS). The comparison between the pristine and corroded WE surfaces shows that Nafion is redistributed after potential is applied. Our results verify that Nafion membrane offers a reliable means to secure particles onto electrodes. Furthermore, the electrochemical performance is reliable and reproducible. Thus, this approach provides a new way to study more complex and challenging particles, such as uranium oxide, in the future.

Graphical Abstract

1. Introduction

Cerium dioxide (CeO2) adopts a fluorite structure (space group Fm-3m) under ambient conditions, which is common to a variety of dioxides, including uranium oxide (UO2), thorium oxide (ThO2), plutonium oxide (PuO2), and doped zirconium dioxide (ZrO2) [1]. Therefore, CeO2 has been used as a surrogate to understand irradiated mixed oxide (MOX)-based matrix fuel due to its similarity in structure and chemical and mechanical properties [2]. For instance, CeO2 was used to study irradiated mixed oxide as irradiated fuel pellet materials in fission reactors due to its similar structural and mechanical properties [3]. CeO2 and UO2 can be engineered to feature similar grain sizes, and CeO2 is often used as an analogue of UO2 in dissolution studies [4]. When considering the safety case for the geological disposal of nuclear waste, CeO2 and ThO2 are effective spent nuclear fuel analogues that approximate the microstructure characteristics of fuel-grade UO2, yet they are not as sensitive to changes in the oxidation state of the cation as uranium [5].
Previous efforts utilized millimeter (mm)-sized UO2 spent fuel to reduce the risk of contamination to study the spent fuel corrosion phenomenon [6]. For example, Sunder et al. utilized sliced UO2 pieces that were a few mm laterally and 3 mm thick, and they successfully studied UO2 corrosion in an electrolyte containing hydrogen peroxide under open-circuit corrosion conditions [7]. Other previous efforts also used disc type bulk electrodes to achieve results [8,9,10]. However, such experiments are not easy to conduct; this is largely due to the difficulty of handling highly radioactive materials. Hot cells and other logistics were required to perform such experiments. Therefore, new methods are needed to make such studies more accessible to develop the predictability of spent fuel corrosion potential.
Microfluidics is a viable approach to address the associated technical challenges. Our team developed a microfluidic-based platform for the multimodal spectroscopy and microscopy of liquids [11,12,13]. This vacuum-compatible platform is named System for Analysis at the Liquid-Vacuum Interface (SALVI). The electrochemical SALVI, or E-cell, contains three electrodes and allows simultaneous electrochemical analysis, which enables multimodal spectroscopy and microscopy including chemical imaging tools such as time-of-flight secondary ion mass spectrometry (ToF-SIMS) and scanning electron microscopy (SEM) [14,15].
We recently introduced a working electrode (WE) fabrication method to include a small amount of nanoparticles in the SALVI cell using stamping [16]. Conductive epoxy was used as a medium for the direct attachment of nanoparticles onto the electrode surface by utilizing several stamping methods. It showed promise for spent fuel corrosion studies using electrochemistry. However, the inconsistency of stamped target particles and the difficulty in controlling the epoxy amount on fabricated WE call for improvement and optimization. A new approach using Nafion, a proton exchange membrane, is developed in this work. Nafion is a perfluorinated polymer with sulfonic acid groups that stands out for its high proton conductivity, its selective permeability to water, and its superior chemical stability [17,18,19]. Nafion also has been widely used in fuel cells and batteries as the separator and binder materials due to its high proton transfer ability. Specifically, Nafion is used as the barrier membrane material between anodic and cathodic layers in fuel cells [18,20,21,22]. Nafion is used to hold the target particles (i.e., cerium oxide CeO2) onto the gold (Au) conductive substrate to form a precisely controlled WE in terms of mass loading and electrode surface area.
In this study, we demonstrate that using micrometer (μm)-sized electrodes is a novel and alternative solution to study particle corrosion. This is achieved by miniaturizing the working electrode in an established electrochemical cell, that is, the electrochemical version of the SALVI, or the E-cell [11]. The Nafion membrane is used as a protection layer in the E-cell after attaching CeO2 particles. Considering the challenges involved in utilizing UO2, a radioactive chemical, as a WE component with regard to strict safety protocols of radioactive material handling [14,15], its close analogue CeO2 was chosen to develop and optimize the fabrication protocol.
The fabricated CeO2-containing SALVI E-cell devices were tested to show reproducibility and to validate their performance as a new analytical approach. Multimodal surface analysis tools, including time-of-flight secondary ion mass spectrometry (ToF-SIMS), scanning electron microscopy-focused ion beam (SEM-FIB), X-ray photoelectron spectroscopy (XPS), and nanometer resolution atomic force microscopy (AFM) were used to characterize the powder-attached electrode surface to verify the electrically driven corrosion effects on the electrode surface. Microfluidics provides the benefit of singling out the α-radiolysis effect due to the small size of the overall electrochemical cell as an inherent feature. The novel microfluidic approach increases the degree of freedom to study more diverse spent fuel corrosion conditions, including synfuels and noble metal particles, in the future.

2. Materials and Methods

2.1. Chemical Agents

The Nafion solutions of 5 wt% and 20 wt% were acquired from Sigma Aldrich. The pristine single crystal CeO2 particles were provided by Dr. Dallas Reilly. The cerium oxide (CeO2, 10 nm mean diameter) particles were purchased from US Research Materials Inc. (Houston, TX, USA). The polydimethyl siloxane (PDMS) was purchased from Millipore Sigma (Darmstadt, Germany). The silicon (Si) wafer chips (University Wafers, Boston, MA, USA) were used in device development. More details were described previously [16]. The platinum (Pt) wires (25 mm outside diameter) were purchased from Sigma Aldrich (St. Louis, MO, USA).

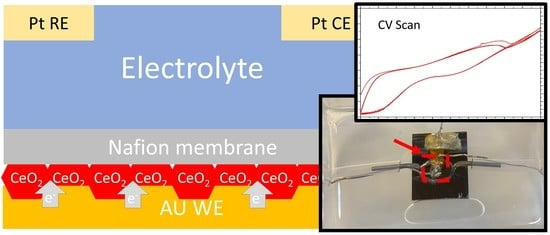
2.2. Microfluidic Electrochemical Cell Fabrication

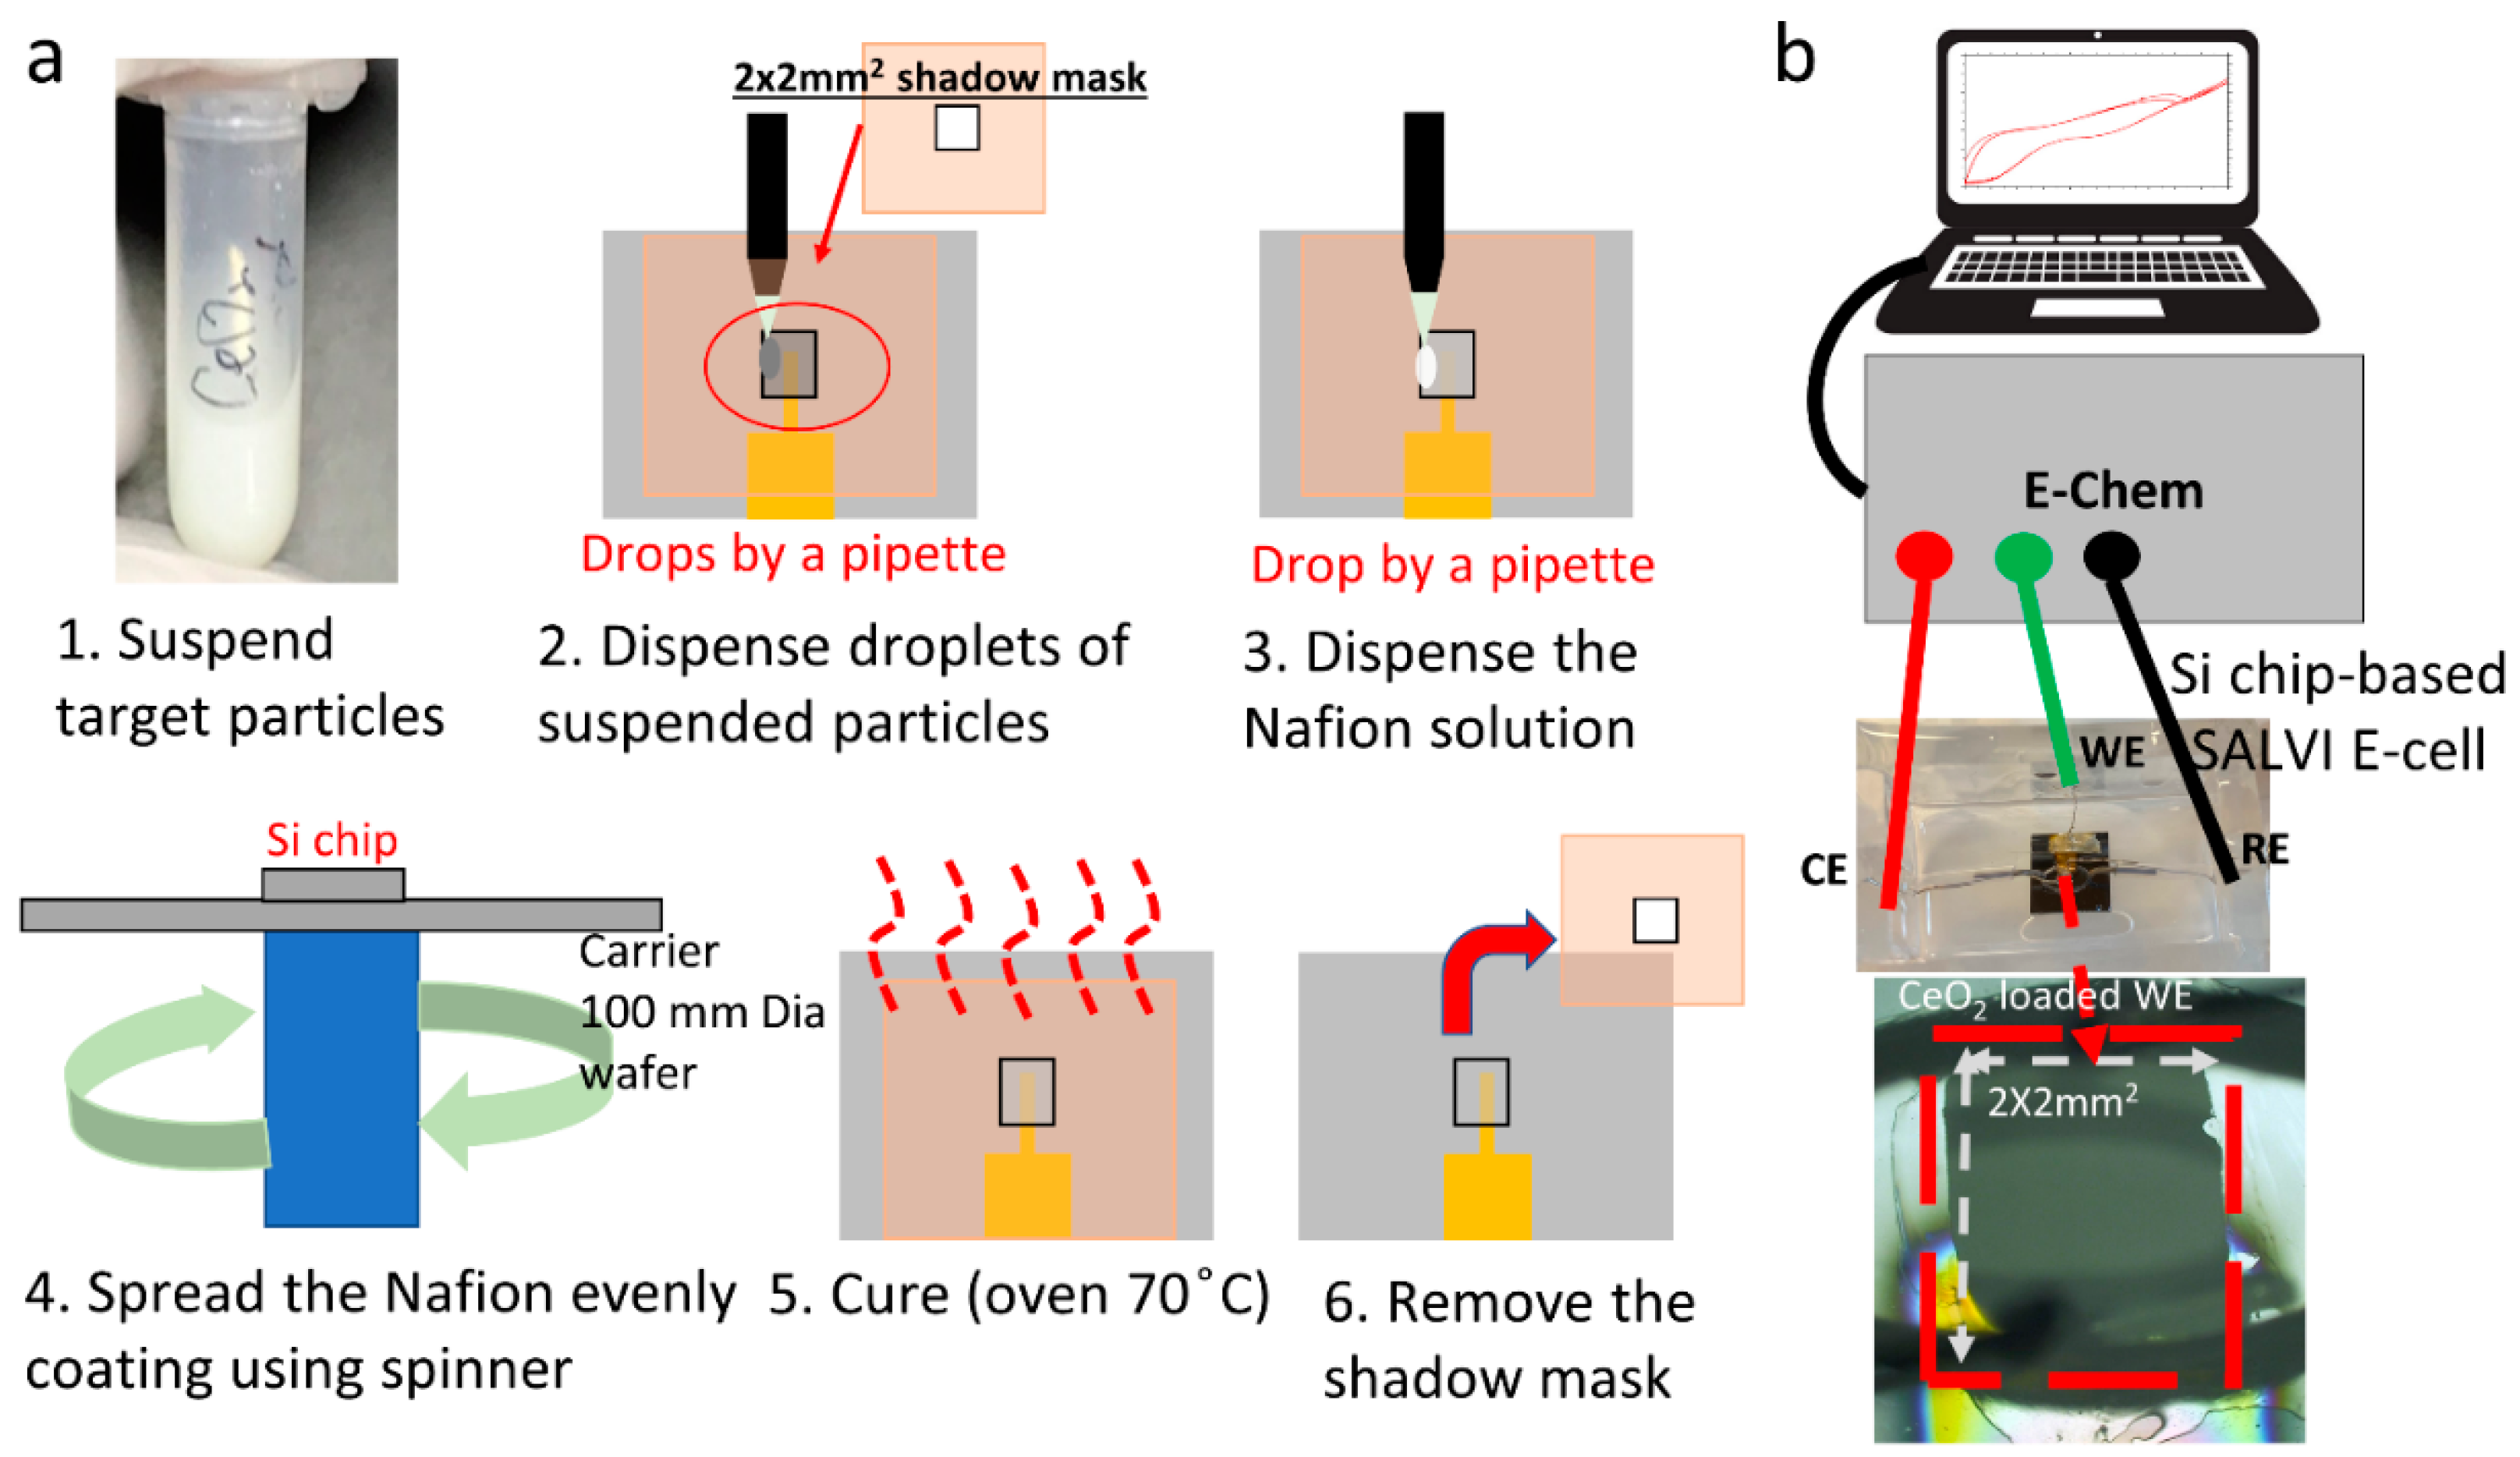
2.2.1. WE Fabrication

A LAURELL 650M spin coater (North Wales, PA, USA) was used to form a thin layer of Nafion with 0, 500 and 1000 rpm spinning recipes. The Nafion membrane was used to hold the target particles when making the WE that contained CeO2 particles. Figure 1a shows the WE fabrication process using Nafion as the protection membrane. A small amount of target CeO2 particles (e.g., 250 mg) was suspended in 1 mL of deionized (DI) water to make a stock with a concentration of 250 mg/mL, as shown in Figure 1a. A few droplets of the particle-suspended liquid mixture were pipetted onto the shadow-masked Au-WE layer on the Si chip [16]. The Si chips were used to reduce the cost of method development. The spun Nafion layer was cured in a 70 °C oven for another 30 min to form a homogeneously distributed layer adapted from a protocol in Nafion membrane fabrication [20,21]. The Si chips with deposited target particles were dried in the oven at 70 °C for 30 min. Optical images of each completed WE surface also were recorded with an optical microscope (VHX500, Keyence, Itasca, IL, USA) with a magnification 100 times (see Figure S1). It is worth noting that the optimal amount of particle deposition was investigated by testing many devices in duplicate sets. For example, the initial amount of CeO2 particles was set at 0.6 mg. The particle mass loading was increased to show the enhanced effect in the CV testing.

2.2.2. Device Assembly

The SALVI E-cell uses Pt wires as the counter electrode and reference electrode, respectively. The body of the devices was fabricated using soft lithography [23,24]. More details on SALVI fabrication were reported previously [16]. Key details are provided in the Supporting Information.

2.3. Membrane Thickness Mesurements

The Nafion membrane thickness was determined using a profilometer (Profilm3D, KLA, Milpitas, CA, USA).

2.4. Cyclic Voltammetry

Cyclic voltammetry (CV) was used to verify the microfluidics device performance. The electrolyte containing 0.1 mol/L of sodium perchlorate (NaClO4) was used following a previous publication using bulk electrodes [7]. A series of CV potential scans at different scanning rates was performed using multiple E-cells to verify the electrochemical reproducibility of this new technique. Figure 1b shows the experimental setup of the SALVI E-cell. The CeO2-containing E-cells were tested using CV sweeping from −1 V to 1 V and 1 V to −1 V at several scan rates (i.e., 10, 20, 40, 60, 80, and 100 mV/s), respectively. CV scans on the Nafion control SALVI E-cells were also performed to compare with those obtained from the devices with CeO2-particle WEs. The WE chips were retrieved for surface characterization using ToF-SIMS, AFM, and SEM-FIB. In comparison, the pristine, as-made WE chips containing CeO2 were characterized to determine the corrosion effects after CV sweeping.

2.5. AFM Characterization

A topographical analysis of the as-made and corroded WE surfaces was performed using an MFP-3D Infinity AFM (Asylum, Oxford, Santa Barbara, CA, USA). Tapping mode measurements were performed using an etched silicon probe (Bruker, RTESPA-300, 8 nm nominal tip radius, 40 N/m spring constant, Billerica, MA, USA) with a set point of 3 V and a scan speed of 0.3 Hz.

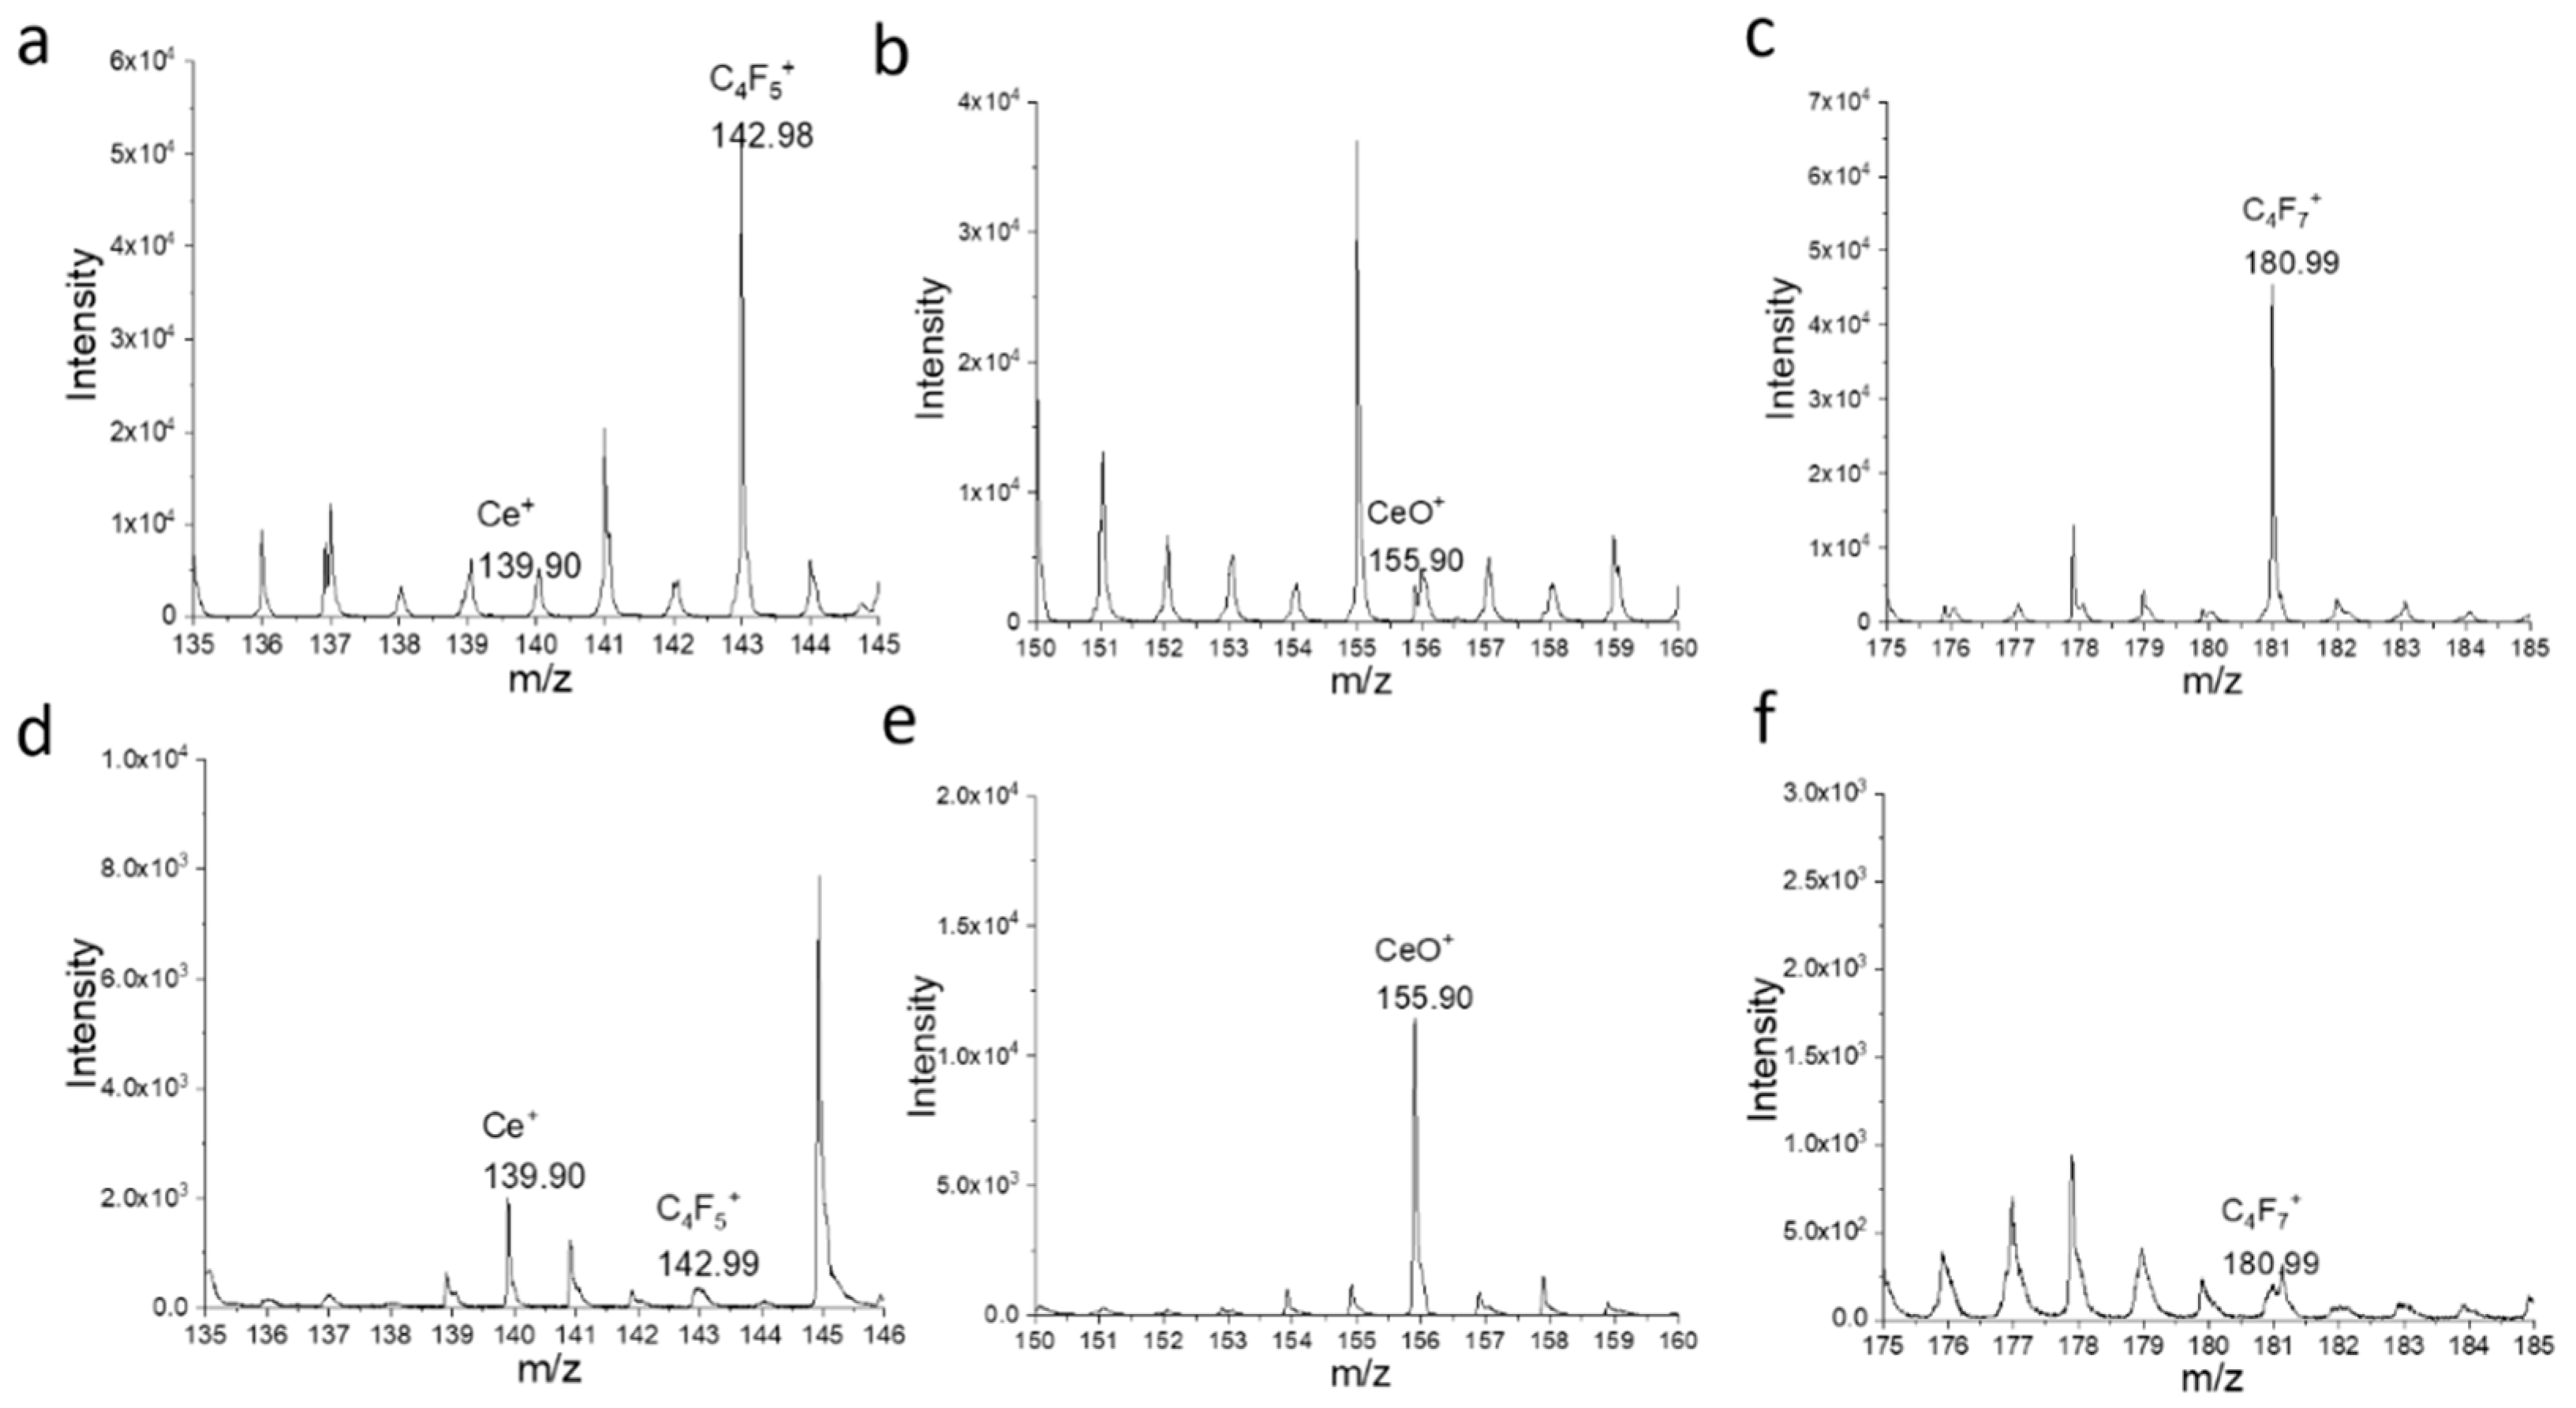
2.6. ToF-SIMS Characterization

A surface analysis of the as-fabricated WE surfaces was performed using a ToF-SIMS (IONTOF GmbH, ToF-SIMS V, Münster, Germany). The pressure of the main chamber was maintained at 1 × 10⁻⁸ mbar during the analysis. The primary ion beam was a 25 keV Bi3+ with 10 kHz pulse energy. The pulse width was 0.8 ns and the current was ~0.6 pA. ToF-SIMS high resolution spectral data were acquired by rastering over an area of 500 × 500 μm2 for 60 scans. The ToF-SIMS data were processed using the IONTOF Surface Lab 7.0 software. The mass spectra were calibrated using peaks such as C (m/z+ 12.0), CH3 (m/z+ 15.02), and Ce+(m/z+ 139.90) in the positive ion mode.

2.7. SEM-FIB

The SEM-FIB liftout samples were prepared using a FEI, Helios 660 (Thermo Fisher, Waltham, MA, USA). The lift-out specimens were obtained by milling out an interfacial sample of the CeO2 from the device. Milling was performed under the ion-beam source at 30 kV and 0.79 nA. The voltage was reduced to 5 kV for the final thinning of the cross-section. Electron micrographs of the pristine and corroded CeO2 electrodes were acquired using a secondary electron detector at 5 kV and 3.2 nA current.

2.8. XPS

The XPS measurements were performed with a Thermo Fisher NEXSA (Waltham, MA, USA). This system uses a focused monochromatic Al Kα (1468.7 eV) source for excitation with a double-focusing hemispherical analyzer with multi-element input lens and 128 channel detector. The X-ray beam is incident to normal to the sample and the photoelectron detector is 60° off normal. High-energy resolution spectra were collected using a pass-energy of 50 eV with a step size of 0.1 eV and a dwell time of 50 ms. The full-width-at-half-maximum (FWHM) was measured to be 0.82 eV for the Cu(2p3/2) peak using the same conditions as those at which the narrow scan spectra were collected.
The XPS Ce(3d) narrow scan region was deconvoluted using the 3d5/2 peaks in Casa XPS (v 2.3.24) with a GL (80) peak shape. The 3d3/2 peaks were not needed for analysis since they featured a fixed area ratio (2:3) and spin orbit coupling distances (18.10 eV). The charge referencing was performed using the most intense Ce 3d5/2 peak at 916.7 eV [25]. Additional fitting information can be found in the supporting experimental details in the section on supplemental information.

3. Results and Discussion

3.1. WE Fabrication Optimization

Two different Nafion concentrations (5 wt% and 20 wt%) of 10 µL droplets and three spinning speeds (i.e., 0, 500 rpm, 1000 rpm) were tested to reach an optimal result. When using different spinning rates, the Nafion membrane thickness varies. Table 1 presents a summary of the Nafion membrane thickness corresponding to the spinning rates. The fabricated Nafion layer using the optimized conditions is approximately 150 nm thick. After applying the series conditions to develop the Nafion coating on top of the target particles, an optimized condition was determined, that is, one drop of 10 µL of 5 wt% Nafion solution spin-coated at 1000 rpm. This device performance was verified by comparing the electrochemical analysis results of different devices prepared using the listed conditions in duplicates in Table 1.
Higher spinning rates result in thinner membranes and potentially better electrochemical results in the test cases evaluated in this work. The comparisons in Figure S2d–f show distinct features of CV profiles such as peaks 0.3 V (from −1 V to 1 V) and 0.7 V (from 1 V to −1 V) from the Nafion control (Figure 2d). It is interesting that major peaks in Figure S2d shift to the left by ~0.1 V, corresponding to the thinnest Nafion membrane in the 20 wt% Nafion batches of devices. This result indicates that the Nafion background in the CV profile becomes subservient as its layer getting thinner. Therefore, the optimal Nafion spin coating procedure would be a 1000 rpm spin using the 5 wt% Nafion solution. Additionally, increasing the target particle amount could increase the signal intensities to capture unique characteristics as well. An example is given in Figure S3.
To achieve optimal conditions, we chose to increase the particle mass loading by 10 times and to decrease the Nafion layer thickness, that is, increasing the CeO2 to 6 mg and using the thinnest Nafion from 5 wt% Nafion with a 1000 rpm spinning rate. Devices fabricated using this method show a significant improvement compared to those made using the conductive silver epoxy as the binder material, as described in our recent publication [16].
Using optimized conditions, the CeO2 device CV profile (Figure S3a,b) results show that using the Nafion binder causes less interference and improves particle deposition in a more controlled manner. During potential sweeps of the oxidation process of the CeO2, the anodic peaks were observed at potentials (Epa) of −0.75 V and 0.022 V. In comparison, the Nafion control device’s CV profiles show two peaks at −0.596 V and 0.239 V, respectively. Similarly, during the reduction process of the CeO2, the observed cathodic peak potentials were (Epc) of 0.446 V and −0.134 V, respectively. By contrast, the Nafion control device CV profiles were 0.647 V, 0.056 V, and −0.476 V, respectively. We also plotted current vs. square root of scan rates to show linear trend relations in Figure S3c. This finding of the CeO2-loaded E-cell demonstrates the good reproducibility of the devices using the newly developed Nafion fabrication method.

3.2. SEM-FIB Characterization

FIB-SEM was used to obtain images of the surface of CeO2 WE. Figure 2b shows the morphology of the CeO2 WE after 100 cycles of CV scanning. Corrosion makes the surface relatively rougher compared to the pristine CeO2 surface (Figure 2e). This observation can be explained by the possible redistribution of Nafion as a result of CV sweeping [17,26]. Figure 2c also shows a slight Nafion layer thickness reduction compared to Figure 2f, as indicated by the white marks. Additional SEM-FIB trench images are presented in Figure S4.

3.3. ToF-SIMS Spectral Analysis and 2D Mapping

The ToF-SIMS molecular mapping of the CeO2 particles as the WE in the SALVI E-cells and nanometer resolution AFM imaging of the electrode surface topography before (RMS: 140 nm) and after running CV (RMS: 428 nm) are depicted in Figure 3. Boththe ToF-SIMS and the AFM imaging results show that an even Nafion layer was deposited on top of the CeO2 particles before applying potential sweeps. The Ce+ and CeO+ signal intensities are lower in the pristine electrode surface (Figure 3a,b) compared to those after running CV (Figure 3g,h). This is because the CeO2 was covered by the Nafion layer. In contrast, the Nafion fragment ions (e.g., C4F5+, C4F7+) show much higher ion intensities in the as-prepared electrode surface (Figure 3c,d) compared to after its use in the electrochemical experiments (Figure 3i,j). After performing electrochemical corrosion, higher Ce+ and CeO+ signals are observed (Figure 3g,h). More similar observations are reported in Figure S5. The AFM results show that an even Nafion film (Figure 3e,f) is formed using the spin coating technique. Both ToF-SIMS and AFM observations indicate that the Nafion membrane provides a safe protection layer with CeO2 particles as the WE. Once it had been used in the CV experiments, the Nafion was redistributed due to proton transfer (Figure 3i,k), exposing the CeO2 particles to the electrolyte. It is worth noting that one hundred cycles of potential sweeps were performed using the WE inside a SALVI cell before the ToF-SIMS and AFM surface mapping. Our results show that the devices prepared using the novel Nafion and particle attachment method can be used for extensive electrochemical testing.
Figure 4 depicts the positive ToF-SIMS spectra of the corroded and pristine CeO2 WE surface. The spectral results corroborate with the 2D mapping. Much stronger Nafion fragment peaks, such as C4F5+ m/z+ 142.99 (Figure 4a) and C4F7+ m/z+ 180.99 (Figure 4c), are prominent on the pristine electrode surface. The peaks representing CeO2 particles, such as Ce+ m/z+ 139.90 (Figure 4a) and CeO+ m/z+ 155.90 (Figure 4b), are also observable in the pristine surface. However, their counts increased after potential sweeping and corrosion develops on the electrode surface, as seen in Figure 4d,e, respectively. by contrast, the Nafion fragment peaks C4F5+ m/z+ 142.98 (Figure 4d), and C4F7+ m/z+ 180.99 (Figure 4f) reduced after corrosion occurred, providing additional evidence that the Nafion redistributes. This phenomenon is not surprising, and it has been reported in the past [17,19]. It is worth noting that the possible sulfur and fluorine contamination on the WE surface was studied using ToF-SIMS spectral analysis. The SIMS spectral results provide no evidence of sulfur or fluorine interference, as shown in Figures S5 and S6 [27,28].

3.4. XPS Analysis

XPS narrow scan regions were used to determine the oxidation states of the pristine CeO2 WE (Figure 5b) and post-CV WE (Figure 5a). Wide scan regions are also shown in Figure S7. The Ce (3d5/2) was deconvoluted to distinguish the oxidation states present. After CV (Figure 5a), the Ce4+ oxidation state was dominant, which indicates that electrochemical oxidation of the Ce3+ to Ce4+ occurred as a result of the CV scan. This Ce4+ oxidation state was also confirmed by the increase in the intensity of 916.7 eV and the disappearance of shoulders present in the pristine electrode shown in Figure S8. Two oxidation states can be observed in the pristine CeO2 WE case, which was dominated by Ce4+. This was likely due to air oxidation during storage [29,30]. The calculated ratio between Ce3+ and Ce4+ in the pristine WE case are 29.7% and 70.3%, respectively.
Further evidence of Ce3+ is shown in Figure S8 by the presence of shoulders and a lower intensity peak at 916.7 eV relative to after electrochemical cycling or fully oxidized state [25]. The peak positions and intensity ratios (Tables S1 and S2) also resemble the results reported by Paparazzo et al. [25]. The conversion of the Ce3+ oxidation state to Ce4+ after electrochemical cycling indicates the redox activity of the cerium particles on the electrode surface. Thus, the XPS results further confirm that Nafion-assisted CeO2 particle deposition as WE is viable.
Direct deposition on an electrode (DDE) is a widely used approach to making electrodes. In fact, powders have been applied using DDE. However, controlling the amount of material dispensed onto a surface is difficult in DDE [31,32]. The new Nafion and particle attachment method provides a better solution compared to DDE. More importantly, the new development presented here allows flexible electrode preparation using different kinds of particles that are compatible with the microfluidics platform. CeO2 is an important material for energy applications [33,34]. The development of this DDE WE to be used in microfluidic cells can provide a multimodal platform for rapid electrochemical testing, for example, in studying rare earth materials [35]. In this study, we used CeO2 as an analogue to establish the protocol for studying uranium oxide corrosion in the future [4]. It is anticipated that the developed approach will be adapted to study other, more challenging materials, such as UO2.

4. Conclusions

CeO2 was used as a surrogate of spent fuel UO2 particles to develop a new method to fabricate effective WE in the SALVI electrochemical cell. A layer of thin Nafion membrane was developed via spin coating to protect the target particles. This new method provides a valuable electrochemical analysis tool for studying materials and understanding their corrosion potentials in the future. The fabrication workflow was optimized. The effects of Nafion weight percentages and spinning rates on the Nafion membrane thickness were investigated. Multiple devices were prepared using varying parameters. Their electrochemical performance was evaluated using CV. Our results show that the device-to-device reproducibility is reliable. More importantly, the electrochemical characteristics in the CeO2-containing devices feature distinguished redox potentials that differ significantly from those of the Nafion controls. It is expected that this new solution will be used to study spent fuel redox chemistry, since it will offer a diverse platform to introduce syn fuels, noble metal particles, or controlled dopants as WEs. More systematic studies will be performed using microfluidics to study the spent fuel chemistry at the material interfaces in the future.

Supplementary Materials

The following are available online at https://www.mdpi.com/article/10.3390/mi12111414/s1. Figure S1: (a) the optical microscopy image of the as-made CeO2 Nafion working electrode (WE) and (b) the profilometer measurement image of the CeO2 Nafion WE. Figure S2: the CeO2 WE CV plots with different Nafion fabrication conditions—(a) CeO2 WE 5 wt% Nafion with 1000 rpm spin rate, (b) CeO2 WE 5 wt% Nafion with 500 rpm spin rate, (c) CeO2 WE 5 wt% Nafion with drop application, (d) CeO2 WE 20 wt% Nafion with 1000 rpm spin rate, (e) CeO2 WE 20 wt% Nafion with 500 rpm spin rate, and (f) CeO2 WE 20 wt% Nafion with drop application. The scanning rate is at 100 mV/s. Figure S3: reproducibility of optimized CeO2 devices using (a) 100 mV/s scan rate, (b) 80 mV/s scan rate, and (c) the current vs. square root of scan rate plot. Ipa refers to oxidation peak current and Ipc reduction peak current. Figure S4: SEM FIB images of (a) the trench of the CeO2 WE after electrochemical corrosion and (b) the pristine CeO2 WE, using 6500 times magnification. Figure S5: ToF-SIMS spectral results in (a) the corroded CeO2 WE after electrochemical corrosion and (b) the pristine CeO2 WE in the mass range of m/z+ 1–355. Figure S6: ToF-SIMS spectral results of (a) the corroded CeO2 WE after electrochemical corrosion and (b) the pristine CeO2 WE in the mass range of m/z+ 1–355. Figure S7: XPS wide scan spectral results of (a) the corroded CeO2 WE after electrochemical corrosion, (b) the pristine CeO2 WE, and (c) the Nafion membrane. Figure S8: Normalized Ce(3d) spectra before and after cyclic voltammetry. Regions indicative of Ce3+ are marked (1), (2), and (3), respectively. Table S1: XPS peak positions and corresponding FWHM values for the electrode analyzed before CV. Table S2: XPS peak positions and corresponding FWHM values for the electrode analyzed after CV.

Author Contributions

J.S. developed the methods and performed the experimental work presented in this paper. He also performed the ToF-SIMS analysis. He wrote and revised the manuscript with X.-Y.Y. E.C.B. contributed to project technical direction and administration support as the project manager. He also provided discussion direction of the manuscript. S.L.R. performed the AFM analysis. He also contributed to the initial draft of AFM methodology and data analysis. S.T. performed the SEM/FIB analysis and contributed to the initial draft of SEM/FIB methodology. M.H.E. and L.E.S. performed the XPS analysis and contributed initial draft of the XPS methodology and data analysis. All the authors revised the paper. X.-Y.Y. developed the method and supervised the experiments. She wrote and revised the manuscript with J.S. All authors have read and agreed to the published version of the manuscript.

Funding

The programmatic support for this work was from the U.S. Department of Energy Nuclear Energy Spent Fuel Waste Science Technology (SFWST) program (Project# 60410). X.-Y.Y. thanks the Office of Science, Office of Basic Energy Sciences, of the U.S. DOE through the Direct Air Capture Program for partial support for the electrode development and characterization. Part of the work was performed using the Environmental Molecular Sciences Laboratory (grid436923.9), a DOE Office of Science User Facility sponsored by the Office of Biological and Environmental Research. PNNL is operated by Battelle under the contract DE-AC05-76RL01830.

Data Availability Statement

Data is contained within the article or supplementary material.

Conflicts of Interest

The authors declare no conflict of interest. The funders had no role in the design of the study; in the collection, analyses, or interpretation of data; in the writing of the manuscript, or in the decision to publish the results.

References

  1. Cureton, W.F.; Tracy, C.L.; Lang, M. Review of Swift Heavy Ion Irradiation Effects in CeO2. Quantum Beam Sci. 2021, 5, 19. [Google Scholar] [CrossRef]
  2. García-Ostos, C.; Rodríguez-Ortiz, J.A.; Arévalo, C.; Cobos, J.; Gotor, F.J.; Torres, Y. Fabrication and characterization of CeO2 pellets for simulation of nuclear fuel. Nucl. Eng. Des. 2016, 298, 160–167. [Google Scholar] [CrossRef]
  3. Torres, Y.; García-Ostos, C.; Arévalo, C.; Gotor, F.J.; Pavón, J.J.; Trueba, P.; Rodríguez-Ortiz, J.A. Processing and characterization of surrogate nuclear materials with controlled radial porosity. J. Nucl. Sci. Technol. 2017, 54, 167–173. [Google Scholar] [CrossRef]
  4. Fernandez, S.; Nieto, M.I.; Cobos, J.; Moreno, R. CeO2 pellet fabrication as spent fuel matrix analogue. J. Eur. Ceram. Soc. 2016, 36, 3505–3512. [Google Scholar] [CrossRef]
  5. Nelson, A.T.; Rittman, D.R.; White, J.T.; Dunwoody, J.T.; Kato, M.; McClellan, K.J. An Evaluation of the Thermophysical Properties of Stoichiometric CeO2 in Comparison to UO2 and PuO2. J. Am. Ceram. Soc. 2014, 97, 3652–3659. [Google Scholar] [CrossRef]
  6. Einstein, A.J.; Pascual, T.N.; Mercuri, M.; Karthikeyan, G.; Vitola, J.V.; Mahmarian, J.J.; Better, N.; Bouyoucef, S.E.; Hee-Seung Bom, H.; Lele, V.; et al. Current worldwide nuclear cardiology practices and radiation exposure: Results from the 65 country IAEA Nuclear Cardiology Protocols Cross-Sectional Study (INCAPS). Eur. Heart J. 2015, 36, 1689–1696. [Google Scholar] [CrossRef] [Green Version]
  7. Sunder, S.; Miller, N.H.; Shoesmith, D.W. Corrosion of uranium dioxide in hydrogen peroxide solutions. Corros. Sci. 2004, 46, 1095–1111. [Google Scholar] [CrossRef]
  8. Shoesmith, D.W.; Sunder, S.; Bailey, M.G.; Wallace, G.J. The Corrosion of Nuclear Fuel (UO2) In Oxygenated Solutions. Corros. Sci. 1989, 29, 1115–1128. [Google Scholar] [CrossRef]
  9. Christensen, H.; Sunder, S.; Shoesmith, D.W. Oxidation of unclear fuel (UO2) by the products of water radiolysis: Development of a kinetic model. J. Alloy. Compd. 1994, 213, 93–99. [Google Scholar] [CrossRef]
  10. Sunder, S.; Strandlund, L.K.; Shoesmith, D.W. Anodic oxidation and dissolution of CANDU fuel (UO2) in slightly alkaline sodium perchlorate solutions. Electrochim. Acta 1998, 43, 2359–2372. [Google Scholar] [CrossRef]
  11. Wang, Z.; Zhang, Y.; Liu, B.; Wu, K.; Thevuthasan, S.; Baer, D.R.; Zhu, Z.; Yu, X.Y.; Wang, F. In Situ Mass Spectrometric Monitoring of the Dynamic Electrochemical Process at the Electrode-Electrolyte Interface: A SIMS Approach. Anal. Chem. 2017, 89, 960–965. [Google Scholar] [CrossRef]
  12. Yang, L.; Yu, X.Y.; Zhu, Z.; Iedema, M.J.; Cowin, J.P. Probing liquid surfaces under vacuum using SEM and ToF-SIMS. Lab Chip 2011, 11, 2481–2484. [Google Scholar] [CrossRef]
  13. Yang, L.; Yu, X.-Y.; Zhu, Z.; Thevuthasan, T.; Cowin, J.P. Making a hybrid microfluidic platform compatible forin situimaging by vacuum-based techniques. J. Vac. Sci. Technol. A Vac. Surf. Films 2011, 29. [Google Scholar] [CrossRef]
  14. International Atomic Energy Agency. Industerial Safety Safety Guidelines for Nuclear Facilities; IAEA Nuclear Energy Series NP-T-3.3; International Atomic Energy Agency: Vienna, Austria, 2018; p. 264. [Google Scholar]
  15. Canadian Nuclear Safety Commission. Radiobioassy Protocols for Responding to Abnormal Intakes of Radionuclides; G-147; Canadian NuclearSafety Commission: Ottawa, ON, Canada, 2003; p. 27. [Google Scholar]
  16. Son, J.; Buck, E.C.; Riechers, S.L.; Yu, X.Y. Stamping Nanoparticles onto the Electrode for Rapid Electrochemical Analysis in Microfluidics. Micromachines 2021, 12, 60. [Google Scholar] [CrossRef]
  17. Mauritz, K.A.; Moore, R.B. State of Understanding of Nafion. Chem. Rev. 2004, 104, 4535–4586. [Google Scholar] [CrossRef] [PubMed]
  18. Nagao, Y. Highly Oriented Sulfonic Acid Groups in a Nafion Thin Film on Si Substrate. J. Phys. Chem. C 2013, 117, 3294–3297. [Google Scholar] [CrossRef]
  19. Paul, D.K.; McCreery, R.; Karan, K. Proton Transport Property in Supported Nafion Nanothin Films by Electrochemical Impedance Spectroscopy. J. Electrochem. Soc. 2014, 161, F1395–F1402. [Google Scholar] [CrossRef] [Green Version]
  20. Kaw, K.A.Y.; Palisoc, S.T.; Natividad, M.T. A morphological and cyclic voltammetric investigation of spin-coated hexaammineruthenium (III)-incorporated Nafion® thin films. Philipp. Sci. Lett. 2014, 7, 171–178. [Google Scholar]
  21. Palisoc, S.; Natividad, M.; Tadios, S. Fabrication and morphological characterization of Nafion thin films spin coated on silica. J. Optoelectron. Adv. Mater. 2014, 16, 759. [Google Scholar]
  22. Parnian, M.J.; Rowshanzamir, S.; Alipour Moghaddam, J. Investigation of physicochemical and electrochemical properties of recast Nafion nanocomposite membranes using different loading of zirconia nanoparticles for proton exchange membrane fuel cell applications. Mater. Sci. Energy Technol. 2018, 1, 146–154. [Google Scholar] [CrossRef]
  23. Liu, B.; Yu, X.Y.; Zhu, Z.; Hua, X.; Yang, L.; Wang, Z. In situ chemical probing of the electrode-electrolyte interface by ToF-SIMS. Lab Chip 2014, 14, 855–859. [Google Scholar] [CrossRef]
  24. Yu, J.; Zhou, Y.; Hua, X.; Liu, S.; Zhu, Z.; Yu, X.Y. Capturing the transient species at the electrode-electrolyte interface by in situ dynamic molecular imaging. Chem. Commun. 2016, 52, 10952–10955. [Google Scholar] [CrossRef] [PubMed]
  25. Paparazzo, E. Use and mis-use of X-ray photoemission spectroscopy Ce3d spectra of Ce2O3 and CeO2. J. Phys. Condens. Matter 2018, 30, 343003. [Google Scholar] [CrossRef]
  26. Hiesgen, R.; Aleksandrova, E.; Meichsner, G.; Wehl, I.; Roduner, E.; Friedrich, K.A. High-resolution imaging of ion conductivity of Nafion® membranes with electrochemical atomic force microscopy. Electrochim. Acta 2009, 55, 423–429. [Google Scholar] [CrossRef]
  27. Guo, R.; Talma, A.G.; Datta, R.N.; Dierkes, W.K.; Noordermeer, J.W.M. Novel Surface Modification of Sulfur by Plasma Polymerization and its Application in Dissimilar Rubber-Rubber Blends. Plasma Chem. Plasma Process. 2010, 30, 679–695. [Google Scholar] [CrossRef] [Green Version]
  28. Ferrari, S.; Ratner, B.D. ToF-SIMS quantification of albumin adsorbed on plasma-deposited fluoropolymers by partial least-squares regression. Surf. Interface Anal. 2000, 29, 837–844. [Google Scholar] [CrossRef]
  29. Wheeler, D.W. Kinetics and mechanism of the oxidation of cerium in air at ambient temperature. Corros. Sci. 2016, 111, 52–60. [Google Scholar] [CrossRef]
  30. Zhu, Y.; Jain, N.; Hudait, M.K.; Maurya, D.; Varghese, R.; Priya, S. X-ray photoelectron spectroscopy analysis and band offset determination of CeO2 deposited on epitaxial (100), (110), and (111)Ge. J. Vac. Sci. Technol. B 2014, 32, 011217. [Google Scholar] [CrossRef]
  31. Grygar, T.; Marken, F.; Schröder, U.; Scholz, F. Electrochemical Analysis of Solids. A Review. Collect. Czechoslov. Chem. Commun. 2002, 67, 163–208. [Google Scholar] [CrossRef] [Green Version]
  32. Ghosh, P.K.; Bard, A.J. Clay-Modified Electrodes. J. Am. Chem. Soc. 1983, 105, 5691–5693. [Google Scholar] [CrossRef]
  33. Murugan, R.; Ravi, G.; Yuvakkumar, R.; Rajendran, S.; Maheswari, N.; Muralidharan, G.; Hayakawa, Y. Pure and Co doped CeO2 nanostructure electrodes with enhanced electrochemical performance for energy storage applications. Ceram. Int. 2017, 43, 10494–10501. [Google Scholar] [CrossRef]
  34. Yao, J.; Wu, F.; Qiu, X.; Li, N.; Su, Y. Effect of CeO2-coating on the electrochemical performances of LiFePO4/C cathode material. Electrochim. Acta 2011, 56, 5587–5592. [Google Scholar] [CrossRef]
  35. Rosalbino, F.; Angelini, E.; De Negri, S.; Saccone, A.; Delfino, S. Influence of the rare earth content on the electrochemical behaviour of Al–Mg–Er alloys. Intermetallics 2003, 11, 435–441. [Google Scholar] [CrossRef]
Figure 1. (a) The flow chart of the step-by-step fabrication process of particle deposition (1–3), Nafion film formation (4–5), and the assembled electrochemical device (6); and (b) the setup to perform electrochemical analysis of CeO2 containing SALVI E-cells.
Micromachines 12 01414 g001
Figure 2. (a) CV results of CeO2-applied electrochemical cell using 5% Nafion, 1000 rpm spin rate and 80 mV/s scan rate, (b) SEM image of the CeO2 WE surface after electrochemical corrosion with a magnification of 14,000 X, (c) SEM-FIB image of the suspended lamella from the corroded CeO2 WE surface with a magnification of 12,000 X, (d) CV results of the Nafion only control using 5 wt% Nafion 500 rpm spin rate and 80 mV/s scan rate, (e) SEM image of the pristine CeO2 WE surface with a magnification of 12,000, and (f) SEM-FIB image of the suspended lamella from the pristine CeO2 WE surface with a magnification of 6500.
Micromachines 12 01414 g002
Figure 3. Normalized ToF-SIMS 2D positive ion images of representative CeO2 particles and Nafion fragments on a pristine CeO2 WE surface: (a) Ce+, (b) CeO+, (c) C4F5+, and (d) C4F7+. Corresponding AFM images of the as-fabricated electrode (e) 2D surface and (f) 3D amplitude images. Similarly, representative ToF-SIMS 2D positive ion images of the CeO2 WE surface after CV scans depicted in (gj) and AFM 2D/3D images (k,l), respectively.
Micromachines 12 01414 g003
Figure 4. ToF-SIMS spectral comparison of (ac) the pristine and (df) CV scanned CeO2 WE surface. Ce+ and CeO+ peaks are related to CeO2 while C4F7+ is related to the Nafion membrane.
Micromachines 12 01414 g004
Figure 5. XPS narrow scan regions of the Ce(3d) after CV (a) and pristine WE condition (b).
Micromachines 12 01414 g005
Table 1. Nafion membrane fabrication conditions for thickness optimization.
No.Nafion (%)Spin Rate (rpm)Curing Time (min)Footprint (mm × mm2)Avg. Thickness (µm)Note
15500302.1 × 2.20.13Nafion only
251000302.1 × 2.10.12Nafion only
320500302.4 × 1.71.18Nafion only
4201000302.0 × 2.10.83Nafion only
520500302.5 × 2.414.21Nafion over CeO2 deposit
6 201000301.8 × 1.86.45Nafion over CeO2 deposit
Publisher’s Note: MDPI stays neutral with regard to jurisdictional claims in published maps and institutional affiliations.

