
Biosensing Near the Exceptional Point Based on Resonant Optical Tunneling Effect


Abstract
1. Introduction
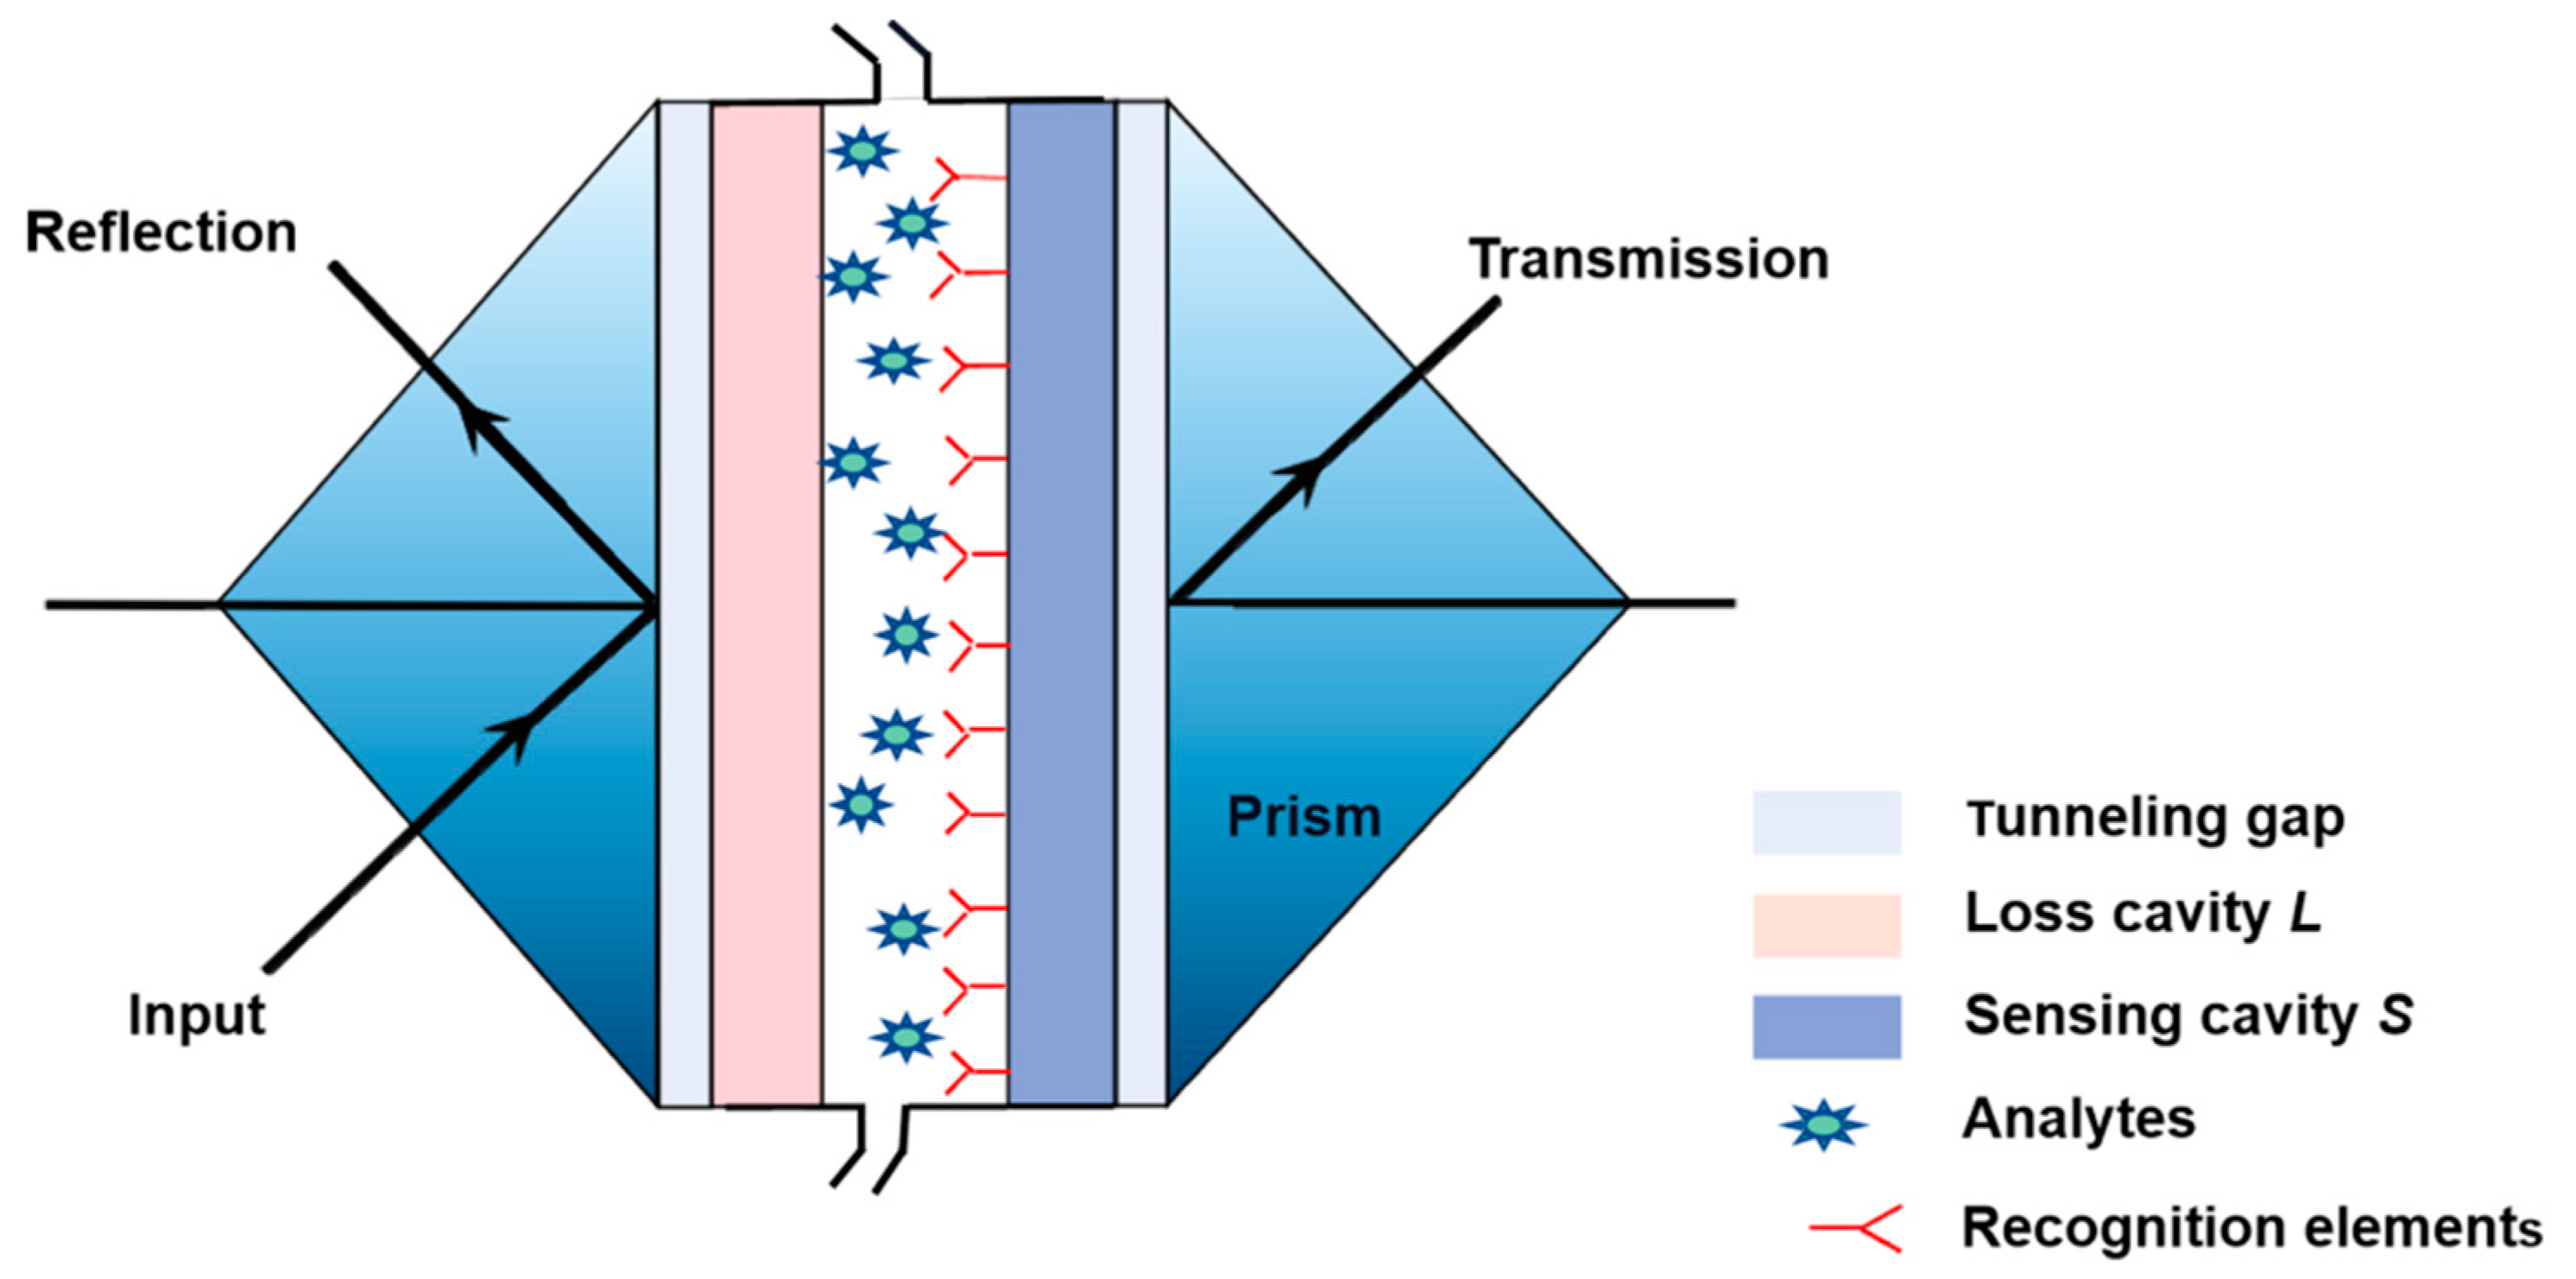
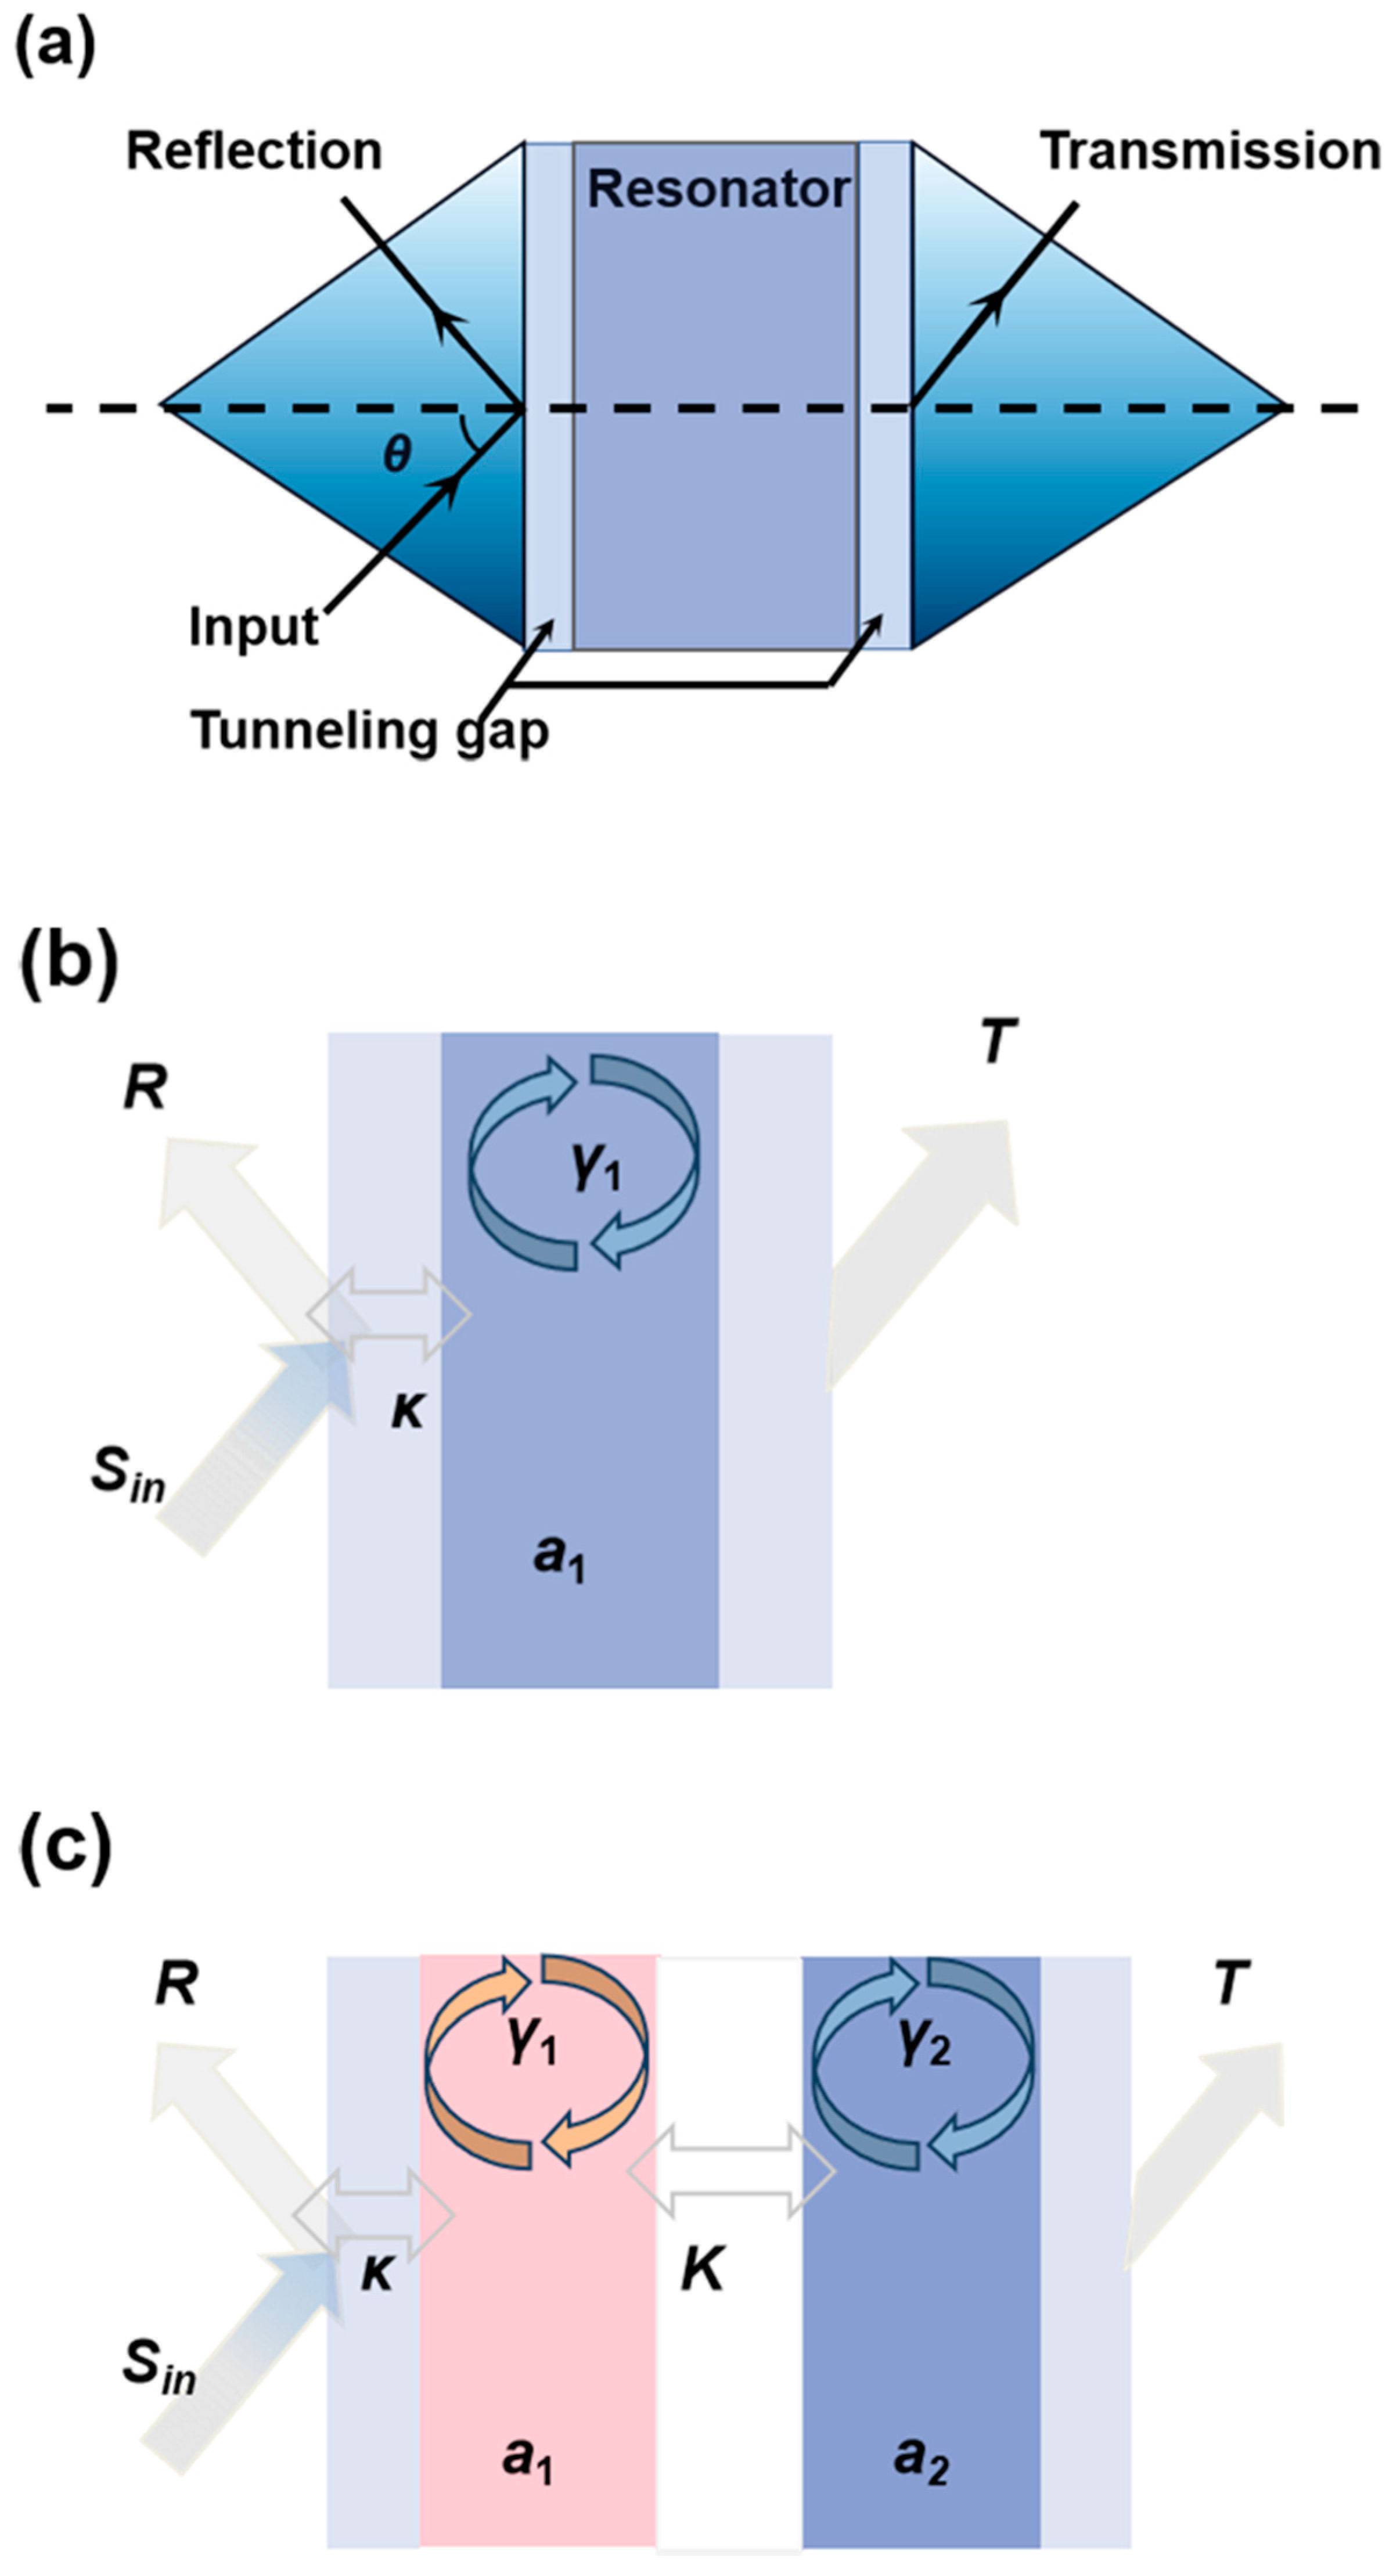
2. Device Design
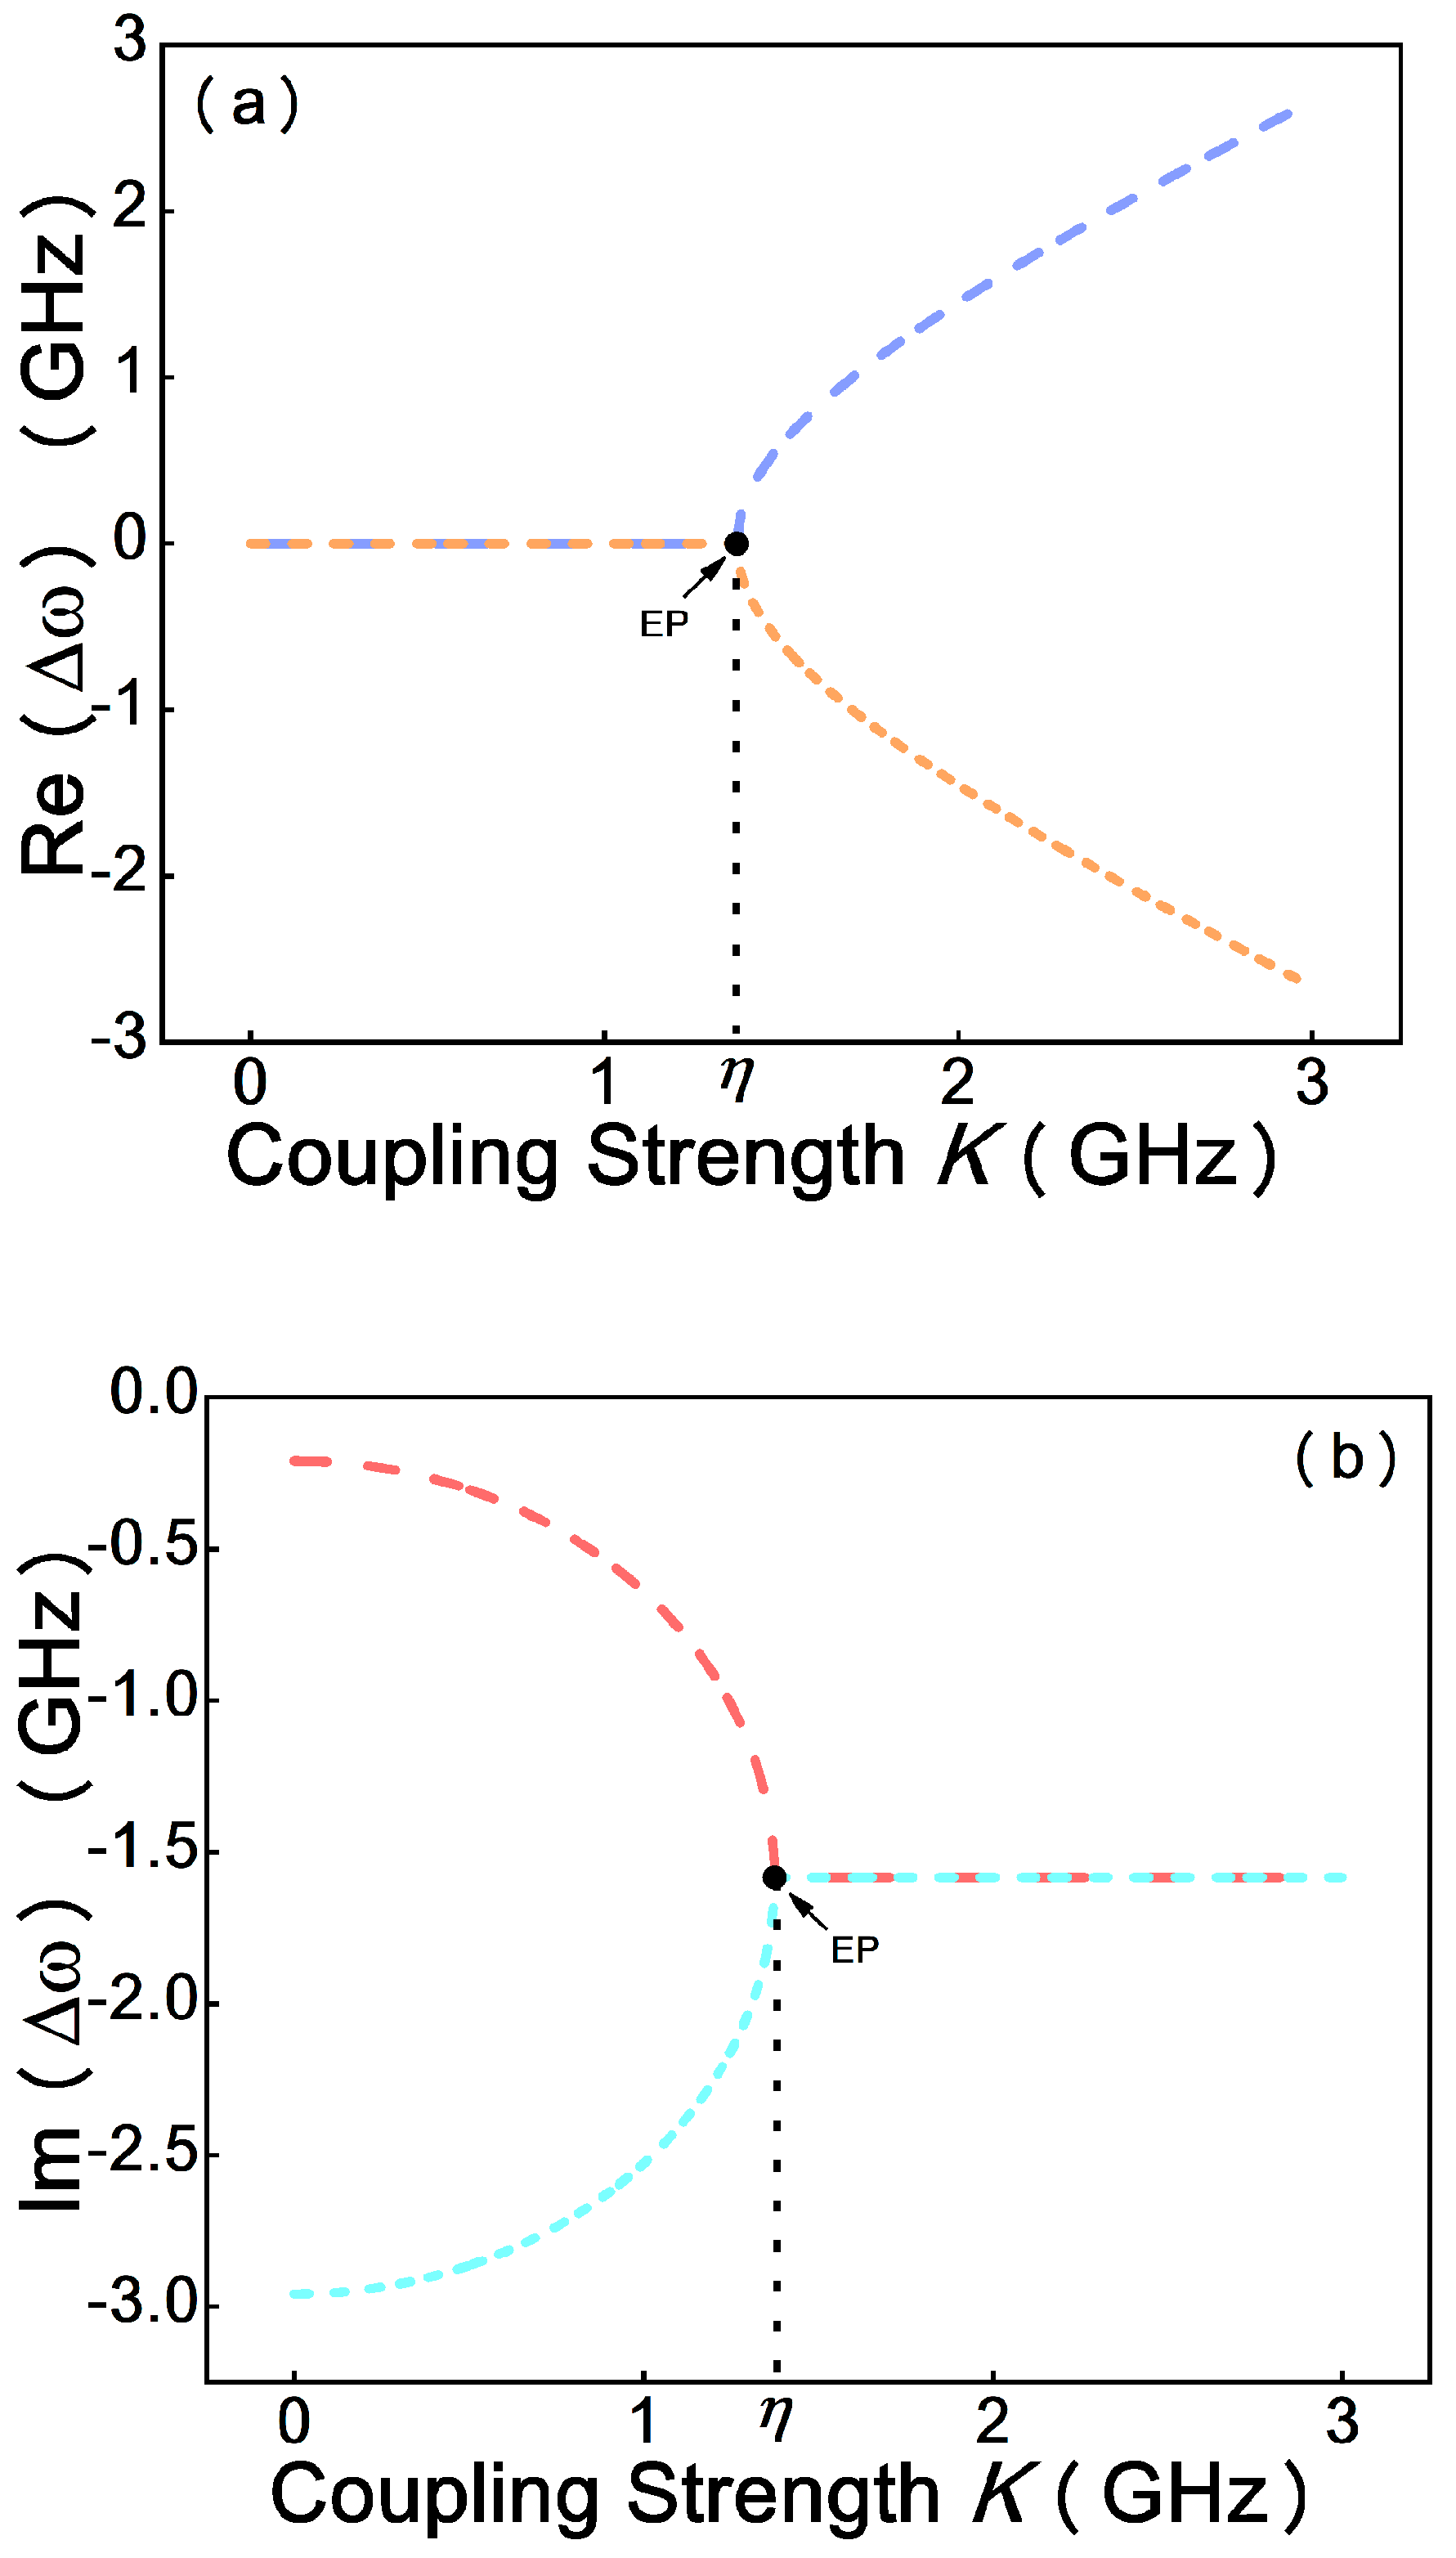
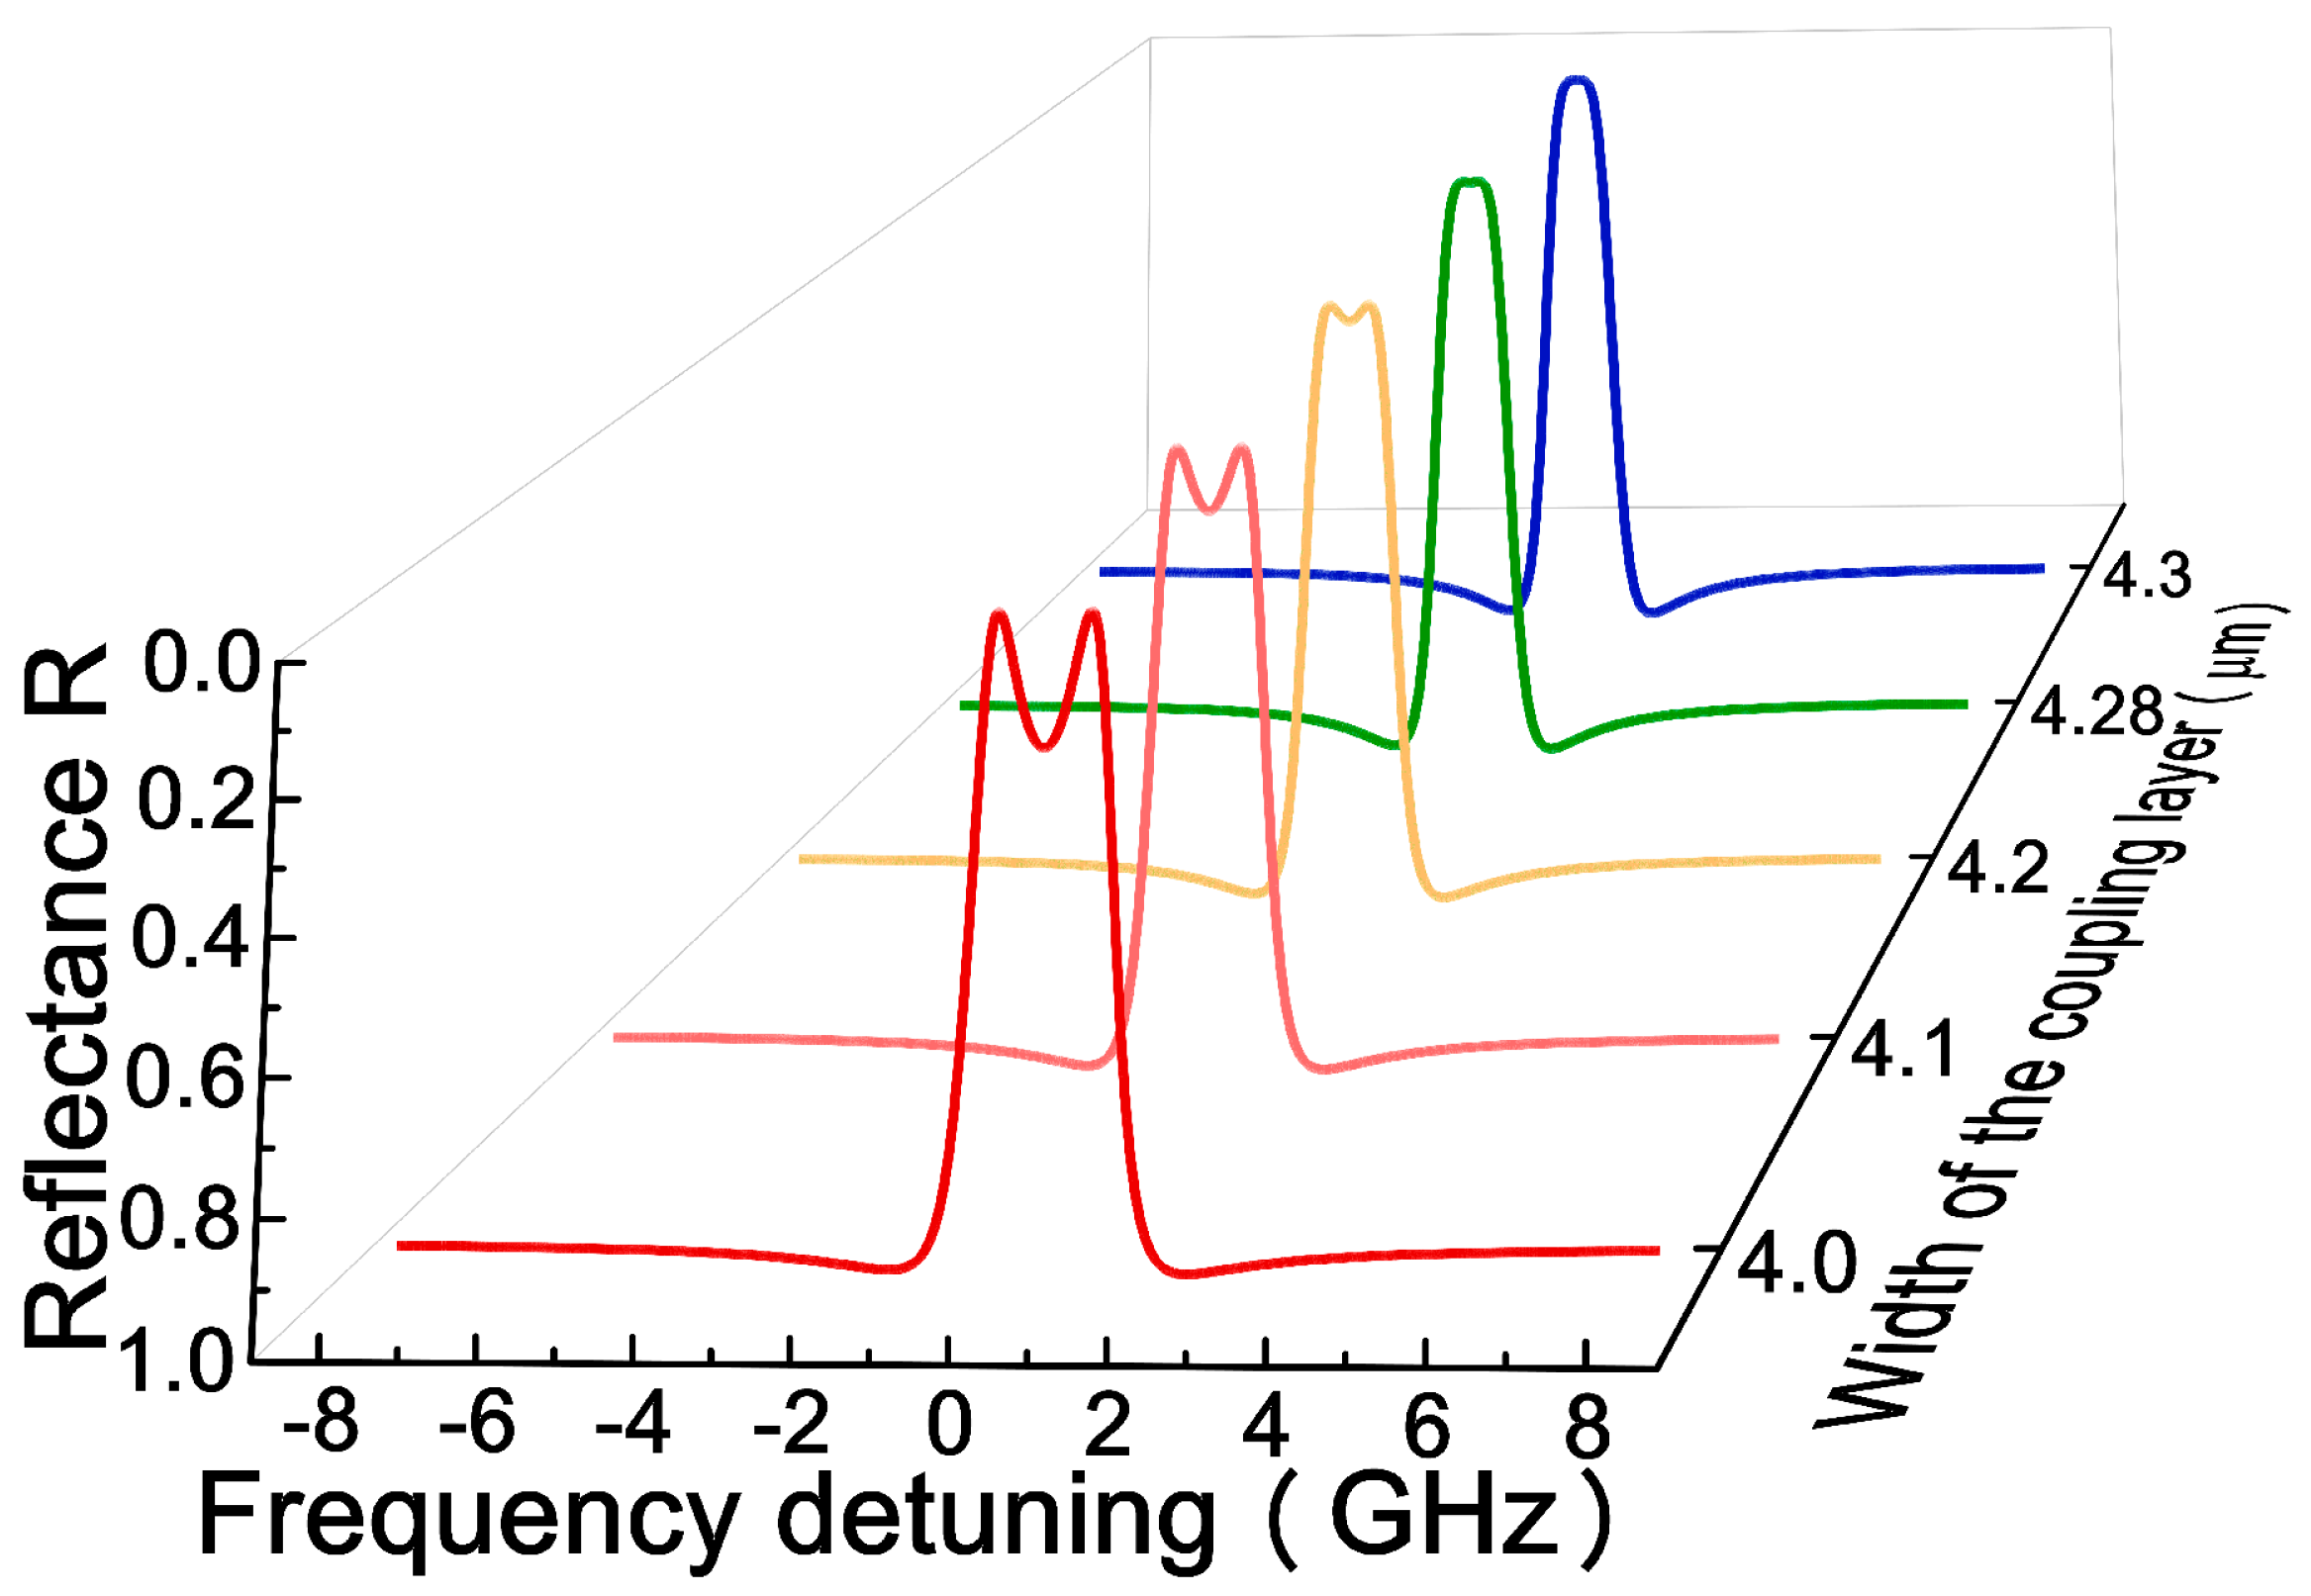
3. Theoretical Analysis and Simulation
4. Conclusions
Author Contributions
Funding
Institutional Review Board Statement
Informed Consent Statement
Data Availability Statement
Conflicts of Interest
References
- KATO, T. Peturbation Teory for Linear Operators; Springer: New York, NY, USA, 1966. [Google Scholar]
- Berry, M.V. Physics of Nonhermitian Degeneracies. Czechoslov. J. Phys. 2004, 54, 1039–1047. [Google Scholar] [CrossRef]
- El-Ganainy, R.; Makris, K.G.; Christodoulides, D.N.; Musslimani, Z.H. Theory of coupled optical PT-symmetric structures. Opt. Lett. 2007, 32, 2632–2634. [Google Scholar] [CrossRef]
- Longhi, S. Bloch Oscillations in Complex Crystals with PT Symmetry. Phys. Rev. Lett. 2009, 103, 4. [Google Scholar] [CrossRef]
- Peng, B.; Ozdemir, S.K.; Lei, F.C.; Monifi, F.; Gianfreda, M.; Long, G.L.; Fan, S.H.; Nori, F.; Bender, C.M.; Yang, L. Parity-time-symmetric whispering-gallery microcavities. Nat. Phys. 2014, 10, 394–398. [Google Scholar] [CrossRef]
- Miri, M.A.; Alu, A. Exceptional points in optics and photonics. Science 2019, 363, eaar7709. [Google Scholar] [CrossRef]
- Zhu, J.G.; Ozdemir, S.K.; He, L.N.; Yang, L. Controlled manipulation of mode splitting in an optical microcavity by two Rayleigh scatterers. Opt. Express 2010, 18, 23535–23543. [Google Scholar] [CrossRef]
- Peng, B.; Ozdemir, S.K.; Liertzer, M.; Chen, W.J.; Kramer, J.; Yilmaz, H.; Wiersig, J.; Rotter, S.; Yang, L. Chiral modes and directional lasing at exceptional points. Proc. Natl. Acad. Sci. USA 2016, 113, 6845–6850. [Google Scholar] [CrossRef]
- Huang, Y.; Shen, Y.C.; Veronis, G. Non-PT-symmetric two-layer cylindrical waveguide for exceptional-point-enhanced optical devices. Opt. Express 2019, 27, 37494–37507. [Google Scholar] [CrossRef]
- Lin, Z.; Pick, A.; Loncar, M.; Rodriguez, A.W. Enhanced Spontaneous Emission at Third-Order Dirac Exceptional Points in Inverse-Designed Photonic Crystals. Phys. Rev. Lett. 2016, 117, 107402. [Google Scholar] [CrossRef]
- Huang, Y.; Shen, Y.C.; Min, C.J.; Fan, S.H.; Veronis, G. Unidirectional reflectionless light propagation at exceptional points. Nanophotonics 2017, 6, 977–996. [Google Scholar] [CrossRef]
- Guo, A.; Salamo, G.J.; Duchesne, D.; Morandotti, R.; Volatier-Ravat, M.; Aimez, V.; Siviloglou, G.A.; Christodoulides, D.N. Observation of PT-Symmetry Breaking in Complex Optical Potentials. Phys. Rev. Lett. 2009, 103, 4. [Google Scholar] [CrossRef]
- Miller, J. Exceptional points make for exceptional sensors. Phys. Today 2017, 70, 23–26. [Google Scholar] [CrossRef]
- Wiersig, J. Enhancing the Sensitivity of Frequency and Energy Splitting Detection by Using Exceptional Points: Application to Microcavity Sensors for Single-Particle Detection. Phys. Rev. Lett. 2014, 112, 5. [Google Scholar] [CrossRef]
- Wiersig, J. Sensors operating at exceptional points: General theory. Phys. Rev. A 2016, 93, 9. [Google Scholar] [CrossRef]
- Chen, W.J.; Ozdemir, S.K.; Zhao, G.M.; Wiersig, J.; Yang, L. Exceptional points enhance sensing in an optical microcavity. Nature 2017, 548, 192–196. [Google Scholar] [CrossRef]
- Hodaei, H.; Hassan, A.U.; Wittek, S.; Garcia-Gracia, H.; El-Ganainy, R.; Christodoulides, D.N.; Khajavikhan, M. Enhanced sensitivity at higher-order exceptional points. Nature 2017, 548, 187–191. [Google Scholar] [CrossRef]
- Yeh, p.; Hendry, M. Optical waves in layered media. Phys. Today 1990, 43, 77–78. [Google Scholar] [CrossRef]
- Hayashi, S.; Kurokawa, H.; Oga, H. Observation of Resonant Photon Tunneling in Photonic Double Barrier Structures. Opt. Rev. 1999, 6, 204–210. [Google Scholar] [CrossRef]
- Jian, A.Q.; Wei, C.G.; Guo, L.F.; Hu, J.; Tang, J.; Liu, J.; Zhang, X.M.; Sang, S.B. Theoretical Analysis of an Optical Accelerometer Based on Resonant Optical Tunneling Effect. Sensors 2017, 17, 389. [Google Scholar] [CrossRef]
- Jian, A.Q.; Zou, L.; Bai, G.; Duan, Q.Q.; Zhang, Y.X.; Zhang, Q.W.; Sang, S.B.; Zhang, X.M. Highly sensitive cell concentration detection by resonant optical tunneling effect. J. Lightwave Technol. 2019, 37, 2800–2806. [Google Scholar] [CrossRef]
- Jian, A.; Jiao, M.; Zhang, Y.; Zhang, Q.; Xue, X.; Sang, S.; Zhang, X. Enhancement of the volume refractive index sensing by ROTE and its application on cancer and normal cells discrimination. Sens. Actuators A Phys. 2020, 313, 112177. [Google Scholar] [CrossRef]
- Jian, A.; Liu, F.; Bai, G.; Zhang, B.; Zhang, Y.; Zhang, Q.; Xue, X.; Sang, S.; Zhang, X. Parity-time symmetry based on resonant optical tunneling effect for biosensing. Opt. Commun. 2020, 475, 125815. [Google Scholar] [CrossRef]
- Cham, J. Top 10 physics discoveries of the last 10 years. .Nat. Phys. 2015, 11, 799. [Google Scholar] [CrossRef]
- Peng, B.; Ozdemir, S.K.; Rotter, S.; Yilmaz, H.; Liertzer, M.; Monifi, F.; Bender, C.M.; Nori, F.; Yang, L. Loss-induced suppression and revival of lasing. Science 2014, 346, 328–332. [Google Scholar] [CrossRef] [PubMed]
- Fan, X.D.; White, I.M. Optofluidic microsystems for chemical and biological analysis. Nat. Photonics 2011, 5, 591–597. [Google Scholar] [CrossRef]
- Guo, Y.B.; Li, H.; Reddy, K.; Shelar, H.S.; Nittoor, V.R.; Fan, X.D. Optofluidic Fabry-Perot cavity biosensor with integrated flow-through micro-/nanochannels. Appl. Phys. Lett. 2011, 98, 3. [Google Scholar] [CrossRef]
- Boucher, D.; Cournoyer, D.; Stanners, C.P.; Fuks, A. Studies on the control of gene expression of the carcinoembryonic antigen family in human tissue. Cancer Res. 1989, 49, 847–852. [Google Scholar]
- Zhang, X.; Zou, Y.C.; An, C.; Ying, K.J.; Chen, X.; Wang, P. A miniaturized immunosensor platform for automatic detection of carcinoembryonic antigen in EBC. Sens. Actuator B Chem. 2014, 205, 94–101. [Google Scholar] [CrossRef]
- Zou, Y.C.; Wang, L.; Zhao, C.; Hu, Y.J.; Xu, S.; Ying, K.J.; Wang, P.; Chen, X. CEA, SCC and NSE levels in exhaled breath condensate-possible markers for early detection of lung cancer. J. Breath Res. 2013, 7, 10. [Google Scholar] [CrossRef]
- Moro, D.; Villemain, D.; Vuillez, J.P.; Agnius Delord, C.; Brambilla, C. CEA CYFRA21-1 and SCC in non-small cell lung cancer. Lung Cancer 1995, 13, 169–176. [Google Scholar] [CrossRef]
- Haus, H.A. Waves and Fields in Optoelectronics; Prentice Hall: Hoboken, NJ, USA, 1984. [Google Scholar]
- Polster, H.D. A Symmetrical All-Dielectric Interference Filter. J. Opt. Soc. Am. 1952, 42, 21–24. [Google Scholar] [CrossRef]
- Langbein, W. No exceptional precision of exceptional-point sensors. Phys. Rev. A 2018, 98, 8. [Google Scholar] [CrossRef]
- Zhang, M.Z.; Sweeney, W.; Hsu, C.W.; Yang, L.; Stone, A.D.; Jiang, L. Quantum Noise Theory of Exceptional Point Amplifying Sensors. Phys. Rev. Lett. 2019, 123, 6. [Google Scholar] [CrossRef] [PubMed]


| Parameter | Material | Symbol | Value |
|---|---|---|---|
| RI of input prism | K9 glass | nin | 1.5000−9.84 × 10⁻⁸i |
| RI of the first tunneling layer Width of the first tunneling layer | Polydimethylsiloxane (PDMS) | n1 d1 | 1.396–5 × 10⁻⁶i 5.5 μm |
| RI of the loss cavity Width of the loss cavity | Silicate glass | n2 d2 | 1.65−1.2 × 10⁻⁸i 800 μm |
| RI of coupling layer Width of coupling layer | Sample | n3 d3 | 1.3506−6.4538 × 10⁻⁶i 4.28 μm |
| RI of the sensing cavity Width of the sensing cavity | Silicate glass | n4 d4 | 1.65−1.6 × 10⁻⁸i 800 μm |
| RI of the second tunneling layer Width of the second tunneling layer | Polydimethylsiloxane (PDMS) | n5 d5 | 1.396–5 × 10⁻⁶i 5.5 μm |
| RI of output prism | K9 glass | nout | 1.5000−9.84 × 10⁻⁸i |
| Incident angle | θ | 68.84° |
Publisher’s Note: MDPI stays neutral with regard to jurisdictional claims in published maps and institutional affiliations. |
© 2021 by the authors. Licensee MDPI, Basel, Switzerland. This article is an open access article distributed under the terms and conditions of the Creative Commons Attribution (CC BY) license (https://creativecommons.org/licenses/by/4.0/).
Share and Cite
Liu, Y.; Yan, P.; Liu, F.; Jian, A.; Sang, S. Biosensing Near the Exceptional Point Based on Resonant Optical Tunneling Effect. Micromachines 2021, 12, 426. https://doi.org/10.3390/mi12040426
Liu Y, Yan P, Liu F, Jian A, Sang S. Biosensing Near the Exceptional Point Based on Resonant Optical Tunneling Effect. Micromachines. 2021; 12(4):426. https://doi.org/10.3390/mi12040426
Chicago/Turabian StyleLiu, Yang, Pengyun Yan, Feng Liu, Aoqun Jian, and Shengbo Sang. 2021. "Biosensing Near the Exceptional Point Based on Resonant Optical Tunneling Effect" Micromachines 12, no. 4: 426. https://doi.org/10.3390/mi12040426
APA StyleLiu, Y., Yan, P., Liu, F., Jian, A., & Sang, S. (2021). Biosensing Near the Exceptional Point Based on Resonant Optical Tunneling Effect. Micromachines, 12(4), 426. https://doi.org/10.3390/mi12040426