
Visualization of Local Concentration and Viscosity Distribution during Glycerol-Water Mixing in a Y-Shape Minichannel: A Proof-of-Concept-Study


Abstract
:1. Introduction
2. Materials and Methods
2.1. Concentration Analysis
- is the density of the fluid ;
- is the velocity of the fluid
- is a characteristic linear dimension ;
- is the dynamic viscosity of the fluid ; and
- is the kinematic viscosity of the fluid .
2.2. Fluid Preparation
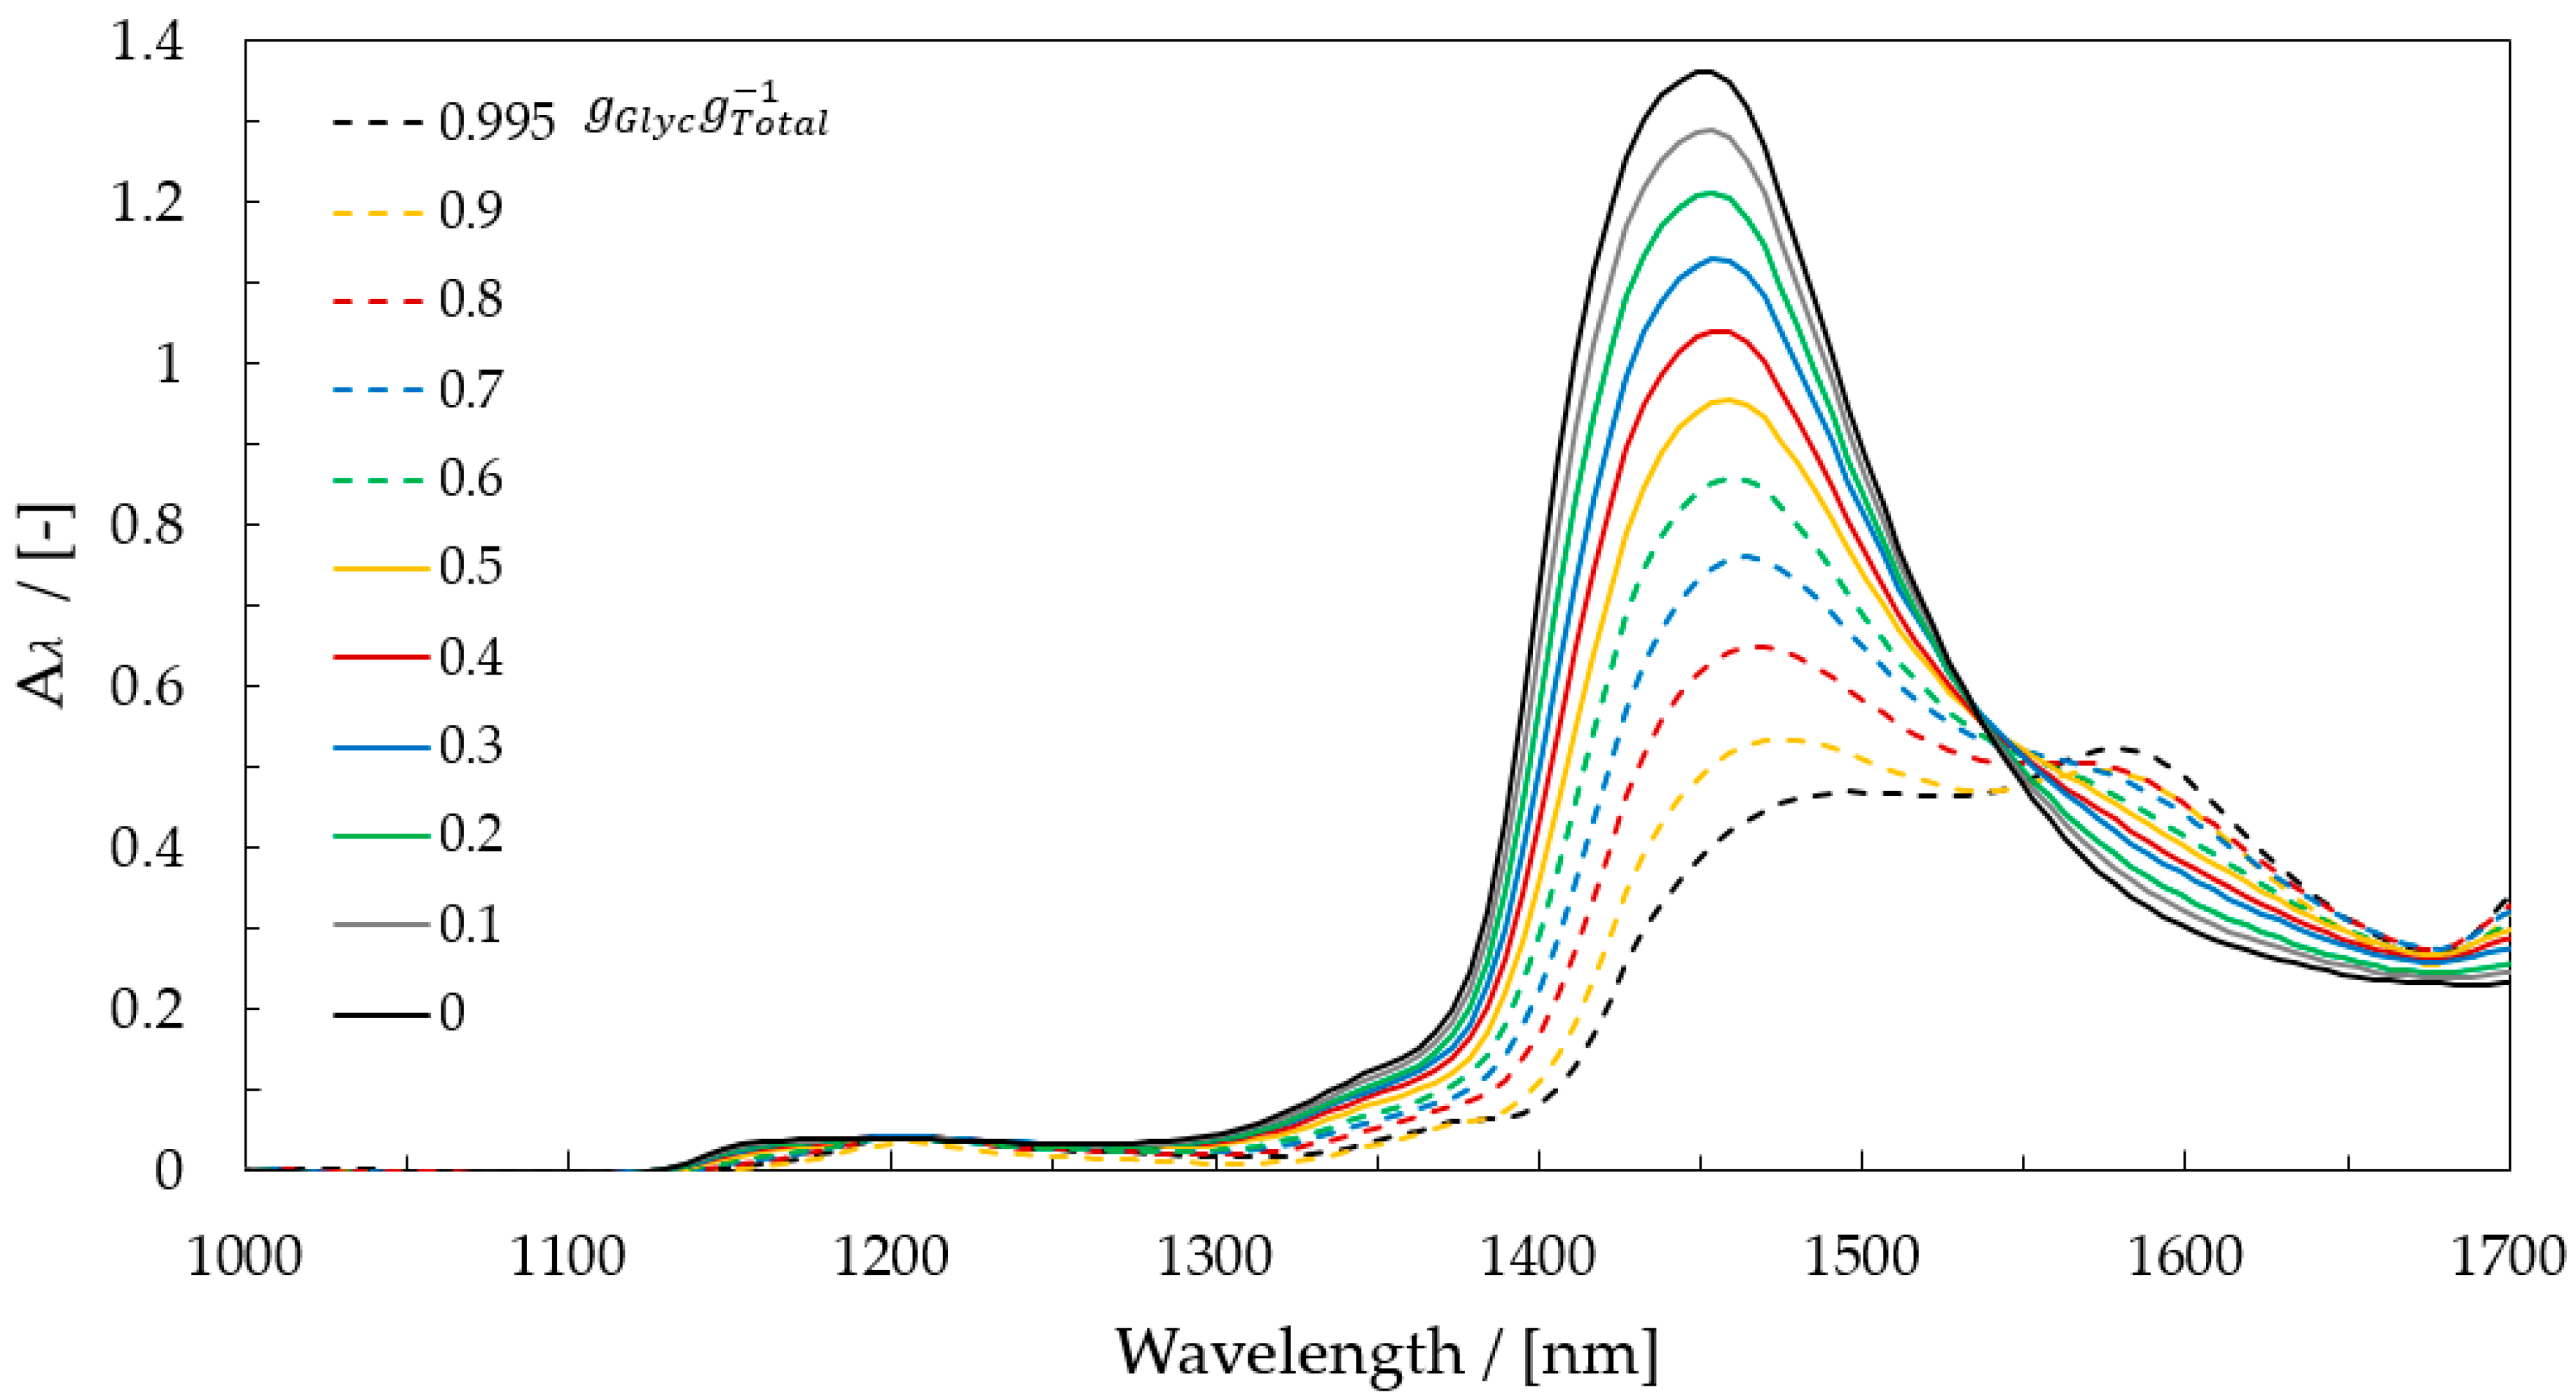
2.3. Spectroscopy
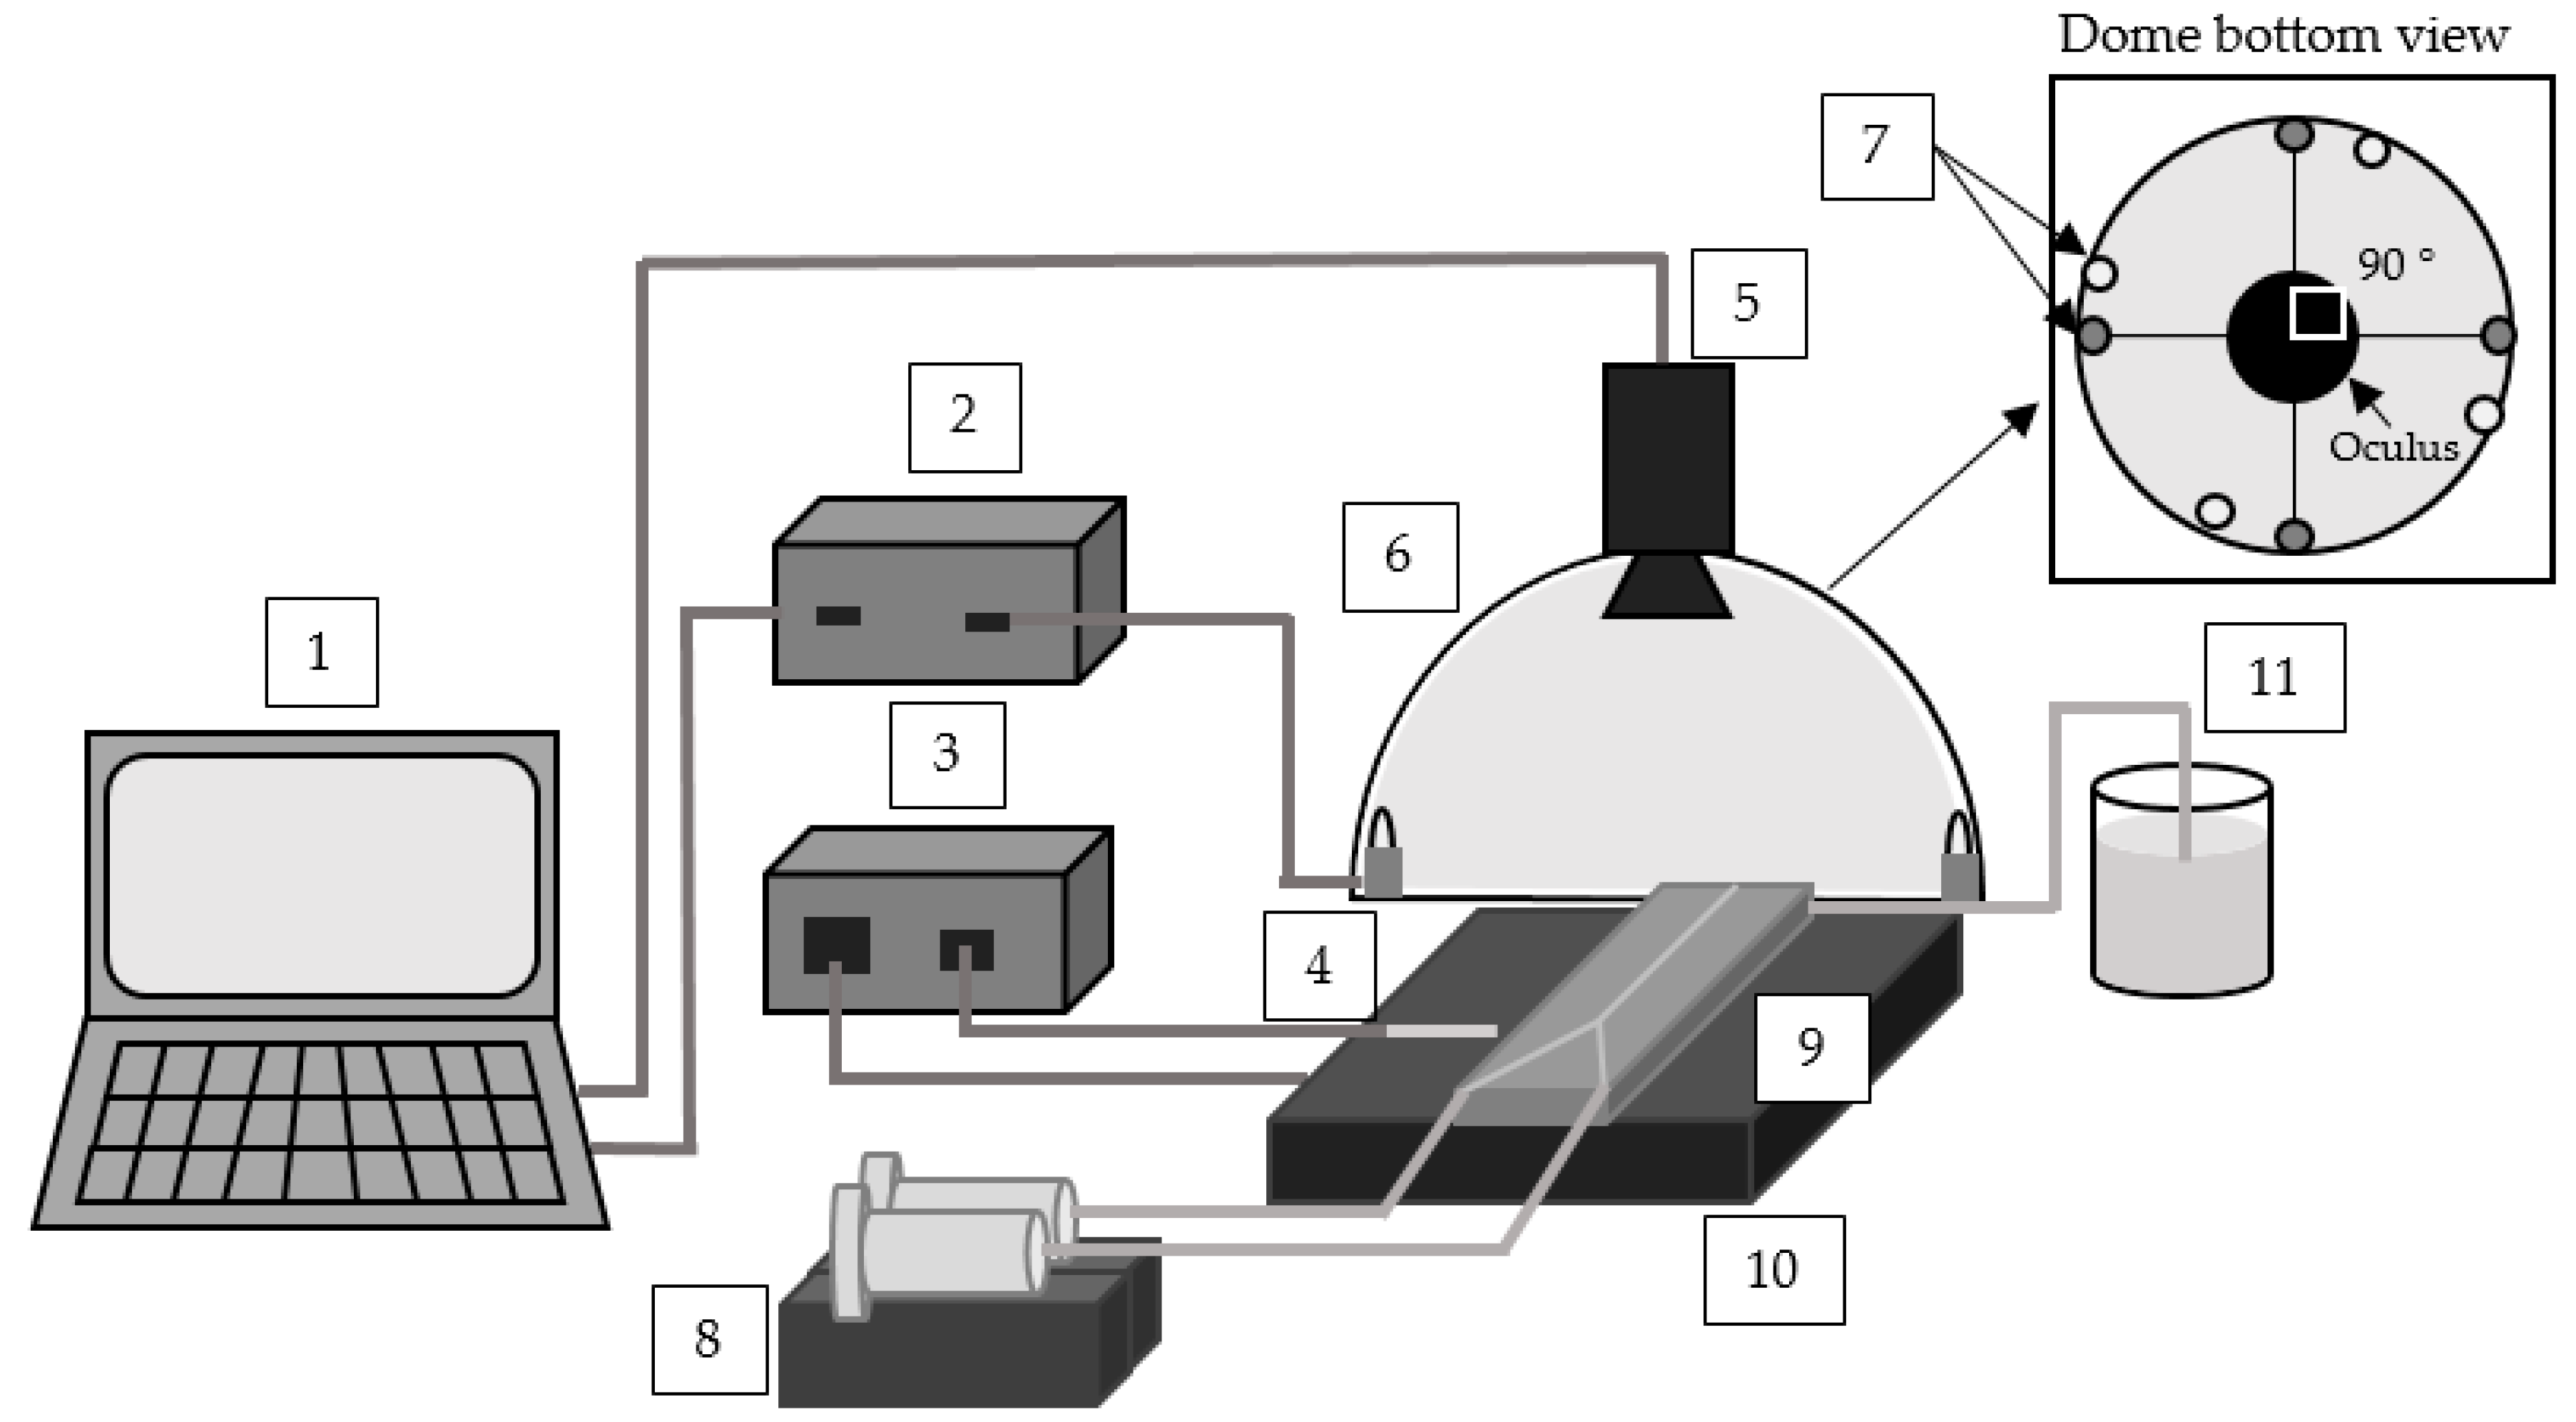
2.4. Experimental Setup
2.5. Calibration and Concentration Samples
3. Results and Discussion
Effect of Temperature
4. Conclusions
Author Contributions
Funding
Data Availability Statement
Acknowledgments
Conflicts of Interest
Appendix A

| ϑ (°C) | a | b |
|---|---|---|
| 20 | 0.671 | 2.073 |
| 30 | 0.654 | 2.068 |
| 40 | 0.637 | 2.053 |
| Cheng [28] | Segur and Oberstar [23] | P.N.Shankar [25] | |||
|---|---|---|---|---|---|
| Glycerol Mass Fraction | Fluid Density (kg m–3) | Reynold Number | Viscosity (mPa s) | Viscosity (mPa s) | Viscosity (mPa s) |
| 0 | 998.0 | 49.66 | 1.005 | 1.005 | 0.984 |
| 0.1 | 1024 | 39.49 | 1.297 | 1.310 | 1.274 |
| 0.2 | 1051 | 30.18 | 1.741 | 1.760 | 1.734 |
| 0.3 | 1078 | 21.95 | 2.455 | 2.500 | 2.462 |
| 0.4 | 1104 | 14.96 | 3.685 | 3.720 | 3.728 |
| 0.5 | 1131 | 9.421 | 6.002 | 6.000 | 5.886 |
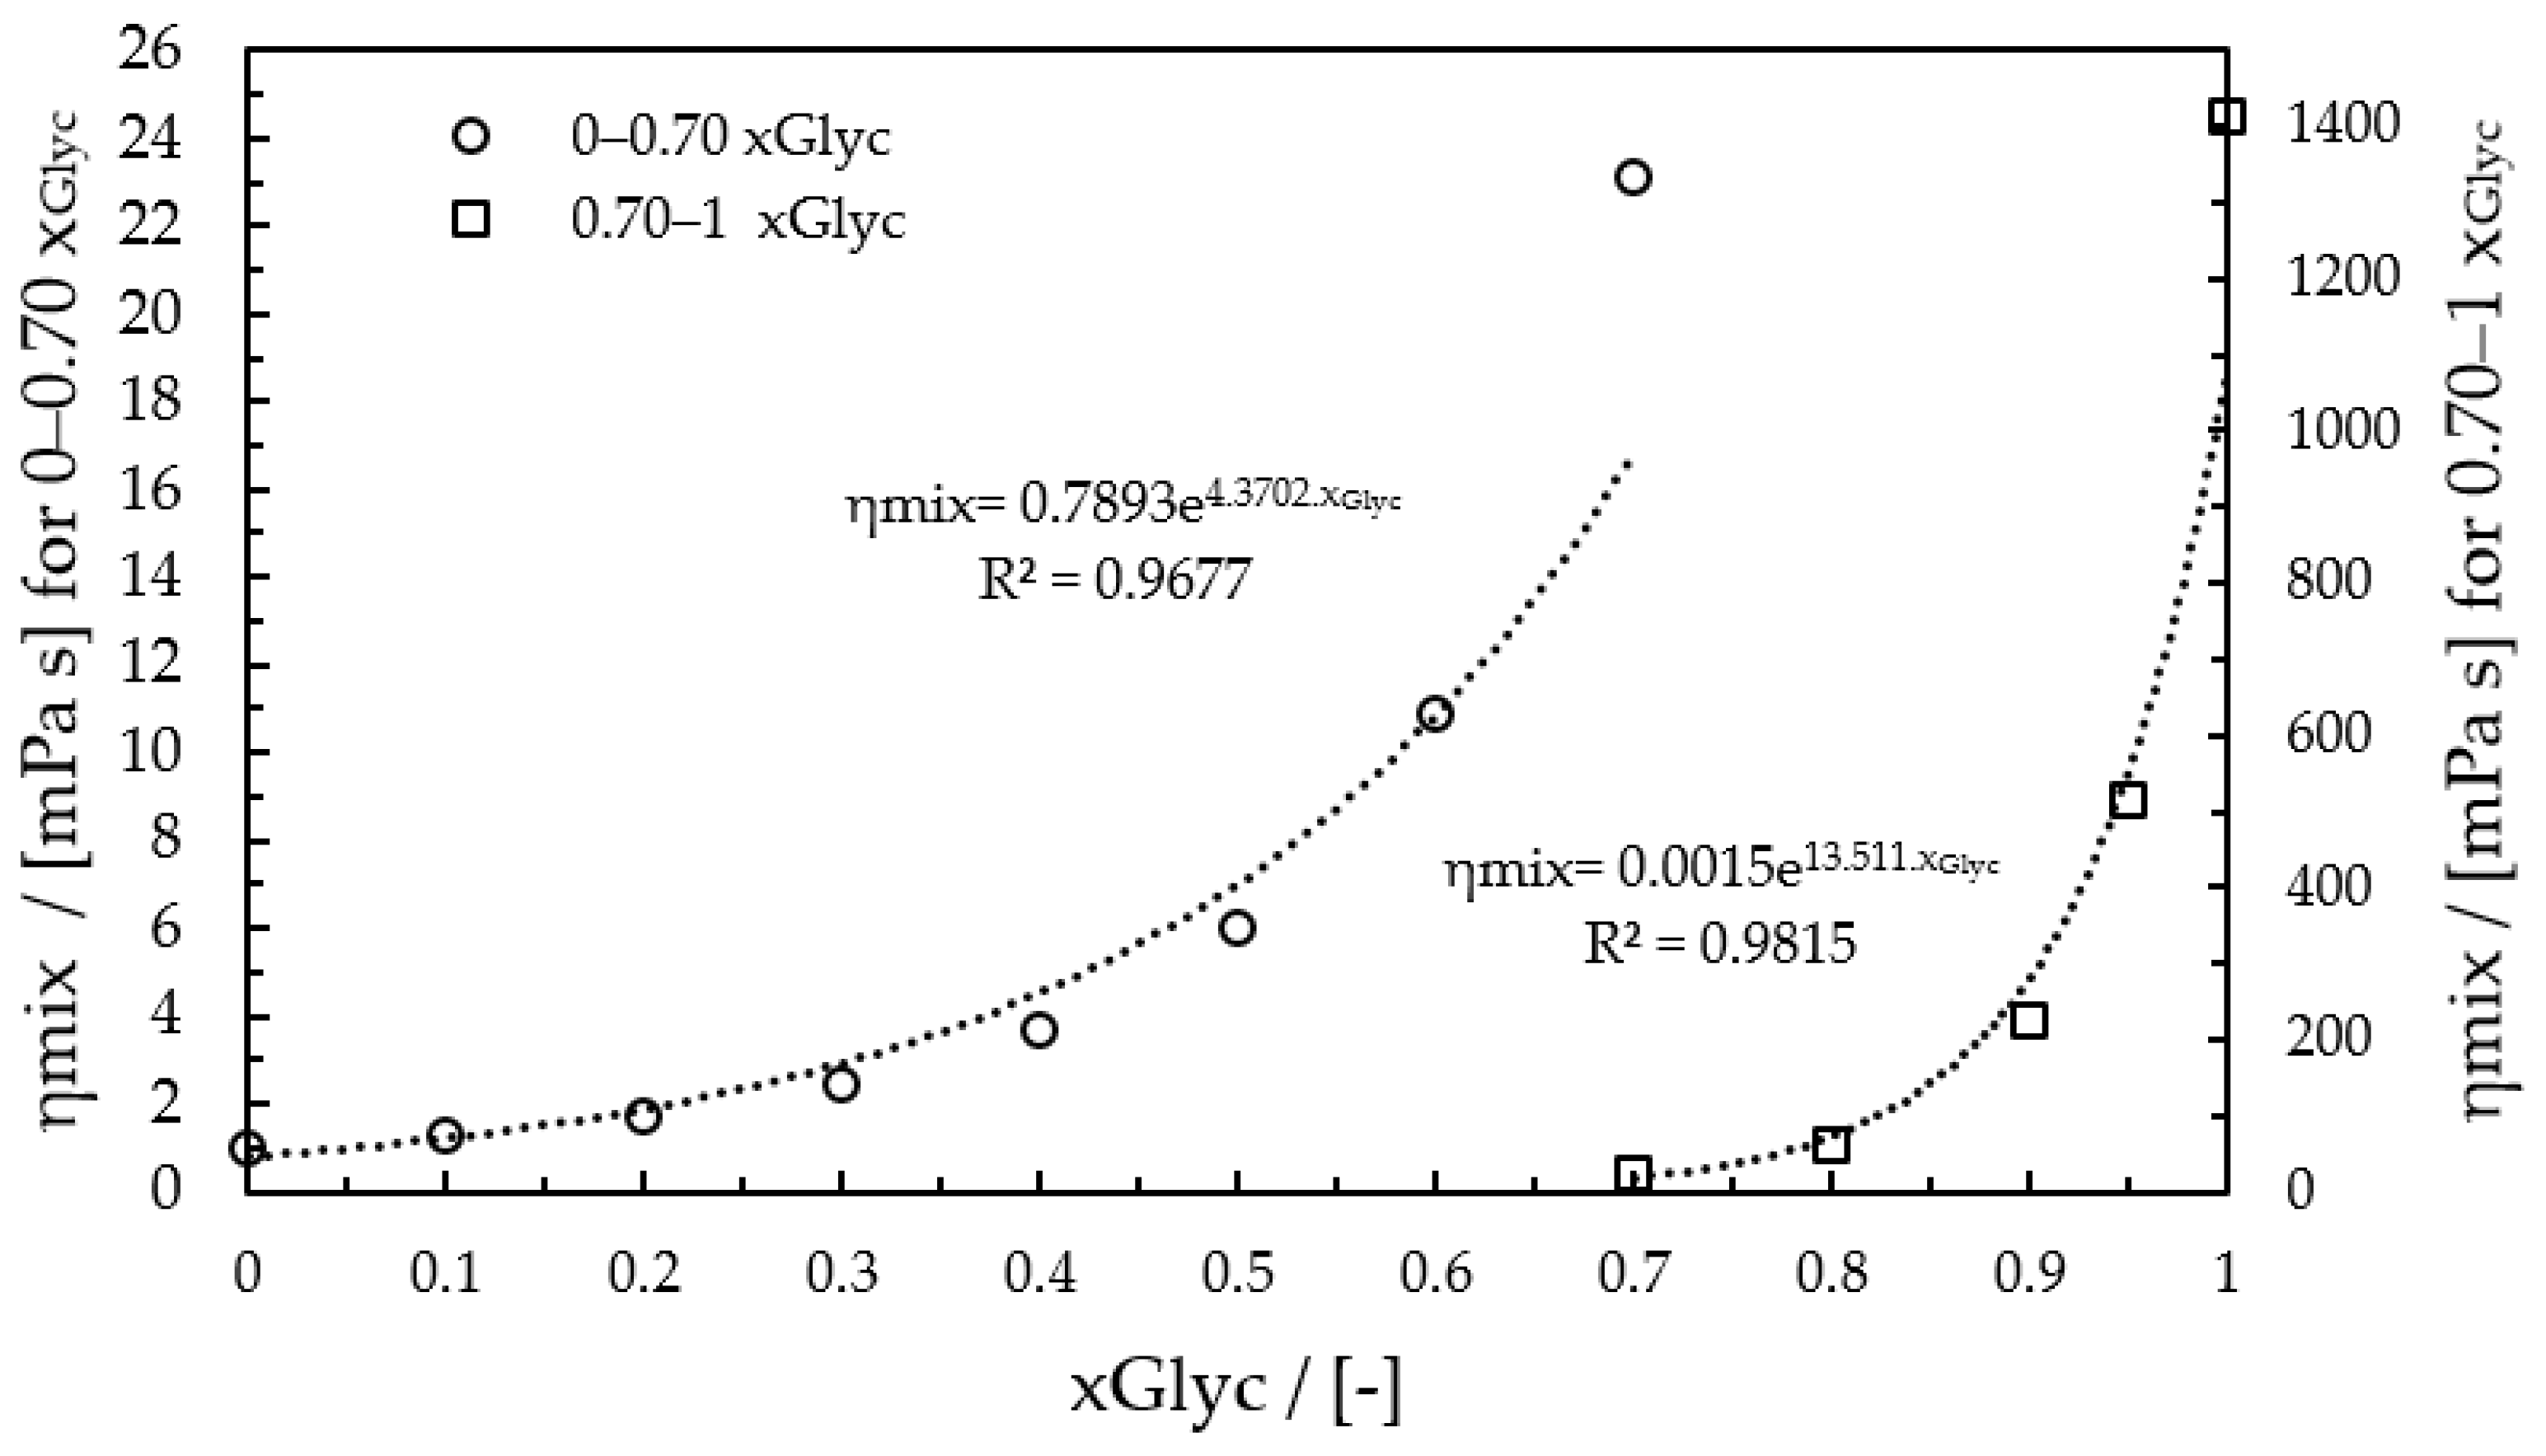
| 0.6 | 1158 | 5.304 | 10.91 | 10.80 | 10.53 |
| 0.7 | 1184 | 2.564 | 23.09 | 22.50 | 21.89 |
| 0.8 | 1211 | 0.995 | 60.86 | 60.10 | 55.84 |
| 0.9 | 1237 | 0.277 | 223.7 | 219.0 | 229.7 |
| 0.95 | 1251 | 0.121 | 515.6 | 523.0 | 232.4 |
| 1 | 1264 | 0.045 | 1413 | 1412 | 1466 |
References
- Ehrfeld, W.; Hessel, V.; Löwe, H. Microreactors: New Technology for Modern Chemistry, 1st ed.; 3. reprint; Wiley-VCH: Weinheim, Germany, 2005; ISBN 3-527-29590-9. [Google Scholar]
- Adeosun, J.T.; Lawal, A. Numerical and experimental studies of mixing characteristics in a T-junction microchannel using residence-time distribution. Chem. Eng. Sci. 2009, 64, 2422–2432. [Google Scholar] [CrossRef]
- Rinke, G.; Ewinger, A.; Kerschbaum, S.; Rinke, M. In situ Raman spectroscopy to monitor the hydrolysis of acetal in microreactors. Microfluid. Nanofluid. 2011, 10, 145–153. [Google Scholar] [CrossRef]
- Orsi, G.; Roudgar, M.; Brunazzi, E.; Galletti, C.; Mauri, R. Water–ethanol mixing in T-shaped microdevices. Chem. Eng. Sci. 2013, 95, 174–183. [Google Scholar] [CrossRef]
- Hessel, V.; Löwe, H.; Schönfeld, F. Micromixers—A review on passive and active mixing principles. Chem. Eng. Sci. 2005, 60, 2479–2501. [Google Scholar] [CrossRef]
- Aubin, J.; Ferrando, M.; Jiricny, V. Current methods for characterising mixing and flow in microchannels. Chem. Eng. Sci. 2010, 65, 2065–2093. [Google Scholar] [CrossRef]
- Deuerling, J.; Keck, S.; Moelyadi, I.; Repke, J.-U.; Rädle, M. In-Line Analysis of Diffusion Processes in Micro Channels by Long Distance Raman Photometric Measurement Technology-A Proof of Concept Study. Micromachines 2021, 12, 116. [Google Scholar] [CrossRef] [PubMed]
- Salmon, J.-B.; Ajdari, A.; Tabeling, P.; Servant, L.; Talaga, D.; Joanicot, M. In situ Raman imaging of interdiffusion in a microchannel. Appl. Phys. Lett. 2005, 86, 94106. [Google Scholar] [CrossRef] [Green Version]
- Dambrine, J.; Géraud, B.; Salmon, J.-B. Interdiffusion of liquids of different viscosities in a microchannel. New J. Phys. 2009, 11, 75015. [Google Scholar] [CrossRef]
- Gan, H.Y.; Lam, Y.C.; Nguyen, N.T.; Tam, K.C.; Yang, C. Efficient mixing of viscoelastic fluids in a microchannel at low Reynolds number. Microfluid Nanofluid 2006, 3, 101–108. [Google Scholar] [CrossRef]
- Sato, Y.; Irisawa, G.; Ishizuka, M.; Hishida, K.; Maeda, M. Visualization of convective mixing in microchannel by fluorescence imaging. Meas. Sci. Technol. 2002, 14, 114–121. [Google Scholar] [CrossRef]
- Campbell, K.; Groisman, A. Generation of complex concentration profiles in microchannels in a logarithmically small number of steps. Lab Chip 2007, 7, 264–272. [Google Scholar] [CrossRef] [PubMed]
- Liu, Y.Z.; Kim, B.J.; Sung, H.J. Two-fluid mixing in a microchannel. Int. J. Heat Fluid Flow 2004, 25, 986–995. [Google Scholar] [CrossRef]
- Hayashi, Y.; Puzenko, A.; Feldman, Y. Slow and fast dynamics in glycerol–water mixtures. J. Non-Cryst. Solids 2006, 352, 4696–4703. [Google Scholar] [CrossRef]
- Kübel-Heising, F.; Kunkel, S.; Medina, I.; Hien, A.; Schmitt, L.; Scholl, S.; Repke, J.-U.; Rädle, M. Near-Infrared Image Analysis as Tool for Monitoring Process Activities. ChemBioEng Rev. 2018, 5, 334–342. [Google Scholar] [CrossRef]
- Pilar Dorado, M.; Pinzi, S.; de Haro, A.; Font, R.; Garcia-Olmo, J. Visible and NIR Spectroscopy to assess biodiesel quality: Determination of alcohol and glycerol traces. Fuel 2011, 90, 2321–2325. [Google Scholar] [CrossRef] [Green Version]
- Hellesø, S.M.; Atten, P.; Berg, G.; Lundgaard, L.E. Experimental study of electrocoalescence of water drops in crude oil using near-infrared camera. Exp. Fluids 2015, 56, 613. [Google Scholar] [CrossRef]
- Medina, I.; Schmitt, L.; Kapoustina, V.; Scholl, S.; Rädle, M. Untersuchung von lokalen Schichtdickenverteilungen in Fluiden mithilfe der Nahinfrarot-Bildanalyse. Chem. Ing. Tech. 2019, 91, 1041–1048. [Google Scholar] [CrossRef]
- Lubnow, M.; Jeffries, J.B.; Dreier, T.; Schulz, C. Water film thickness imaging based on time-multiplexed near-infrared absorption. Opt. Express 2018, 26, 20902–20912. [Google Scholar] [CrossRef]
- Kakuta, N.; Yamashita, H.; Kawashima, D.; Kondo, K.; Arimoto, H.; Yamada, Y. Simultaneous imaging of temperature and concentration of ethanol–water mixtures in microchannel using near-infrared dual-wavelength absorption technique. Meas. Sci. Technol. 2016, 27, 115401. [Google Scholar] [CrossRef] [Green Version]
- Kakuta, N.; Fukuhara, Y.; Kondo, K.; Arimoto, H.; Yamada, Y. Temperature imaging of water in a microchannel using thermal sensitivity of near-infrared absorption. Lab Chip 2011, 11, 3479–3486. [Google Scholar] [CrossRef]
- Ayoub, M.; Abdullah, A.Z. Critical review on the current scenario and significance of crude glycerol resulting from biodiesel industry towards more sustainable renewable energy industry. Renew. Sustain. Energy Rev. 2012, 16, 2671–2686. [Google Scholar] [CrossRef]
- Segur, J.B.; Oberstar, H.E. Viscosity of Glycerol and Its Aqueous Solutions. Ind. Eng. Chem. 1951, 43, 2117–2120. [Google Scholar] [CrossRef]
- Adamenko, I.I.; Bulavin, L.A.; Ilyin, V.; Zelinsky, S.A.; Moroz, K.O. Anomalous behavior of glycerol–water solutions. J. Mol. Liq. 2006, 127, 90–92. [Google Scholar] [CrossRef]
- Shankar, P.N.; Kumar, M. Experimental determination of the kinematic viscosity of glycerol-water mixtures. Proc. R. Soc. Lond. A 1994, 444, 573–581. [Google Scholar] [CrossRef]
- Delgado, D.R.; Martínez, F.; Fakhree, M.A.A.; Jouyban, A. Volumetric properties of the glycerol formal + water cosolvent system and correlation with the Jouyban–Acree model. Phys. Chem. Liq. 2012, 50, 284–301. [Google Scholar] [CrossRef]
- Volk, A.; Kähler, C.J. Density model for aqueous glycerol solutions. Exp. Fluids 2018, 59, 2671. [Google Scholar] [CrossRef] [Green Version]
- Cheng, N.-S. Formula for the Viscosity of a Glycerol−Water Mixture. Ind. Eng. Chem. Res. 2008, 47, 3285–3288. [Google Scholar] [CrossRef]
- Kessler, R.W. (Ed.) Prozessanalytik: Strategien und Fallbeispiele aus der industriellen Praxis; Wiley-VCH: Weinheim, Germany, 2006; ISBN 3-527-31196-3. [Google Scholar]
- Kerr, P.H.; Fisher, E.M.; Buffington, M.L. Dome lighting for insect imaging under a microscope. Am. Entomol. 2008, 54, 198–200. [Google Scholar] [CrossRef] [Green Version]


| Viscosity (mPa s) | |||
|---|---|---|---|
| 20 °C | 30 °C | 40 °C | |
| 0.00 | 1.005 | 0.799 | 0.654 |
| 0.10 | 1.297 | 1.020 | 0.826 |
| 0.50 | 6.002 | 4.224 | 3.111 |
| 0.90 | 223.7 | 112.0 | 61.53 |
| 0.95 | 1414 | 597.9 | 282.4 |
| Temperature (°C) | Glycerol Mass Fraction 0–0.7 | Glycerol Mass Fraction 0.7–1 | ||
|---|---|---|---|---|
| 20 | 0.9677 | 0.9815 | ||
| 30 | 0.9704 | 0.9812 | ||
| 40 | 0.9729 | 0.9810 |
Publisher’s Note: MDPI stays neutral with regard to jurisdictional claims in published maps and institutional affiliations. |
© 2021 by the authors. Licensee MDPI, Basel, Switzerland. This article is an open access article distributed under the terms and conditions of the Creative Commons Attribution (CC BY) license (https://creativecommons.org/licenses/by/4.0/).
Share and Cite
Medina, I.; Deuerling, J.; Kumari, P.; Scholl, S.; Rädle, M. Visualization of Local Concentration and Viscosity Distribution during Glycerol-Water Mixing in a Y-Shape Minichannel: A Proof-of-Concept-Study. Micromachines 2021, 12, 940. https://doi.org/10.3390/mi12080940
Medina I, Deuerling J, Kumari P, Scholl S, Rädle M. Visualization of Local Concentration and Viscosity Distribution during Glycerol-Water Mixing in a Y-Shape Minichannel: A Proof-of-Concept-Study. Micromachines. 2021; 12(8):940. https://doi.org/10.3390/mi12080940
Chicago/Turabian StyleMedina, Isabel, Julian Deuerling, Pooja Kumari, Stephan Scholl, and Matthias Rädle. 2021. "Visualization of Local Concentration and Viscosity Distribution during Glycerol-Water Mixing in a Y-Shape Minichannel: A Proof-of-Concept-Study" Micromachines 12, no. 8: 940. https://doi.org/10.3390/mi12080940
APA StyleMedina, I., Deuerling, J., Kumari, P., Scholl, S., & Rädle, M. (2021). Visualization of Local Concentration and Viscosity Distribution during Glycerol-Water Mixing in a Y-Shape Minichannel: A Proof-of-Concept-Study. Micromachines, 12(8), 940. https://doi.org/10.3390/mi12080940