Article

Method for QCM Resonator Device Equivalent Circuit Parameter Extraction and Electrode Quality Assessment

1
School of Automation Engineering, University of Electronic Science and Technology of China, Chengdu 611731, China
2
School of Electrical Engineering and Information, Southwest Petroleum University, Chengdu 610599, China
3
Wuhan Hi-Trusty Electronics Co., LTD, Wuhan 432400, China
*
Author to whom correspondence should be addressed.
Micromachines 2021, 12(9), 1086; https://doi.org/10.3390/mi12091086
Submission received: 26 July 2021 / Revised: 6 September 2021 / Accepted: 6 September 2021 / Published: 9 September 2021

Abstract

:
Quartz crystal microbalance (QCM) resonators are used in a wide range of sensors. Current QCM resonators achieve a simultaneous measurement of multiple physical quantities by analyzing lumped-element equivalent parameters, which are obtained via the introduction of external devices. This introduction of external devices will probably increase measurement error. To realize the measurement of multiple physical quantities while eliminating the measurement error caused by external devices, this paper proposes a measurement method for the lumped-element equivalent parameters of QCM resonators without the need for extra external devices. Accordingly, a numerical method for solving nonlinear equations with fewer data points required and a higher accuracy was adopted. A standard crystal resonator parameter extraction experiment is described. The extracted parameters were consistent with the nominal parameters, which confirms the accuracy of this method. Furthermore, six QCM resonator device samples with different electrode diameters and materials were produced and used in the parameter measurement experiment. The linear relationship between the electrode material conductivity and motional resistance R1 is discussed. The ability of this method to characterize the electrode material and to detect the rust status of the electrode is also demonstrated. These abilities support the potential utility of the proposed method for an electrode quality assessment of piezoelectric devices.

Graphical Abstract

1. Introduction

Quartz crystal microbalances (QCM), as microelectromechanical devices, have been widely used in sensing applications, including humidity [1,2,3,4], liquid [5], and gas sensors [6]. Based on the adsorption effect of polymers, DNA, or proteins [7], QCM sensors have great application prospects in the field of biosensors, e.g., quality inspection in the biopharmaceutical industry [8] and applications in artificial olfaction [9], among others. Biosensors are primarily used in a liquid environment, and QCM loading has an inhomogeneous structure [10]. Under these conditions, QCM has an effect not only on the mass [11] but also on the viscosity [12]. This phenomenon is manifested in the complexity behind the frequency shift interpretation when QCM is used in liquid applications [11]. Commercial QCM sensors only provide limited information such as resonance frequency; however, the equivalent parameters provide a higher observation dimension, which is convenient for dissociating multiphysical coupling effects, realizing multiphysical sensors [13], and improving sensitivity [14,15,16]. Additionally, the equivalent parameters can be used to evaluate the performance of devices. Therefore, it is necessary to extract equivalent parameters for the purpose of aligning the sensor design with their practical applications [17].
Moreover, QCM equivalent circuit parameter extraction has applications in other piezoelectric resonators. It was reported that QCM resonators, AlN piezoelectric resonators [18,19], thin-film microelectromechanical system (MEMS) resonators [20], and piezoceramic transducers [21] have similar equivalent circuit models. Therefore, the equivalent circuit parameter extraction method presented here can also be used as a potential approach to the characterization of piezoelectric resonators.
QCM sensors can be described with a Mason equivalent circuit [22,23]. After several mathematical simplifications, the equivalent circuit can be described as a Butterworth–Van Dyke (BVD) equivalent circuit [24]. Many researchers have contributed to the QCM equivalent parameter measurement of BVD equivalent circuits. Casteleiro-Roca et al. [25] obtained the equivalent parameters by a series inductance and resistance. Liu et al. [26] measured the equivalent parameters by a series standard capacitance. Due to the connection of external electronic components, optimization and/or tuning is required in both of the above methods. Consequently, in situ equivalent parameter measurement methods without the need for external devices were developed. Yao et al. [14] measured the impedance of QCM sensors with an impedance analyzer and determined the equivalent parameters by fitting. Gugliandolo et al. [17] extracted the equivalent parameters via scattering (S-) parameter measurements coupled with a Lorentzian fitting; however, this fitting method requires more data points, which increases the probability of noise interference.
This paper presents a method to measure the equivalent parameters based on the phase–frequency curve of insertion loss (S21) of the resonator device. This method adopts an analytical solution instead of fitting. It extracts only four points of the phase–frequency curve, which are near the resonance or antiresonance frequency. The slope of a phase–frequency curve is greater when the frequency point is near the resonance or antiresonance frequency and is not sensitive to phase jitter caused by noise. Therefore, this method has a higher signal-to-noise ratio (SNR) than fitting-based methods. The combination of higher SNR and reliance on fewer data points increases the accuracy of the parameter measurement, which is reflected by the small root mean square error (RMSE) value between the measurement curve and the inversion curve.
The accuracy of the proposed method was verified via a parameter measurement of a standard crystal. Additionally, QCM resonator devices with different electrode diameters and materials were analyzed to demonstrate the ability of this method to determine the electrode radius and to evaluate the electrode rust status. Finally, the capability of this method to evaluate the electrical performance of a resonator is demonstrated.

2. Methodology and Simulation Validation
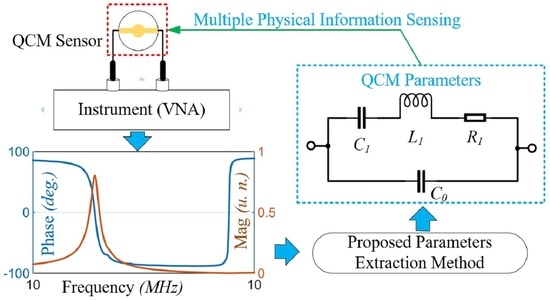
2.1. Methodology

The derivation of the proposed method is provided below and then verified by simulation.
The equivalent circuit model of the QCM device is shown in Figure 1a and is referred to as the Butterworth–Van Dyke (BVD) model [27]. It contains four parameters: static capacitance C0, motional capacitance C1, motional inductance L1, and motional resistance R1. The schematic diagram of the measurement circuit is shown in Figure 1b, where Zr is the internal resistance, Zm is the measurement resistance, and ZL is the load impedance. In this case, ZL is the impedance of the network in Figure 1a.
The ratio of the vector voltage on the measuring resistance to the vector voltage of the AC signal source is given by the following:
G f = U m U = Z m Z L + Z r + Z m
where Um is the vector voltage on the measurement resistance and U is the vector voltage of the AC signal source. Then, the phase of the forward transmission coefficient S21 is as follows [26]:
Phase S 21 = 180 π atan imag G f real G f
The magnitude of the forward transmission coefficient is:
Mag S 21 = abs G f
The zero-phase frequency of the network in Figure 1a is [26]:
ω ± = 1 L 1 C 1 + 1 2 L 1 C 0 R 1 2 2 L 1 2 ± 1 L 1 C 1 + 1 2 L 1 C 0 R 1 2 2 L 1 2 2 1 L 1 2 C 1 2 1 + C 1 C 0
The resonance angular frequency is:
ω r = 1 L 1 C 1 + 1 2 L 1 C 0 R 1 2 2 L 1 2 1 L 1 C 1 + 1 2 L 1 C 0 R 1 2 2 L 1 2 2 1 L 1 2 C 1 2 1 + C 1 C 0
The antiresonance angular frequency is:
ω a = 1 L 1 C 1 + 1 2 L 1 C 0 R 1 2 2 L 1 2 + 1 L 1 C 1 + 1 2 L 1 C 0 R 1 2 2 L 1 2 2 1 L 1 2 C 1 2 1 + C 1 C 0
It could be found that the resonance angular frequency ωr and the antiresonance angular frequency ωa have the relationship given by the following:
ω a 2 + ω r 2 2 = 1 L 1 C 1 + 1 2 L 1 C 0 R 1 2 2 L 1 2
ω r 2 ω a 2 = 1 L 1 2 C 1 2 1 + C 1 C 0
It could then be found that Equations (7) and (8) contain equivalent parameters. Therefore, a method exists for the retrieval of BVD parameters from the two frequency points ωr and ωa. However, the four unknown parameters correspond to two input frequencies, and the equations have innumerable solutions. Consequently, two other equations with BVD parameters as independent variables needed to be constructed. The derivative equations of the phase–frequency curve at the resonance frequency and the antiresonance frequency were, thus, added to obtain four nonlinear quaternion equations.
In practice, the derivative can be approximated as the slope of the curve. Therefore, the two additional equations required were constructed as follows:
Δ 1 = Phase S 21 f f = f r
Δ 2 = Phase S 21 f f = f a
where fr is resonance frequency and fr = ωr/2; fa is antiresonance frequency and fa = ωa/2; Δ1 and Δ2 are the slopes of the phase–frequency curve at the resonance and antiresonance frequency, respectively.
Due to the automatic impedance matching of the instrument, the internal resistance Zr changes with changes in the load resistance ZL. Therefore, the internal resistance Zr must be corrected. In the proposed method, the maximum value of the magnitude-frequency curve was selected to correct Zr [28]. The additional equation is:
Max Mag S 21 = abs G f s
where Max[Mag(S21)] is the maximum value of the measured magnitude–frequency curve and fs is the frequency corresponding to the maximum point.
Thus, the nonlinear equations are given as follows [28]:
ω a 2 + ω r 2 2 = 1 L 1 C 1 + 1 2 L 1 C 0 R 1 2 2 L 1 2 ω r 2 ω a 2 = 1 L 1 2 C 1 2 1 + C 1 C 0 Δ 1 = Phase S 21 f f = f r Δ 2 = Phase S 21 f f = f a max Mag S 21 = abs G f s
In Formula (12), the feature parameters extracted from the measurement curve are presented on the left and the parameters to be calculated are shown on the right. Similar to the finite element method, the four-dimensional space, including R1, L1, C1, and C0, was constructed first. Subsequently, the four parameters were solved by the variable step search method [29].

2.2. Validation by ADS Simulation

Advanced Design System (ADS, Keysight Technologies Ltd., Santa Rosa, CA, USA) software was used for the simulation of the BVD model, and the frequency response of the circuit was obtained via the S-parameter simulation module. The start frequency of the S-parameters was 316.9 MHz, the stop frequency was 317.5 MHz, and the frequency spacing of scanning was 1 Hz. The XTAL1 module was used to characterize the QCM resonator, and Term 1 and Term 2 characterized the internal resistance and measurement resistance, respectively, both of which were 50 Ω. The simulation schematic and its generated phase–frequency curve are shown in Figure 2. The simulation parameters were derived from an actual resonator [30] and were R1 = 14.00 Ω, L1 = 75.00 uH, C1 = 3.36 fF, and C0 = 3.00 pF.
As shown in Figure 2a, the internal resistance Zr (Term 1) and measurement resistance Zm (Term 2) were 50 Ω. As the internal resistance was invariable in the simulation model, only the phase–frequency curve was needed to calculate the equivalent parameters. The equivalent parameter calculation steps were as follows:
Step 1, figure acquisition. The phase–frequency curve for the Advanced Design System (ADS) simulation shown in Figure 2b was obtained.
Step 2, feature parameter extraction. Feature parameters were extracted from the phase–frequency curve. In Figure 2b, the two points closest to the resonance frequency were m1 (317,045,487 Hz, 17.55 udeg.) and m2 (317,045,488 Hz, −452.36 mdeg.), the two points closest to the antiresonance frequency were m3 (317,220,493 Hz, −256.17 udeg.) and m4 (317,220,494 Hz, 3.36 mdeg.).
Step 3,input parameter calculation. The resonance frequency and slope were calculated from points m1 and m2: the resonance frequency was fr = 317045487.03 Hz and the slope was Δ1 = −4.69 × 10⁻⁴ deg./Hz. The antiresonance frequency and slope were calculated from points m3 and m4: the antiresonance frequency was fa = 317220493.07 Hz and the slope was Δ2 = 3.62 × 10⁻² deg./Hz.
Step 4,solution to the nonlinear equations. The input parameter values (fr, fa, Δ1, Δ2, Zr, and Zm) were substituted into the nonlinear equations in Formula (12) to solve for the output parameters.
Step 5, results. The output parameters calculated according to the proposed method were R1 = 14.00 Ω, L1 = 74.99 uH, C1 = 3.36 fF, and C0 = 2.99 pF. Compared with the setting parameters, the maximum error was 0.0067%.
The simulation results verified the high accuracy of the equivalent parameters measured by the proposed method. In Section 3, the accuracy of this method was verified using a standard crystal experiment. The potential of this method to evaluate the crystal properties was demonstrated by the experimental results.

3. Experimental Platform and Materials

To validate our simulation results, an experimental platform was set up and included a vector network analyzer (VNA), a conditioning circuit, and a software algorithm derived from the proposed method.
A total of seven resonator devices—one standard crystal resonator device and six QCM resonator devices—were used in the testing. All of the QCM resonator devices were manufactured by Wuhan Hi-Trusty Electronics Co., Ltd. Three of them differed by their electrode radius diameters, and the rest varied in their electrode materials.

3.1. Experimental Platform

A block diagram of the experiment is shown in Figure 3. The resonator was connected to the vector network analyzer (VNA) through the conditioning circuit and fixture. The device communicates with the host computer by USB and transmits the measured S-parameter data to the computer. The measured data were processed by the proposed method, and the equivalent parameters were calculated.

3.2. Material

The testing materials included one standard crystal resonator device and six QCM resonator devices.

3.2.1. Standard Crystal Resonator Device

In order to verify the accuracy of this method, the standard resonator parameters were measured by the proposed method and were compared with those measured by the supplier using large-scale instruments.
The standard resonator was provided by Hebei BOWEI Integrated Circuits Co., Ltd. (Shijiazhuang, China). The parameters that were measured by the producer using professional equipment were R1 = 69.78 Ω, L1 = 1407.29 mH, C1 = 0.18 pF, and C0 = 2.11 pF.

3.2.2. QCM Resonator Devices with Different Electrode Diameters and Materials

As a microelectromechanical device, the electrode shape or material of a QCM resonator greatly affects its electrical properties. Thus, the relationship between the electrode radius, the electrode material, and equivalent parameters was investigated. The equivalent parameters of QCM resonators with three different electrode diameters and three types of electrode materials were measured, and the relationships between static capacitance and the electrode diameter and between motional resistance and the electrode material were analyzed. The experimental results demonstrate the potential of this method in the evaluation of QCM properties.
Figure 4a shows the three QCM resonator devices with different electrode diameters. Their diameters were Φ = 5 mm, Φ = 4 mm, and Φ = 3 mm, and the electrode material of all three was silver.
Figure 4b shows the three QCM resonator devices with different electrode materials. The electrodes were composed of gold (Au), silver (Ag), and aluminum (Al), and all had a diameter of Φ = 4 mm. In industrial applications, the aging of electrodes due to oxidation is a common phenomenon in QCM devices and occurs most commonly in silver electrodes. As such, a QCM device with an aging silver electrode, including some rusting, was chosen for the experiments, thereby allowing for the potential of the proposed method for the evaluation of electrode aging to be determined.

4. Results and Discussion

The experimental results are divided into three parts: (1) the measurement of the standard resonator device parameters, (2) the equivalent parameter measurement of the QCM resonator devices with different electrode diameters, and (3) the equivalent parameter measurement of the QCM resonator devices with different electrode materials.
This study also discusses the quantitative characterization of a QCM resonator through: (1) the linear relationship between the electrode area, the static capacitance C0 and motional capacitance C1, and (2) the linear relationship between electrode material conductivity and motional resistance R1.
Based on this discussion, the ability of the proposed method to detect electrode rust status was also demonstrated.

4.1. Measurement of Standard Resonator Device Parameters

The phase–frequency curve and magnitude–frequency curve measured by VNA are shown in Figure 5a,b.
Through the proposed method, the equivalent circuit parameters of this standard resonator were found to be R1 = 70.59 Ω, L1 = 1447.23 mH, C1 = 0.17 pF, and C0 = 2.87 pF. A comparison between the parameters measured by this method and those provided by the supplier is presented in Table 1.
The parameters measured by this method were basically consistent with those measured by a supplier’s large-scale instruments, and the discrepancies were mainly due to C0. This was due to the difference in fixtures between the supplier’s measurement system and our measurement system [26]. When C0 was removed, the maximum error of the other parameters was less than 5%.

4.2. Equivalent Parameter Measurement of QCM Resonator Devices with Different Electrode Diameters

The phase–frequency and magnitude–frequency curves of QCM devices with different electrode diameters are presented in Figure 6 (solid line).
The dotted lines show the inversed curves of the equivalent circuit parameters presented in Table 2. The inversion curves were obtained by substituting the parameters presented in Table 2 into Formulas (2) and (3). It can be seen that the measurement curve and the inversion curve were highly consistent, which indicates the accuracy of the measurement parameters. The RMSE values between the measured and inversion phase–frequency curves for devices with 3 mm, 4 mm, and 5 mm diameter electrodes were 0.52, 0.31, and 0.16, respectively. The RMSE values were low, which further validates the accuracy of the measured parameters.
Through a further analysis of the data in Table 2, it was found that the capacitance diameter exerted an influence on all four parameters but had little influence on the capacitance ratio r, defined as r = C0/C1 [27]. This was because both C0 and C1 were positively proportional to the electrode area [27]. The relationship between the electrode area and both C0 and C1 can be seen in Figure 7: C0 and C1 had a highly linear relationship with the electrode area, which verifies the accuracy of the calculation parameters. Additionally, the feasibility of this method for the detection of the electrode area is shown.

4.3. Equivalent Parameter Measurement of QCM Resonator Devices with Different Electrode Materials

The phase–frequency curve and magnitude–frequency curve of QCM devices with different electrode materials are shown in Figure 8 (solid line). The materials tested were Au, Ag, and Al.
The equivalent parameters of QCM devices with different electrode materials were measured by the proposed method, as shown in Table 3.
The dotted lines show the inversed curves of the equivalent circuit parameters presented in Table 3. The RMSE values between the measured and inversion phase–frequency curves for devices with Au, Ag, and Al electrodes were 1.08, 0.57, and 0.81, respectively.
It can be found from Figure 8a that the measured phase–frequency curve of the Al electrode had a large jitter at 10.03 MHz. This jitter was caused by the inevitable noise of the measuring environment. The black dotted box shown in Figure 8a is an enlarged view of the jitter of the measured curve. The blue solid line is the curve as measured by the instrument. The red dotted line is the curve of parameter inversion. It can be seen that the dotted line was smoother; if the curve was fitted using these unsmooth data points, then the fitting error would increase.
Comparatively, the proposed method only used four points from the phase–frequency curve rather than all of them—as required for the fitting-based method. These four points were close to the resonance and antiresonance frequency. The slope of the curve was larger at the resonance and antiresonance frequency (as shown in Figure 8a). Thus, the phase jitter had a smaller effect on the smoothness of the curve. Consequently, the phase–frequency curve inverted by the parameters measured by the proposed method was highly consistent with the measured curve, except for in the area of jitter.
The above experiments demonstrated the advantage of the proposed method by reducing the influence of the phase jitter on the parameter measurement. This could explain why the RMSE of the curves inverted by the parameters measured by the proposed method was as low as 0.81.
Through a further analysis of the data in Table 3, the differences between the C0 values for the three devices with different electrode materials were found to be minimal, with a standard deviation of 6.24%. This was likely due to the consistent electrode diameter for the three devices (Φ = 4 mm).
It can be seen from Table 3 that the greatest influence of electrode material was on the motional resistance R1. This may be due to the different conductivity of the electrode materials. The conductivity of the electrode materials and their motional resistance R1 are presented in Table 4.
To demonstrate the relationship between the electrode material conductivity and motional resistance R1, the data from Table 4 were plotted in Figure 9. The conductivity of the electrode material had a linear relationship with motional resistance; however, the device with a rusty silver electrode (blue dot) did not exhibit this same relationship.
The above experiments demonstrated that the proposed method could be used to evaluate the rust status of QCM resonator electrodes, which suggests a potential application for these devices in other fields.

5. Conclusions

A method for the extraction of the equivalent parameters of the BVD model of QCM resonator devices was presented in this paper. The proposed method requires neither external electronic components nor optimization and/or tuning. Moreover, the numerical method of nonlinear equations was adopted in place of the fitting method. Special feature points were selected and reduced the influence of the phase jitter noise on the measurement of parameters, which resulted in RMSE values as small as 0.16 between the curve inverted from the parameters and the actual measurement curve. Compared with the supplier’s instrument-based testing results, the measuring error was less than 5%. The typical tolerance of precision commercial inductors was ±5% [25]. In 2017, Liu’s method utilized a connected external capacitor to reduce the measuring error to ±4.5% [26]. By removing the need to connect external devices, the error of the proposed method was further reduced to ±2.5%.
Some potential applications of this method were given. QCM resonator devices with three electrode diameters and three types of electrode material were manufactured. The linear relationship between the static capacitance and the electrode area, and the linear relationship between the conductivity of the electrode material and the motional resistance, were demonstrated via parameter measurement experiments. We also demonstrated the potential of this method to detect electrode rusting.
This method was suitable for the BVD model and has the potential to be applied to other piezoelectric resonators, such as AlN piezoelectric resonators, thin-film MEMS resonators, and piezoceramic transducers. Therefore, our study provides a potential approach for the quality assessment of other piezoceramic resonators.
For the convenience of communication, we provide the URL of the program used to calculate the parameters from the curve measured by VNA. URL: https://pan.baidu.com/s/1KrLw3-Kgips6ct04gaA76g. Password is vtky.

Author Contributions

Conceptualization, D.L.; methodology, D.L.; software, D.L. and Z.T.; investigation, Q.C. and Y.Y.; resources, X.W.; data curation, H.L.; writing—original draft preparation, D.L.; writing—review and editing, X.X. and Z.T.; project administration, D.L.; funding acquisition, X.X. and D.L. All authors have read and agreed to the published version of the manuscript.

Funding

This work was supported by the National Natural Science Foundation of China (grant no. 61701085), the Department of Science and Technology of Sichuan Province (2019JDZH0020), and the Key Laboratory of Nondestructive Testing, Fujian Polytechnic Normal University (S2-KF2013).

Data Availability Statement

Data available in a publicly accessible repository that does not issue DOIs. Publicly available datasets were analyzed in this study. This data can be found here: https://pan.baidu.com/s/1KrLw3-Kgips6ct04gaA76g. Password is vtky. The other data presented in this study are available on request from the corresponding author.

Conflicts of Interest

The authors declare no conflict of interest.

References

  1. Yao, Y.; Zhang, H.; Sun, J.; Ma, W.Y.; Li, L.; Li, W.Z.; Du, J. Novel QCM humidity sensors using stacked black phosphorus nanosheets as sensing film. Sens. Actuators B Chem. 2017, 244, 259–264. [Google Scholar] [CrossRef]
  2. Hussain, M.; Kotova, K.; Lieberzeit, P.A. Molecularly imprinted polymer nanoparticles for formaldehyde sensing with QCM. Sensors 2016, 16, 9. [Google Scholar] [CrossRef] [Green Version]
  3. Chen, Q.; Feng, N.B.; Huang, X.H.; Yao, Y.; Jin, Y.R.; Pan, W.; Liu, D. Humidity-sensing properties of a BiOCl-coated quartz crystal microbalance. ACS Omega 2020, 5, 18818–18825. [Google Scholar] [CrossRef]
  4. Chen, Q.; Yao, Y.; Huang, X.H.; Liu, D.; Mao, K.L. Simulation analysis and experimental verification for sensitivity of IDE-QCM humidity sensors. Sens. Actuators B Chem. 2021, 341, 129992. [Google Scholar] [CrossRef]
  5. Esmeryan, K.D.; Stoimenov, N.I. Studying the bulk and contour ice nucleation of water droplets via quartz crystal microbalances. Micromachines 2021, 12, 463. [Google Scholar] [CrossRef] [PubMed]
  6. Tchalala, M.R.; Bhatt, P.M.; Chappanda, K.N.; Tavares, S.R.; Adil, K.; Belmabkhout, Y.; Shkurenko, A.; Cadiau, A.; Heymans, N.; De Weireld, G.; et al. Fluorinated MOF platform for selective removal and sensing of SO2 from flue gas and air. Nat. Commun. 2019, 10, 1328. [Google Scholar] [CrossRef] [PubMed] [Green Version]
  7. Chen, Q.; Xu, S.M.; Liu, Q.X.; Masliyah, J.; Xu, Z.H. QCM-D study of nanoparticle interactions. Adv. Colloid Interface Sci. 2016, 233, 94–114. [Google Scholar] [CrossRef] [PubMed] [Green Version]
  8. Migon, D.; Wasilewski, T.; Suchy, D. Application of QCM in Peptide and Protein-Based Drug Product Development. Molecules 2020, 25, 3950. [Google Scholar] [CrossRef] [PubMed]
  9. Wasilewski, T.; Szulczynski, B.; Wojciechowski, M.; Kamysz, W.; Gebicki, J. Determination of long-chain aldehydes using a novel quartz crystal microbalance sensor based on a biomimetic peptide. Microchem. J. 2020, 154, 104509. [Google Scholar] [CrossRef]
  10. Oseev, A.; Mukhin, N.; Elie-Caille, C.; Boireau, W.; Lucklum, R.; Lecompte, T.; Remy-Martin, F.; Manceau, J.-F.; Chollet, F.; Leblois, T. Topology Challenge for the Assessment of Living Cell Deposits with Shear Bulk Acoustic Biosensor. Nanomaterials 2020, 10, 2079. [Google Scholar] [CrossRef]
  11. Mukhin, N.; Lucklum, R. QCM based sensor for detecting volumetric properties of liquids. Curr. Appl. Phys. 2019, 19, 679–682. [Google Scholar] [CrossRef]
  12. Tan, F.; Qiu, D.Y.; Guo, L.P.; Ye, P.; Zeng, H.; Jiang, J.; Tang, Y.; Zhang, Y.C. Separate density and viscosity measurements of unknown liquid using quartz crystal microbalance. Aip Adv. 2016, 6, 095313. [Google Scholar] [CrossRef] [Green Version]
  13. Bai, Q.S.; Huang, X.H.; Liu, D. A Novel Voltage Controlled Temperature Compensated Crystal Oscillator for Eliminating the Trim Effect. In Proceedings of the IEEE International Frequency Control Symposium, New Orleans, LA, USA, 9–12 May 2016; pp. 115–117. [Google Scholar]
  14. Yao, Y.; Zhang, H.; Huang, X.H. Enhanced sensitivity of quartz crystal proximity sensors using an asymmetrical electrodes configuration. Sens. Actuators A Phys. 2017, 258, 95–100. [Google Scholar] [CrossRef]
  15. Toledo, J.; Ruiz-Díez, V.; Bertke, M.; Suryo-Wasisto, H.; Peiner, E.; Sánchez-Rojas, J.L. Piezoelectric MEMS resonators for cigarette particle detection. Micromachines 2019, 10, 145. [Google Scholar] [CrossRef] [PubMed] [Green Version]
  16. Yang, J.; Zhang, M.; He, Y.R.; Su, Y.; Han, G.W.; Si, C.W.; Ning, J.; Yang, F.H.; Wang, X.D. A resonant Z-Axis aluminum nitride thin-film piezoelectric MEMS accelerometer. Micromachines 2019, 10, 589. [Google Scholar] [CrossRef] [Green Version]
  17. Gugliandolo, G.; Marinkovic, Z.; Campobello, G.; Crupi, G.; Donato, N. On the performance evaluation of commercial SAW resonators by means of a direct and reliable equivalent-circuit extraction. Micromachines 2021, 12, 303. [Google Scholar] [CrossRef] [PubMed]
  18. Sun, C.; Soon, B.W.; Zhu, Y.; Wang, N.; Loke, S.P.H.; Mu, X.; Tao, J.; Gu, A.Y. Methods for improving electromechanical coupling coefficient in two dimensional electric field excited AlN Lamb wave resonators. Appl. Phys. Lett. 2015, 106, 253502. [Google Scholar] [CrossRef]
  19. Wang, Y.; Goh, W.L.; Chai, K.T.C.; Mu, X.; Hong, Y.; Kropelnicki, P.; Je, M. Parasitic analysis and pi-type Butterworth-Van Dyke model for complementary-metal-oxide-semiconductor Lamb wave resonator with accurate two-port Y-parameter characterizations. Rev. Sci. Instrum. 2016, 87, 045004. [Google Scholar] [CrossRef]
  20. Moradian, S.; Akhkandi, P.; Huang, J.Y.; Gong, X.; Abdolvand, R. A Battery-less wireless respiratory sensor using micro-machined thin-film piezoelectric resonators. Micromachines 2021, 12, 363. [Google Scholar] [CrossRef]
  21. Kluk, P.; Milewski, A. Piezoceramic transducers selection method for high power ultrasonic devices. Acta Phys. Pol. A 2015, 127, 719–722. [Google Scholar] [CrossRef]
  22. Nakamoto, T.; Moriizumi, T.; Takamichi, N.; Toyosaka, M. A Theory of a quartz crystal microbalance based upon a mason equivalent circuit. Jpn. J. Appl. Phys. 1990, 29, 963–969. [Google Scholar] [CrossRef]
  23. Aleixandre, M.; Nakamoto, T. Study of Room Temperature Ionic Liquids as Gas Sensing Materials in Quartz Crystal Microbalances. Sensors 2020, 20, 4026. [Google Scholar] [CrossRef] [PubMed]
  24. Na Songkhla, S.; Nakamoto, T. Interpretation of Quartz Crystal Microbalance Behavior with Viscous Film Using a Mason Equivalent Circuit. Chemosensors 2021, 9, 9. [Google Scholar] [CrossRef]
  25. Casteleiro-Roca, J.L.; Calvo-Rolle, J.L.; Meizoso-Lopez, M.C.; Pinon-Pazos, A.; Rodriguez-Gomez, B.A. New approach for the QCM sensors characterization. Sens. Actuators A Phys. 2014, 207, 1–9. [Google Scholar] [CrossRef]
  26. Liu, D.; Huang, X.; Hu, J.; Tang, Y.; Wang, Y. Measurement of quartz crystal unit parameters based on the precise derivation of zero phase frequency. Electron. Lett. 2017, 53, 2799. [Google Scholar] [CrossRef]
  27. Bottom, V.E. Introduce to Crystal Unite Design; Van Nostrand Reinhold Company: New York, NY, USA, 1987; pp. 82–167. [Google Scholar]
  28. Liu, D.; Yan, Y.; Xiao, X.T.; Gao, B.; Tian, G.Y. A Method for Measuring the Equivalent Electrical Parameters and Resonant Frequency of Piezoelectric Resonators. China Patent CN201811393865.3, 21 November 2018. (In Chinese). [Google Scholar]
  29. Liu, D.; Huang, X.H.; Tang, Y.L.; Wang, Y. Measurement of Quartz Crystal Resonator Parameters Based on the Precise Derivation of Zero Phase Frequency. J. Univ. Electron. Sci. Technol. China 2018, 47, 545–549. [Google Scholar]
  30. Huang, X.H.; Wang, Y.; Fu, W. Optimization and realization of a 315-MHz low-phase-noise voltage-controlled SAW oscillator. IEEE Trans. Circuits Syst. II Express Briefs 2012, 59, 16–19. [Google Scholar] [CrossRef]
Figure 1. Schematic diagrams of the equivalent circuit of the QCM sensor and the measuring circuit: (a) Butterworth–Van Dyke (BVD) equivalent circuit model of the QCM sensor; (b) vector network analyzer (VNA) measuring circuit.
Micromachines 12 01086 g001
Figure 2. Simulation schematic diagram and result: (a) schematic diagram; (b) phase–frequency curve of quartz crystal ADS simulation.
Micromachines 12 01086 g002
Figure 3. Schematic diagram of the experiment.
Micromachines 12 01086 g003
Figure 4. QCM resonator devices with different electrode diameters or materials: (a) QCM resonator devices with different electrode diameters; (b) QCM resonator devices with different electrode materials.
Micromachines 12 01086 g004
Figure 5. Measured curve and inversion curve of standard resonator: (a) phase–frequency curve; (b) magnitude–frequency curve.
Micromachines 12 01086 g005
Figure 6. Measured curve and inversion curve of QCM resonator devices with different electrode diameters: (a) Phase-frequency curve; (b) Magnitude-frequency curve.
Micromachines 12 01086 g006
Figure 7. The linear relationship between electrode area and both C0 and C1: (a) S vs. C0; (b) S vs. C1.
Micromachines 12 01086 g007
Figure 8. Measured curve and inversion curve of QCM resonator devices with different electrode materials: (a) phase–frequency curve; (b) magnitude–frequency curve.
Micromachines 12 01086 g008
Figure 9. The linear relationship between electrode material conductivity and motional resistance R1.
Micromachines 12 01086 g009
Table 1. Comparison between the parameters measured by the proposed method and those provided by the supplier.
ParametersProposed MethodSupplier Measurement
R1(Ω)70.5969.78
L1 (mH)1447.231407.29
C1 (pF)0.170.18
C0 (pF)2.872.11
Table 2. Equivalent parameters of QCM resonator devices with different electrode diameters.
Φ (mm)345
R1 (Ω)12.427.876.63
L1 (mH)25.7715.1010.22
C1 (pF)9.8616.8224.86
C0 (pF)2.313.715.69
r4.294.534.36
Table 3. Equivalent parameters of QCM resonator devices with different electrode materials.
Electrode MaterialAuAgAl
R1 (Ω)15.0017.7018.33
L1 (mH)15.3115.6116.10
C1 (pF)16.6716.2515.64
C0 (pF)3.603.573.69
Table 4. Conductivity of the electrode materials and their motional resistance.
Electrode MaterialAgAuAlAg (Rusty)
R1 (Ω)7.8715.0018.3317.70
Conductivity (MS/m)62.5041.0035.3462.50
Publisher’s Note: MDPI stays neutral with regard to jurisdictional claims in published maps and institutional affiliations.

