3.1. Designing Microfluidic Devices for Supramolecular Chemical Signal Generation
In microchips with contacting reacting flows, the reaction starts immediately after the junction of the input channels [
53]. To avoid an immediate start of a chemical reaction, and add the on/off capabilities to our microfluidic devices, we separated reacting flows by a varied central flow of solvent by using devices with three inputs.
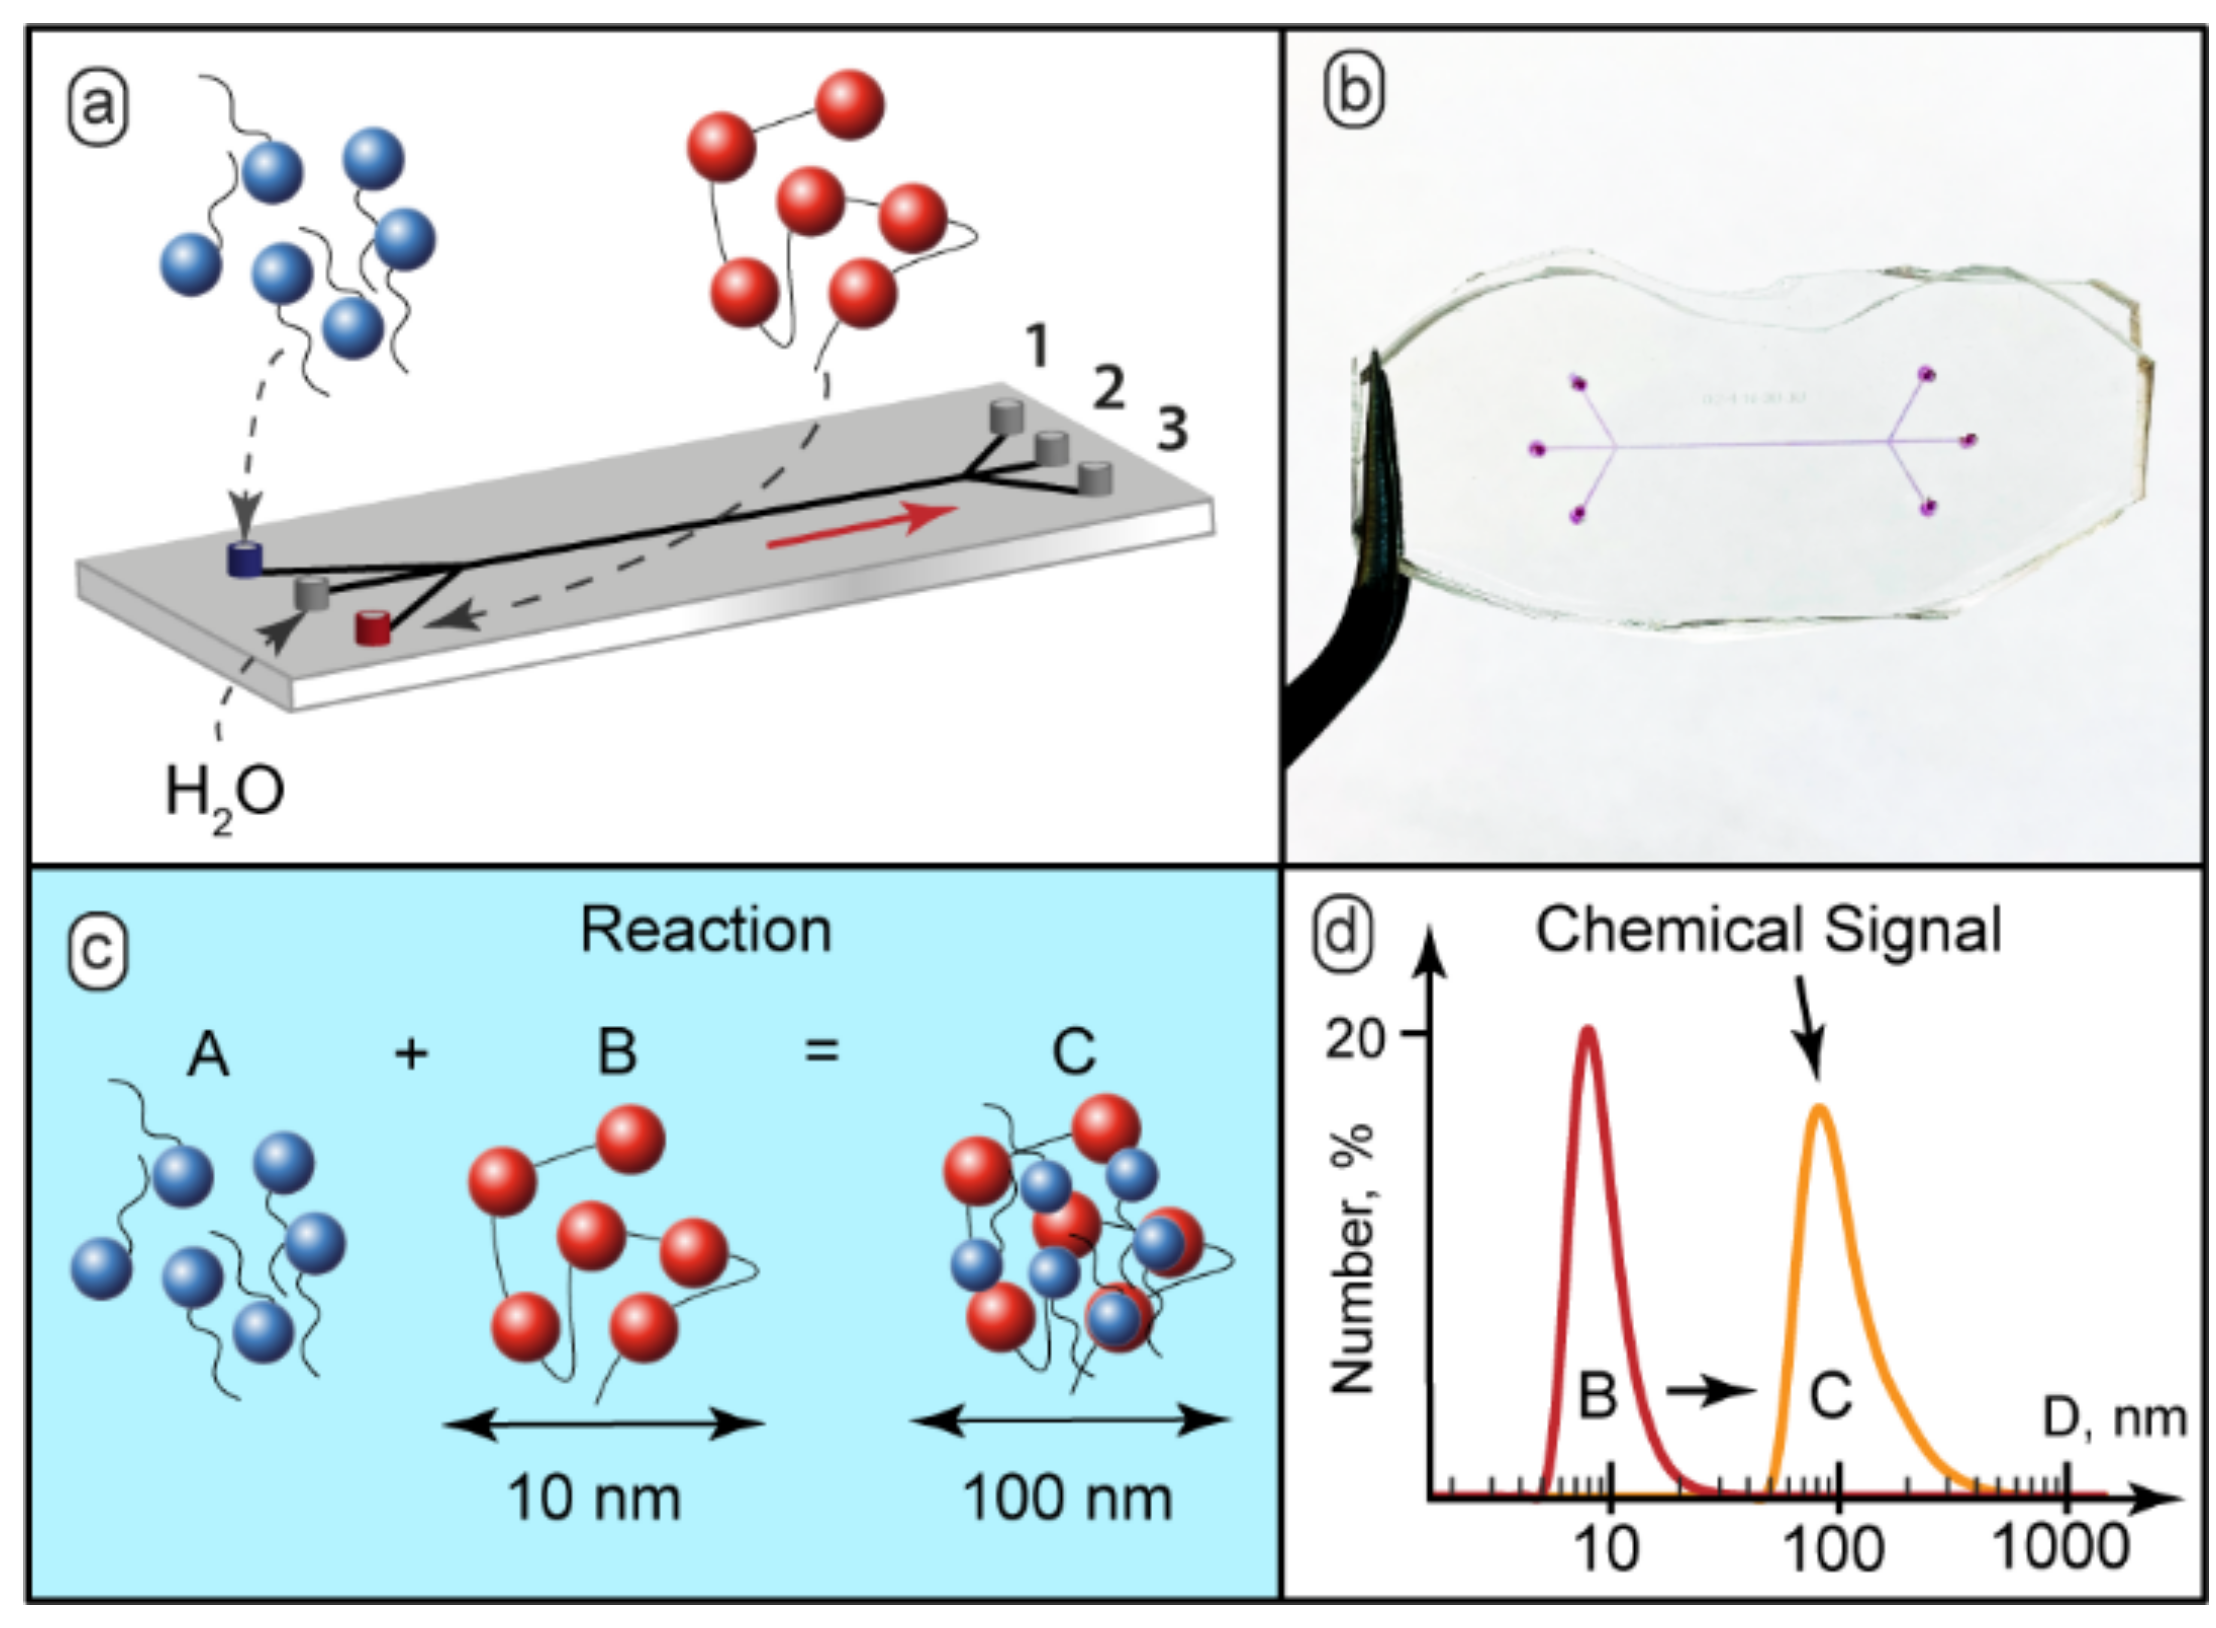
Figure 1a demonstrates the schematic diagram of such a microfluidic device.
Figure 1b shows the microfluidic chip prototype fabricated for the experiments. The microchannels were filled with dye for better visualization. The widths of all the channels were 200–300 µm. The length of the main channel was 15 mm. In the experiments, we also used 100 mm long chips. Variable lengths allowed convenient control of the residence time of the reagents in the main channel.
The complexation scenario of ionic polyelectrolytes with oppositely charged surfactants assumes formation of complexes with surfactant ions bound electrostatically to macromolecular sites [
28] (
Figure 1c). Bound surfactant ions reduce solubility of polyelectrolyte macromolecules, so they tend to organize into larger aggregates and, finally, precipitate [
29].
The behavior of the PDADMAC-SDS system in macroscopic conditions was characterized by DLS. The DLS analysis revealed that the hydrodynamic diameter of individual polyelectrolyte macromolecules in the presence of 50 mmol KCl, as a background electrolyte, was about 10–15 nm (
Figure 1d). The solutions with the SDS-to-PDADMAC molar ratio of 0.1–0.5 became turbid and contained particles with the hydrodynamic diameter of 100–150 nm (
Figure 1d). With the SDS-to-PDADMAC molar ratio above 0.5, precipitates formed and the resulting transparent solution contained no nanoscale or sub-microscale particles.
For further microfluidic experiments, therefore, we used 6.1 × 10⁻³ mol/L PDADMAC solution and 1.2 × 10⁻³ mol/L SDS solution to provide a surfactant-to-polymer molar ratio of 0.2, which did not lead to precipitation in bulk.
The detected 100–150 nm particles were supposed to be aggregates of macromolecules that contained bound surfactant ions. DLS is sensitive to these aggregates and provided reliable detection results for concentrations of the reagents in an order of magnitude lower than the initial ones (6.1 × 10⁻⁴ mol/L). The size of aggregates gradually reduced with dilution (to 70–100 nm) but was still clearly different from the size of initial macromolecules.
Aggregated macromolecules represent a convenient chemical signal. This signal is easy to detect, even at low concentrations of reacting species. The size of the aggregates differed significantly from the hydrodynamic diameters of the original polymer macromolecules (about 10–15 nm according to DLS) or surfactant molecules (about 2–3 nm according to NMR [
51]).
For the implementing of the chemical logic gate potential of microfluidic chips, we fabricated and studied microfluidic reactors with two and three outputs. In principle, two outputs are sufficient for achieving multiple logic gate capabilities. Such designs are common for commercial H-sensor microfluidic devices. We performed preliminary microfluidic tests with three-input and two-output devices. At relatively high flow rates of the reagents and the solvent (>20 µL/min), and wide solvent flows (0.6–0.9 of the main channel width), dynamic light scattering detected particles of no more than 10–15 nm in the output flows. In such flow conditions, polymer and surfactant molecules might not reach each other by diffusion, and their flows might turn out to release through different outputs without reacting. At lower flow rates (0.1–10 µL/min) and narrower solvent flow widths (<0.5), 100–150 nm particles were detected in both outputs in nearly all flow conditions. This effect might be associated with the formation of polymer-surfactant complexes in the center of the main channel and its distribution between two outputs. With two-output chips, therefore, we could achieve only on-off states of microfluidic devices without reproducible switching of a chemical signal (polymer-surfactant complexes) between the outputs, which is required for creating various logic gate states in a microfluidic chip.
With three output designs, we could achieve the same on-off states as in two-output devices at high flow rates and solvent flow widths. However, DLS analysis of samples collected at lower flow rates of the reagents and the solvent (0.1–10 µL/min) detected 100–150 nm particles in the central output or a combination of two or three outputs. Therefore, we could assume that three outputs might provide more options for chemical signal activation and switching, as compared with two-output geometries.
In further microfluidic experiments, the samples were collected separately at all 3 microchannel outputs and analyzed by DLS. Based on macroscopic characterization results, <15 nm for individual polymer macromolecules and >70 nm for aggregates, we selected a 50 nm diameter as the threshold value. The absence of particles above 50 nm in diameter in the collected samples was considered as “0” or the logical “False”. The presence of larger particles was considered as “1” or the logical “True”.
3.2. Modeling Microfluidic Polyelectrolyte-Surfactant Reactions in 3-Input and 3-Output Chips
To predict the reaction initiation conditions and the complexation product release through specific microchip outputs, we developed scaling laws that evaluate polyelectrolyte-surfactant complexation conditions in a microfluidic device with a central flow of buffer.
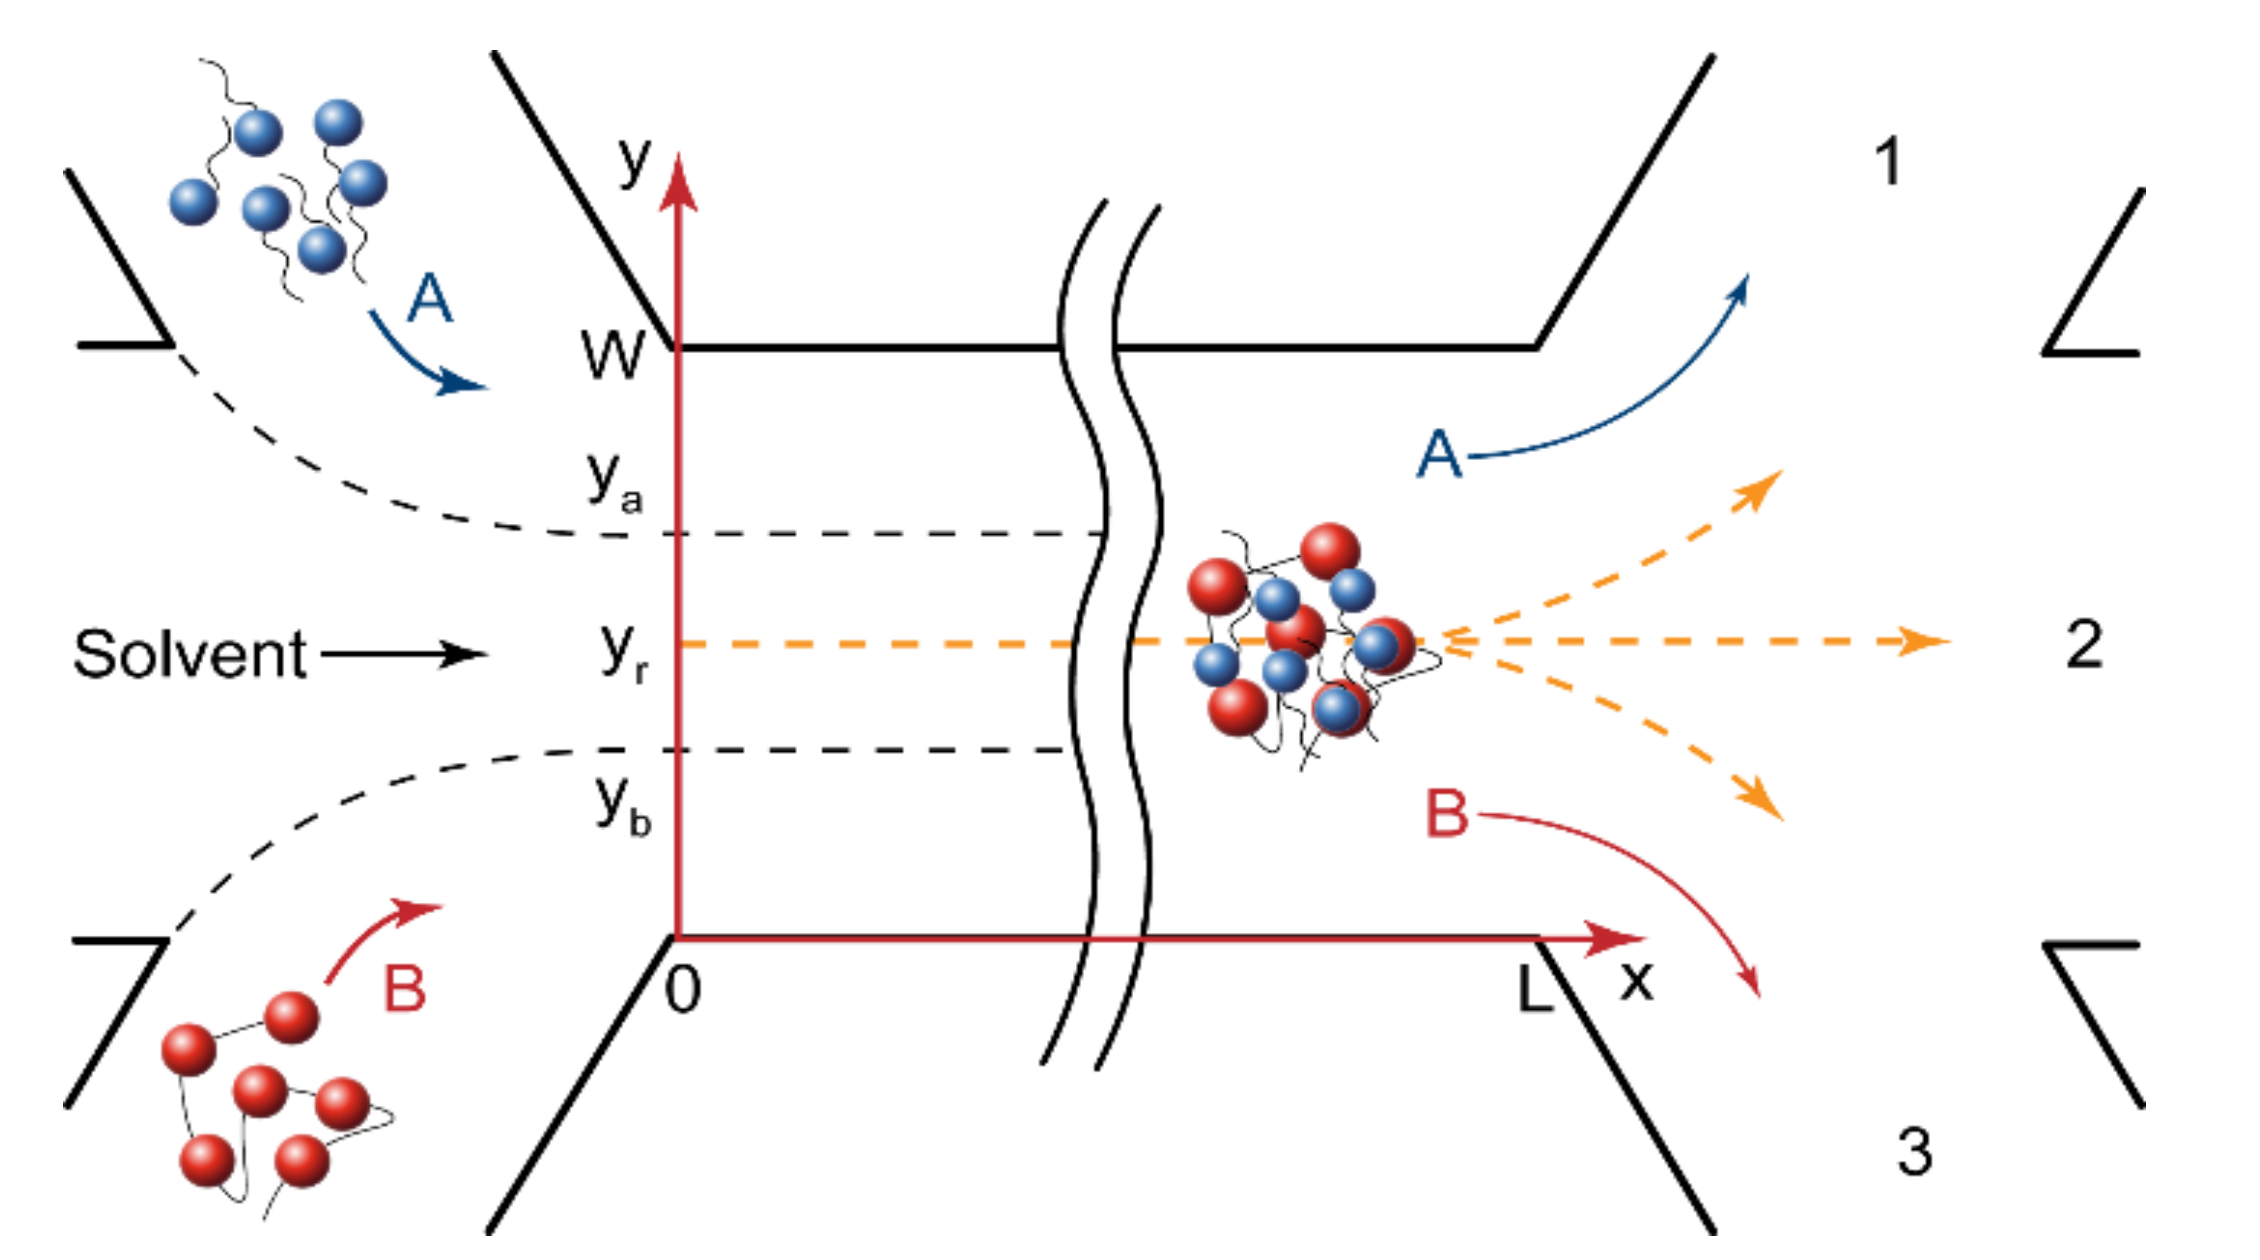
Figure 2 shows the geometry of a microfluidic chip with the width W and the length L. The central solvent flow prevented the A and B reactive flows from having an immediate contact and, therefore, from an immediate reaction start. The flow rates of polymer and surfactant were always equal, Q
A = Q
B, to reduce the number of microfluidic pumps that were required for the device’s operation. The solvent flow could also be an additional control factor for performing reactions in microchips.
In the central solvent flow (
Figure 2), the reaction started when the reacting molecules diffused from their flow boundaries (y
a and y
b) to the site of reaction (y
r). For a rectangular microchannel geometry (U
max = 3/2U), shown in
Figure 2, the initiation time t
in required for a certain part of the reagent “A” molecules to reach the reaction site from the “A” flow was set as follows [
53]:
where U is the flow velocity; L is the microchannel length; D
a and D
b are the diffusivities of the reaction species; y
a and y
b are the boundaries of surfactant and polymer flow, respectively; y
r is the reaction front coordinate.
By introducing a set of dimensionless numbers, we could transform Equation (2) into the scaling law for the reaction initiation at the main channel end (x = L) and predict the reaction front location. These numbers were Peclet number Pe = UW/D
a, the microchannel length-to-width ratio L
N = L/W, the normalized diffusion coefficient D
N = D
b/D
a, and the normalized solvent flow rate Q
N = Q
solvent/(∑Q
i). For equal flow rates of the reagents A and B, the resulting scaling law was:
and the reaction front location:
Equation (3) allows the “turning on” and “turning off” of the reaction in the main channel on demand for arbitrary microchannel geometries (LN) and reaction pairs (DN) by varying Pe and QN numbers. Equation (4) predicts the reaction front location across the main channel and, thus, the presence of the reaction product in a specific output.
A characteristic feature of reacting colloid and polymer systems is a combination of their low diffusivities and relatively high rates of surfactant binding by polymer [
50], due to electrostatic interactions and the hydrophobic effect. To evaluate competing kinetic and diffusion factors, we calculated the Damköhler number, that is the ratio of reaction and diffusion rates: Da =
, where C
0 is the initial polymer concentration. We used an approximate value of the rate constant that was set to 10
4. Such a value is close to the reported rates of polymer-surfactant interactions [
49,
50]. For the PDADMAC-SDS reaction pair and 200–300 μm wide microchannels, Da ≈ 10
4–10
5, the reagents should interact almost instantaneously when they meet by diffusion. We could consider that the rate of reaction was not a governing factor in the process kinetics. This agreed with papers reporting that diffusion-controlled reactions in microchannels depend weakly on reaction rate constants [
18].
For the fast diffusion-limited complexation processes studied in this paper, we could assume, therefore, that the reaction completed when the reagents mixed in the main channel by diffusion. For the geometry in
Figure 2, the mixing time [
53] was defined as follows:
The respective scaling law for chemical equilibrium was:
A more detailed derivation of Equations (2)–(5) is provided in
Appendix A.
By setting the flow conditions close to those predicted by Equation (5), we could achieve product accumulation across the main channel end and its release from multiple, or all, outputs.
The Peclet number is a widely used microfluidic similarity criterion, which characterizes the ratio of convection and diffusion rates in a microchannel [
53,
54]. In Equations (2) and (5), the Peclet number depends on other dimensionless numbers that combine microchannel length and width (L
N), diffusivities of reagents (D
N) and a flow rate pattern (Q
N). Therefore, these equations allowed evaluation of the microchip operation conditions that corresponded to reaction start and completion for arbitrary reaction pairs, microchip geometries, and operation modes.
3.3. Numerical and Experimental Verification of the Scaling Laws
The dimensionless numbers, Pein and Peeq, are expected to provide only an evaluation of reaction conditions in a microchip. Firstly, a characteristic diffusion time does not state the exact concentration of diffusing molecules at a specific distance from the flow of a reagent. Secondly, detection of a chemical signal at microchip outputs depends on the sensitivity of an applicable analytical method.
The first step to verify the scaling laws was to perform the numerical simulation of the processes, shown in
Figure 2, by solving Equation (1) with Matlab, and comparing the results with Pe
in and Pe
eq predictions.
The mathematical model suitable for numerical simulations should consider convection, diffusion, and kinetic processes in microfluidic flows. Fundamentally, it is necessary to analyze continuity and the Navier-Stokes equations. In the experiments, however, the inlet flows of the reagents and the solvent were stationary. The viscosity of polymer and surfactant solutions was close to that of a pure solvent. The flows in microchannels were laminar (the calculated Reynold number was Re < 5 for all the experiments). Such conditions are standard for single-phase microfluidic reactive flows [
53]. We could, therefore, use the solution of the Navier-Stokes equations, which predicts a parabolic flow velocity field in a microchannel, that is a standard approach in literature to model such microfluidic systems [
49,
53,
54,
55,
56]. For a rectangular microchannel and the coordinates shown in
Figure 2, the velocity field could be approximated by the following equation:
In the main channel (
Figure 2), therefore, there was a pressure-driven laminar flow of solutions along the X axis (the axial convection of the reacting species). The reagents also diffused across the main channel from the side flows to the reaction site in the solvent flow. In stationary flow conditions, we could neglect the axial diffusion of the reacting species. The equation that described the concentration distribution of the reagent A in the main channel included the axial convection component
and the radial diffusion component (Fick’s law):
, where A is the molar concentration of surfactant,
and
are its first order partial derivatives by time and the X axis, respectively,
is its second-order partial derivative by the Y axis, and
is the diffusion coefficient of the reagent A. In the stationary inlet flow conditions of the performed microfluidic experiments (
, we obtained the convection-diffusion equation [
53]:
We should also consider the reaction occurring between the reagents A and B. Surfactant binding by polymer can be described by a second-order reaction A + B = C, where B is the molar concentration of polymer binding cites (for PDADMAC, it is equal to the molar concentration of its monomer units) and C is the concentration of polymer binding centers with bound surfactant ions. The rate law for this reaction is
, where k is the rate constant. This kinetic rate law contributed to Equation (7) as the sink term. In the stationary conditions of the microfluidic experiments, the resulting equation predicted the concentration distribution of reagent A in the main channel [
53]:
Equation (8) combines the convection term with a parabolic velocity field, the diffusion term introduced according to Fick’s law, and the kinetic term representing the chemical reaction of polyelectrolyte-surfactant complexation.
The same equations were derived for the polymer B and the product C. The resulting system represented the complete set of convection-diffusion reaction equations [
53] that described the concentration distribution of the reaction species in the main channel:
where U(y) is the flow velocity; D
a, D
b, and D
c are the diffusivities of surfactant, polymer and the reaction product.
To complete the mathematical model, we needed to introduce the boundary conditions for the main channel. At the junction point (x = 0), the concentration of a reagent was equal to its initial concentration at the inlet flow and was zero elsewhere. The concentration of the product was zero at the junction point. If y
a and y
b were the boundaries of the A and B inlet flows (
Figure 2), then we could introduce the following Dirichlet boundary conditions for x = 0:
The coordinates y
a and y
b depend on surfactant, polymer, and solvent flow widths. In turn, these flow widths are proportional to the surfactant, polymer, and solvent flow rates in identical conditions of their flow paths to the main channel. If Q
a, Q
b, and Q
s are the polymer, surfactant, and solvent flow rates, respectively, then (for the geometry in
Figure 2):
With the addition of Equation (11) to the boundary conditions represented by Equation (10), we could cover all possible cases of polymer, surfactant, and solvent flow widths in the main channel by setting them with the respective flow rates.
We also needed to introduce the boundary conditions for the main channel walls (y = 0 and y = W in
Figure 2). They were derived from the assumption that the reaction species did not penetrate through microchannel walls, so resulting in a zero-radial flux at the walls [
53]. For the reagent A, we could formalize it as the following Neumann boundary conditions [
53]:
The same boundary conditions were introduced for the reagent B and the product C.
Equations (9)–(12) represent a mathematical model suitable for numerical simulations to predict the concentration profiles of the reacting species in the main channel. These equations were further transformed into a dimensionless form to be solved in Matlab (2021a, MathWorks, Inc., Natick, MA, USA). More details of the dimensional analysis are provided in the
Supplementary Materials and Figure S1.
In the numerical simulations, we used the following diffusion coefficients of the reagents: D
PDADMAC ≈ 50 μm
2/s found by DLS and D
SDS ≈ 500 μm
2/s [
51].
Equation (9) was solved in Matlab with the boundary conditions represented by Equations (10) and (12). The flowrates of the reagents were selected to provide conditions below, above or equal to the respective threshold Peclet numbers.
Figure 3 demonstrates the results of the numerical simulations for the main channel end, where the reactive species distributed between 3 outputs.
As we can see in
Figure 3, the reaction product could accumulate in various parts of the main channel, depending on the experimental conditions. It could, therefore, release through various single or multiple outputs.
In
Figure 3a’s simulation, the product did not form in the center of the main channel and the reagents left the microchip through the side outputs.
Figure 3b demonstrates an approximation of the start of the complexation reaction (turning the chip “On”). The product was supposed to release through the central output
By using Equation (4), we also evaluated conditions when the reaction front displaced towards another output. With a broad solvent flow (Q
N→1), the reaction front displaced to the left part of the microchannel (y
r ≈ 0.25–0.35). Predictions of Equation (4) were verified by numerical modeling of the PDADMAC-SDS reaction pair. The results of simulations (
Figure 3c) agreed with Equation (4)’s evaluations. Under Q
N→1 conditions, the reaction product mostly accumulated near the side of the main channel and was supposed to release through the side output.
Additional numerical simulations were performed for QN→1 conditions for reaction pairs with various diffusivities (DN = 1–10). The results showed that for the reagents with similar diffusivities (DN ≈ 1), the reaction product emerged in the center of the microchannel at all applicable flow rates. For reagents with different diffusivities, numerical simulations showed that the reaction front displaced towards the flow of a reagent with a lower diffusion coefficient. In our case, the reaction occurred near the flow of slowly diffusing polymer macromolecules. Therefore, by varying solvent flow widths for reagents with different diffusivities, we could switch the reaction product released between different outputs.
By minimizing the solvent flow rate, we eliminated the gap between the reacting flows. The product formed in the center of the main channel and was supposed to release through the central output (
Figure 3d).
Finally, by selecting microchip operation modes that corresponded to lower Peclet numbers, approaching equilibrium values, we synthesized polymer-surfactant complexes that occupied two thirds of the main channel first (
Figure 3e) and, then, the entire main channel (
Figure 3f). In such conditions, we could achieve the release of the reaction product through multiple or all outputs.
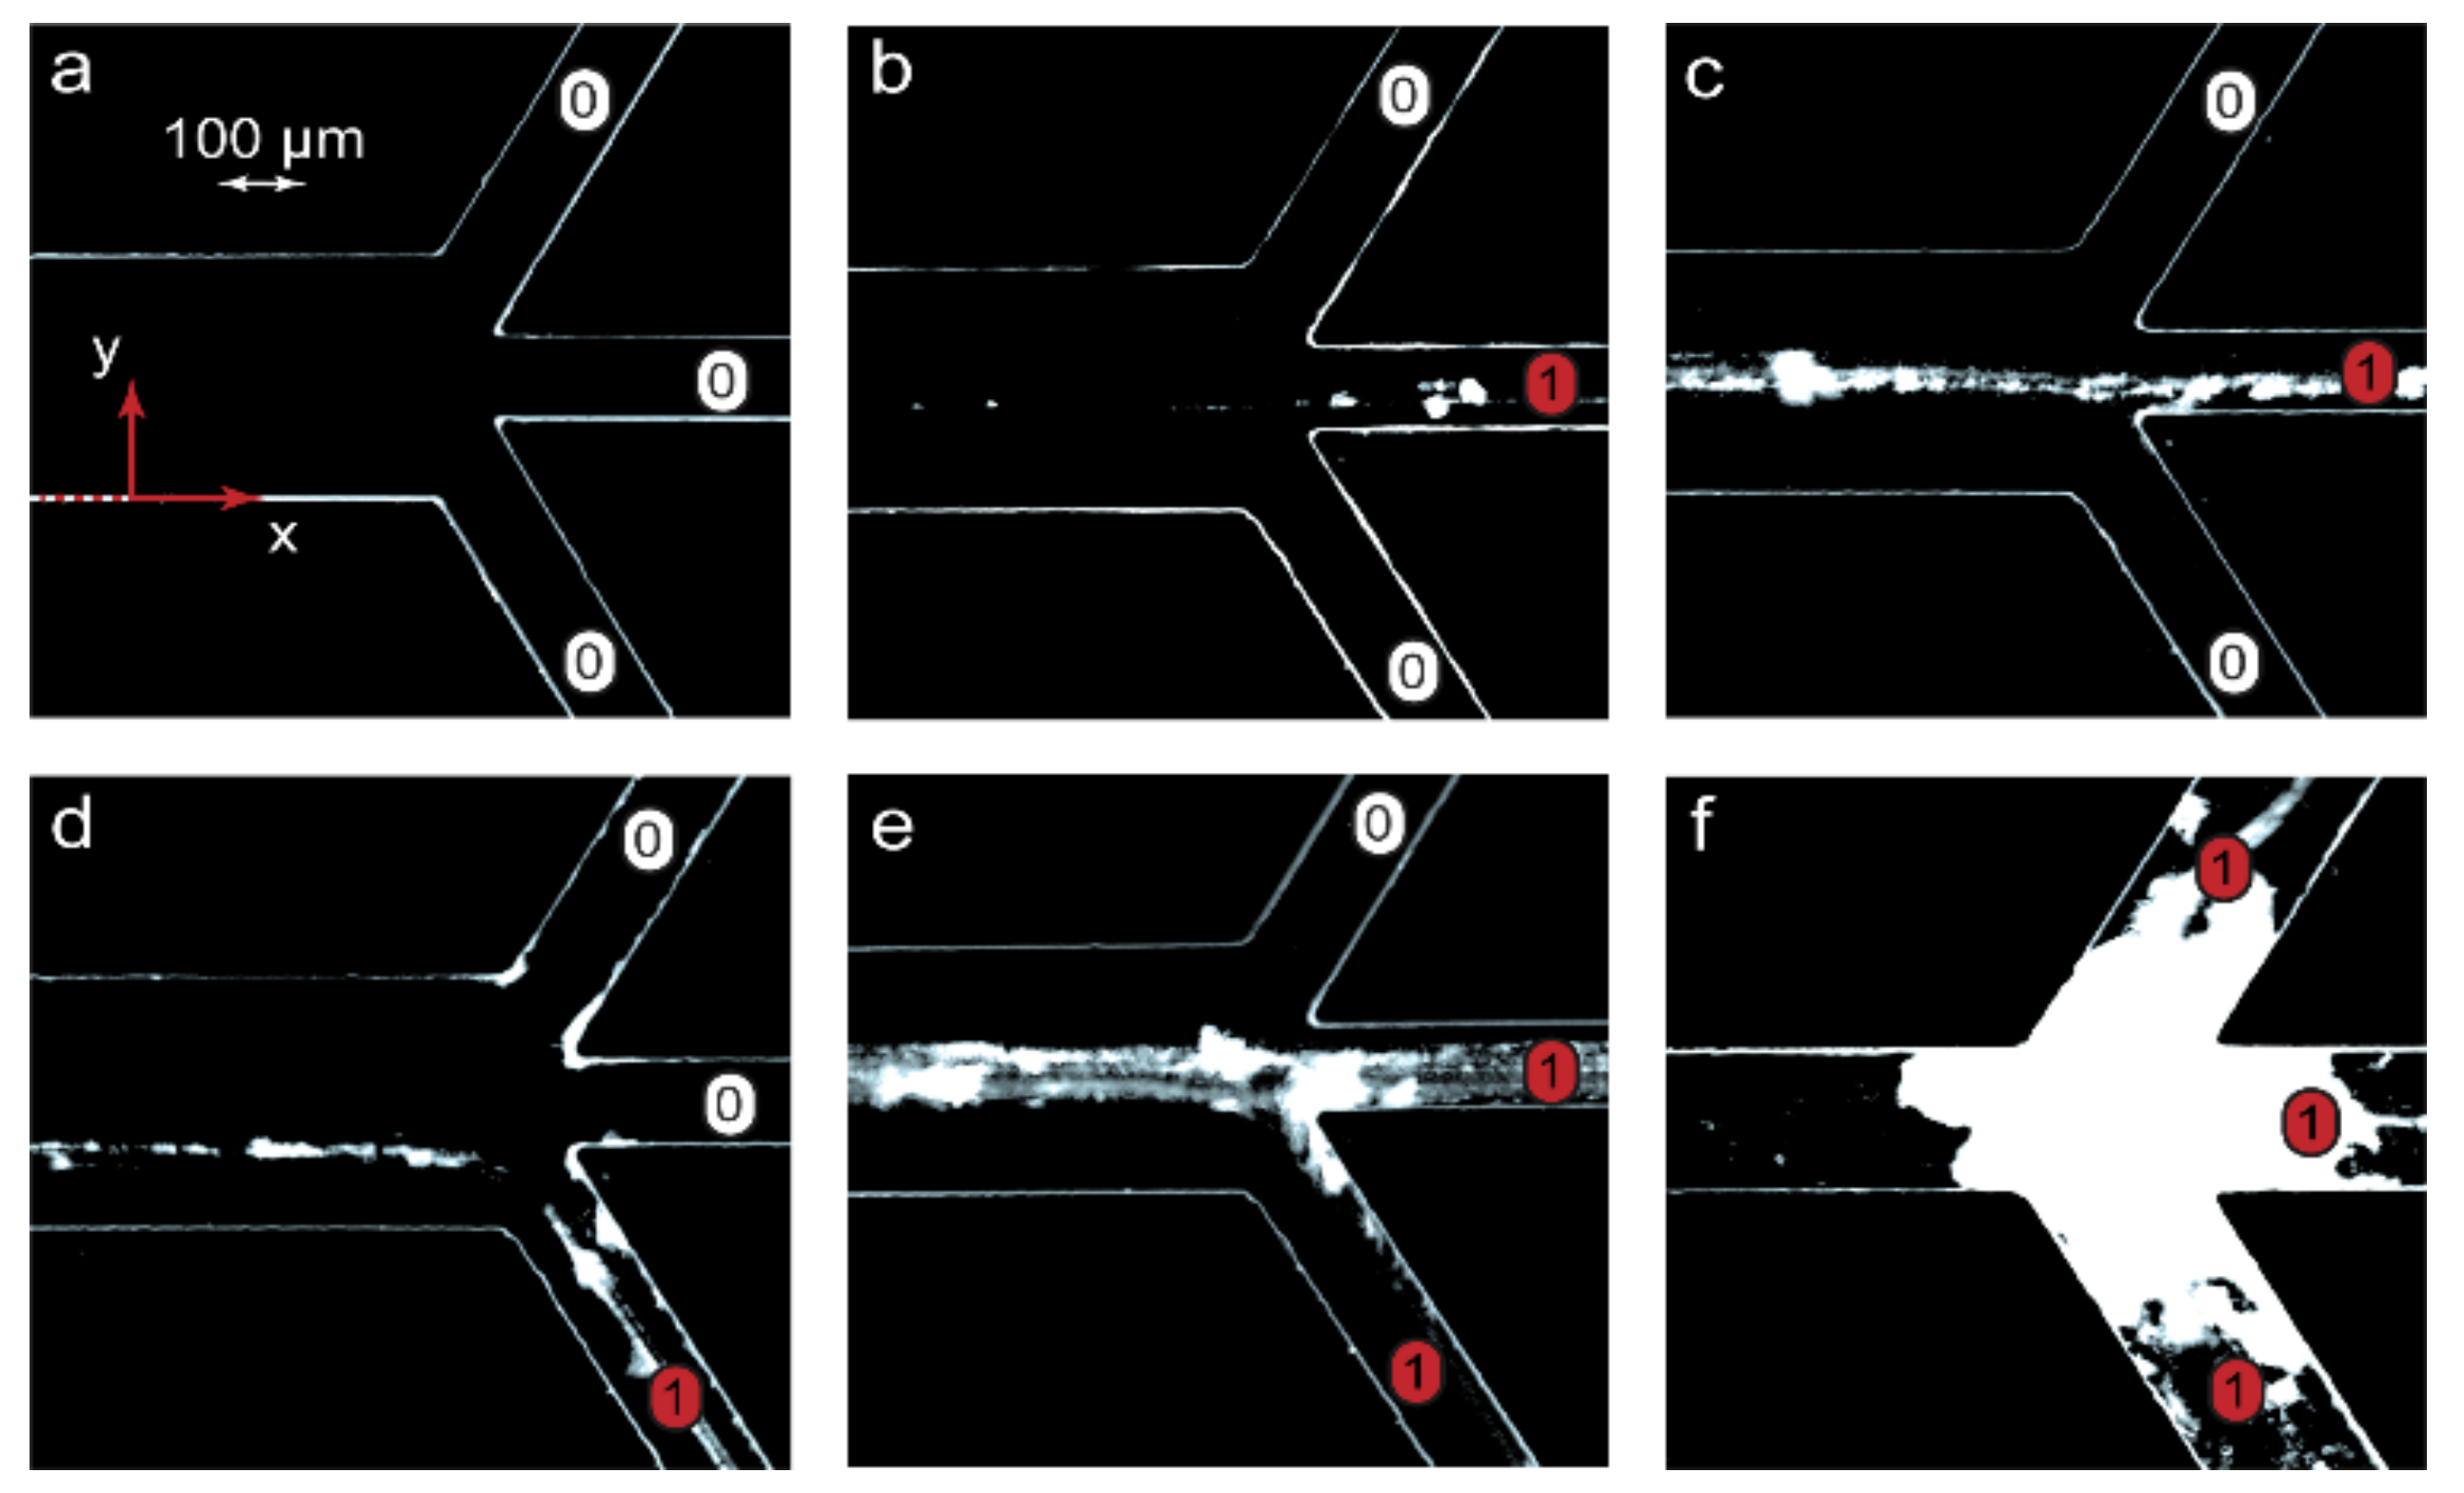
The second step to verifying the scaling laws was to perform microfluidic experiments in conditions matching those used for the numerical simulations. A peculiar feature of reacting polymer-surfactant systems in a nonequilibrium microfluidic confinement is that their complexes precipitate slightly on the bottom of a microchannel along the reaction front. The respective equilibrium macroscopic solutions, however, remained homogeneous. The reason for such an effect might be a preferable binding of surfactant ions by macromolecules available at the reaction front and the resulting reduction in solubility of nonequilibrium polymer-surfactant aggregates in the center of the main channel. Precipitation allowed an easy on-chip tracking of the reaction front locations by optical microscopy and provided a simplified visual detection of the resulting chemical signals at the chip outputs in addition to DLS.
Figure 4 demonstrates the processed negative optical microscopy images of microchip outputs with precipitates marking the reaction product pathways.
Figure 4 visualizes the emergence of a chemical signal (the reaction product) and its release through various microchip outputs. The images in
Figure 4 agreed with the results of numerical simulations represented in
Figure 3. At Pe > Pe
in, the microchannel was clean (
Figure 4a), indicating that no complexation reaction occurred between PDADMAC and SDS. The chip was, therefore, in the “off” state. Traces of precipitated PDADMAC-SDS aggregates appeared at conditions that corresponded to the start of the complexation reaction (Pe = Pe
in). At Pe < Pe
in, a chemical signal marked by partly precipitated complexes migrated between microchip outputs if different solvent flow rates were set (
Figure 4c,d). Finally, the precipitates were observed at multiple outputs when the reaction system approached equilibrium (
Figure 4e,f).
At low flow rates, precipitation might lead to microchip clogging (
Figure 4f) and failure. A series of additional microfluidic experiments performed for the PDADMAC-SDS pair, revealed that precipitation was reversible and could easily be eliminated or minimized by performing the complexation reaction in 20–30 wt.% ethanol, which was more tolerant to hydrophobic colloidal particles. For applications of such microfluidic devices, we should, therefore, select either an appropriate solvent or polymer-surfactant reaction pairs that do not tend to precipitate at the respective ratios of their concentrations.
We performed activation of a macromolecular chemical signal and switched it between multiple outputs by just varying the flow rates According to Equations (4) and (6), we could achieve conditions shown in
Figure 3 with other combinations of flow rates and also other microchannel lengths, widths and reaction pairs. Additional selected numerical simulations were performed for microchannel widths of 100–300 μm, lengths of 15–300 mm, flow rates of 0.2–100 μL/min and reaction pairs with diffusivities of 10–1000 μm
2/s. Equations (4) and (6) provided a satisfactory agreement with the results of simulations. These simulations were selectively verified for the PDADMAC-SDS reaction pair in microchips with different geometries (200 μm widths and 30–100 mm lengths). The experiments also agreed with numerical simulations and demonstrated the product output states were similar to those shown in
Figure 4.
3.4. Detecting Chemical Signals and Achieving Logic Gate States
For detecting supramolecular chemical signals, microfluidic samples of PDADMAC-SDS solutions were collected at chip outputs and analyzed by DLS. The results are summarized in
Table 1. The samples were taken from the microchips in the same experimental conditions as demonstrated in
Figure 4.
The DLS data of the samples collected at the microchip outputs agreed with the numerical simulations represented by
Figure 3 and the visual results shown in
Figure 4. Before the start of the reaction (conditions “a”), particles of about 10 nm in diameter were detected in the sample taken at output “3”. The size of these particles corresponded to those of the initial PDADMAC macromolecules, which were supposed to release through output “3”.
The samples released through outputs “1” and “2” in the experimental conditions “a” were also analyzed by dynamic light scattering. In output “1”, DLS detected only particles of approximately 2–3 nm in diameter. These particles were supposed to be releasing surfactant molecules, which were fed through the input “A”. Similar results were obtained for the output 2, that might indicate that traces of surfactant penetrated to the output 2 flow by diffusion.
The size range of 2–3 nm is, however, close to the lower DLS detection threshold and high-precision measurements require additional preparation of samples that was not necessary in this work, as the chemical signal we intended to detect was in a far larger size range of ~100 nm. Therefore, we approximated the results as “<10 nm” in
Table 1 for the conditions “a” and further experiments.
Under the conditions, “b”, particles of a broad size range (10–100 nm) were detected in the central output. They might have been both individual polymer macromolecules and aggregated complexes. Such a chemical signal was unstable and possibly indicated a large detection error due to a very low concentration of the reaction product in the Pe = Pein conditions. Similar unstable results were obtained by performing the complexation reaction in conditions close to Pein: 0.5Pein < Pe < 2Pein.
Under the conditions, “c”, with a broad solvent flow, the size of particles in the lower output was about 70–80 nm, which was above the selected signal detection threshold (50 nm). A smaller size of particles agreed with the size of complexes synthesized in macroscopic conditions in similar polymer-surfactant solutions diluted by large solvent additives. The readout of the central output was unstable and varied in each measurement, indicating that certain macromolecules or product aggregates might have released through the central output. Setting higher QN values allowed us to shift the reaction front to the lower output of the chip and improve the readability of the signal.
Under the conditions, “d”, Pe ≈ 0.25Pein, the product concentration in the central output was relatively high, according to the numerical simulations, and provided a stable chemical signal, represented by 100 nm particles.
Under the conditions, “f” and “e”, Pe→Peeq and polymer-surfactant aggregates of 100–150 nm in diameter were observed in multiple, and all, the outputs, respectively.
The digital equivalents of the reaction product absence and presence in the output channels were 0 and 1, respectively. Three outputs, therefore, provided a rich variety of digital chemical signal readouts set by the dimensionless numbers in the scaling laws (Equations (3), (4) and (6)).
To evaluate a possible impact of PDADMAC and SDS concentrations on chemical signal generation and detection, numerical modeling and experiments were also performed with concentrations of an order of lower magnitude (6.1 × 10
−4 mol/L). At these concentrations, numerical simulations provided results similar to those in
Figure 3. Accumulation of precipitates in the experiments was much lower than that shown in
Figure 4 for higher concentrations of reacting species. The signal detection was unstable under the conditions “b” and “d” but provided reliable results in other conditions.
Selected experiments were also performed in conditions “b”, “c”, and “d” at concentrations of the reagents above those corresponding to the critical micellization concentration (CMC) of SDS (8.4 × 10⁻³ mol/L). At concentrations above CMC, surfactant aggregates with diffusivities different from those of individual surfactant molecules appeared in the solutions. In such conditions, optical microscopy images showed that the precipitate lines marking the reaction front were displaced by 20–30 μm from their original locations. Consideration of micelles requires, therefore, a different mathematical model.
Table 2 summarizes the digital readouts of the microfluidic chips with respect to the scaling laws.
Table 1, and
Figure 3 and
Figure 4 also show the corresponding logic gate states of the chips.
The “a” state was, therefore, a dynamic “off” state and no product emerged in the microchip, although the reagents continued to flow and release through the side outputs. The “b” state was the microchip activation threshold. In this state, a reliable product generation was unstable. In the states from “c” to “f”, the chip performed as a chemical signal switch between various microchip outputs.
The microchip operational modes, summarized in
Table 2, provide various logic gate states. In the “off” mode, the logic states were AND = 0 and OR = 0. In the activation and switching modes, AND = 0 and OR = 1 until the outputs were fully occupied by the reaction product (AND = 1, OR = 1).
Thus, the threshold Pe numbers allowed evaluation of the reaction initiation and completion conditions in microchips. For a stable, reproducible, and detectable generation of chemical signals, we should select microchip operation conditions that exceed, or fall behind, the threshold Pein values.
We could implement a two-step strategy of chemical signal activation and switching for a variety of reaction pairs in microfluidic devices. Firstly, we evaluated the reaction front initiation and switching conditions with the threshold dimensionless numbers Pein and Peeq and the reaction front location yr. Secondly, we verified the results with the numerical script and obtained more precise microchip operation parameters for generating a stable chemical signal. Chemical signal readouts and logic gate states could be changed dynamically by programming microfluidic pumps.


