
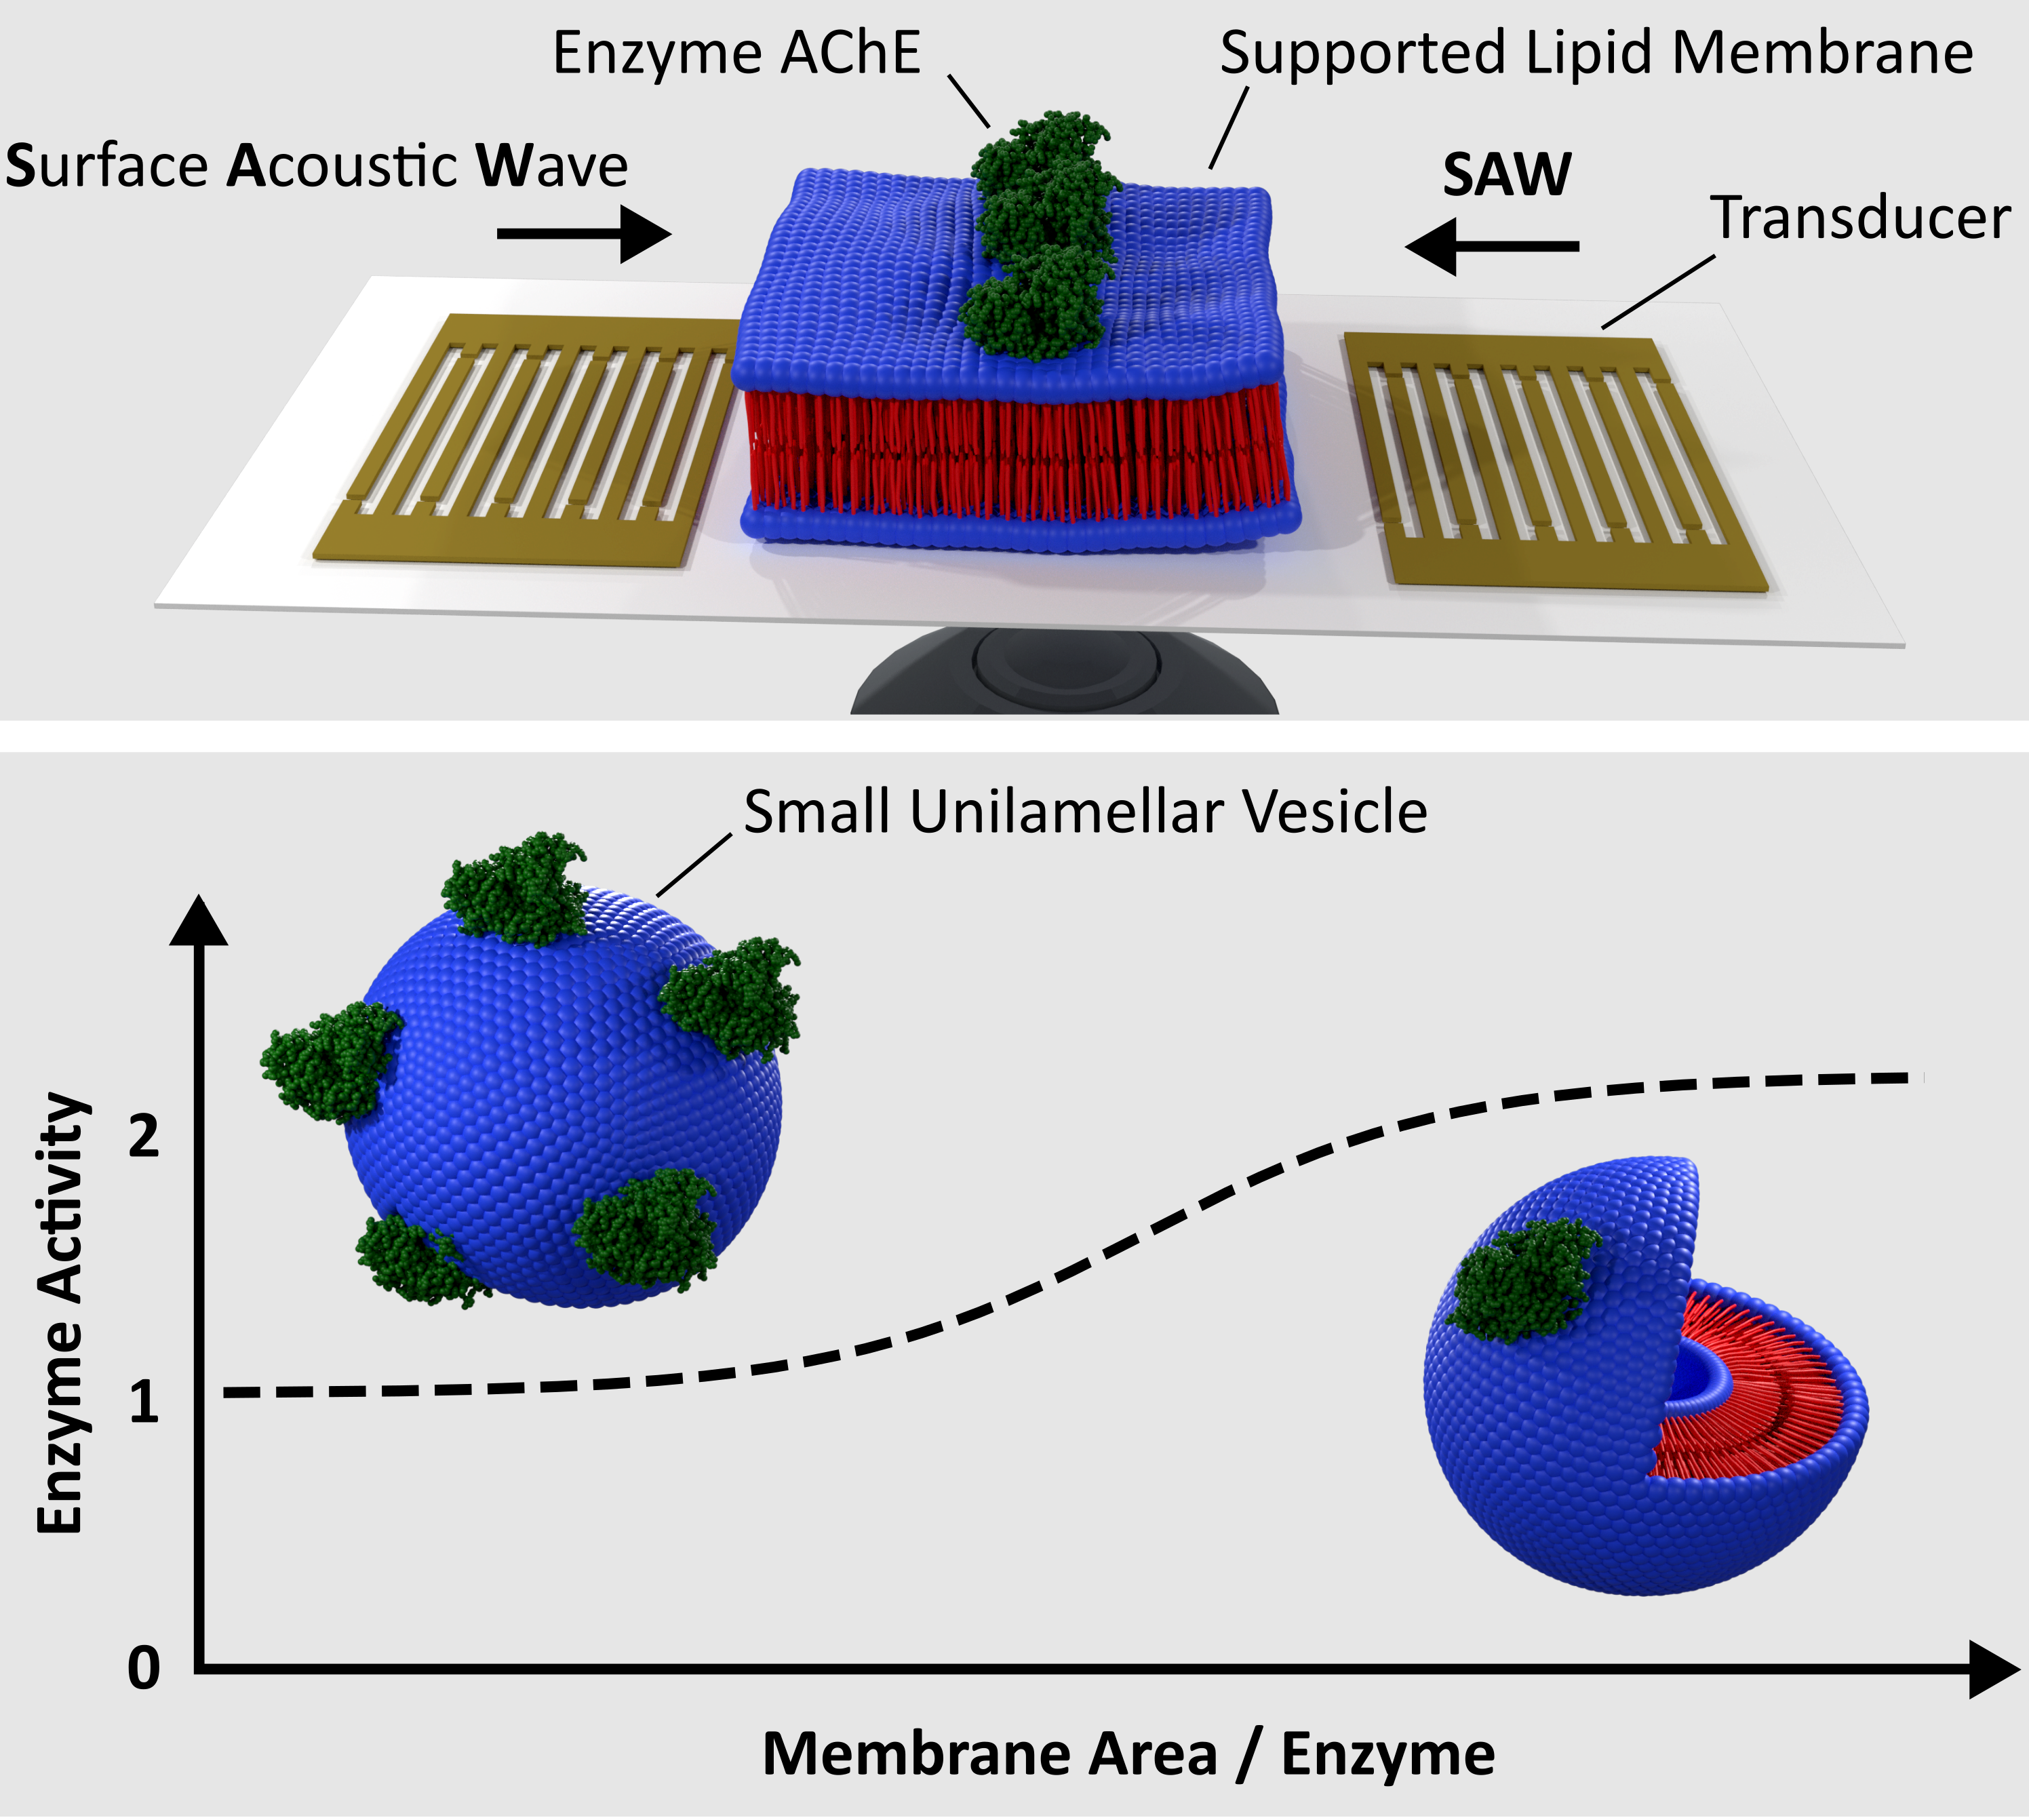
Acetylcholinesterase Activity Influenced by Lipid Membrane Area and Surface Acoustic Waves

 and
and
Abstract
:
1. Introduction
2. Materials and Methods
2.1. Vesicle Fusion
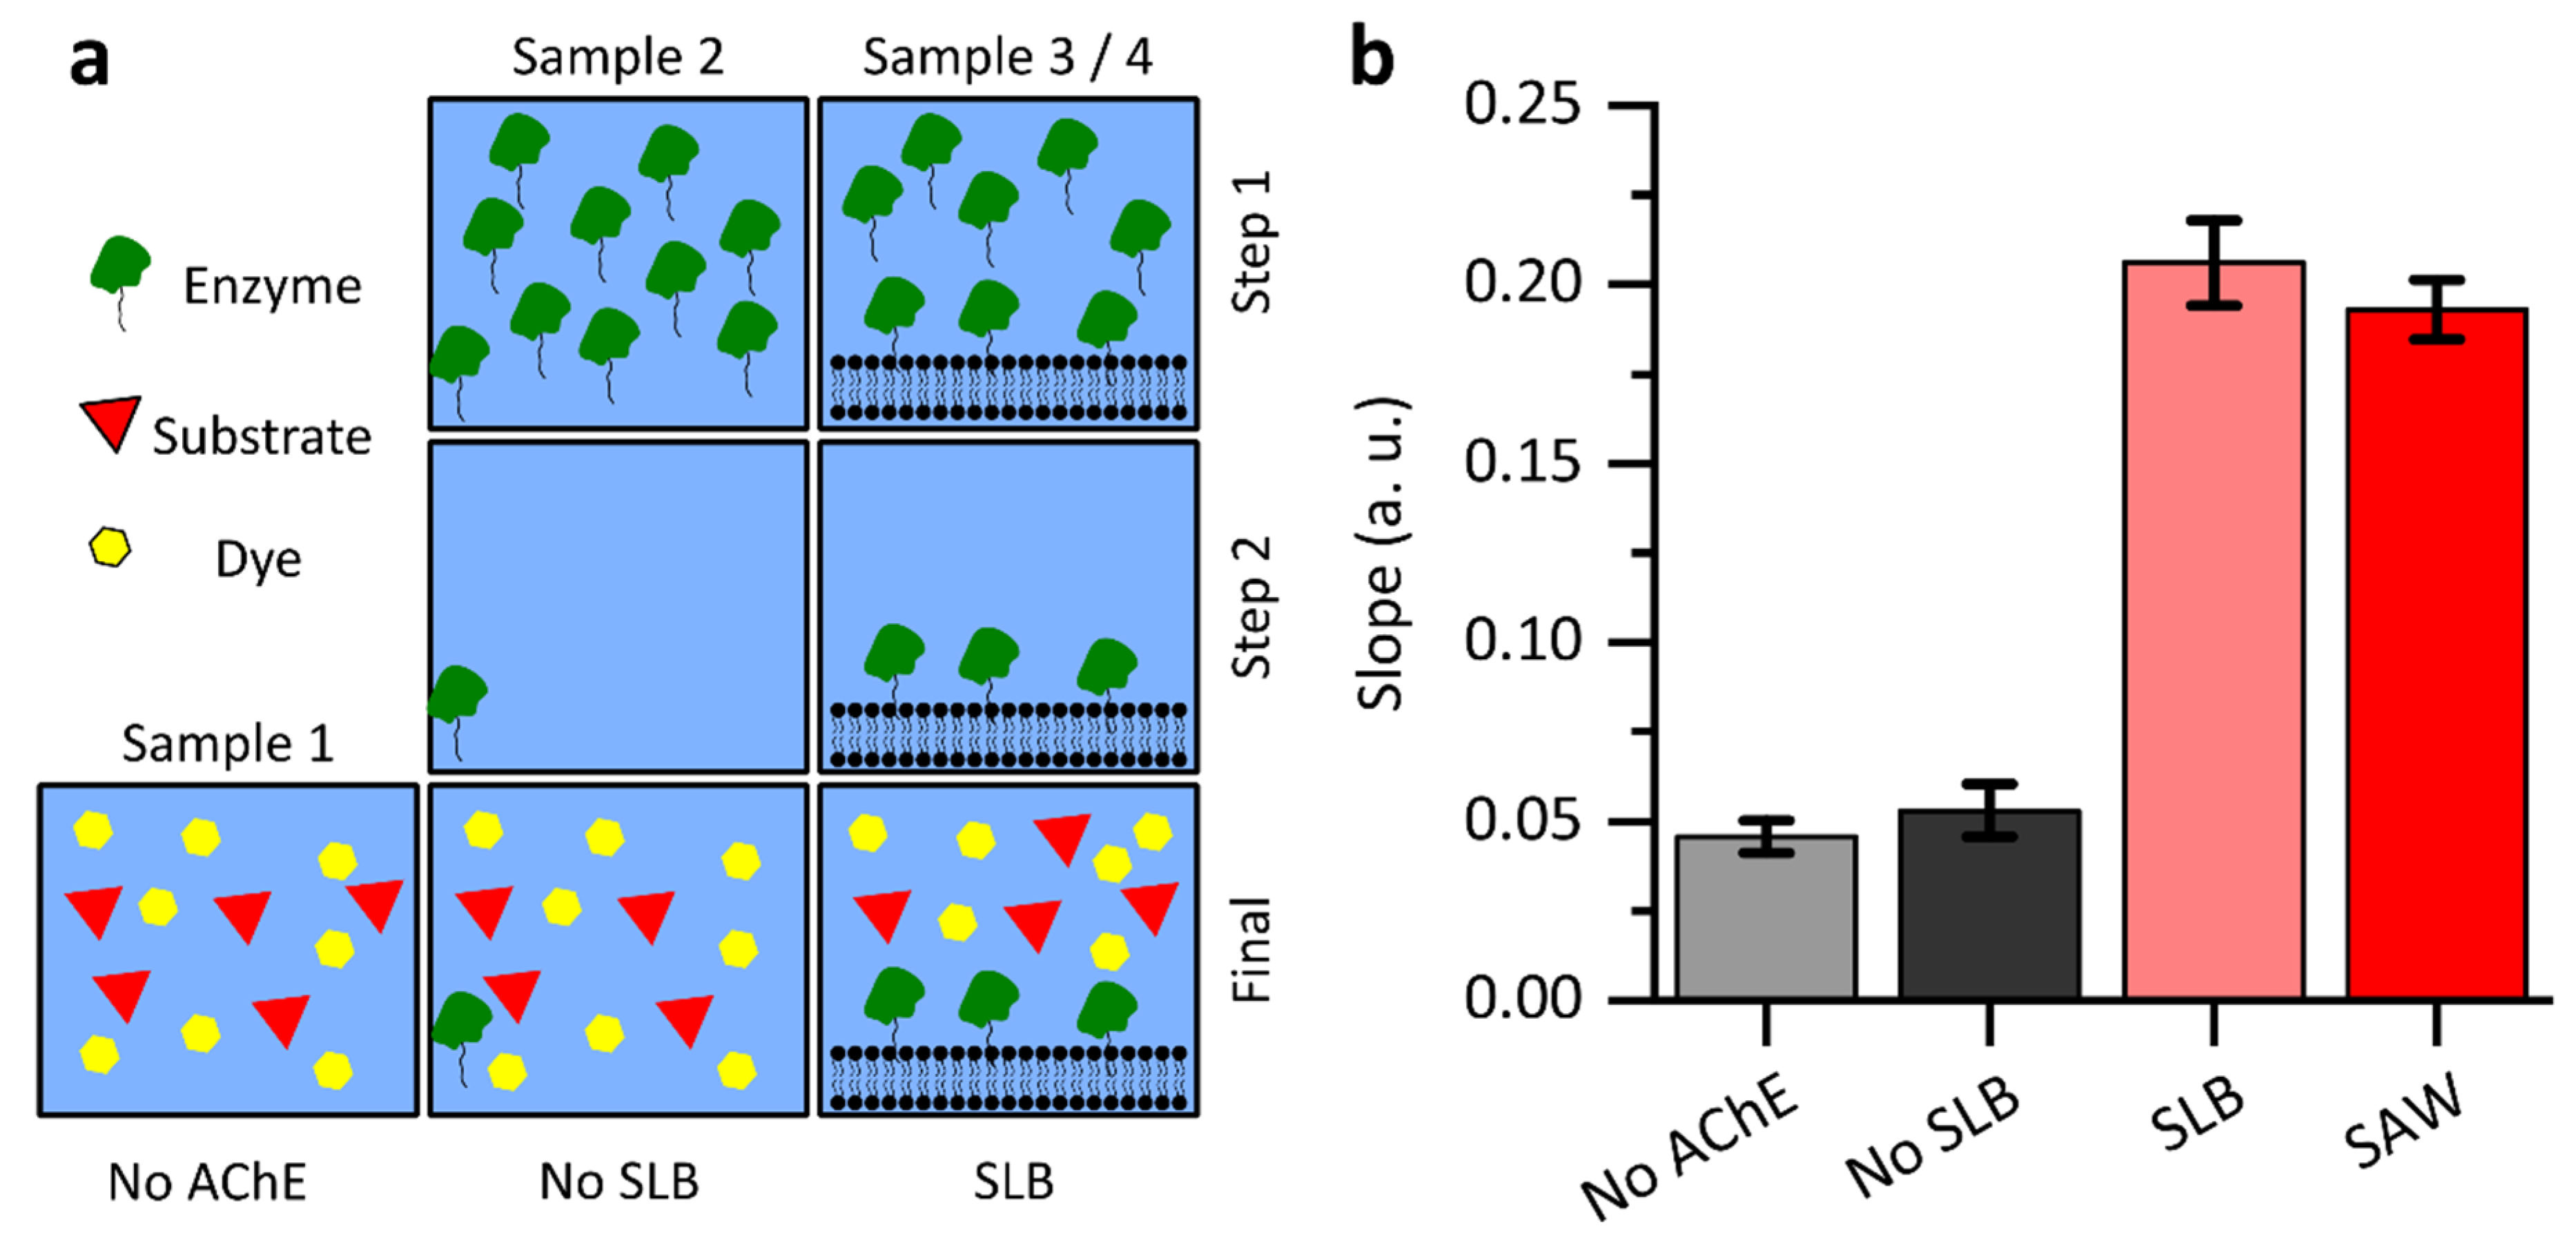
2.2. Ellman Assay
2.3. Simulation of Lipid Diffusion
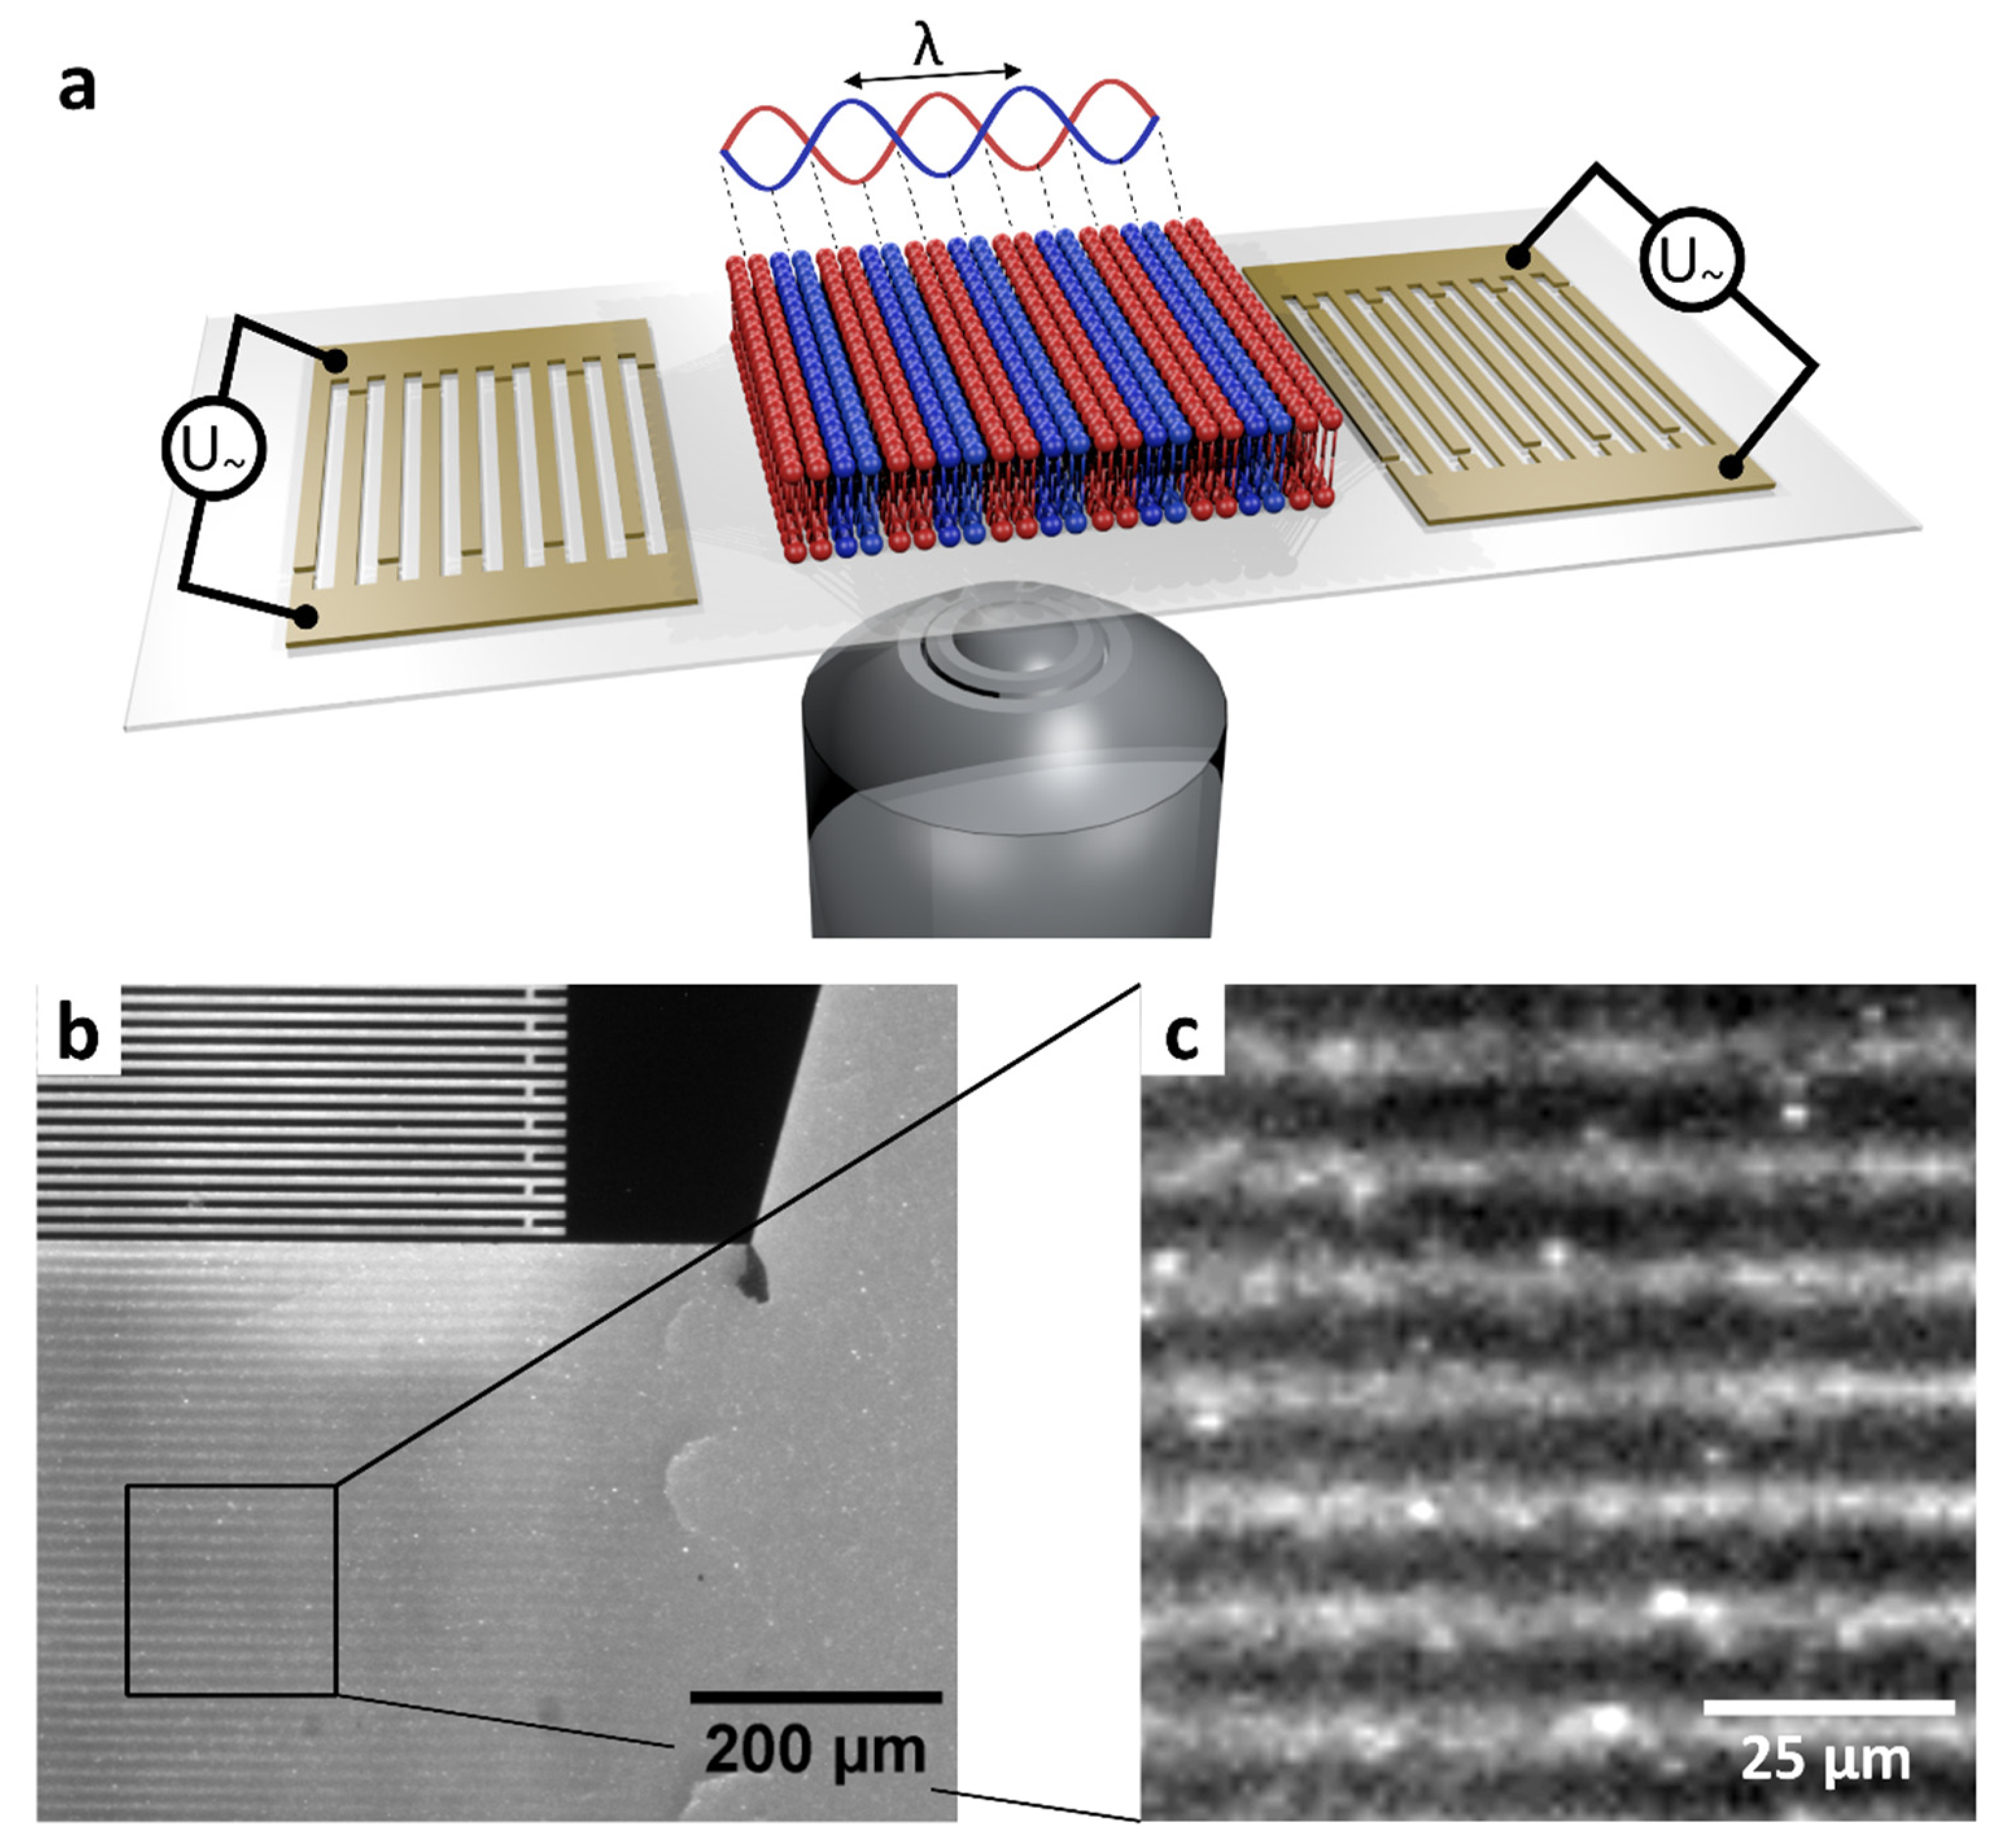
2.4. SAW Chip
3. Results and Discussion
3.1. Bilayer Characterization Using Continuous Bleaching
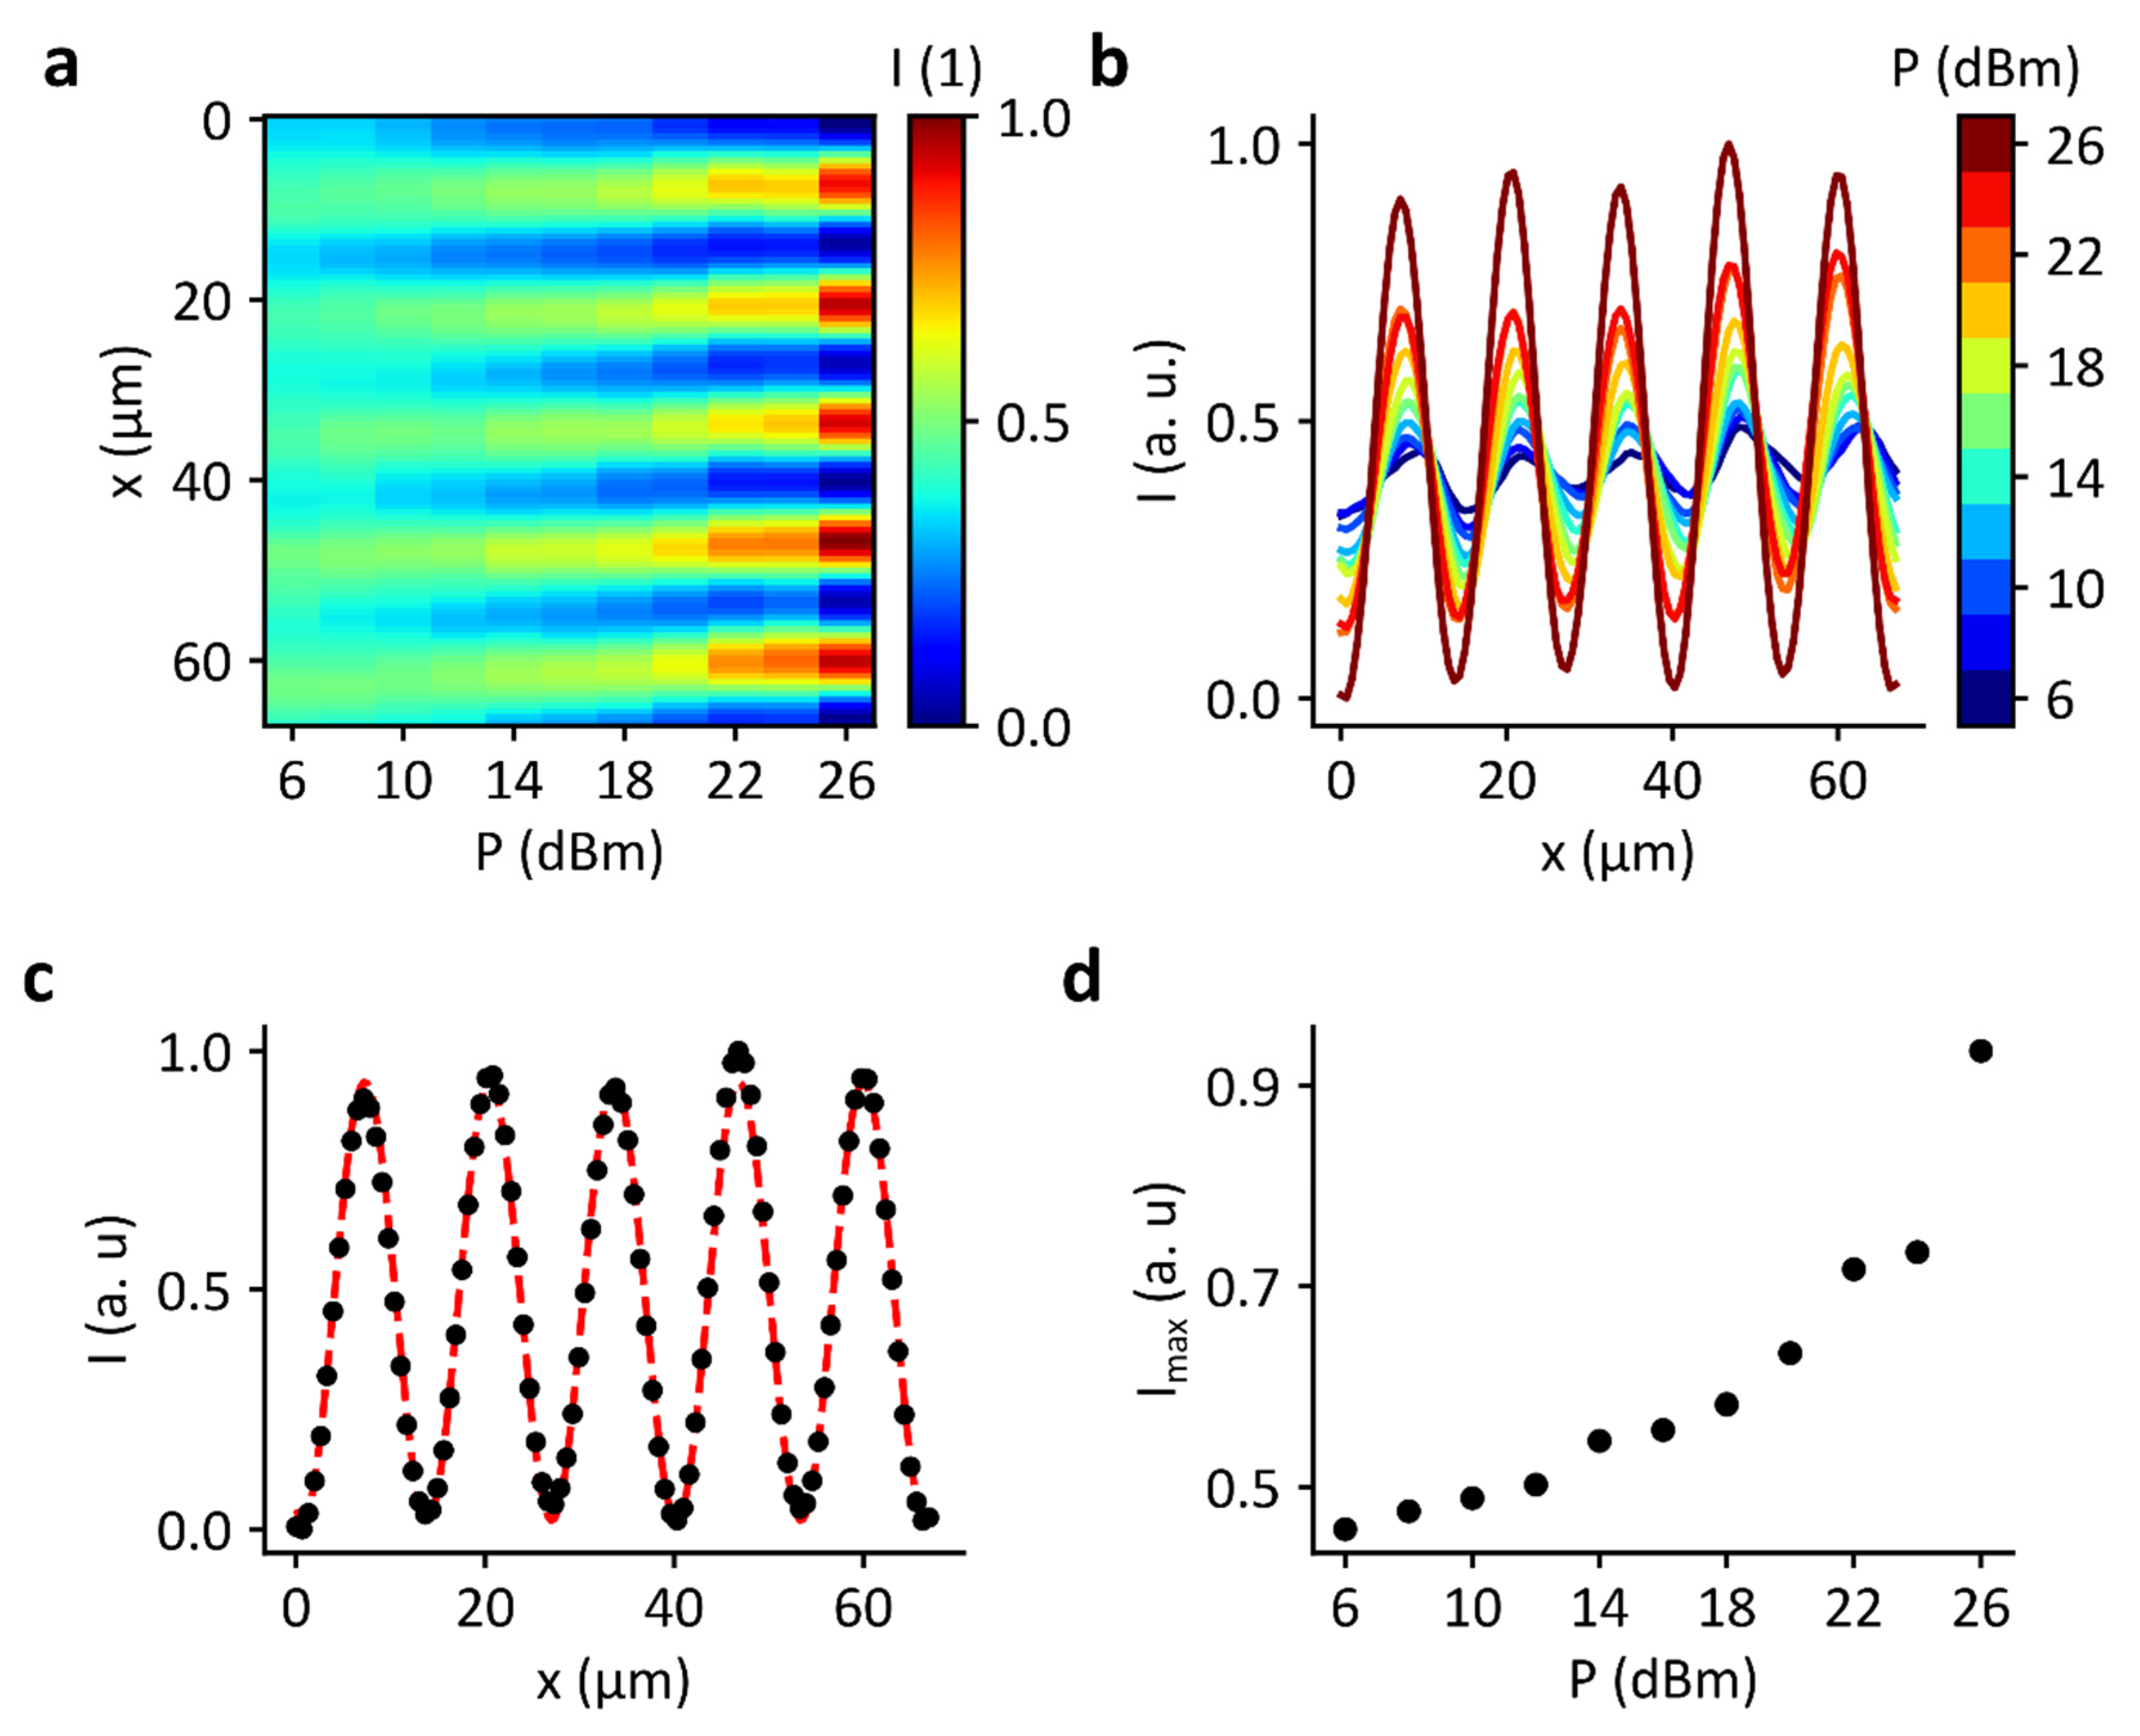
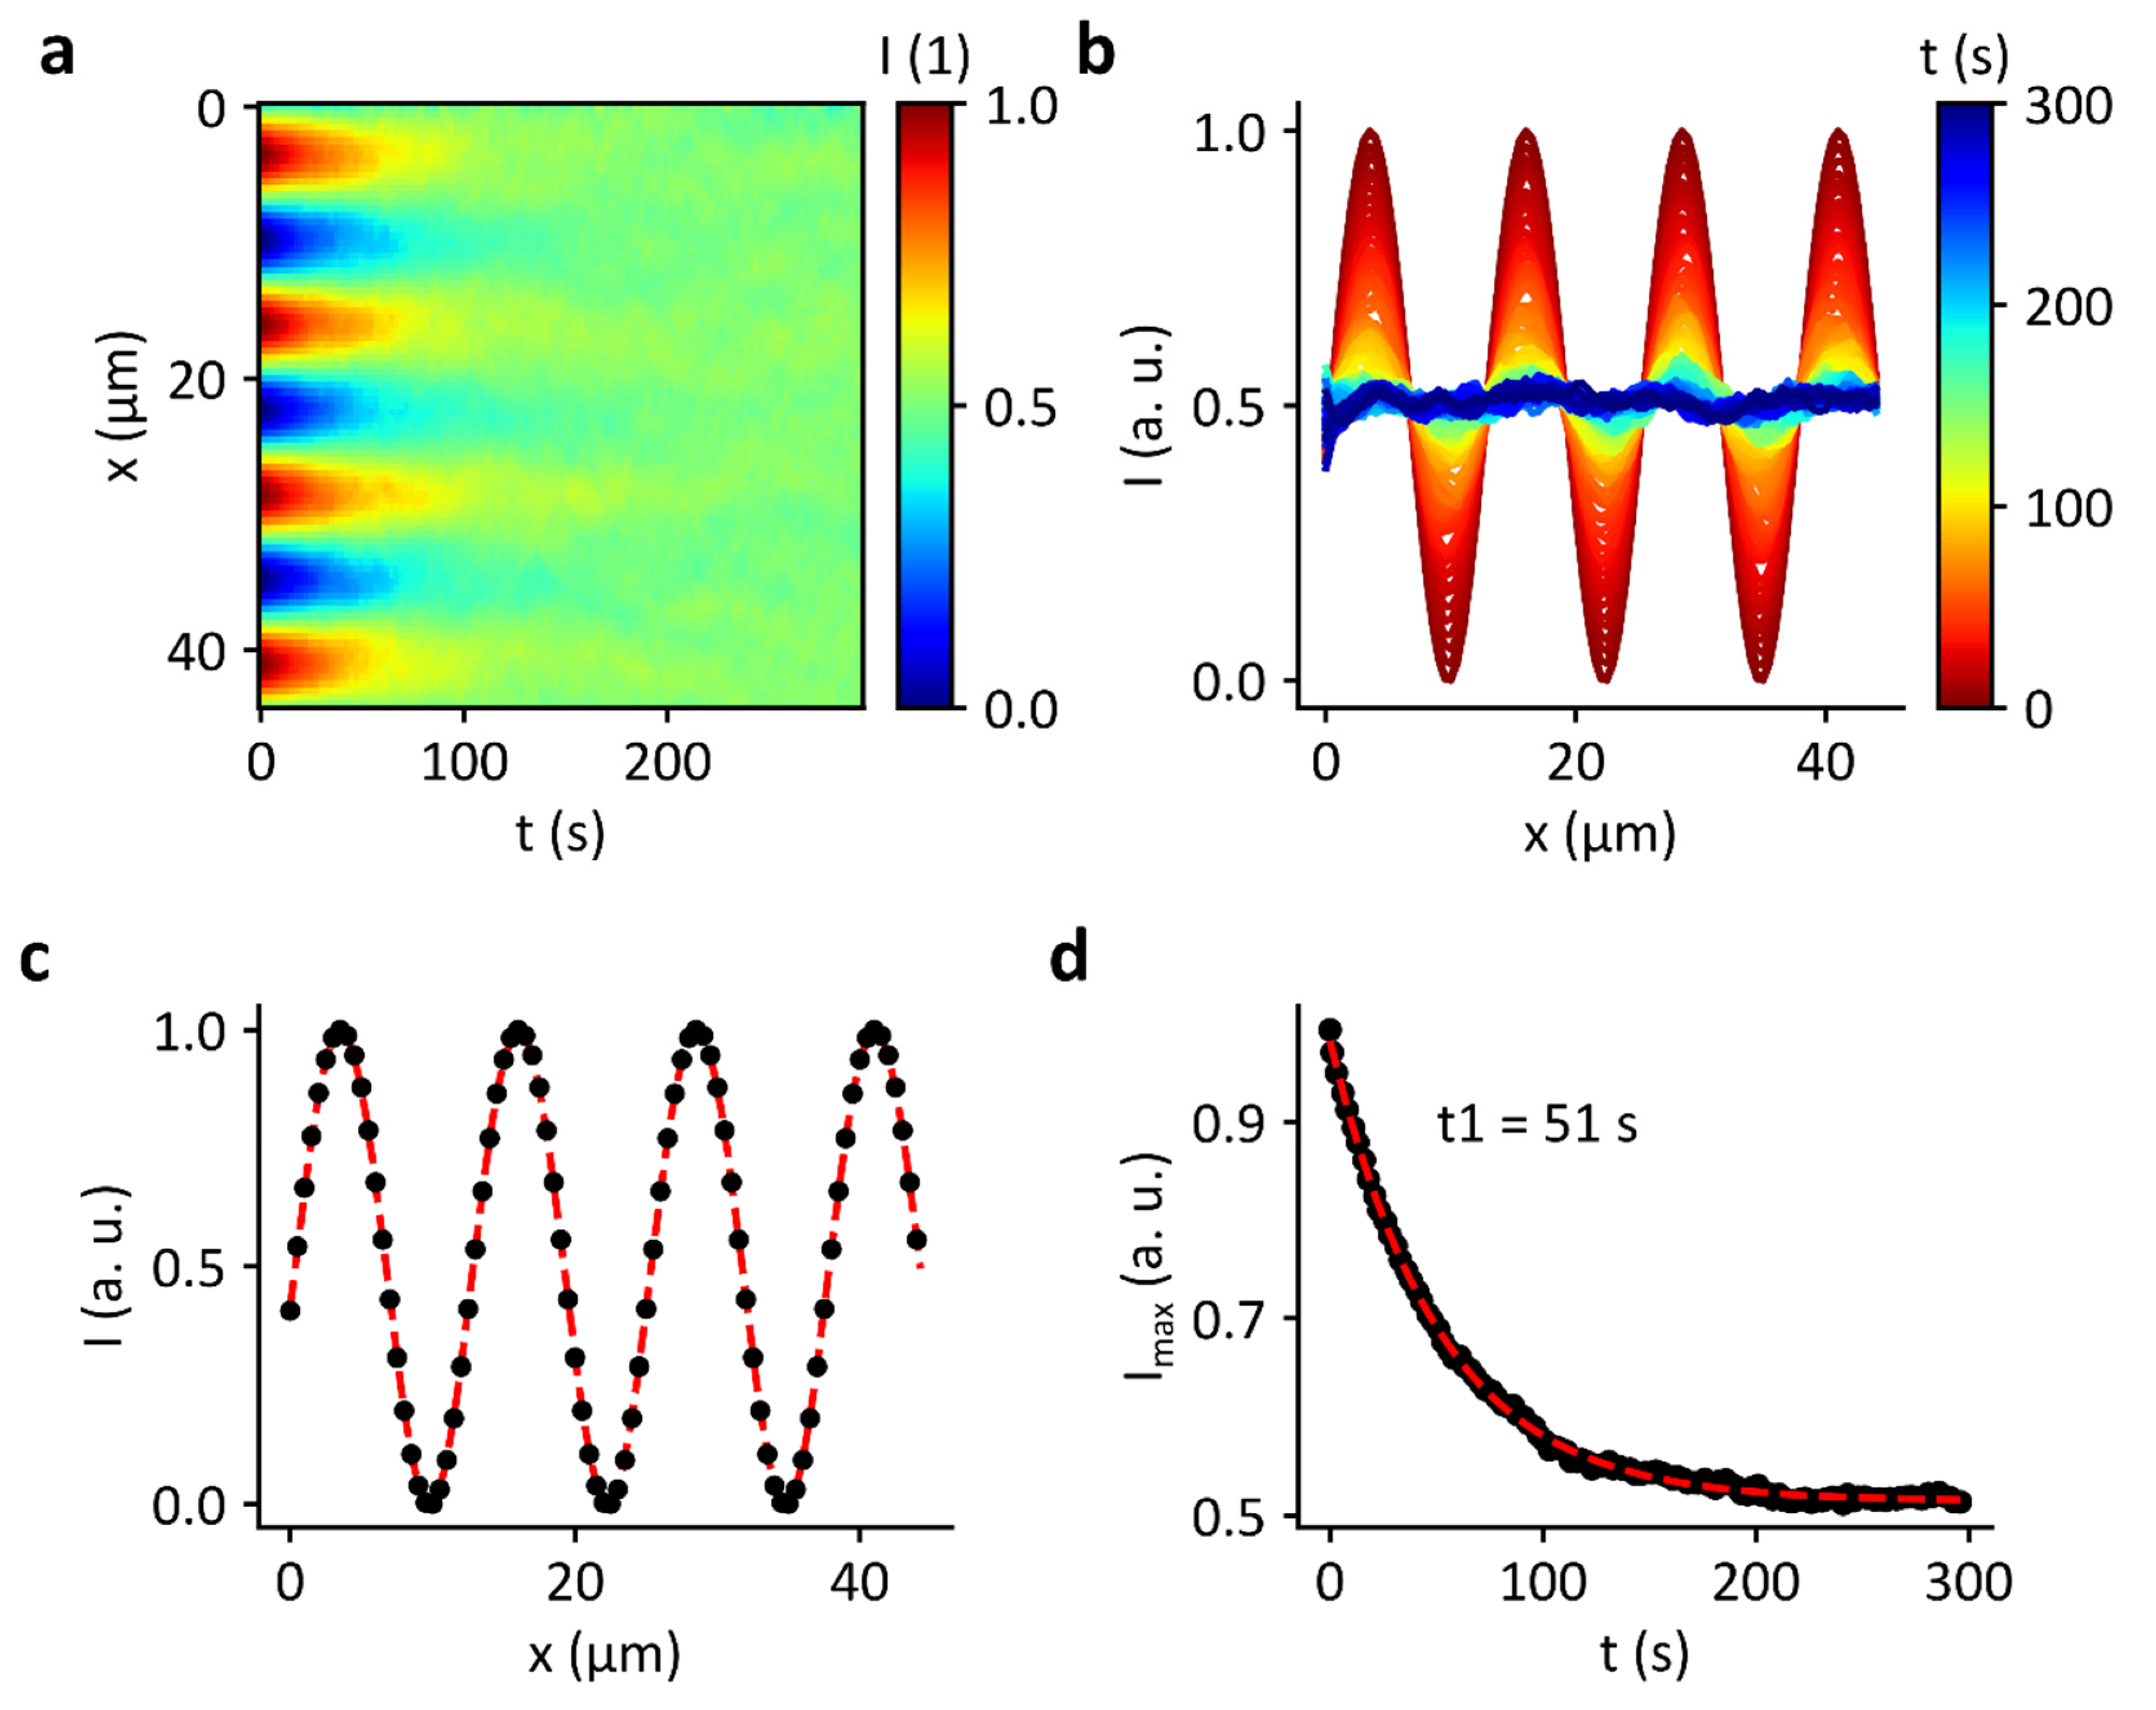
3.2. Domain Formation by Standing Surface Acoustic Wave
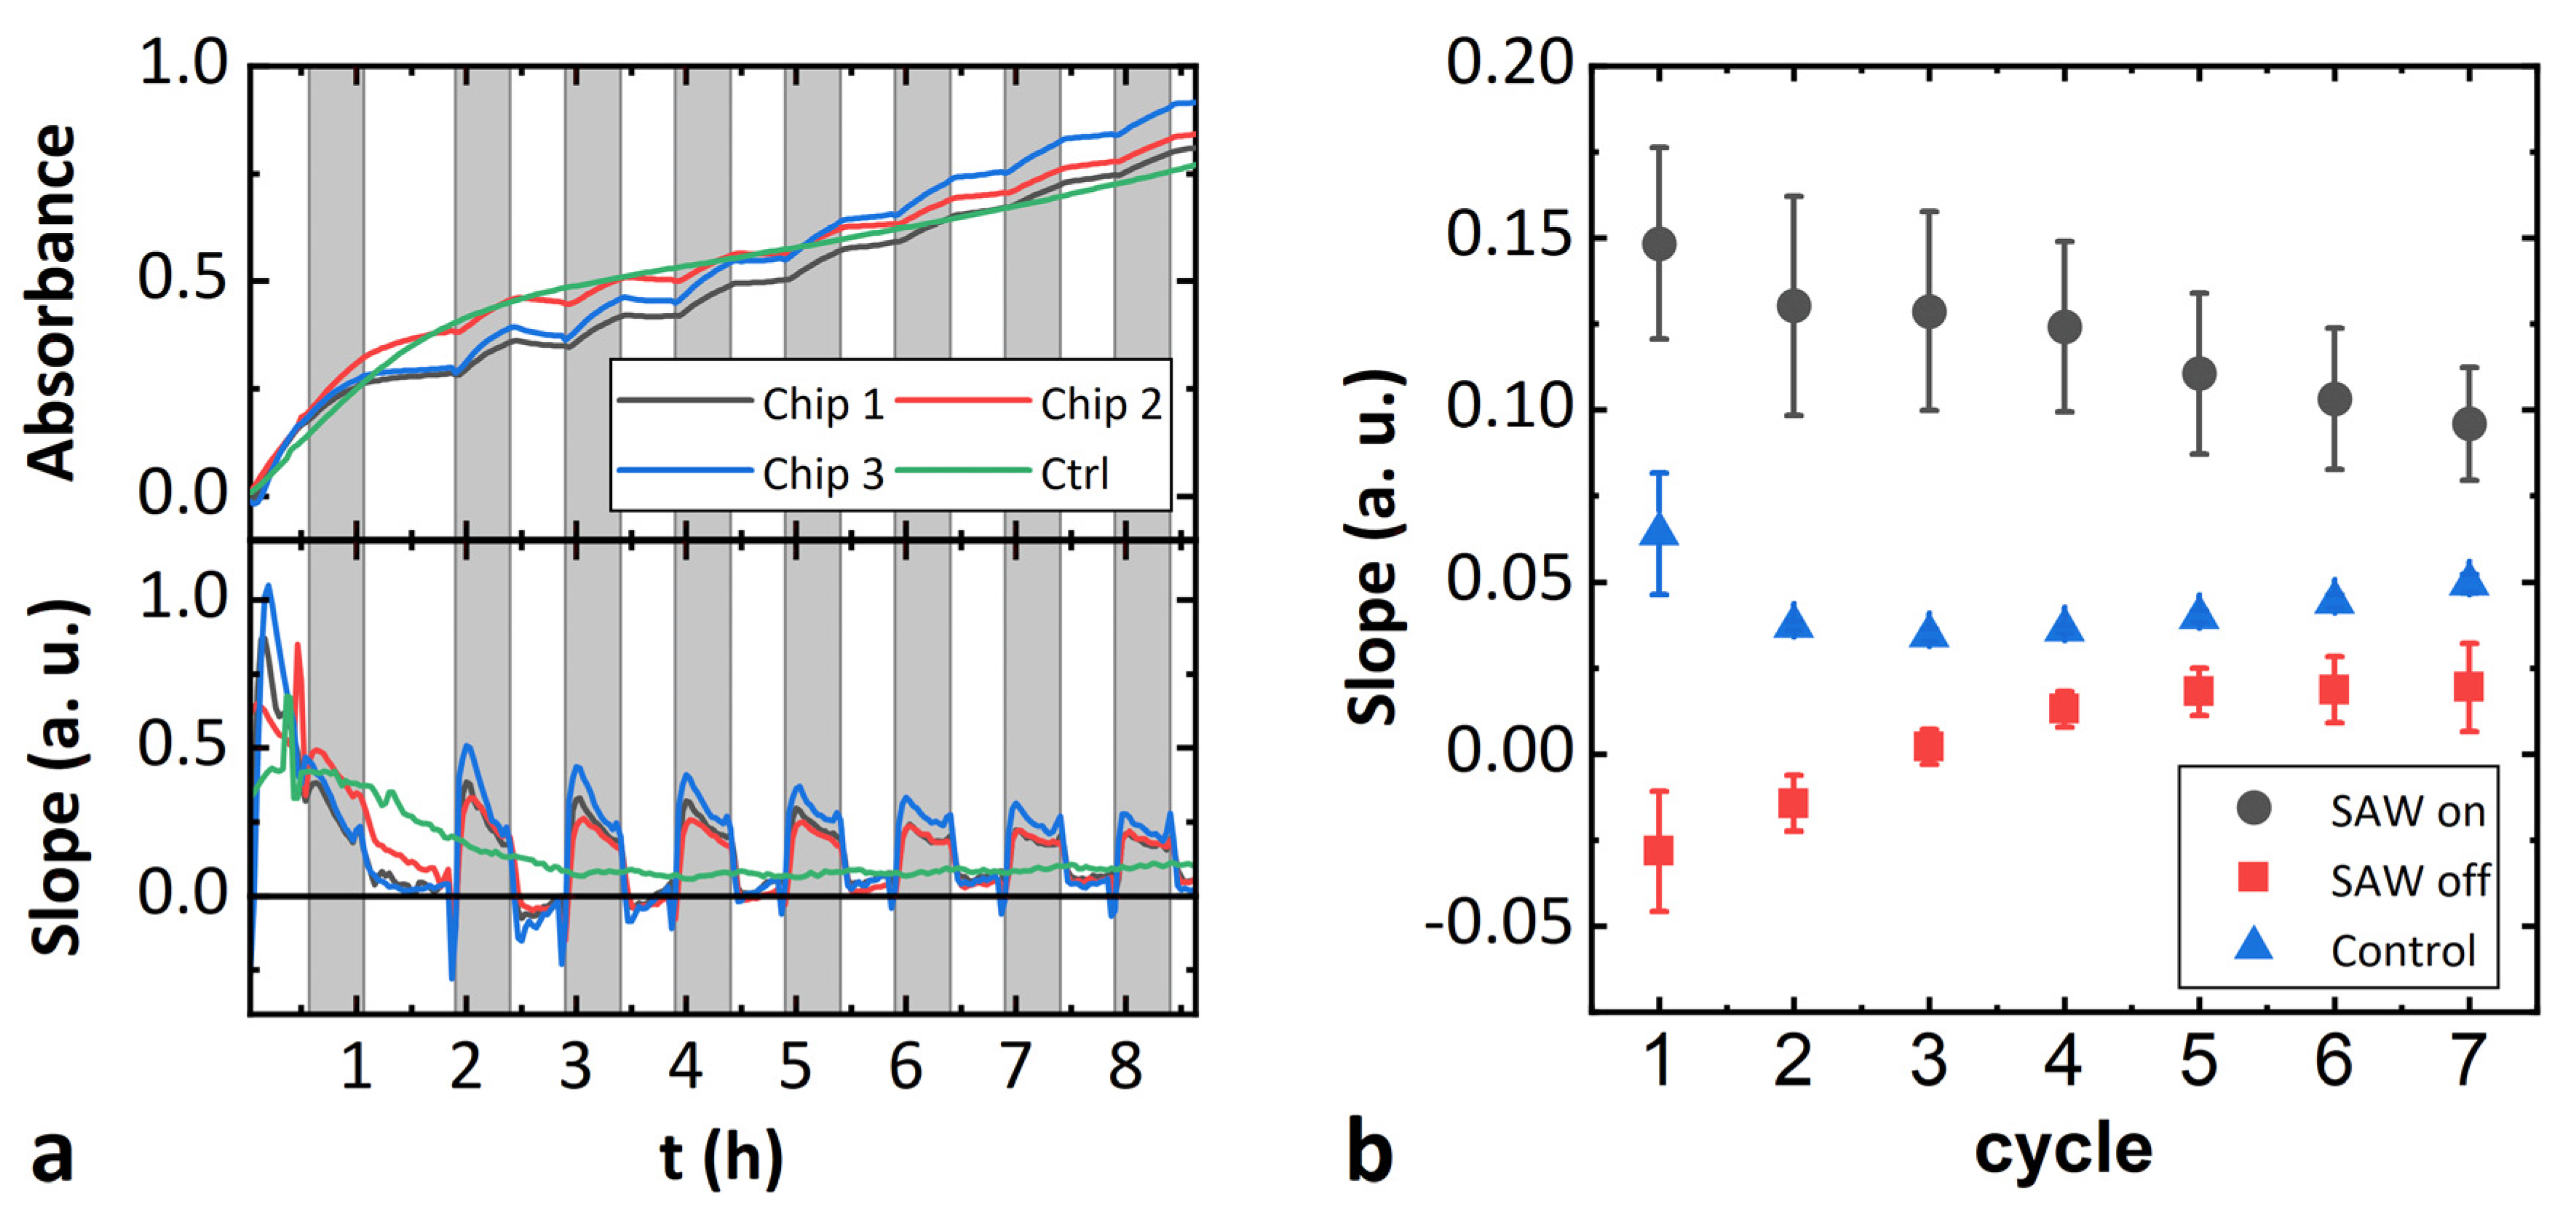
3.3. Influence on Enzyme Activity by Surface Acoustic Waves
3.4. Influence of an Electric Field on Enzyme Activity
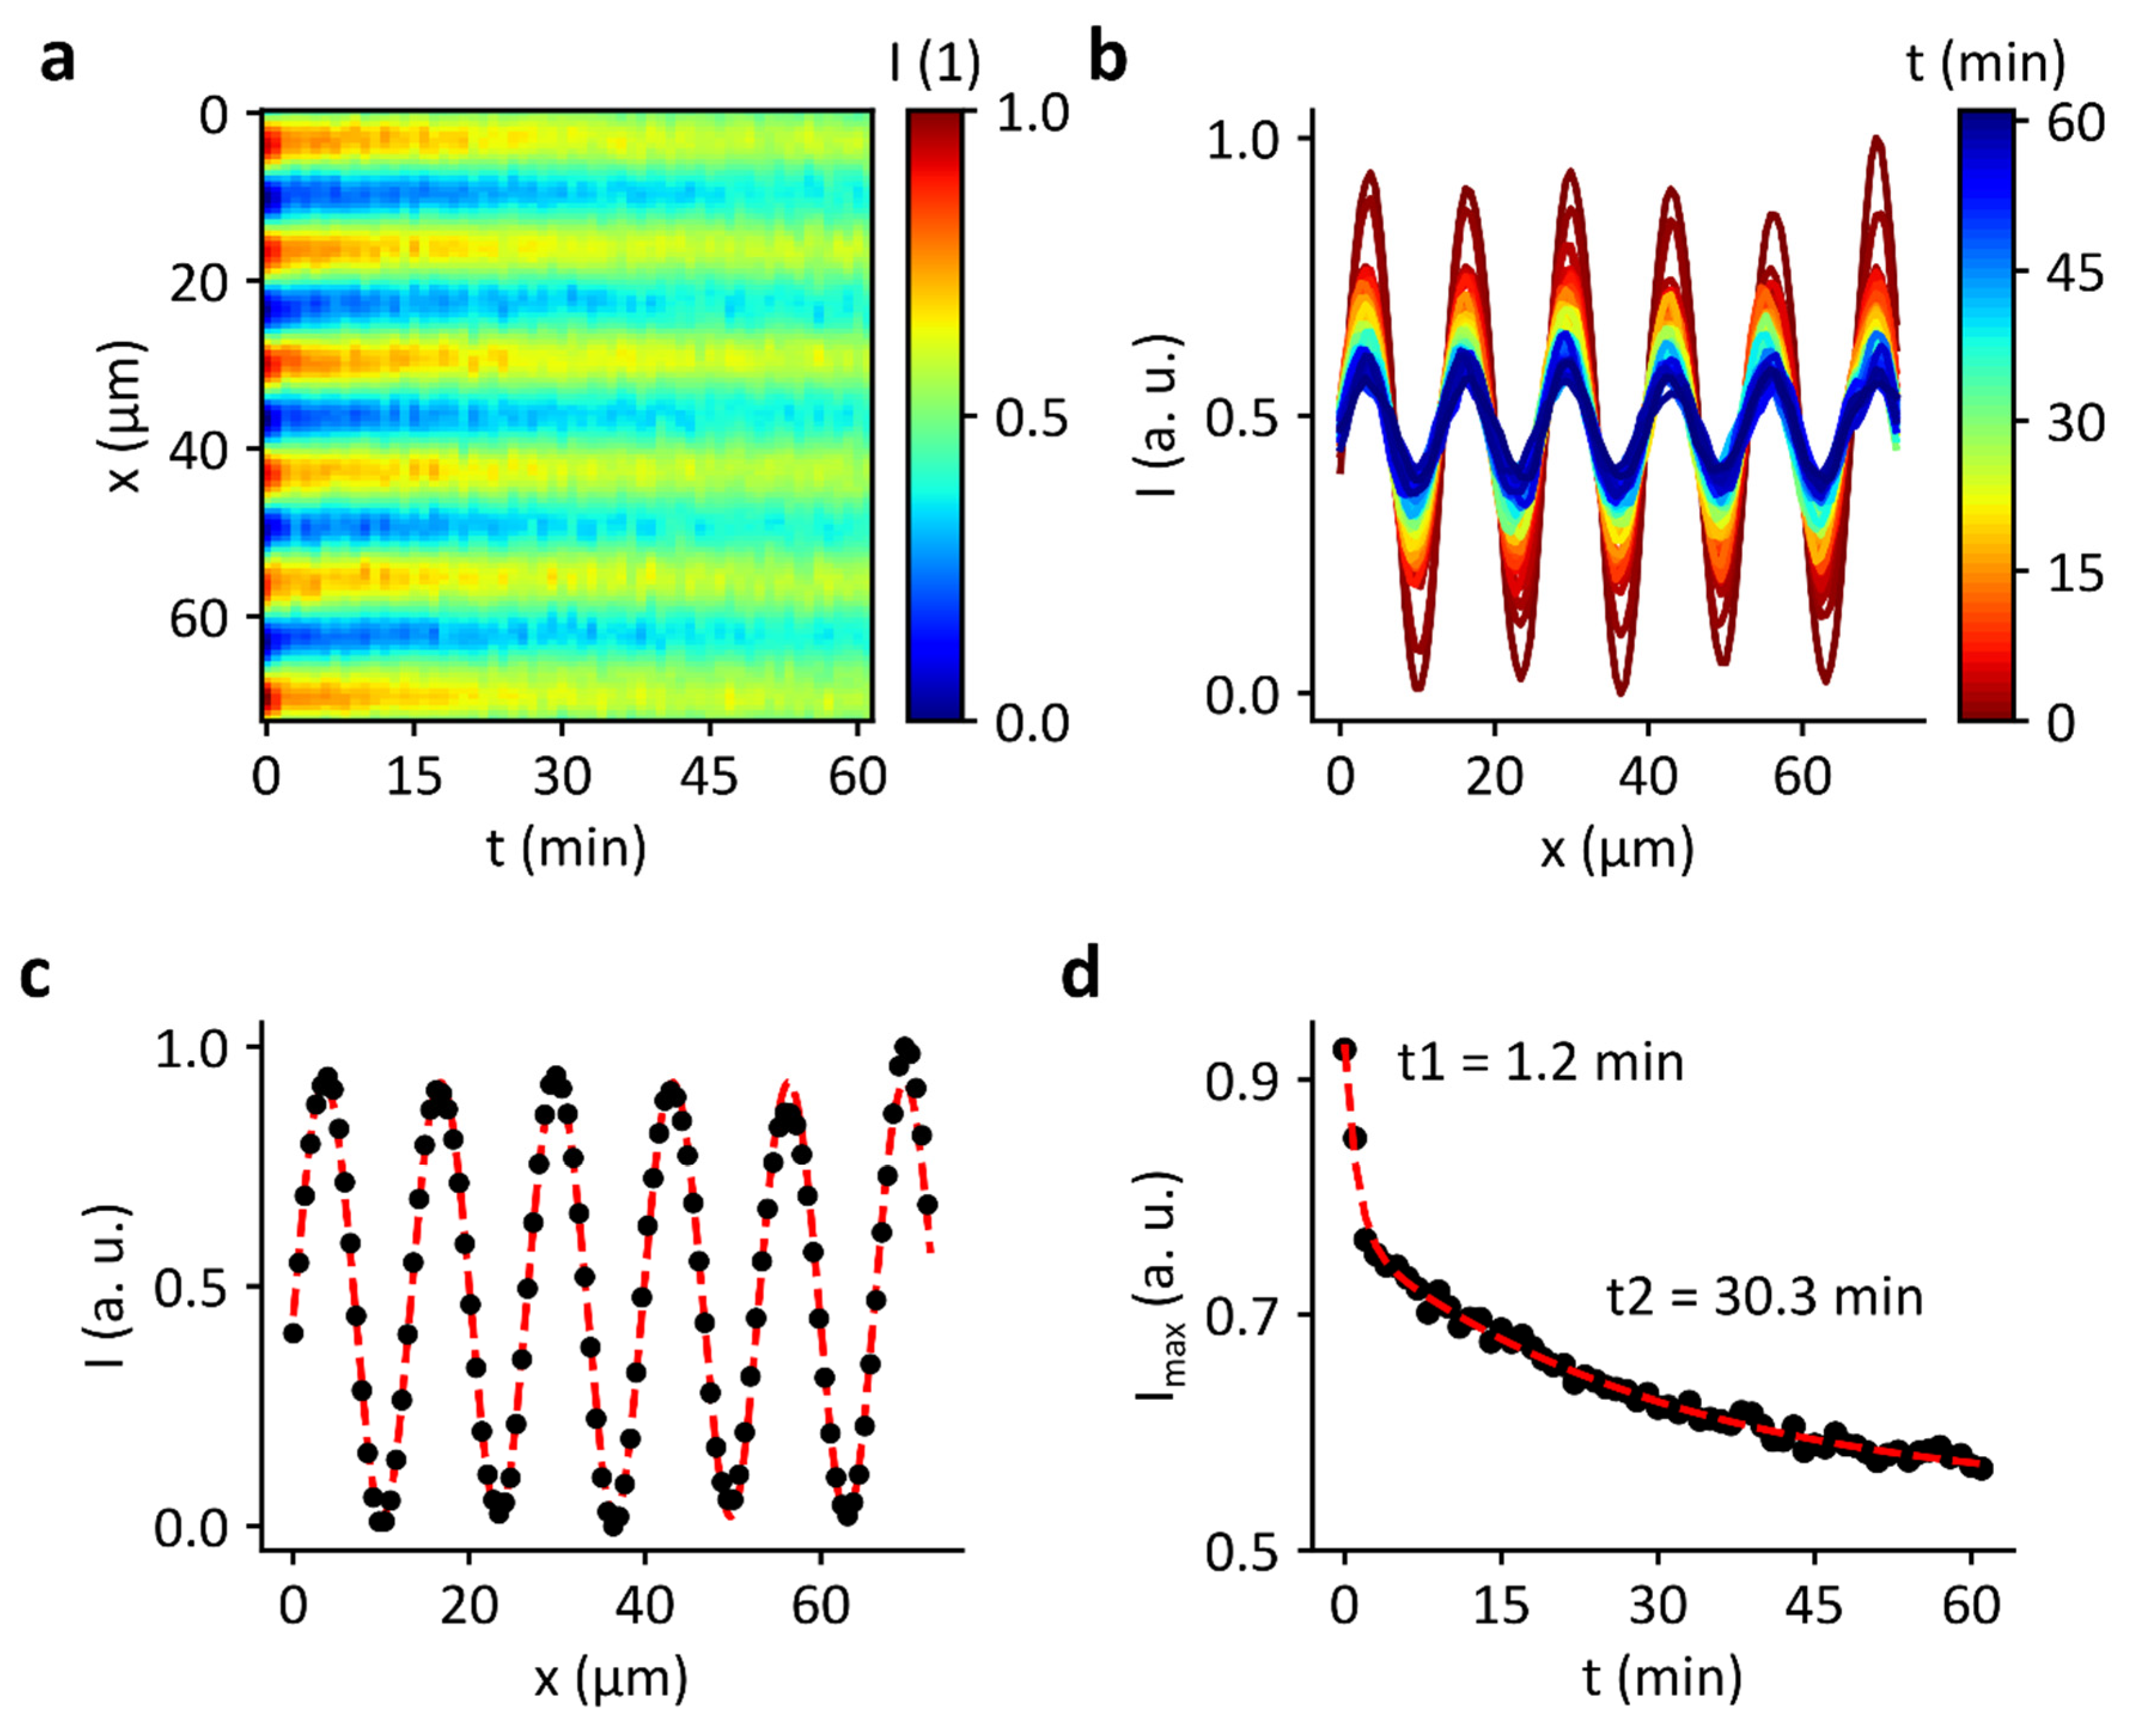
3.5. Decay of Domains
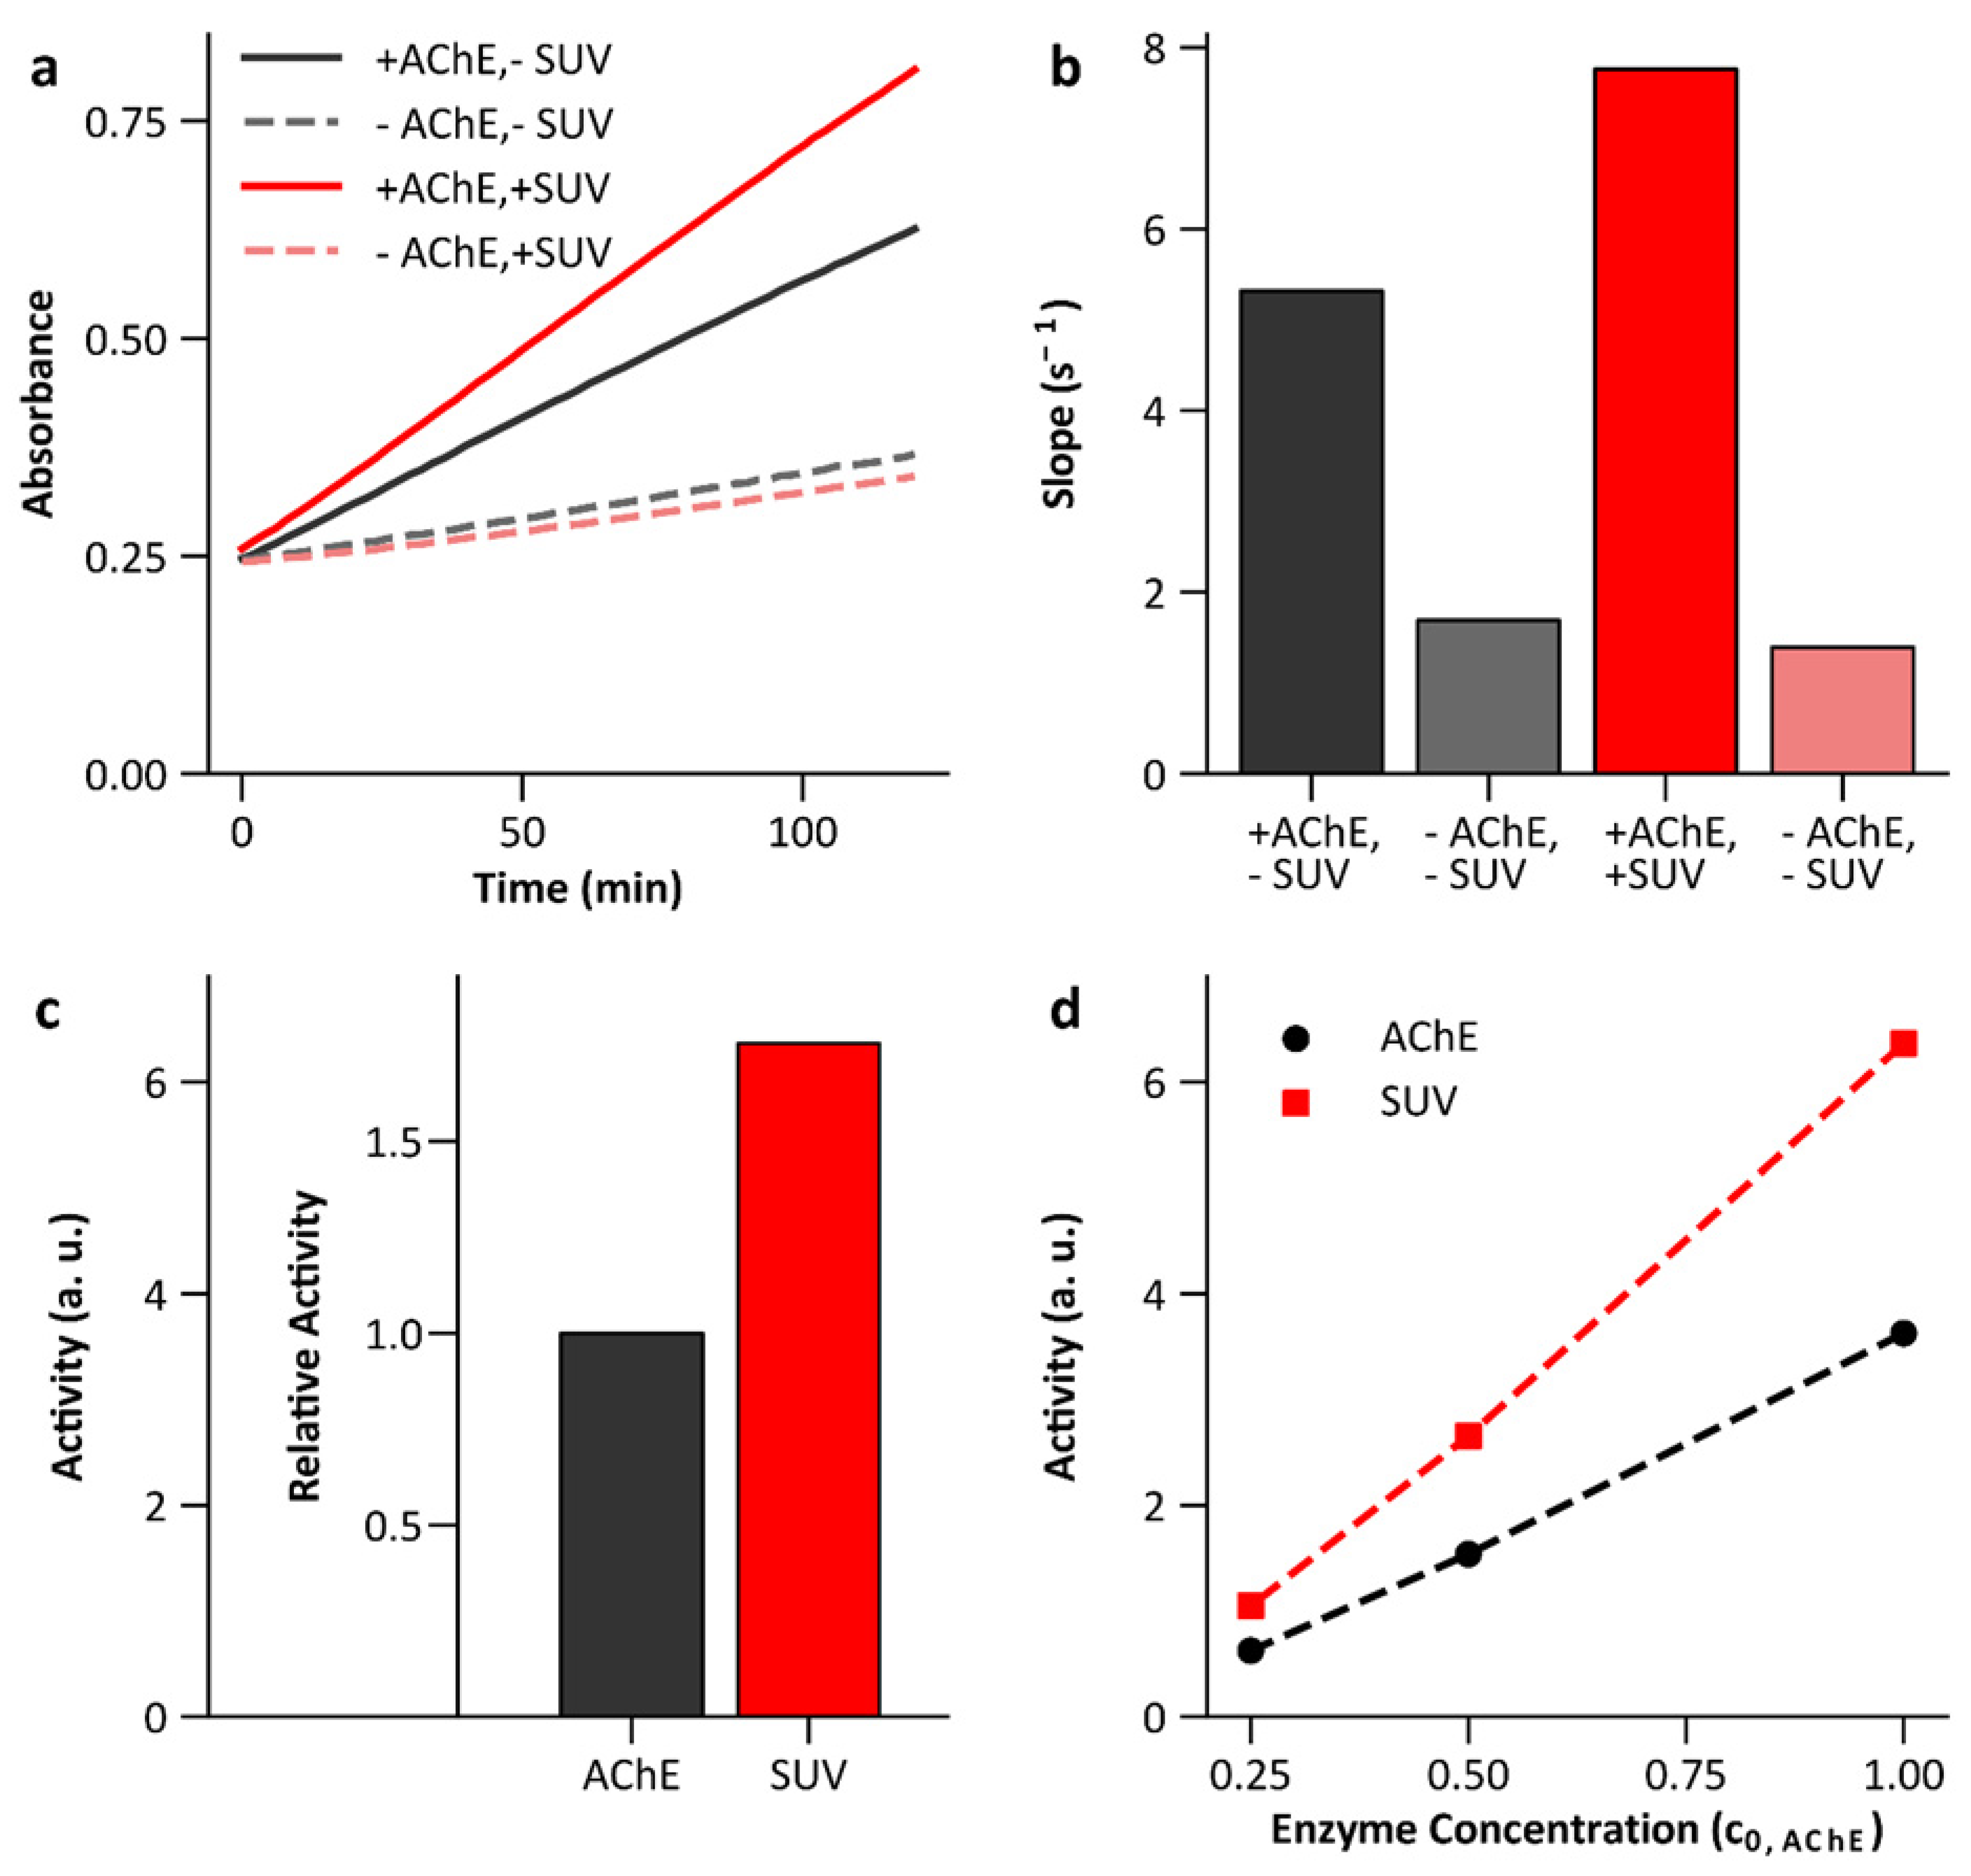
3.6. Enzyme Activity Bound to Lipid Membranes
4. Conclusions
Author Contributions
Funding
Acknowledgments
Conflicts of Interest
References
- Simons, K.; Ikonen, E. Functional Rafts in Cell-Membranes. Nature 1997, 387, 569–572. [Google Scholar] [CrossRef] [PubMed]
- Ono, A.; Freed, E.O. Plasma membrane rafts play a critical role in HIV-1 assembly and release. Proc. Natl. Acad. Sci. USA 2001, 98, 13925–13930. [Google Scholar] [CrossRef] [PubMed] [Green Version]
- Suomalainen, M. Lipid rafts and assembly of enveloped viruses. Traffic 2002, 3, 705–709. [Google Scholar] [CrossRef] [PubMed]
- Jacobson, K.; Mouritsen, O.G.; Anderson, R.G.W. Lipid rafts: At a crossroad between cell biology and physics. Nat. Cell Biol. 2007, 9, 7–14. [Google Scholar] [CrossRef] [PubMed]
- Groves, J.T.; Boxer, S.G. Electric field-induced concentration gradients in planar supported bilayers. Biophys. J. 1995, 69, 1972–1975. [Google Scholar] [CrossRef] [Green Version]
- Groves, J.T.; Ulman, N.; Boxer, S.G. Micropatterning fluid lipid bilayers on solid supports. Science 1997, 275, 651–653. [Google Scholar] [CrossRef]
- Groves, J.T.; Boxer, S.G.; McConnell, H.M. Electric field-induced reorganization of two-component supported bilayer membranes. Proc. Natl. Acad. Sci. USA 1997, 94, 13390–13395. [Google Scholar] [CrossRef] [Green Version]
- Groves, J.T.; Boxer, S.G.; McConnell, H.M. Electric field-induced critical demixing in lipid bilayer membranes. Proc. Natl. Acad. Sci. USA 1998, 95, 935–938. [Google Scholar] [CrossRef] [Green Version]
- Hochrein, M.B.; Leierseder, J.A.; Golubović, L.; Rädler, J.O. DNA localization and stretching on periodically microstructured lipid membranes. Phys. Rev. Lett. 2006, 96, 38103. [Google Scholar] [CrossRef]
- Kung, L.A.; Kam, L.; Hovis, J.S.; Boxer, S.G. Patterning hybrid surfaces of proteins and supported lipid bilayers. Langmuir 2000, 16, 6773–6776. [Google Scholar] [CrossRef]
- Sanii, B.; Smith, A.M.; Butti, R.; Brozell, A.M.; Parikh, A.N. Bending membranes on demand: Fluid phospholipid bilayers on topographically deformable substrates. Nano Lett. 2008, 8, 866–871. [Google Scholar] [CrossRef] [PubMed]
- Hennig, M.; Neumann, J.; Wixforth, A.; Rädler, J.O.; Schneider, M.F. Dynamic patterns in a supported lipid bilayer driven by standing surface acoustic waves. Lab A Chip 2009, 9, 3050–3053. [Google Scholar] [CrossRef] [PubMed]
- Neumann, J.; Hennig, M.; Wixforth, A.; Manus, S.; Rädler, J.O.; Schneider, M.F. Transport, separation, and accumulation of proteins on supported lipid bilayers. Nano Lett. 2010, 10, 2903–2908. [Google Scholar] [CrossRef]
- Hennig, M. Dynamische Strukturierung von Festkörpergestützten Lipidmembranen und Assorbierten Makromolekülen. Ph.D. Thesis, Ludwig-Maximilians-Universität, München, Germay, 2011. [Google Scholar]
- Hennig, M.; Wolff, M.; Neumann, J.; Wixforth, A.; Schneider, M.F.; Rädler, J.O. DNA concentration modulation on supported lipid bilayers switched by surface acoustic waves. Langmuir 2011, 27, 14721–14725. [Google Scholar] [CrossRef] [PubMed]
- Silman, I. The multiple biological roles of the cholinesterases. Prog. Biophys. Mol. Biol. 2020, 162, 41–56. [Google Scholar] [CrossRef] [PubMed]
- Sandermann, H. Regulation of membrane enzymes by lipids. Biochim. Biophys. Acta—Rev. Biomembr. 1978, 515, 209–237. [Google Scholar] [CrossRef]
- Nuschele, S. The Role of Interfaces in Enzyme Activity and Cell Adaptation. Ph.D. Thesis, Universität Augsburg, Augsburg, Germany, 2010. [Google Scholar]
- Fichtl, B. Integration der Biochemie in die Physik der Grenzflächen. Master’s Thesis, Universiät Augsburg, Augsburg, Germany, 2010. [Google Scholar]
- Fichtl, B.; Shrivastava, S.; Schneider, M.F. Protons at the speed of sound: Predicting specific biological signaling from physics. Sci. Rep. 2016, 6, 1–9. [Google Scholar] [CrossRef]
- Kamenac, A.; Obser, T.; Wixforth, A.; Schneider, M.F.; Westerhausen, C. The activity of the intrinsically water-soluble enzyme ADAMTS13 correlates with the membrane state when bound to a phospholipid bilayer. Sci. Rep. 2021, 11, 24476. [Google Scholar] [CrossRef]
- Schneider, M.F.; Nuschele, S.; Shrivastava, S.; Fillafer, C.; Fichtl, B.; Silman, I.; Kaufmann, K. From Thermodynamic States to Biological Function by Einstein’s Approach to Statistical Physics. Biophys. J. 2012, 102, 292a. [Google Scholar] [CrossRef] [Green Version]
- Kaufmann, K. My theory. Anahit AB Publ. 2009, 2, 3. [Google Scholar]
- Brian, A.A.; McConnell, H.M. Allogeneic stimulation of cytotoxic T cells by supported planar membranes. Proc. Natl. Acad. Sci. USA 1984, 81, 6159–6163. [Google Scholar] [CrossRef] [PubMed] [Green Version]
- Bayerl, T.M.; Bloom, M. Physical properties of single phospholipid bilayers adsorbed to micro glass beads. A new vesicular model system studied by 2H-nuclear magnetic resonance. Biophys. J. 1990, 58, 357–362. [Google Scholar] [CrossRef] [Green Version]
- Kalb, E.; Frey, S.; Tamm, L.K. Formation of supported planar bilayers by fusion of vesicles to supported phospholipid monolayers. Biochim. Biophys. Acta (BBA)-Biomembr. 1993, 1103, 307–316. [Google Scholar] [CrossRef]
- Keller, C.A.; Kasemo, B. Surface specific kinetics of lipid vesicle adsorption measured with a quartz crystal microbalance. Biophys. J. 1998, 75, 1397–1402. [Google Scholar] [CrossRef] [Green Version]
- Cremer, P.S.; Boxer, S.G. Formation and spreading of lipid bilayers on planar glass supports. J. Phys. Chem. B 1999, 103, 2554–2559. [Google Scholar] [CrossRef]
- Keller, C.A.; Glasmästar, K.; Zhdanov, V.P.; Kasemo, B. Formation of supported membranes from vesicles. Phys. Rev. Lett. 2000, 84, 5443. [Google Scholar] [CrossRef]
- Reviakine, I.; Brisson, A. Formation of supported phospholipid bilayers from unilamellar vesicles investigated by atomic force microscopy. Langmuir 2000, 16, 1806–1815. [Google Scholar] [CrossRef]
- Ellman, G.L. Tissue sulfhydryl groups. Arch. Biochem. Biophys. 1959, 82, 70–77. [Google Scholar] [CrossRef]
- Ellman, G.L.; Courtney, K.D.; Andres, V., Jr.; Featherstone, R.M. A new and rapid colorimetric determination of acetylcholinesterase activity. Biochem. Pharmacol. 1961, 7, 88–95. [Google Scholar] [CrossRef]
- Dietrich, C.; Merkel, R.; Tampe, R. Diffusion measurement of fluorescence-labeled amphiphilic molecules with a standard fluorescence microscope. Biophys. J. 1997, 72, 1701–1710. [Google Scholar] [CrossRef] [Green Version]
- Hochrein, M.B.; Reich, C.; Krause, B.; Rädler, J.O.; Nickel, B. Structure and mobility of lipid membranes on a thermoplastic substrate. Langmuir 2006, 22, 538–545. [Google Scholar] [CrossRef] [PubMed]
- Horton, M.R.; Reich, C.; Gast, A.P.; Rädler, J.O.; Nickel, B. Structure and dynamics of crystalline protein layers bound to supported lipid bilayers. Langmuir 2007, 23, 6263–6269. [Google Scholar] [CrossRef] [PubMed]
- Hohner, A.O.; David, M.P.C.; Rädler, J.O. Controlled solvent-exchange deposition of phospholipid membranes onto solid surfaces. Biointerphases 2010, 5, 1–8. [Google Scholar] [CrossRef] [PubMed] [Green Version]
- Merkel, R.; Sackmann, E.; Evans, E. Molecular friction and epitactic coupling between monolayers in supported bilayers. J. Phys. 1989, 50, 1535–1555. [Google Scholar] [CrossRef]
- Färber, N.; Westerhausen, C. Broad lipid phase transitions in mammalian cell membranes measured by Laurdan fluorescence spectroscopy. Biochim. Biophys. Acta—Biomembr. 2022, 1864, 183794. [Google Scholar] [CrossRef]
- Fichtl, B.; Silman, I.; Schneider, M.F. On the Physical Basis of Biological Signaling by Interface Pulses. Langmuir 2018, 34, 4914–4919. [Google Scholar] [CrossRef] [Green Version]


Publisher’s Note: MDPI stays neutral with regard to jurisdictional claims in published maps and institutional affiliations. |
© 2022 by the authors. Licensee MDPI, Basel, Switzerland. This article is an open access article distributed under the terms and conditions of the Creative Commons Attribution (CC BY) license (https://creativecommons.org/licenses/by/4.0/).
Share and Cite
Schnitzler, L.G.; Baumgartner, K.; Kolb, A.; Braun, B.; Westerhausen, C. Acetylcholinesterase Activity Influenced by Lipid Membrane Area and Surface Acoustic Waves. Micromachines 2022, 13, 287. https://doi.org/10.3390/mi13020287
Schnitzler LG, Baumgartner K, Kolb A, Braun B, Westerhausen C. Acetylcholinesterase Activity Influenced by Lipid Membrane Area and Surface Acoustic Waves. Micromachines. 2022; 13(2):287. https://doi.org/10.3390/mi13020287
Chicago/Turabian StyleSchnitzler, Lukas G., Kathrin Baumgartner, Anna Kolb, Benedikt Braun, and Christoph Westerhausen. 2022. "Acetylcholinesterase Activity Influenced by Lipid Membrane Area and Surface Acoustic Waves" Micromachines 13, no. 2: 287. https://doi.org/10.3390/mi13020287