Abstract
The temperature dependence of photoluminescence (PL) emission is a valuable tool for investigating carrier localization, recombination, and carrier–phonon interactions. Herein, electron–phonon couplings in lead sulfide (PbS) quantum dots (QDs) and lead sulfide/manganese tellurite (PbS/MnTe) QDs is reported. The effect of temperature on the PL emission of PbS and PbS/MnTe was explored within a temperature range of 10 to 300 K. When temperature increased, PL emission was blue-shifted due to the confinement effect. The gradual broadening of the full width at half maximum (FWHM) with increasing temperature indicates electron–phonon interactions. An analysis based on the Boson model revealed that the values of the exciton acoustic phonon coupling coefficient, σ, and temperature-dependent linewidth, γ, for PbS/MnTe were larger than those for PbS, indicating stronger exciton longitudinal-optical–phonon coupling in the compound structure.
1. Introduction
In recent decades, semiconductor quantum dots (QDs) have attracted considerable attention from researchers because of their enormous size-dependent electronic and optical properties [1]. Due to their unique properties such as photostability [2] and bright and narrow photoluminescence (PL) [3,4], QDs are attractive candidates for many future applications such as bioimaging [5], photovoltaics [6], biosensors [7], and photodetectors [8].
Lead sulfide (PbS) QDs have been studied by many researchers due to their narrow bandgap of 0.41 eV and large exciton Bohr radius of ~18 nm, which provide strong quantum confinement effects in large nanocrystals compared with CdS, which has a small Bohr exciton radius of ~6 nm [9,10]. In addition, near-infrared (NIR) PbS QDs have emerged as a promising tool for in vivo deep-tissue imaging applications [11], NIR optoelectronics [12,13], and solar cells [14]. However, QDs possess a high surface-to-volume ratio, making them prone to surface defect/trap formation, which acts as a non-radiative recombination center within QDs, thereby reducing the confinement effect and material stability [15]. This problem can be solved by stabilizing QDs by chemical modification and optimizing the fluorescence of the QD core [16].
By providing effective surface passivation, the shell layer may function as a barrier to protect QD cores from oxidation [17]. Furthermore, by utilizing a larger bandgap material for the shell, the charge carrier may be confined in the core region and protected from surface interactions and the surrounding environment [18,19]. Thus, core/shell QDs will enhance stability against photodegradation and reduce the number of surface dangling bonds [20,21]. Manganese telluride (MnTe) with a bandgap of MnTe 1.3 eV is ideal for this purpose [22]. PbS/MnTe belongs to type-I QDs where the electrons and holes are confined in the core region, thus increasing the confinement energy of QDs, which is useful for applications such as solar cells [23,24]. To date, there have been no reports on the behavior of PbS mixed with MnTe.
This study focuses on the influence of the PbS mixed with MnTe on the optical properties of QDs. The characteristics of PbS and PbS/MnTe QDs PL emission were assessed in the temperature range of 10 K to 300 K. This study also discusses the morphological characteristics of PbS and PbS/MnTe QDs fabricated via colloidal synthesis.
2. Materials and Methods
2.1. Materials
1-thioglycerol (TGL, 95%) and dithioglycerol (DTG, 95%) were purchased from Sigma Aldrich (Irvine, UK). Lead (II) acetate trihydrate (Pb(CH3COO)2.3H2O, 99.99%), sodium sulfide nonahydrate (Na2S·9H2O, 99.99%), manganese (II) acetate hydrate (Mn(CH3CO2)2·4H2O, 98%), and hydrazine hydrate (N2H4, 80%) were obtained from R&M Chemicals (London, UK). Triethylamine (99.5%) was purchased from Chemiz (Shah Alam, Malaysia) and sodium tellurite (Na2TeO3, 95%) was purchased from Aladdin (Shanghai, China). Deionized water was used throughout the experiments, and all chemicals were used without further purification.
2.2. Synthesis of Quantum Dots
PbS QDs were synthesized in an aqueous solution following the procedure as reported in a previous work [25]. Briefly, Pb(CH3COO)2.3H2O (0.190 g), TGL (26 µL), and DTG (10 µL) were dissolved in deionized water, and the mixture was stirred for 15 min under the flow of nitrogen (N2) gas. Then, the pH of the solution was adjusted to ~10 by the dropwise addition of triethylamine. Subsequently, the S2− precursor was prepared by dissolving Na2S·9H2O in deionized water. Next, Pb2+ and S2− precursors were mixed and stirred for at least 30 min to form a PbS QDs solution. The molar ratio of Pb2+ to S2− was 1:0.3. Meanwhile, the precursor of MnTe was prepared by dissolving 0.060 g of Mn(CH3CO2)2·4H2O, 0.032 g Na2TeO3, and 0.05 g N2H4 in deionized water. The molar ratio of Mn2+ to Te2− was fixed at 1:1. Subsequently, the MnTe precursor was added to the PbS solution and stirred for 30 min under the flow of N2.
2.3. Sample Characterisation
The PL measurements were carried out using a customized setup equipped with a 532 nm diode-pumped solid-state laser (CNI Laser, Changchun, China), double monochromator (Horiba, Kyoto, Japan), a lock-in amplifier (Stanford Research Systems, Sunnyvale, CA, USA), a chopper (Stanford Research System, Sunnyvale, CA, USA), an InGaAs detector (Horiba, Kyoto, Japan), and temperature controller (LakeShore, Westerville, OH, USA). The temperature-dependent PL was measured between 10 and 300 K in a closed-cycle He cryostat system. For PL measurements, the samples were drop-cast onto a glass substrate. High-resolution transmission electron microscopy (HRTEM) and energy-dispersive X-ray spectroscopy (EDX) were employed for structural characterization. The diluted PbS QDs and PbS/MnTe QDs were drop-cast onto a Cu grid and then covered with an ultrathin-coated film. HRTEM was used to determine the size distribution, shape, and particle size of the QDs in the sample, and EDX was used to determine the elemental composition of the samples.
3. Results and Discussion
3.1. High-Resolution Transmission Electron Microscopy (HRTEM)
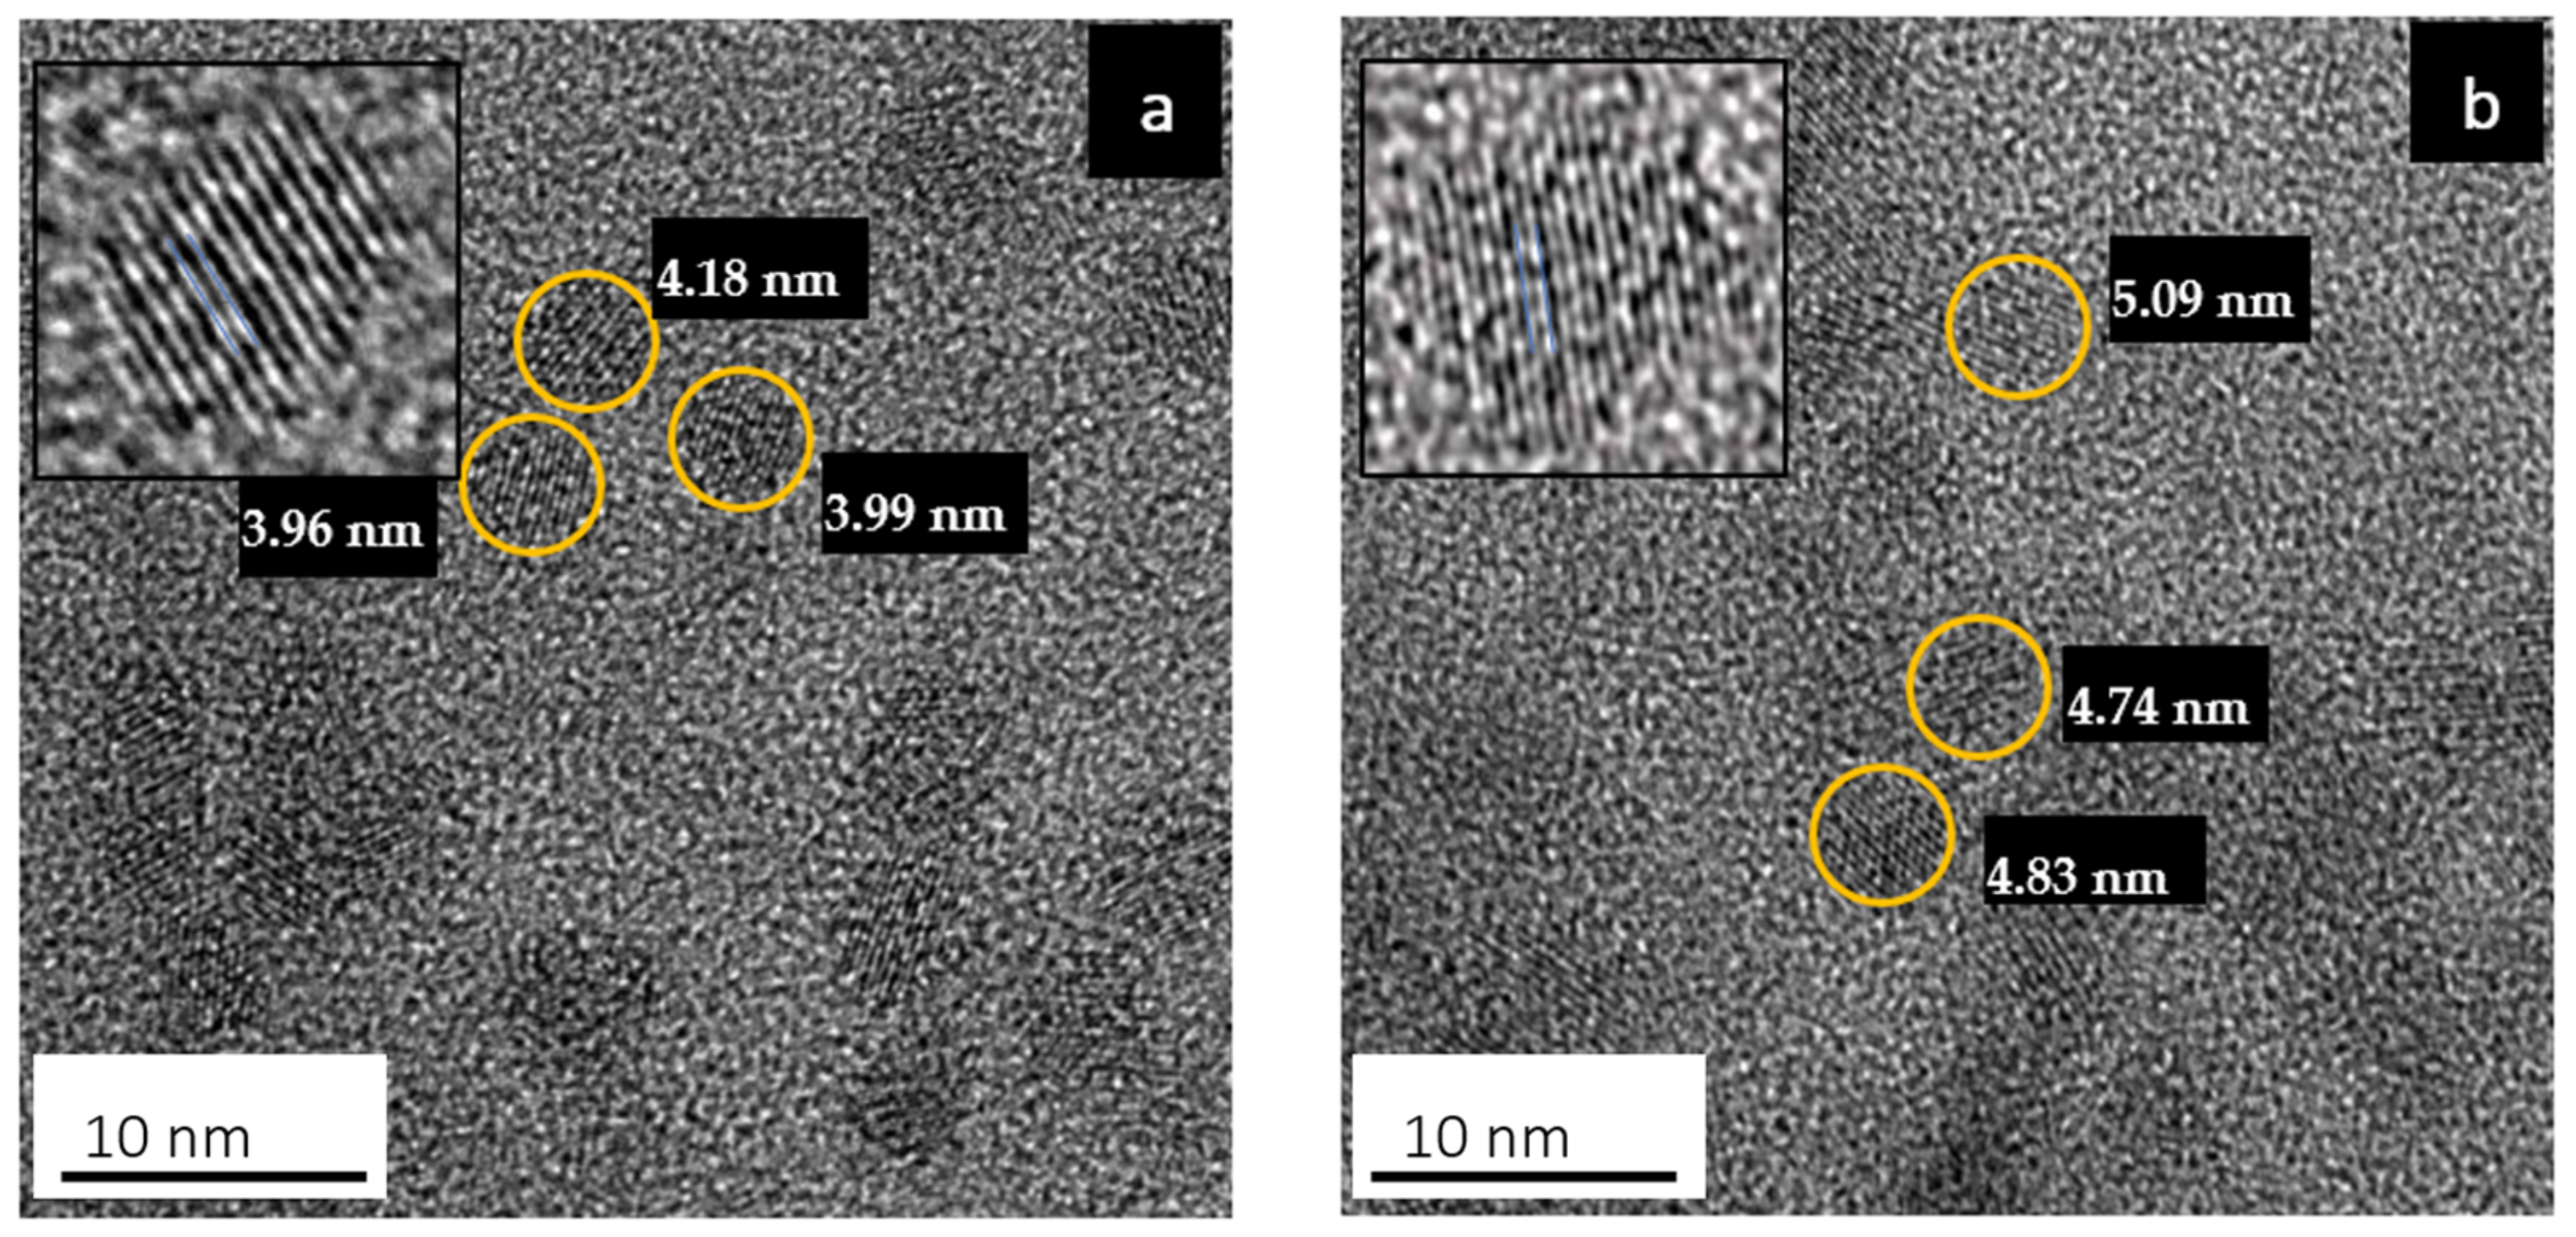
Figure 1 shows HRTEM images of the colloidal PbS and PbS/MnTe QDs. Both samples exhibited monodispersed crystalline and spherical particles. As shown in Figure 1a, the average diameter of the PbS QDs is 4.1 ± 0.8 nm. The size enlargement in PbS/MnTe is observed in Figure 1b, with an average diameter of PbS/MnTe being 4.4 ± 0.6 nm. A size increment of ~0.4 nm was expected due to the addition of MnTe.

Figure 1.
HRTEM images of (a) PbS QDs and (b) PbS/MnTe compound QDs in an aqueous solution.
3.2. Energy Dispersive X-ray (EDX)
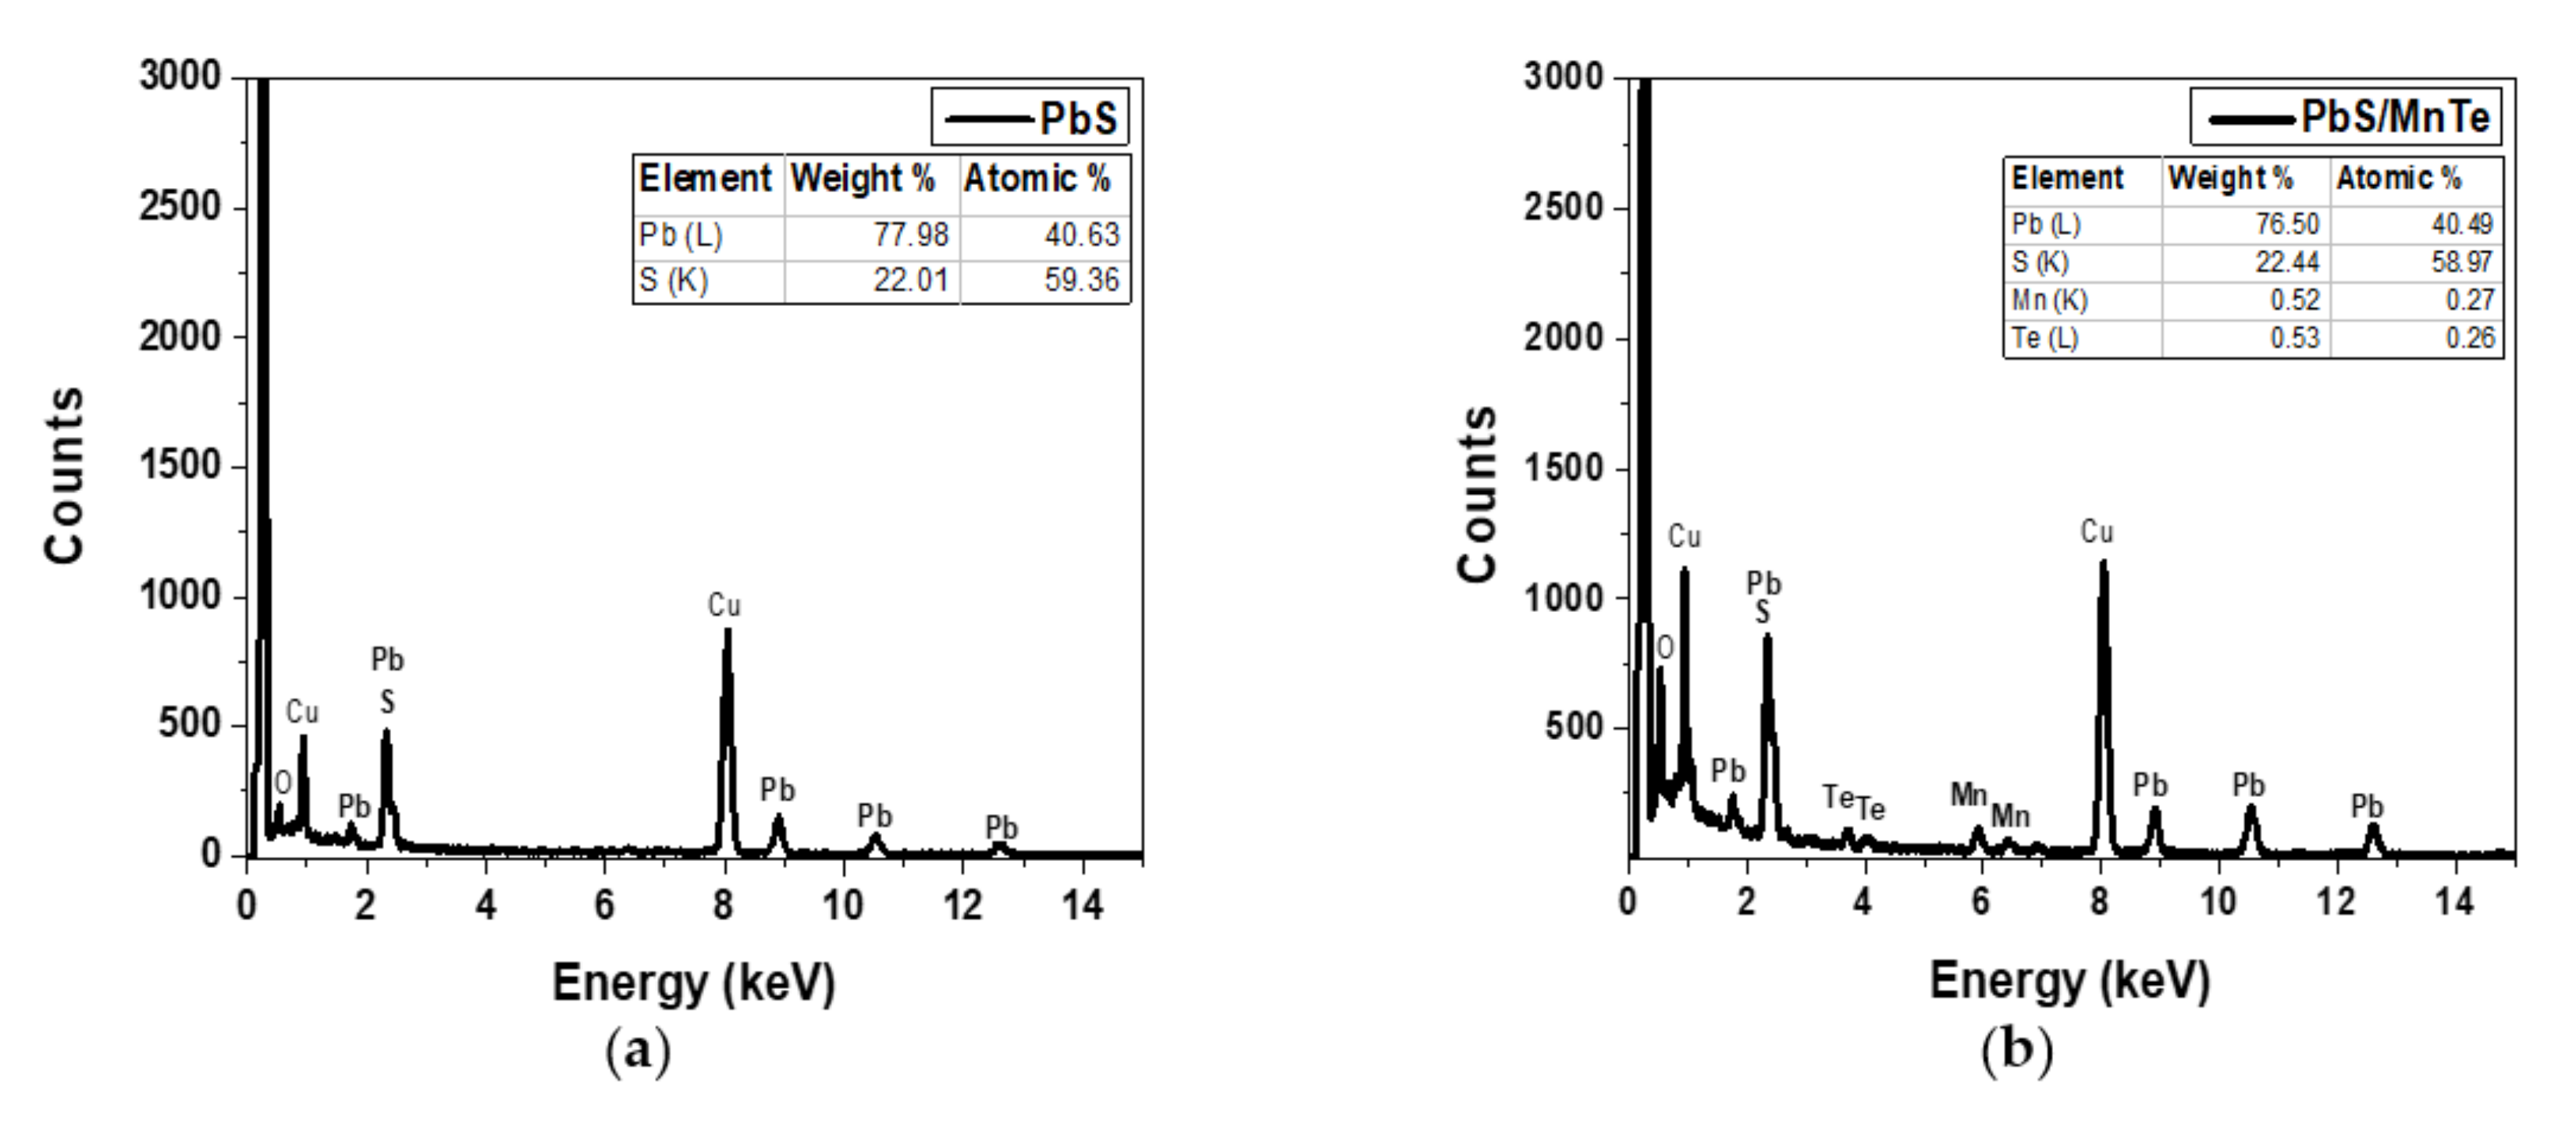
The EDX spectra of the PbS and PbS/MnTe samples are presented in Figure 2. The Cu peaks observed in Figure 2a,b correspond to the copper grid used in the HRTEM, whereas the overlapping peaks at 2.3 keV confirm the presence of Pb and S. The atomic percentage ratio between Pb and S is 1:4 is compared to 1:0.3, as mentioned in sample preparation. The higher amount of S, which is four times higher than Pb, might be due to the capping ligands on the surface of PbS QDs (TGL and DTG) that have functional groups of sulfur atoms [26]. Figure 2b supports the existence of Mn and Te, which were observed at 5.9 keV and 3.7 keV, respectively, in addition to Pb and S.
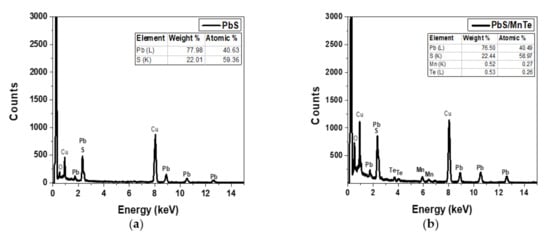
Figure 2.
EDX spectrum of (a) PbS QDs and (b) PbS/MnTe QDs.
3.3. Photoluminescence (PL)
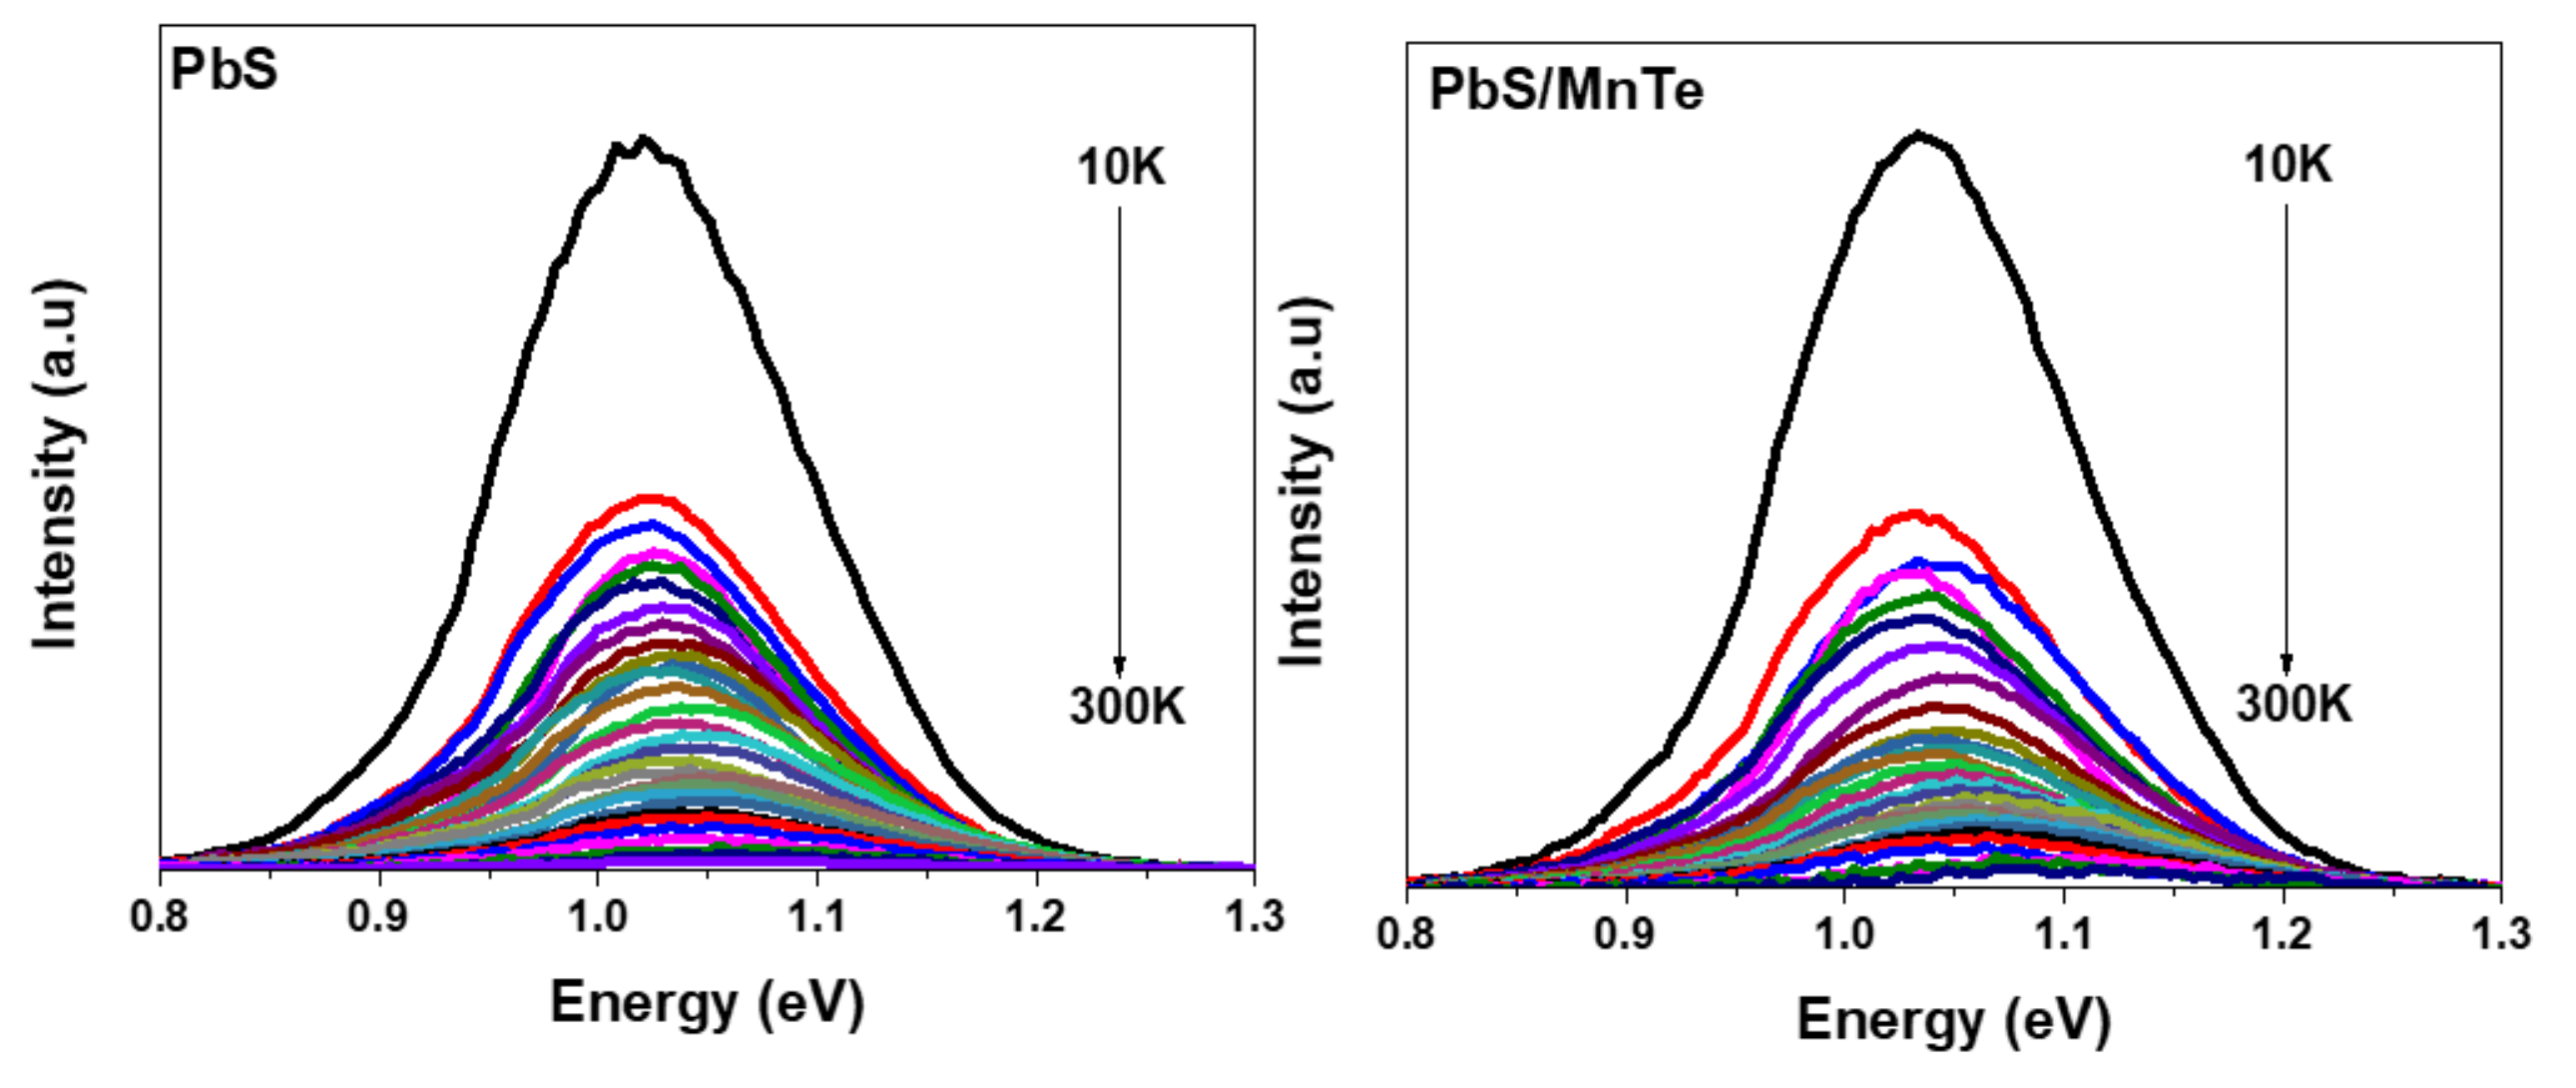
Figure 3 shows the PL spectra of PbS and PbS/MnTe measured at temperatures between 10 and 300 K. Generally, the PL intensity of both samples increases with a decrease in temperature. This is probably due to the electron–phonon coupling [27]. Moreover, the spectral peak blue-shifted with the increase in temperature for both samples, as presented in Figure 4. The blue shift of the PL energy peaks with temperature can be explained by the thermal expansion of the crystal lattice and electron–phonon coupling [28]. The charge carriers at the core of the QDs interact with lattice vibrations through phonons. Because the charge carriers are randomly frozen into QDs states at low temperatures, the PL spectrum represents the distribution of QDs energies. The interaction between the charge carriers and phonons causes a uniform widening of the optical linewidth as the temperature rises. Furthermore, the increase in phonon scattering causes a decrease in PL intensity. The blue shift in the PL peak energy is due to thermal expansion, where strain on the QDs increases as temperature increases.
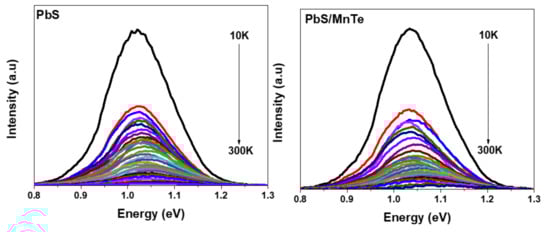
Figure 3.
PL spectra of PbS QDs and PbS/MnTe QDs at temperatures between 10 K and 300 K.
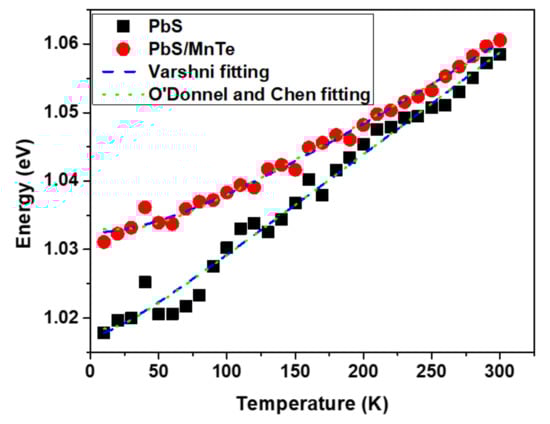
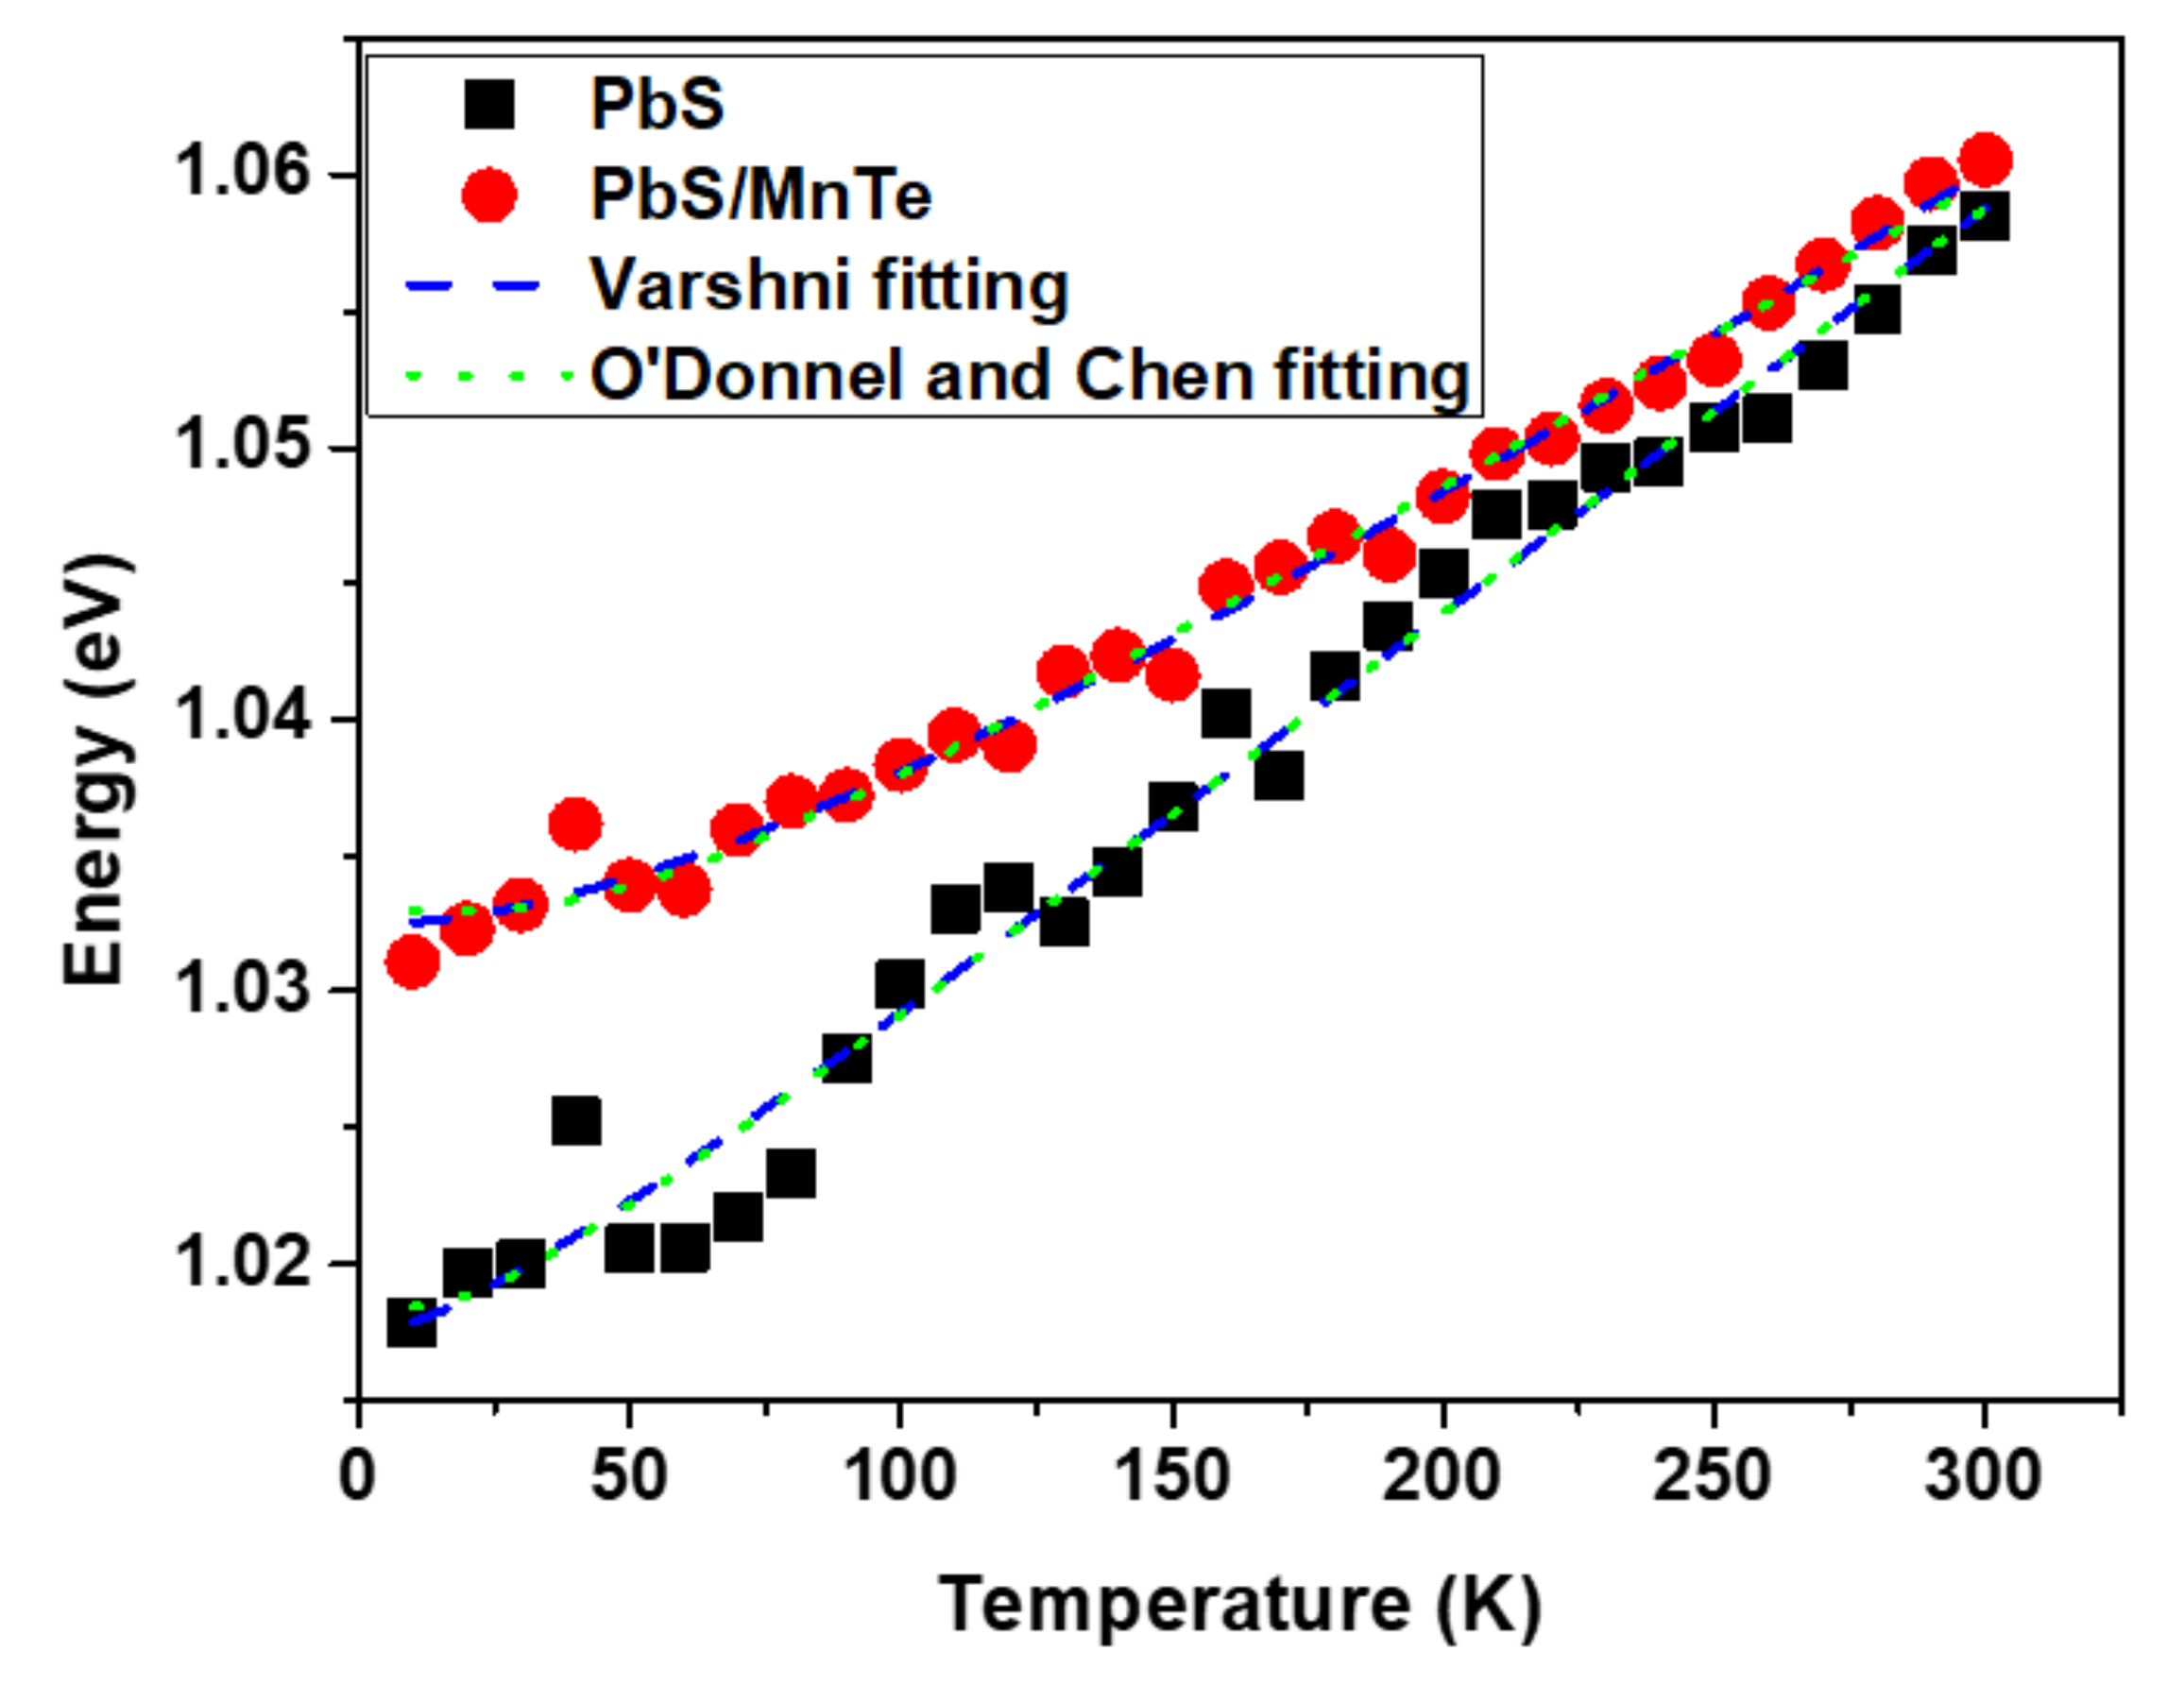
Figure 4.
The variation of PL peak energy as a function of the temperature of PbS and PbS/MnTe.
As observed in Figure 4, the peak energy of the PbS QDs was shifted from 1.018 eV to 1.059 eV. However, in PbS/MnTe, the peak energy shifted from 1.031 to 1.061 eV. This indicates that the presence of MnTe allows the emission spectrum to be tuned to a higher energy. Furthermore, the energy shift in PbS/MnTe is smaller than that in PbS, with an energy shift of ~30 meV probably due to thermal expansion [29]. The thermal expansion coefficient can be explained by fitting data in Figure 4 using Equation (1) as presented by Varshni [30]:
where Eg(0) is the bandgap at T = 0 K, α is the temperature coefficient of the bandgap energy, and β is a constant of the order of magnitude of the semiconductor material’s Debye temperature. Equation (1) was modified by changing the negative sign in the second term to the positive sign since the bandgap energy of PbS QDs increases with the increasing temperature, which is in contrast to other materials [25]. Several factors can contribute to the increase in the energy bandgap of the QDs with temperature. The thermal expansions of the crystal lattice and electron–phonon coupling are included [31,32]. Consequently, the strain between the thermal expansion mismatches also causes a change in the energy bandgap of QDs with temperature [33]. The strain on QDs increases as the temperature rises.
The value of the temperature coefficient, α = dE/dT, can be extracted from the peak energy versus temperature graph in Figure 4. Based on the graph, the value α for PbS QDs is 0.15 meV/K, which is smaller than bulk PbS [34] but comparable to other PbS QDs that were reported [32]. However, the value of α for the PbS/MnTe compound QDs decreased slightly (α = 0.11 meV/K). Generally, the value of dE/dT is mainly attributed to the thermal expansion coefficient and electron–phonon interactions [35,36]. In specific terms, the value of the thermal expansion coefficient of bulk MnTe (−3.42 meV/K) was smaller than that of PbS in bulk (0.52 meV/K). Consequently, the lower dE/dT value of the PbS/MnTe compound QDs was caused by the negative value of the thermal expansion coefficient of bulk MnTe. Additionally, the presence of MnTe limits the lattice dilation of the PbS core. In addition, the electron–phonon interactions might also be a reason for the reduction in dE/dT [34]. The electron–phonon coupling strength in semiconductor nanostructures can be explained by the Huang–Rhys factor as in previous work [37,38]. Figure 4 shows the graph fitted using Equation (2) [39]:
where Eg(0) is the value of the bandgap at 0 K, S is the Huang–Rhys factor, ELO is the average phonon energy, and kB is the Boltzmann constant. The value of S for PbS and PbS/MnTe obtained from the fitting results is 0.4 and 0.7, respectively, while the value of ELO is 5 meV and 12 meV, respectively. The values obtained are in good agreement with previous work [40]. This increase in value indicates an increase in phonon coupling in the presence of MnTe.
Figure 5 shows the temperature dependence of FWHM for PbS and PbS/MnTe. Broadening of the FWHM of both samples was observed when the temperature increased from 10 to 300 K due to electron–phonon interactions. The temperature dependence of the FWHM can be represented by the Boson model in Equation (3):
where Γinh is the inhomogeneous broadening term, σ is the exciton acoustic phonon coupling coefficient, γ is the temperature-dependent linewidth parameter characterizing the total linewidth due to the exciton longitudinal-optical (LO) phonon interaction, and is the Bose–Einstein distribution of the LO phonon. All data were fitted by setting equal to the energy of LO phonons in PbS [41]. The parameters of Γinh, σ, and γ from Equation (2) for PbS and PbS/MnTe are listed in Table 1.
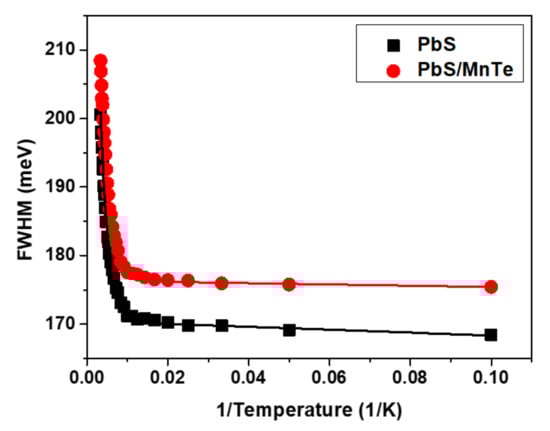
Figure 5.
Temperature dependence of the FWHM for PbS and PbS/MnTe.

Table 1.
Parameters obtained from Equation (2) that have been fitted as in Figure 5.
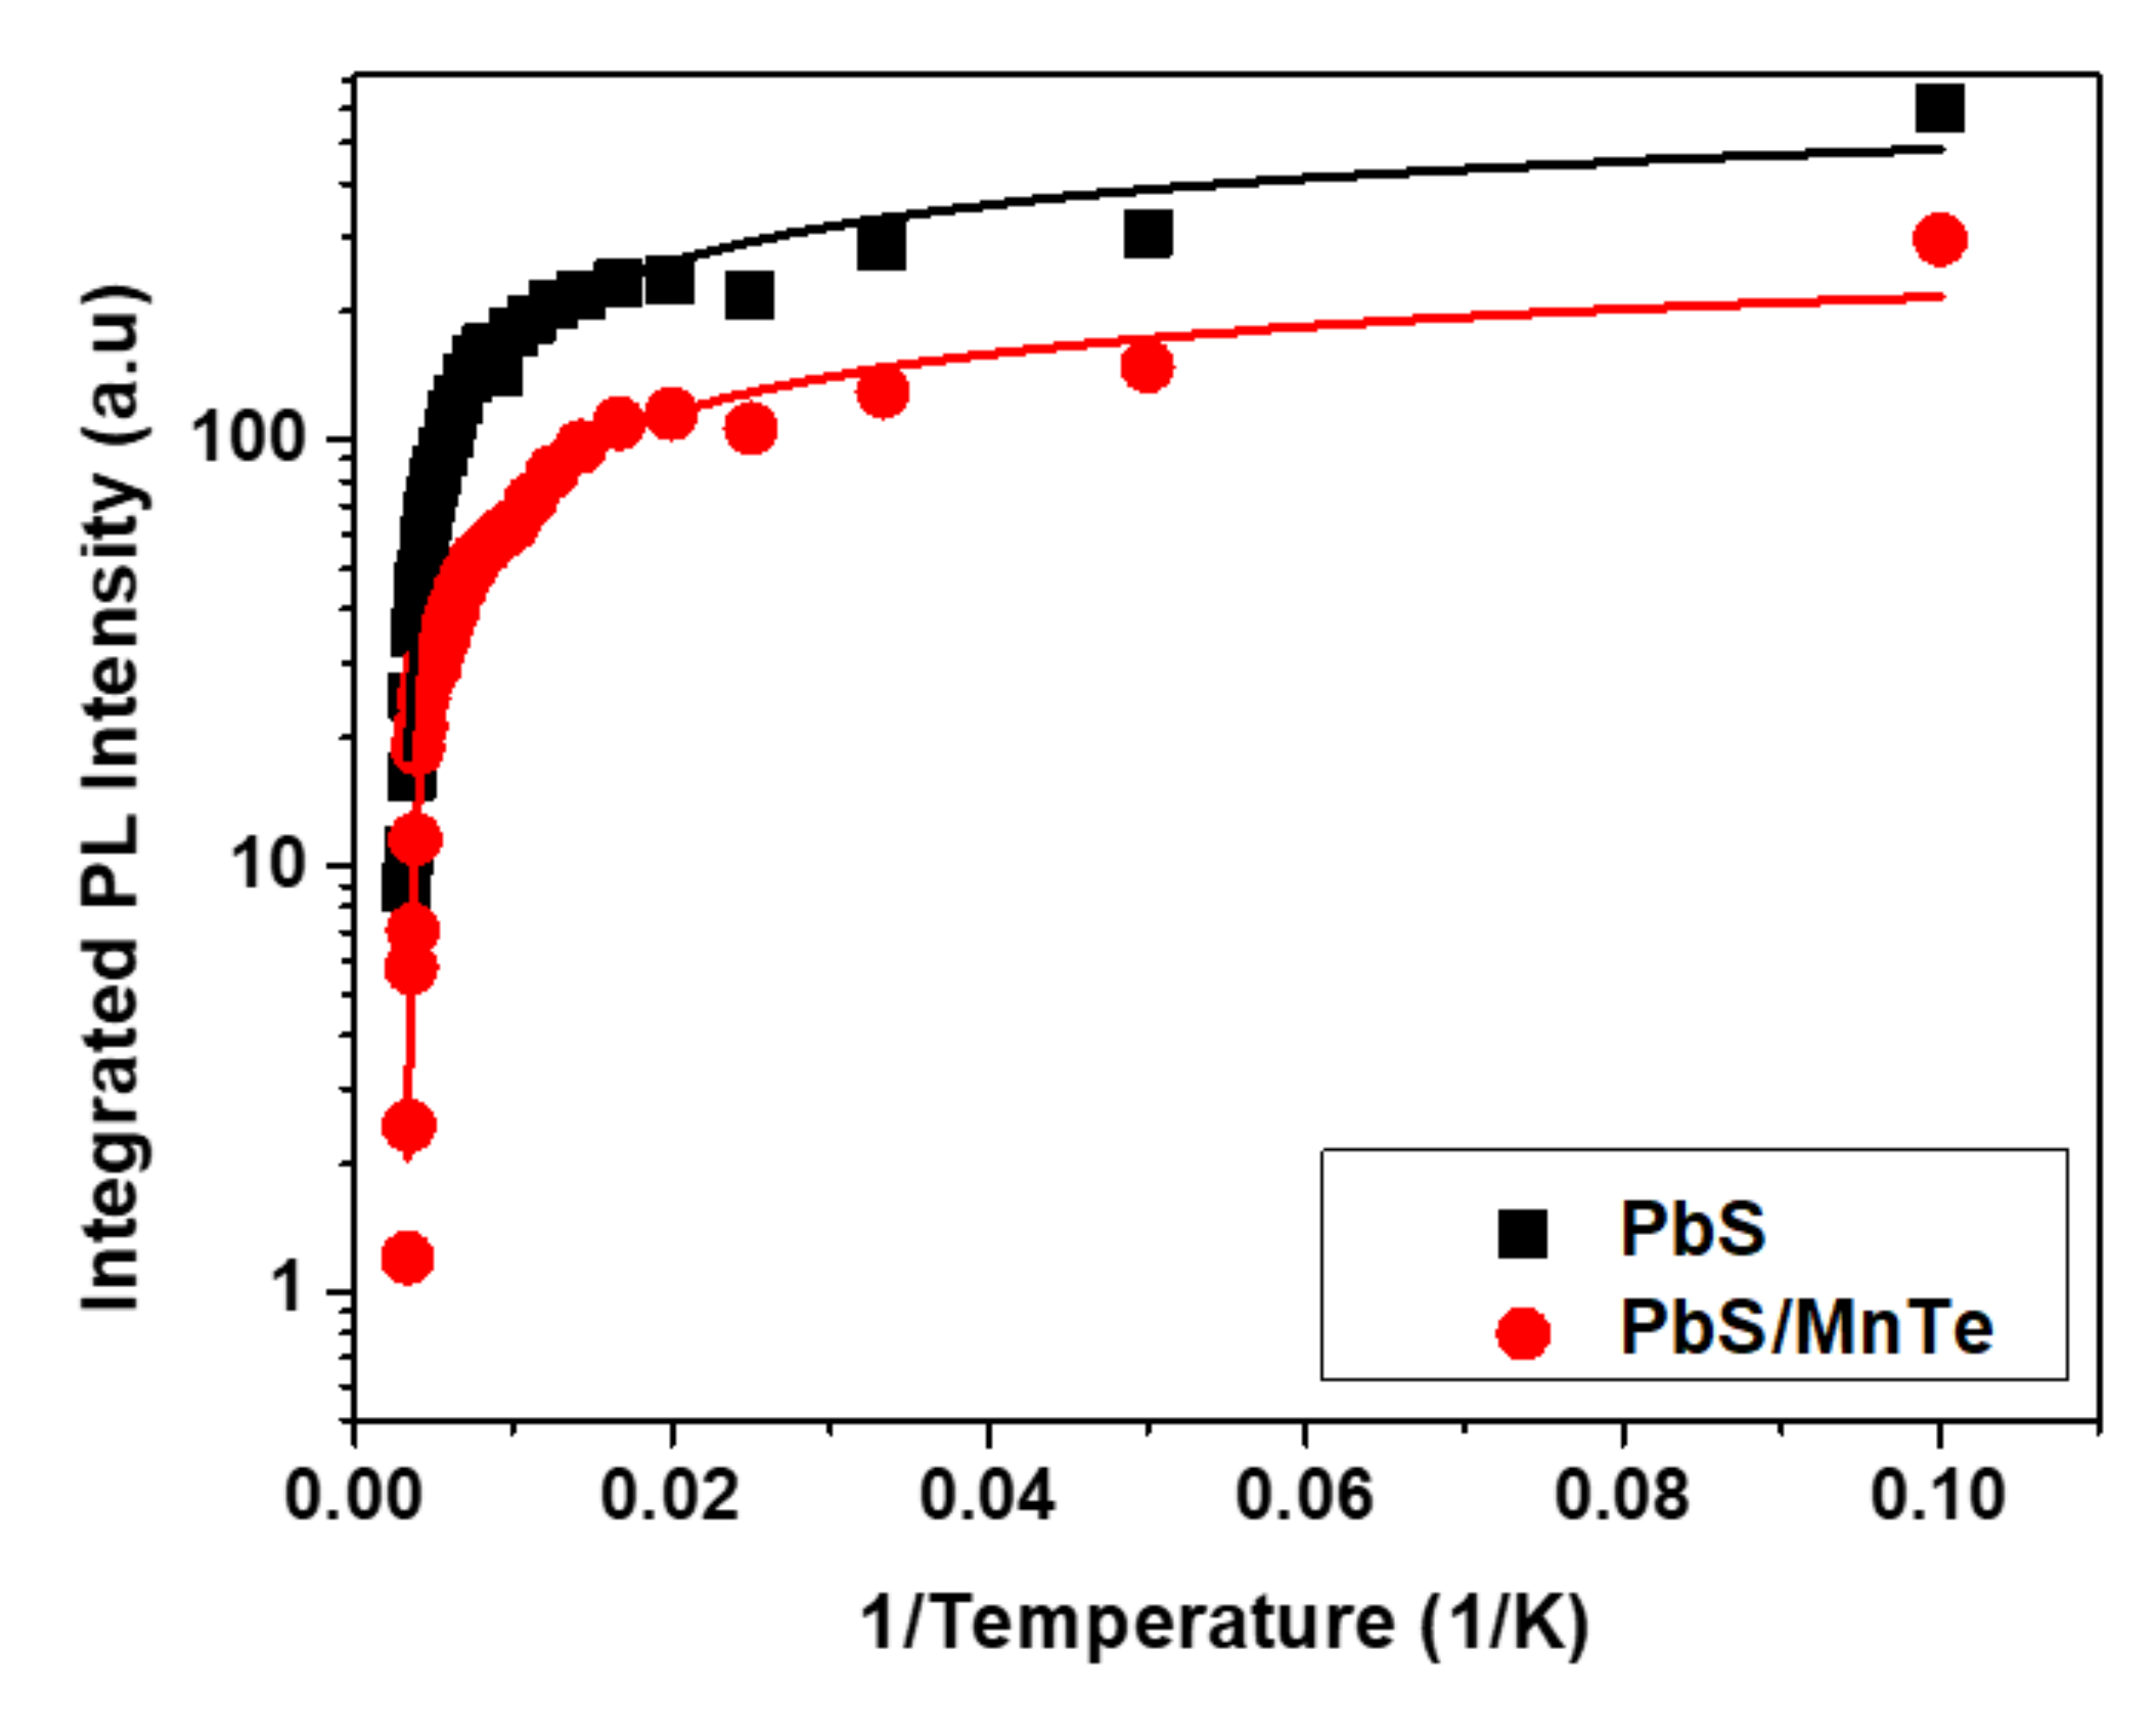
The value of Γinh is not related to temperature because of inhomogeneous broadening, which might be due to the fluctuations in the size, shape, and elemental composition of QDs [42,43]. Interestingly, the values of σ and γ for PbS/MnTe were larger than those for PbS, indicating stronger exciton LO–phonon coupling [44] in these systems. Moreover, the higher values of σ and γ for PbS/MnTe compared with PbS are defined by noticeably stronger quantum confinement, as previously observed [45]. Furthermore, for PL, the decrease in PL peak intensity with temperature can be observed in Figure 6. The decreasing intensity is related to the excitation of carriers from the QDs into non-radiative recombination centers or Auger recombination. To understand the role of recombination, the intensities of the PL spectra of PbS and PbS/MnTe were fitted using the Arrhenius equation as in Equation (4):
where I0 is the PL intensity at 0 K, A is the fitting coefficient, Ea is the activation energy of the thermal quenching, and Kb is the Boltzmann constant. The value of Ea, which was obtained from the fitting graph in Figure 6 for PbS and PbS/MnTe compound QDs, are 11.12 ± 0.61 meV and 5.51 ± 0.29 meV, respectively. The value of the thermal activation energy is influenced by the exciton binding energy [46], potential barrier [47], surface state/trap [34], and electron–phonon interaction [48]. The values of Ea, which were obtained from the fitting graph in Figure 6 for PbS and PbS/MnTe compound QDs, are 11.12 ± 0.61 meV and 5.51 ± 0.29 meV, respectively. The thermal activation energy is influenced by the exciton binding energy [37], potential barrier [38], surface state/trap [31], and electron–phonon interactions [39]. The presence of the potential barrier MnTe had modified the band energy where the carriers are trapped at the center of the core region. This strongly affects the Coulombic interaction and, thus, affects the charge carrier transport.
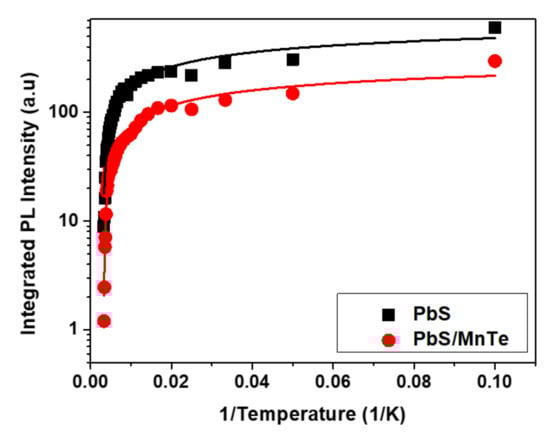
Figure 6.
Temperature dependence of PL intensity for PbS and PbS/MnTe.
The PL intensity showed a slight decrease with increasing temperature for both PbS and PbS/MnTe QDs. The decrease in intensity with temperature is the cause of the significant non-radiative carrier relaxation channels in the semiconductors [49,50]. At high temperatures, phonon coupling is strong, and the nonradiative rate becomes high and, as a result, the PL spectra become more sensitive to the temperature.
4. Conclusions
In summary, we investigated PL temperature dependence of PbS and PbS/MnTe QDs at temperatures ranging from 10 to 300 K. According to these findings, increasing the temperature had affected PL peak energy, FWHM, and intensity of both the samples. The PL peak energies of both samples were blue-shifted with increasing temperatures because of the increasing distance between atoms in QDs as temperature increased. Furthermore, the value of dE/dT for the PbS/MnTe was smaller than that of the PbS core QDs due to the crystal dilation and electron–phonon interaction. Based on FWHM analysis, it can be concluded that PbS/MnTe QDs have stronger LO–phonon interactions than bare PbS QDs due to the greater values of σ and γ, and this reveals that compound QDs have strong quantum confinement effects.
Author Contributions
Investigation, N.D.H.; formal analysis, N.D.H. and M.S.Z.; writing—original draft preparation, N.D.H.; writing—review and editing, Z.A.T., J.Y.C.L., and M.A.K.; supervision, M.A.K. All authors have read and agreed to the published version of the manuscript.
Funding
The authors would like to acknowledge the financial support received from the Fundamental Research Grant Scheme (FRGS) under grant numbers of (FRGS/1/2018/STG07/UPM/02/5) from the Ministry of Higher Education Malaysia and research grants 9567500 and 9664000 from Universiti Putra Malaysia.
Conflicts of Interest
The authors declare no conflict of interest.
References
- Su, G.; Liu, C.; Deng, Z.; Zhao, X.; Zhou, X. Size-Dependent Photoluminescence of PbS QDs Embedded in Silicate Glasses. Opt. Mater. Express 2017, 7, 2194. [Google Scholar] [CrossRef]
- Qian, H.; Dong, C.; Peng, J.; Qiu, X.; Xu, Y.; Ren, J. High-Quality and Water-Soluble Near-Infrared Photoluminescent CdHgTe/CdS Quantum Dots Prepared by Adjusting Size and Composition. J. Phys. Chem. C 2007, 111, 16852–16857. [Google Scholar] [CrossRef]
- Cao, J.; Zhu, H.; Deng, D.; Xue, B.; Tang, L.; Mahounga, D.; Qian, Z.; Gu, Y. In Vivo NIR Imaging with PbS Quantum Dots Entrapped in Biodegradable Micelles. J. Biomed. Mater. Res. Part A 2012, 100, 958–968. [Google Scholar] [CrossRef] [PubMed]
- Li, H.; Shih, W.; Shih, W. Non-Heavy-Metal ZnS Quantum Dots with Bright Blue Photoluminescence by a One-Step Aqueous Synthesis. Nanotechnology 2007, 18, 205604. [Google Scholar] [CrossRef]
- Hu, R.; Law, W.; Lin, G.; Ye, L.; Liu, J.; Liu, J.; Reynolds, J.L.; Yong, K.-T. PEGylated Phospholipid Micelle-Encapsulated Near-Infrared PbS Quantum Dots for in vitro and in vivo Bioimaging. Theranostics 2012, 2, 723–733. [Google Scholar] [CrossRef] [PubMed] [Green Version]
- Im, S.; Kim, H.; Kim, S.; Kim, S.; Seok, S. All Solid State Multiply Layered Pbs Colloidal Quantum-Dot-Sensitized Photovoltaic Cells. Energy Environ. Sci. 2011, 4, 4181. [Google Scholar] [CrossRef]
- Wang, P.; Cao, L.; Chen, Y.; Wu, Y.; Di, J. Photoelectrochemical Biosensor Based on Co3O4 Nanoenzyme Coupled with PbS Quantum Dots for Hydrogen Peroxide Detection. ACS Appl. Nano Mater. 2019, 2, 2204–2211. [Google Scholar] [CrossRef]
- Kwon, J.; Han, M.; Jung, D.; Kong, S.; Jung, D. High Sensitivity Shortwave Infrared Photodetector Based on PbS QDs Using P3HT. Nanomaterials 2021, 11, 2683. [Google Scholar] [CrossRef]
- Yang, T.; Lu, M.; Mao, X.; Liu, W.; Wan, L.; Miao, S.; Xu, J. Synthesis of CdS Quantum Dots (QDs) via a Hot-Bubbling Route and Co-Sensitized Solar Cells Assembly. Chem. Eng. J. 2013, 225, 776–783. [Google Scholar] [CrossRef]
- Guerreiro, P.; Ten, S.; Borrelli, N.; Butty, J.; Jabbour, G.; Peyghambarian, N. PbS Quantum-Dot Doped Glasses as Saturable Absorbers for Mode Locking of a Cr:Forsterite Laser. Appl. Phys. Lett. 1997, 71, 1595–1597. [Google Scholar] [CrossRef]
- Wang, D.; Qian, J.; Cai, F.; He, S.; Han, S.; Mu, Y. ‘Green’-Synthesized Near-Infrared PbS Quantum Dots with Silica–PEG Dual-Layer Coating: Ultrastable and Biocompatible Optical Probes Forin Vivoanimal Imaging. Nanotechnology 2012, 23, 245701. [Google Scholar] [CrossRef] [PubMed]
- Tan, L.; Zhou, Y.; Ren, F.; Benetti, D.; Yang, F.; Zhao, H.; Rosei, F.; Chaker, M.; Ma, D. Ultrasmall PbS Quantum Dots: A Facile and Greener Synthetic Route and Their High Performance in Luminescent Solar Concentrators. J. Mater. Chem. A 2017, 5, 10250–10260. [Google Scholar] [CrossRef]
- Zhang, L.; Kang, C.; Zhang, G.; Pan, Z.; Huang, Z.; Xu, S.; Rao, H.; Liu, H.; Wu, S.; Wu, X.; et al. All-Inorganic CsPbI3 Quantum Dot Solar Cells with Efficiency over 16% by Defect Control. Adv. Funct. Mater. 2020, 31, 2005930. [Google Scholar] [CrossRef]
- Linkov, P.; Krivenkov, V.; Nabiev, I.; Samokhvalov, P. High Quantum Yield CdSe/ZnS/CdS/ZnS Multishell Quantum Dots for Biosensing and Optoelectronic Applications. Mater. Today Proc. 2016, 3, 104–108. [Google Scholar] [CrossRef]
- Debellis, D.; Gigli, G.; ten Brinck, S.; Infante, I.; Giansante, C. Quantum-Confined and Enhanced Optical Absorption of Colloidal PbS Quantum Dots at Wavelengths with Expected Bulk Behavior. Nano Lett. 2017, 17, 1248–1254. [Google Scholar] [CrossRef] [PubMed]
- Xiao, Q.; Huang, S.; Su, W.; Chan, W.; Liu, Y. Facile Synthesis and Characterization of Highly Fluorescent and Biocompatiblen-Acetyl-L-Cysteine Capped CdTe/CdS/ZnS Core/Shell/Shell Quantum Dots in Aqueous Phase. Nanotechnology 2012, 23, 495717. [Google Scholar] [CrossRef] [PubMed]
- Pan, J.; Wan, D.; Gong, J. Pegylated Liposome Coated QDs/Mesoporous Silica Core-Shell Nanoparticles for Molecular Imaging. Chem. Commun. 2011, 47, 3442. [Google Scholar] [CrossRef]
- Samokhvalov, P.; Linkov, P.; Michel, J.; Molinari, M.; Nabiev, I. Photoluminescence quantum yield of CdSe-ZnS/CdS/ZnS core-multishell quantum dots approaches 100% due to enhancement of charge carrier confinement. In Colloidal Nanoparticles for Biomedical Applications IX; International Society for Optics and Photonics: San Diego, CA, USA, 2014; Volume 8955, p. 89550S. [Google Scholar]
- Shelawati, T.; Nurisya, M.S.; Mazliana, A.K. Effects of Step-Potential on Confinement Strength of Strain-Induced Type-I Core–Shell Quantum Dots. Superlattices Microstruct. 2019, 131, 95–103. [Google Scholar] [CrossRef] [Green Version]
- Peng, H.; Zhang, L.; Soeller, C.; Travas-Sejdic, J. Preparation of Water-Soluble CdTe/CdS Core/Shell Quantum Dots with Enhanced Photostability. J. Lumin. 2007, 127, 721–726. [Google Scholar] [CrossRef]
- Fitzmorris, B.; Cooper, J.; Edberg, J.; Gul, S.; Guo, J.; Zhang, J. Synthesis and Structural, Optical, and Dynamic Properties of Core/Shell/Shell CdSe/ZnSe/ZnS Quantum Dots. J. Phys. Chem. C 2012, 116, 25065–25073. [Google Scholar] [CrossRef]
- Anno, H.; Koyanagi, T.; Matsubara, K. Epitaxial Growth of Zincblende Mnte Films as a New Magneto-Optical Material. J. Cryst. Growth 1992, 117, 816–819. [Google Scholar] [CrossRef]
- Jasim, K. Lead Sulfide Quantum Dot Sensitized Nanocrystalline Solar Cell. KnE Eng. 2018, 3, 171. [Google Scholar] [CrossRef]
- Tubtimtae, A.; Arthayakul, K.; Teekwang, B.; Hongsith, K.; Choopun, S. Mnte Semiconductor-Sensitized Boron-Doped TiO2 and ZnO Photoelectrodes for Solar Cell Applications. J. Colloid Interface Sci. 2013, 405, 78–84. [Google Scholar] [CrossRef] [PubMed]
- Zaini, M.S.; Kamarudin, M.A.; Chyi, J.L.Y.; Alang Ahmad, S.A.; Mohmad, A.R. Temperature and Power Dependence of Photoluminescence in PbS Quantum Dots Nanoparticles. Sains Malays. 2019, 48, 1281–1288. [Google Scholar] [CrossRef]
- Zaini, M.; Liew, J.; Alang Ahmad, S.; Mohmad, A.; Ahmad Kamarudin, M. Photoluminescence Investigation of Carrier Localization in Colloidal PbS and PbS/MnS Quantum Dots. ACS Omega 2020, 5, 30956–30962. [Google Scholar] [CrossRef] [PubMed]
- Cao, W.; Yuan, L.; Patterson, R.; Wen, X.; Tapping, P.; Kee, T.; Veetil, B.P.; Zhang, P.; Zhang, Z.; Zhang, Q.; et al. Difference in Hot Carrier Cooling Rate between Langmuir–Blodgett and Drop Cast PbS QD Films Due to Strong Electron–Phonon Coupling. Nanoscale 2017, 9, 17133–17142. [Google Scholar] [CrossRef]
- Ai, B.; Liu, C.; Deng, Z.; Wang, J.; Han, J.; Zhao, X. Low Temperature Photoluminescence Properties of CsPbBr3 Quantum Dots Embedded in Glasses. Phys. Chem. Chem. Phys. 2017, 19, 17349–17355. [Google Scholar] [CrossRef]
- Chun, J.; Yang, W.; Kim, J. Thermal Stability of CdSe/ZnS Quantum Dot-Based Optical Fiber Temperature Sensor. Mol. Cryst. Liq. Cryst. 2011, 538, 333–340. [Google Scholar] [CrossRef]
- Varshni, Y.P. Temperature Dependence of the Energy Gap in Semiconductors. Physica 1967, 34, 149–154. [Google Scholar] [CrossRef]
- Kim, D.; Kuwabara, T.; Nakayama, M. Photoluminescence Properties Related to Localized States in Colloidal PbS Quantum Dots. J. Lumin. 2006, 119, 214–218. [Google Scholar] [CrossRef]
- Lewis, J.; Wu, S.; Jiang, X. Unconventional Gap State of Trapped Exciton in Lead Sulfide Quantum Dots. Nanotechnology 2010, 21, 455402. [Google Scholar] [CrossRef] [PubMed]
- Liu, C.; Heo, J.; Zhang, X.; Adam, J. Photoluminescence of PbS Quantum Dots Embedded in Glasses. J. Non-Cryst. Solids 2008, 354, 618–623. [Google Scholar] [CrossRef]
- Zhao, H.; Liang, H.; Vidal, F.; Rosei, F.; Vomiero, A.; Ma, D. Size Dependence of Temperature-Related Optical Properties of PbS and PbS/CdS Core/Shell Quantum Dots. J. Phys. Chem. C 2014, 118, 20585–20593. [Google Scholar] [CrossRef]
- LitLitvyak, V.; Cherbunin, R.; Onushchenko, A. Temperature Dependence of the Optical Transitions of PbS Quantum Dots in Silicate Glasses. Bull. Russ. Acad. Sci. Phys. 2017, 81, 1490–1492. [Google Scholar] [CrossRef]
- Devreese, J.; Fomin, V.; Gladilin, V.; Klimin, S. Photoluminescence Spectra of Quantum Dots: Enhanced Efficiency of the Electron-Phonon Interaction. Phys. Status Solidi (B) 2001, 224, 609–612. [Google Scholar] [CrossRef]
- Magaryan, K.; Karimullin, K.; Vasil’eva, I.; Naumov, A. Analysis of the Temperature Dependence of the Exciton Luminescence Spectra of Cadmium Selenide Quantum Dots Grown in a Liquid Crystal Matrix. Opt. Spectrosc. 2019, 126, 41–43. [Google Scholar] [CrossRef]
- Narayanaswamy, A.; Feiner, L.; Meijerink, A.; van der Zaag, P.J. The Effect of Temperature and Dot Size on the Spectral Properties of Colloidal InP/ZnS Core−Shell Quantum Dots. ACS Nano 2009, 3, 2539–2546. [Google Scholar] [CrossRef]
- Karimullin, K.; Arzhanov, A.; Eremchev, I.; Kulnitskiy, B.; Surovtsev, N.; Naumov, A. Combined Photon-Echo, Luminescence and Raman Spectroscopies of Layered Ensembles of Colloidal Quantum Dots. Laser Phys. 2019, 29, 124009. [Google Scholar] [CrossRef]
- Ullrich, B.; Wang, J. Impact of Laser Excitation Variations on the Photoluminescence of Pbs Quantum Dots on GaAs. J. Lumin. 2013, 143, 645–648. [Google Scholar] [CrossRef]
- Olkhovets, A.; Hsu, R.; Lipovskii, A.; Wise, F. Size-Dependent Temperature Variation of the Energy Gap in Lead-Salt Quantum Dots. Phys. Rev. Lett. 1998, 81, 3539–3542. [Google Scholar] [CrossRef]
- Turyanska, L.; Patanè, A.; Henini, M.; Hennequin, B.; Thomas, N. Temperature Dependence of the Photoluminescence Emission from Thiol-Capped PbS Quantum Dots. Appl. Phys. Lett. 2007, 90, 101913. [Google Scholar] [CrossRef] [Green Version]
- Jing, P.; Zheng, J.; Ikezawa, M.; Liu, X.; Lv, S.; Kong, X.; Zhao, J.; Masumoto, Y. Temperature-Dependent Photoluminescence of CdSe-Core CdS/CdZnS/ZnS-Multishell Quantum Dots. J. Phys. Chem. C 2009, 113, 13545–13550. [Google Scholar] [CrossRef]
- Xu, S.J.; Li, G.Q.; Wang, Y.J.; Zhao, Y.; Chen, G.H.; Zhao, D.G.; Zhu, J.J.; Yang, H.; Yu, D.P.; Wang, J.N. Quantum Dissipation and Broadening Mechanisms Due to Electron-Phonon Interactions in Self-Formed InGaN Quantum Dots. Appl. Phys. Lett. 2006, 88, 083123. [Google Scholar] [CrossRef] [Green Version]
- Leifer, K.; Pelucchi, E.; Watanabe, S.; Michelini, F.; Dwir, B.; Kapon, E. Narrow (≈4 meV) Inhomogeneous Broadening and Its Correlation with Confinement Potential of Pyramidal Quantum Dot Arrays. Appl. Phys. Lett. 2007, 91, 081106. [Google Scholar] [CrossRef]
- Gaponenko, M.; Lutich, A.; Tolstik, N.; Onushchenko, A.; Malyarevich, A.; Petrov, E.; Yumashev, K. Temperature-Dependent Photoluminescence of PbS Quantum Dots in Glass: Evidence of Exciton State Splitting and Carrier Trapping. Phys. Rev. B 2010, 82, 125320. [Google Scholar] [CrossRef]
- Gomes, P.F.; Godoy, M.P.F.; Veloso, A.B.; Nakaema, M.K.K.; Iikawa, F.; Brasil, M.J.S.P.; Bortoleto, J.R.R.; Cotta, M.A.; Madureira, J.R. Exciton Binding Energy in Type II Quantum Dots. Phys. Status Solidi (C) 2007, 4, 385–388. [Google Scholar] [CrossRef]
- Zhang, J.; Tolentino, J.; Smith, E.R.; Zhang, J.; Beard, M.C.; Nozik, A.J.; Law, M.; Johnson, J.C. Carrier Transport in PbS and PbSe QD Films Measured by Photoluminescence Quenching. J. Phys. Chem. C 2014, 118, 16228–16235. [Google Scholar] [CrossRef]
- Morello, G.; De Giorgi, M.; Kudera, S.; Manna, L.; Cingolani, R.; Anni, M. Temperature and Size Dependence of Nonradiative Relaxation and Exciton−Phonon Coupling in Colloidal CdTe Quantum Dots. J. Phys. Chem. C 2007, 111, 5846–5849. [Google Scholar] [CrossRef]
- Jagtap, A.; Khatei, J.; Koteswara Rao, K. Exciton–Phonon Scattering and Nonradiative Relaxation of Excited Carriers in Hydrothermally Synthesized CdTe Quantum Dots. Phys. Chem. Chem. Phys. 2015, 17, 27579–27587. [Google Scholar] [CrossRef]

Publisher’s Note: MDPI stays neutral with regard to jurisdictional claims in published maps and institutional affiliations. |
© 2022 by the authors. Licensee MDPI, Basel, Switzerland. This article is an open access article distributed under the terms and conditions of the Creative Commons Attribution (CC BY) license (https://creativecommons.org/licenses/by/4.0/).