
A Derating-Sensitive Tantalum Polymer Capacitor’s Failure Rate within a DC-DC eGaN-FET-Based PoL Converter Workbench Study


Abstract
:1. Introduction
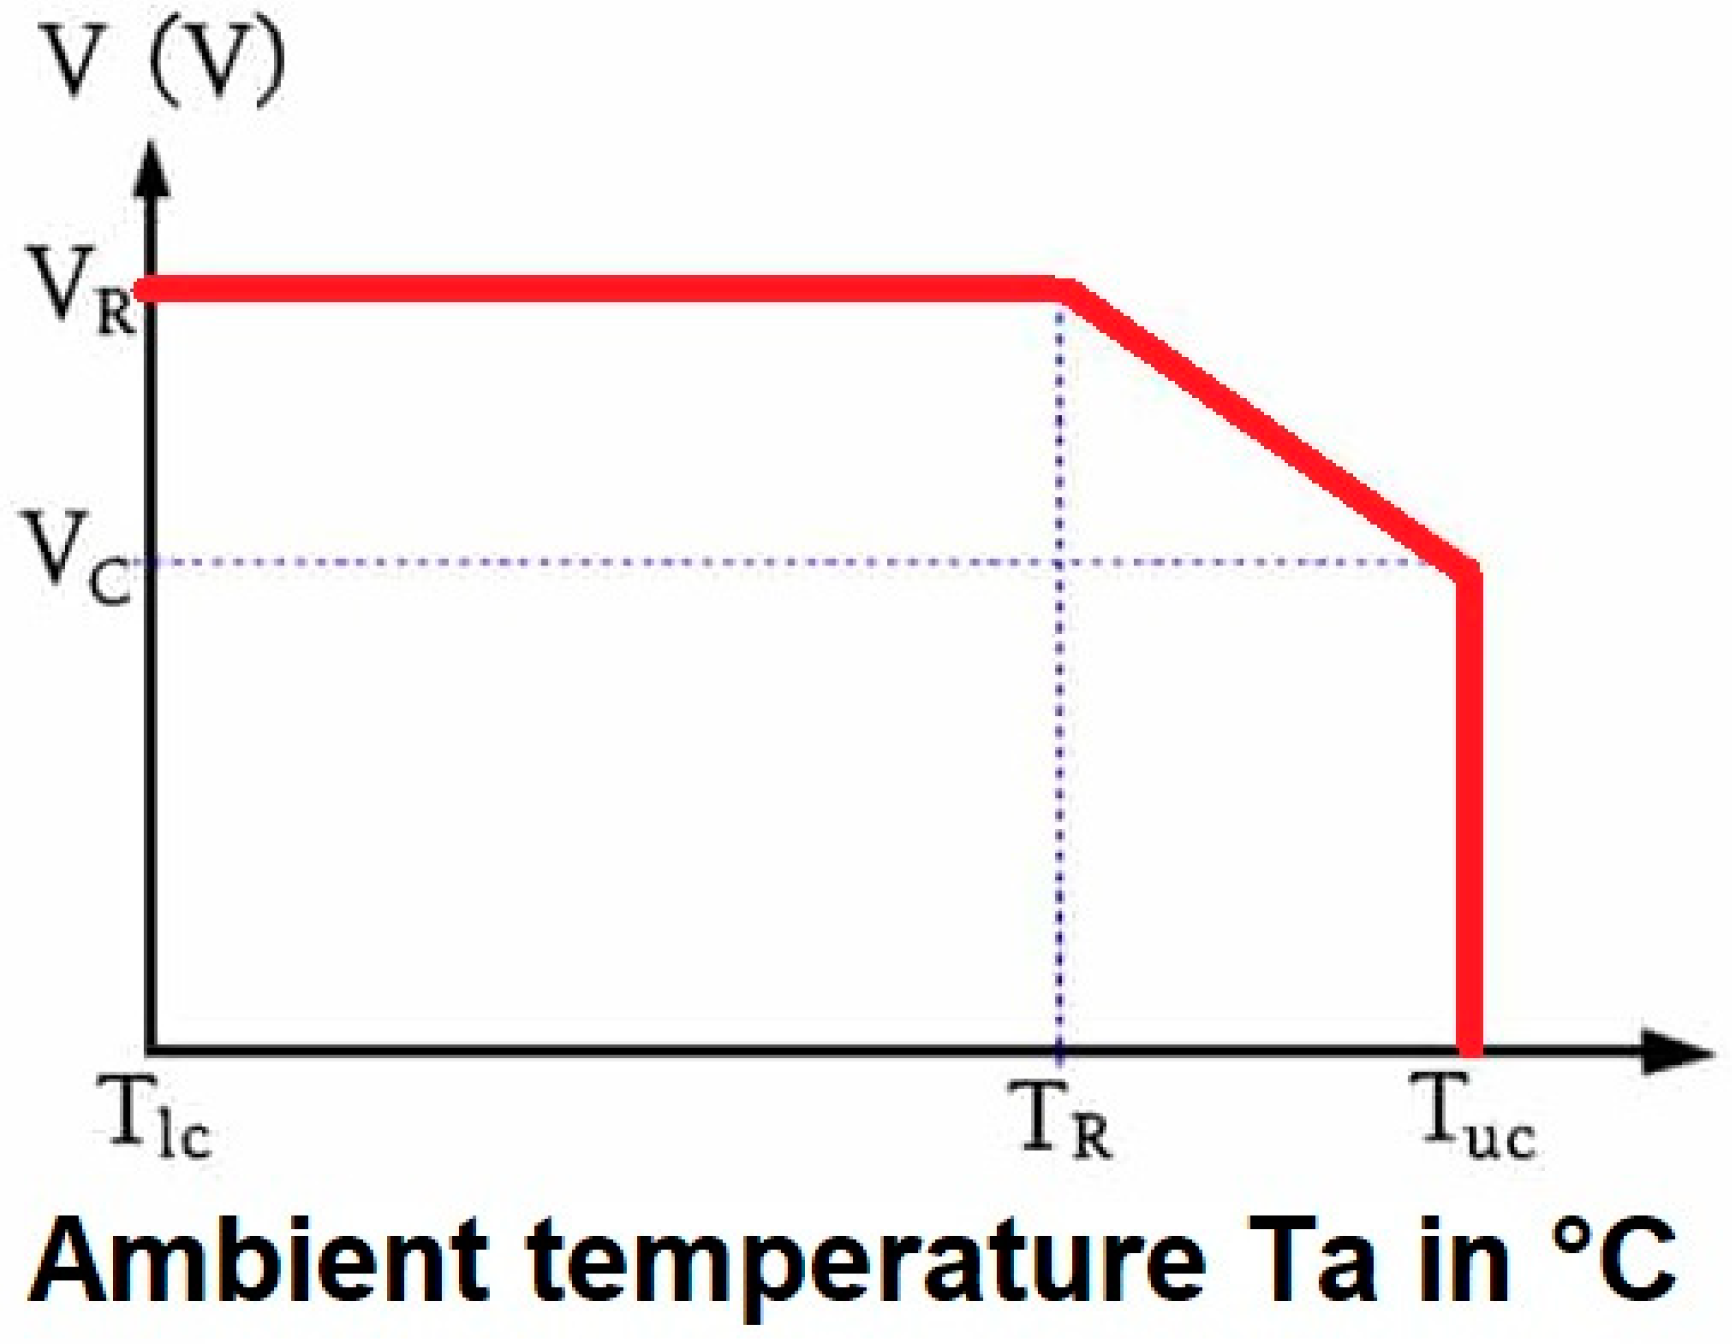
- Voltage derating
- Temperature
- ESR (equivalent series resistance)
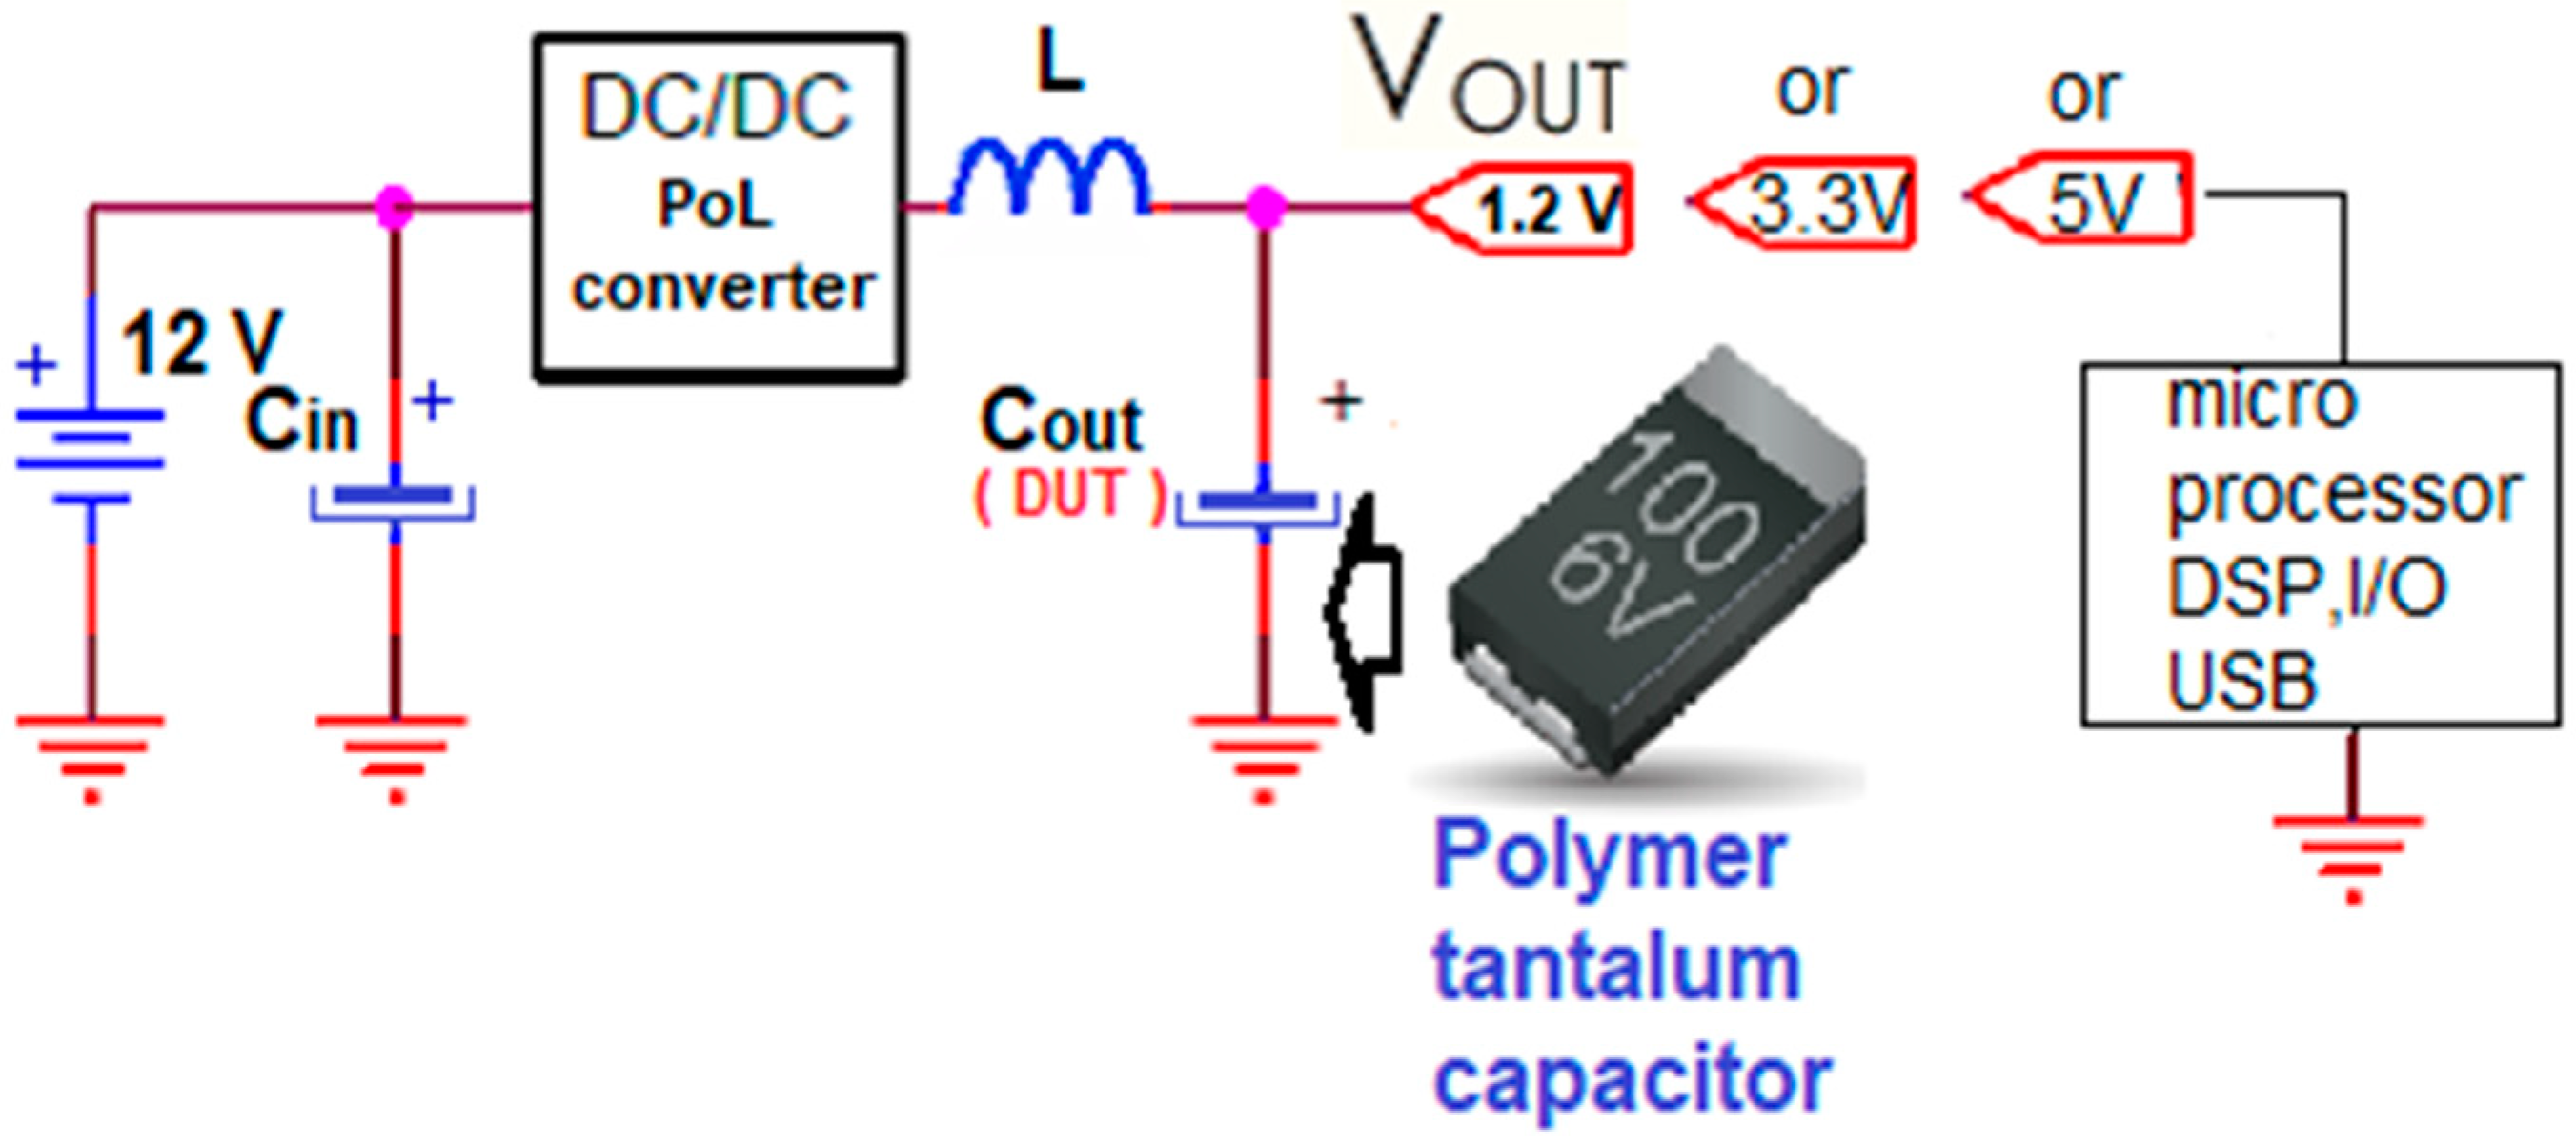
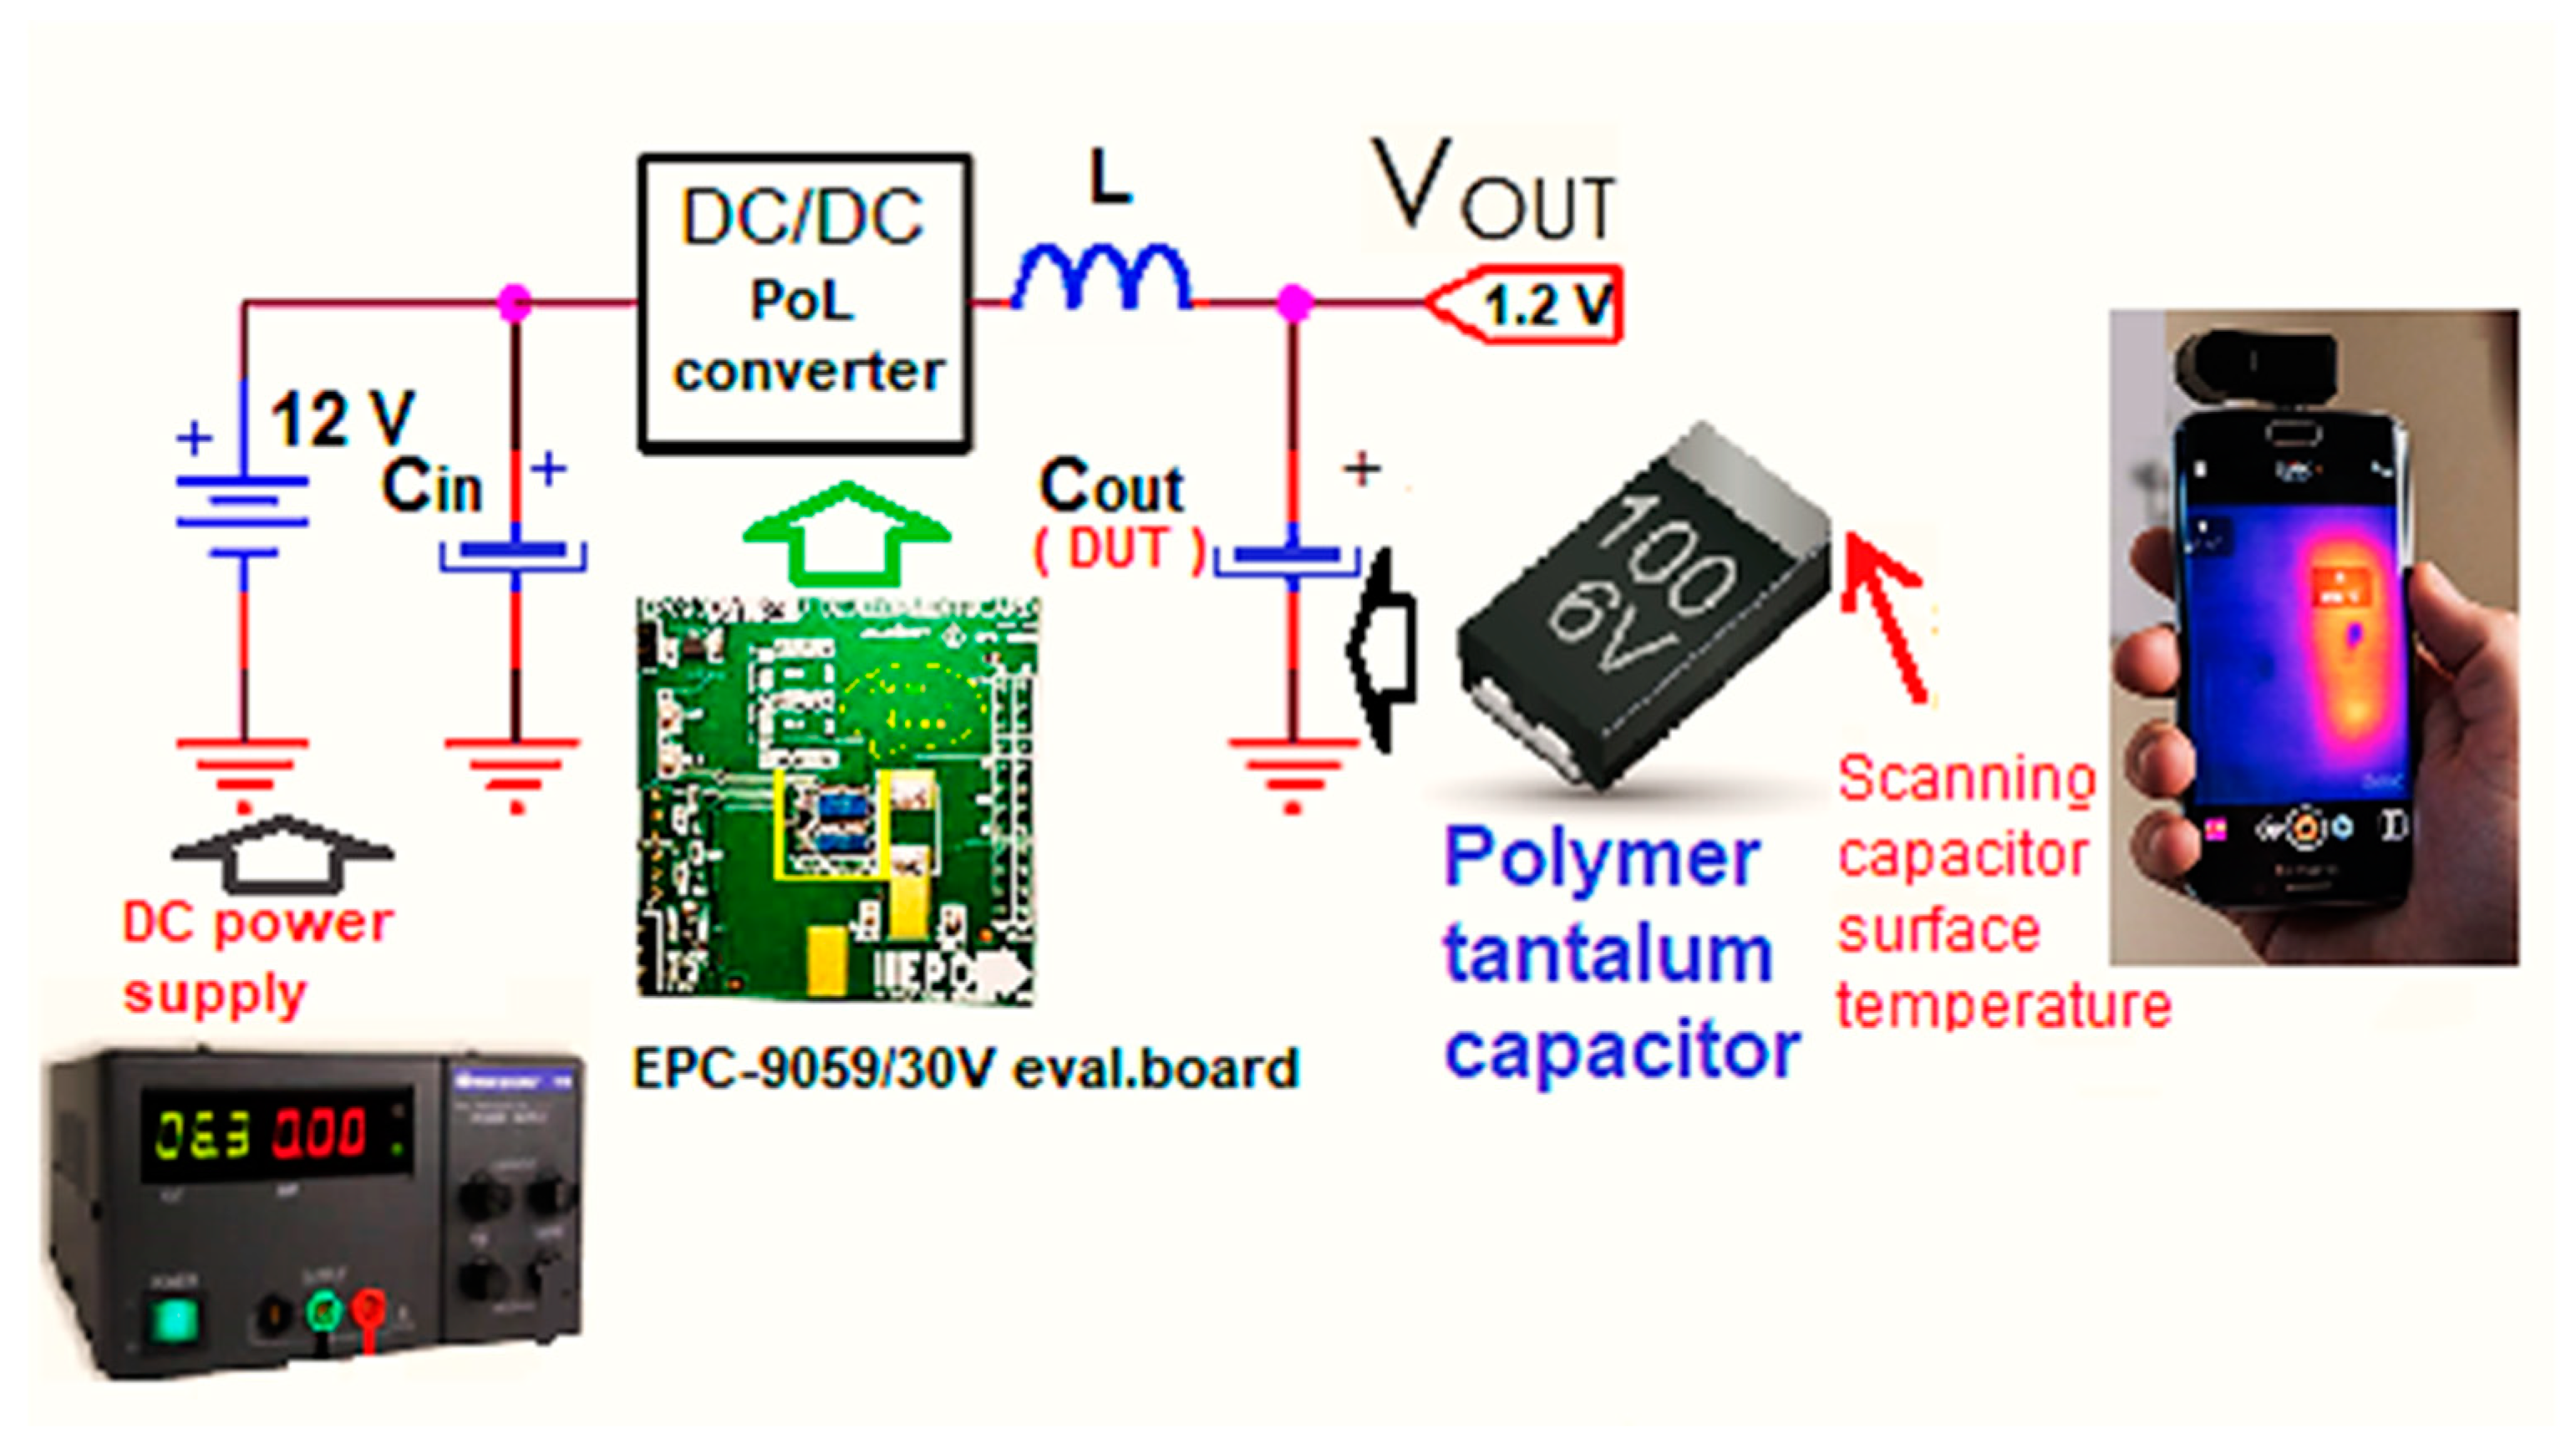
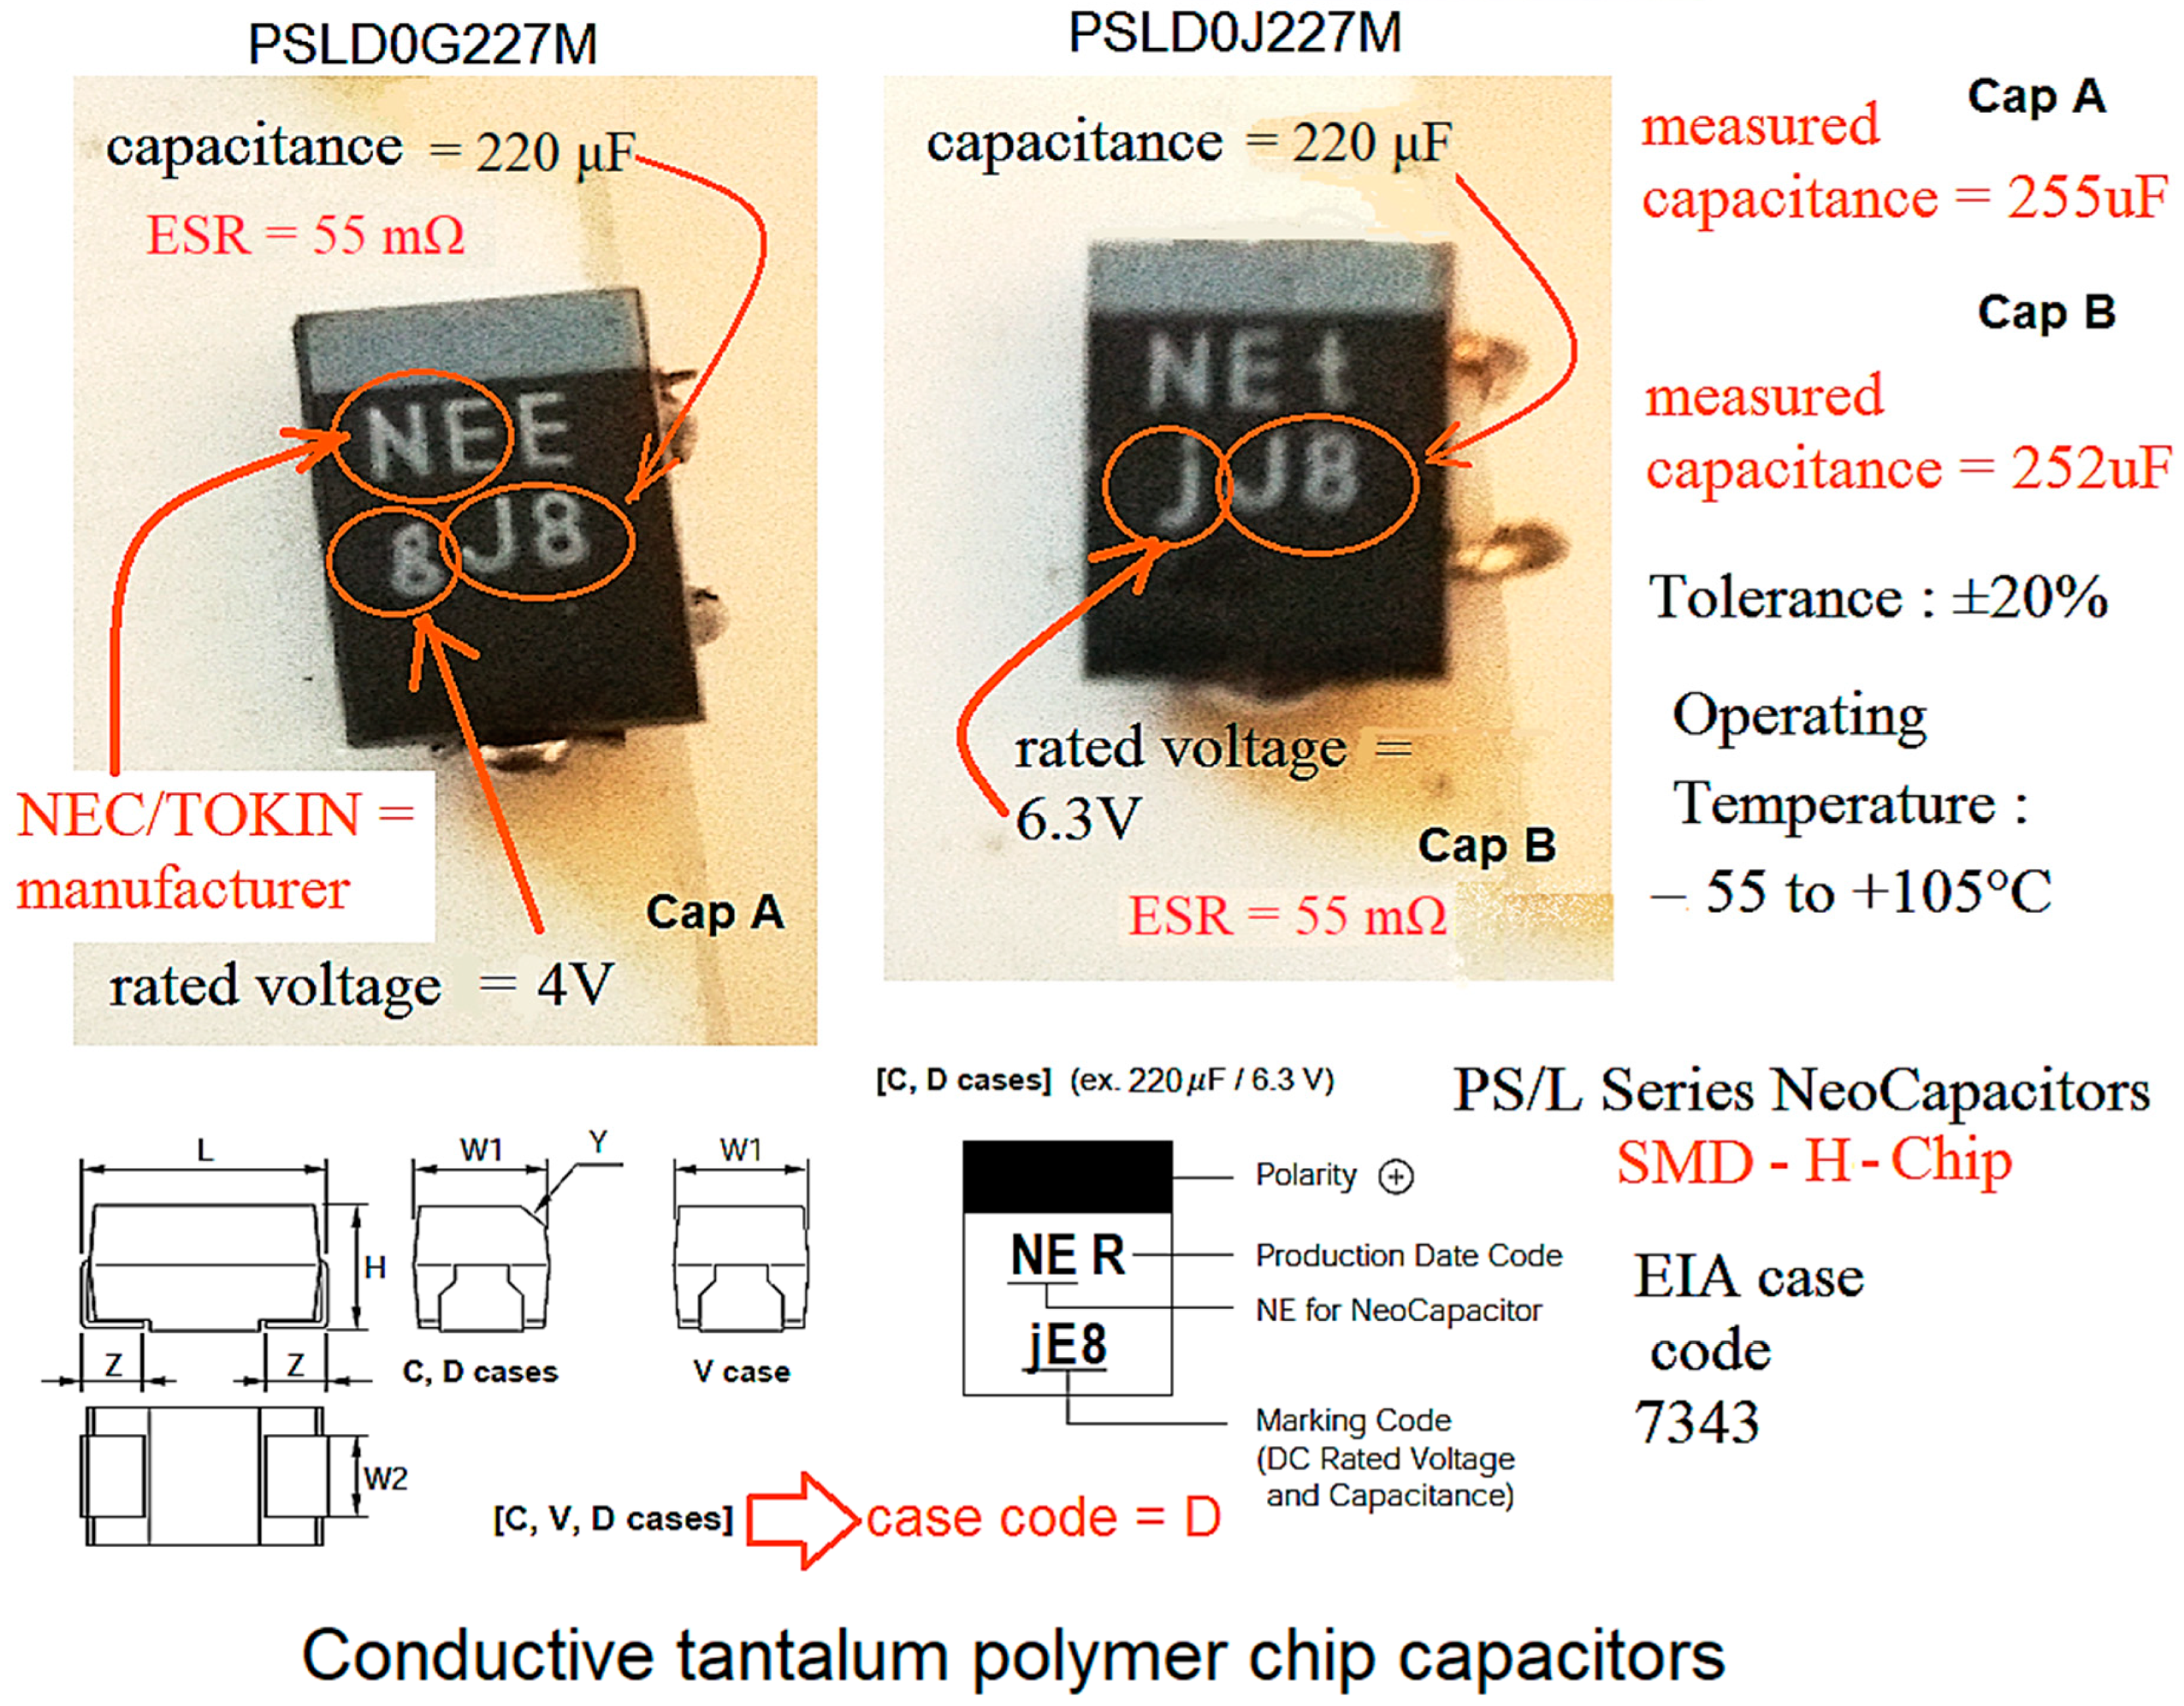
2. Materials and Methods
3. Results
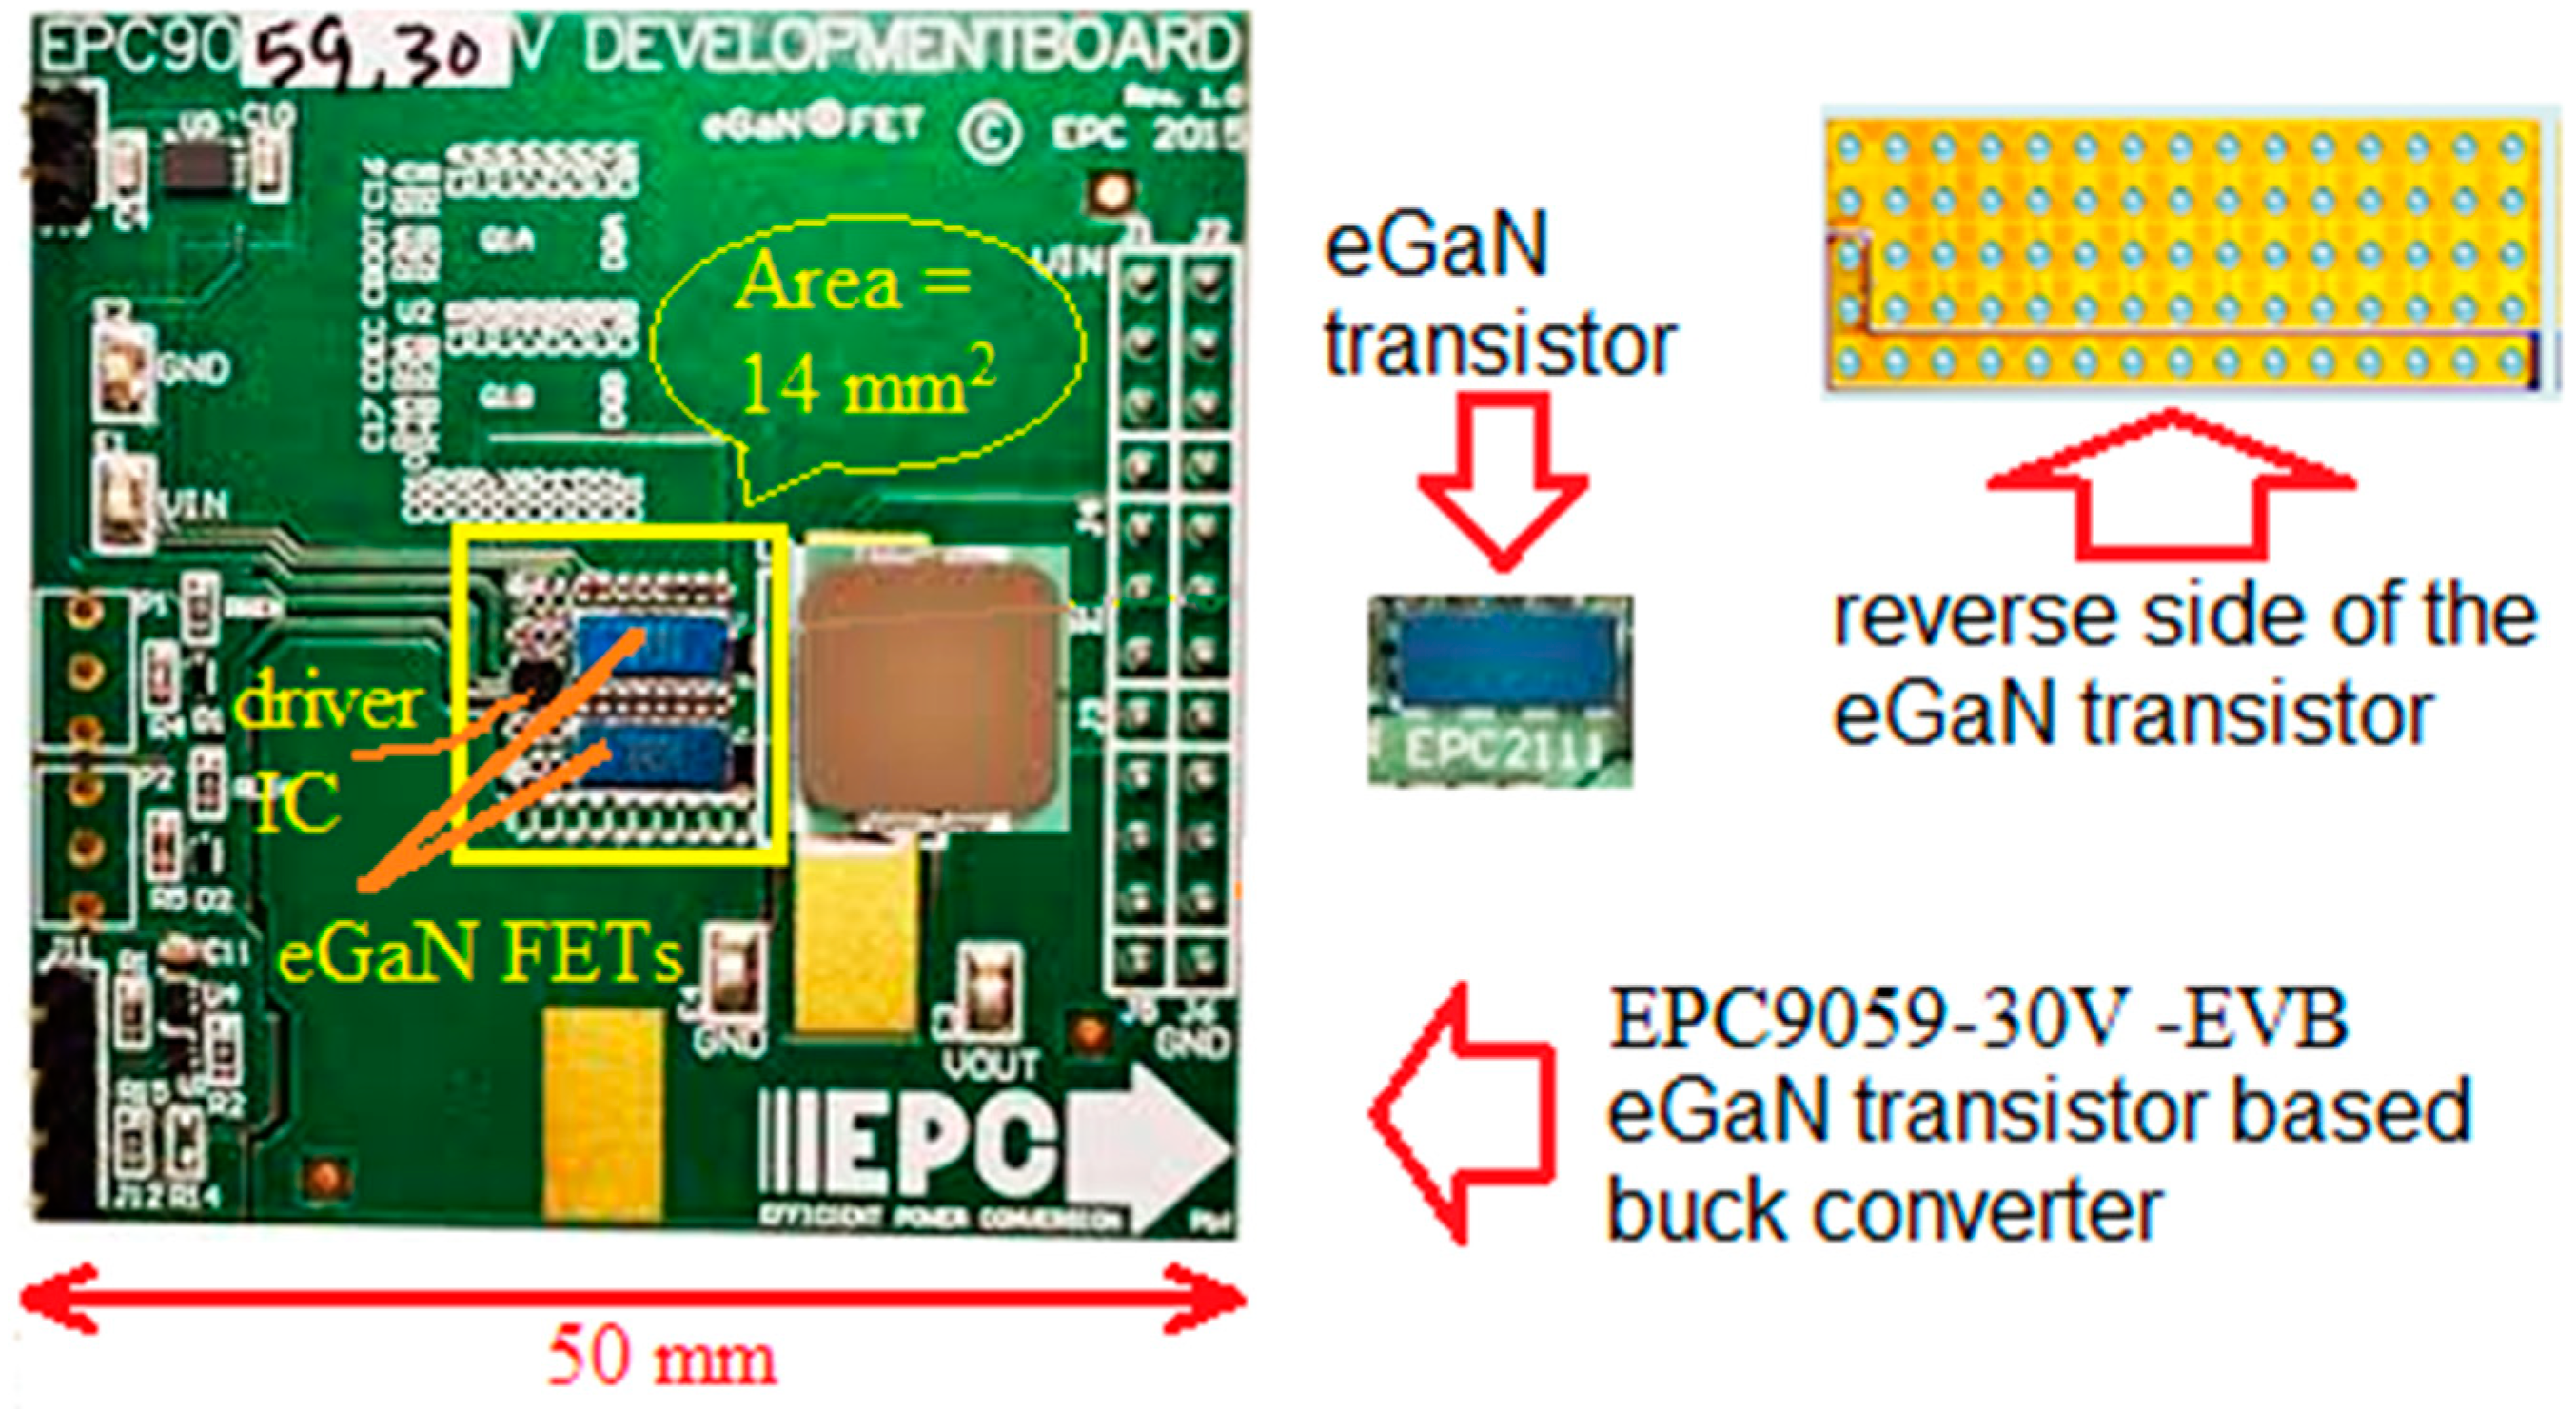
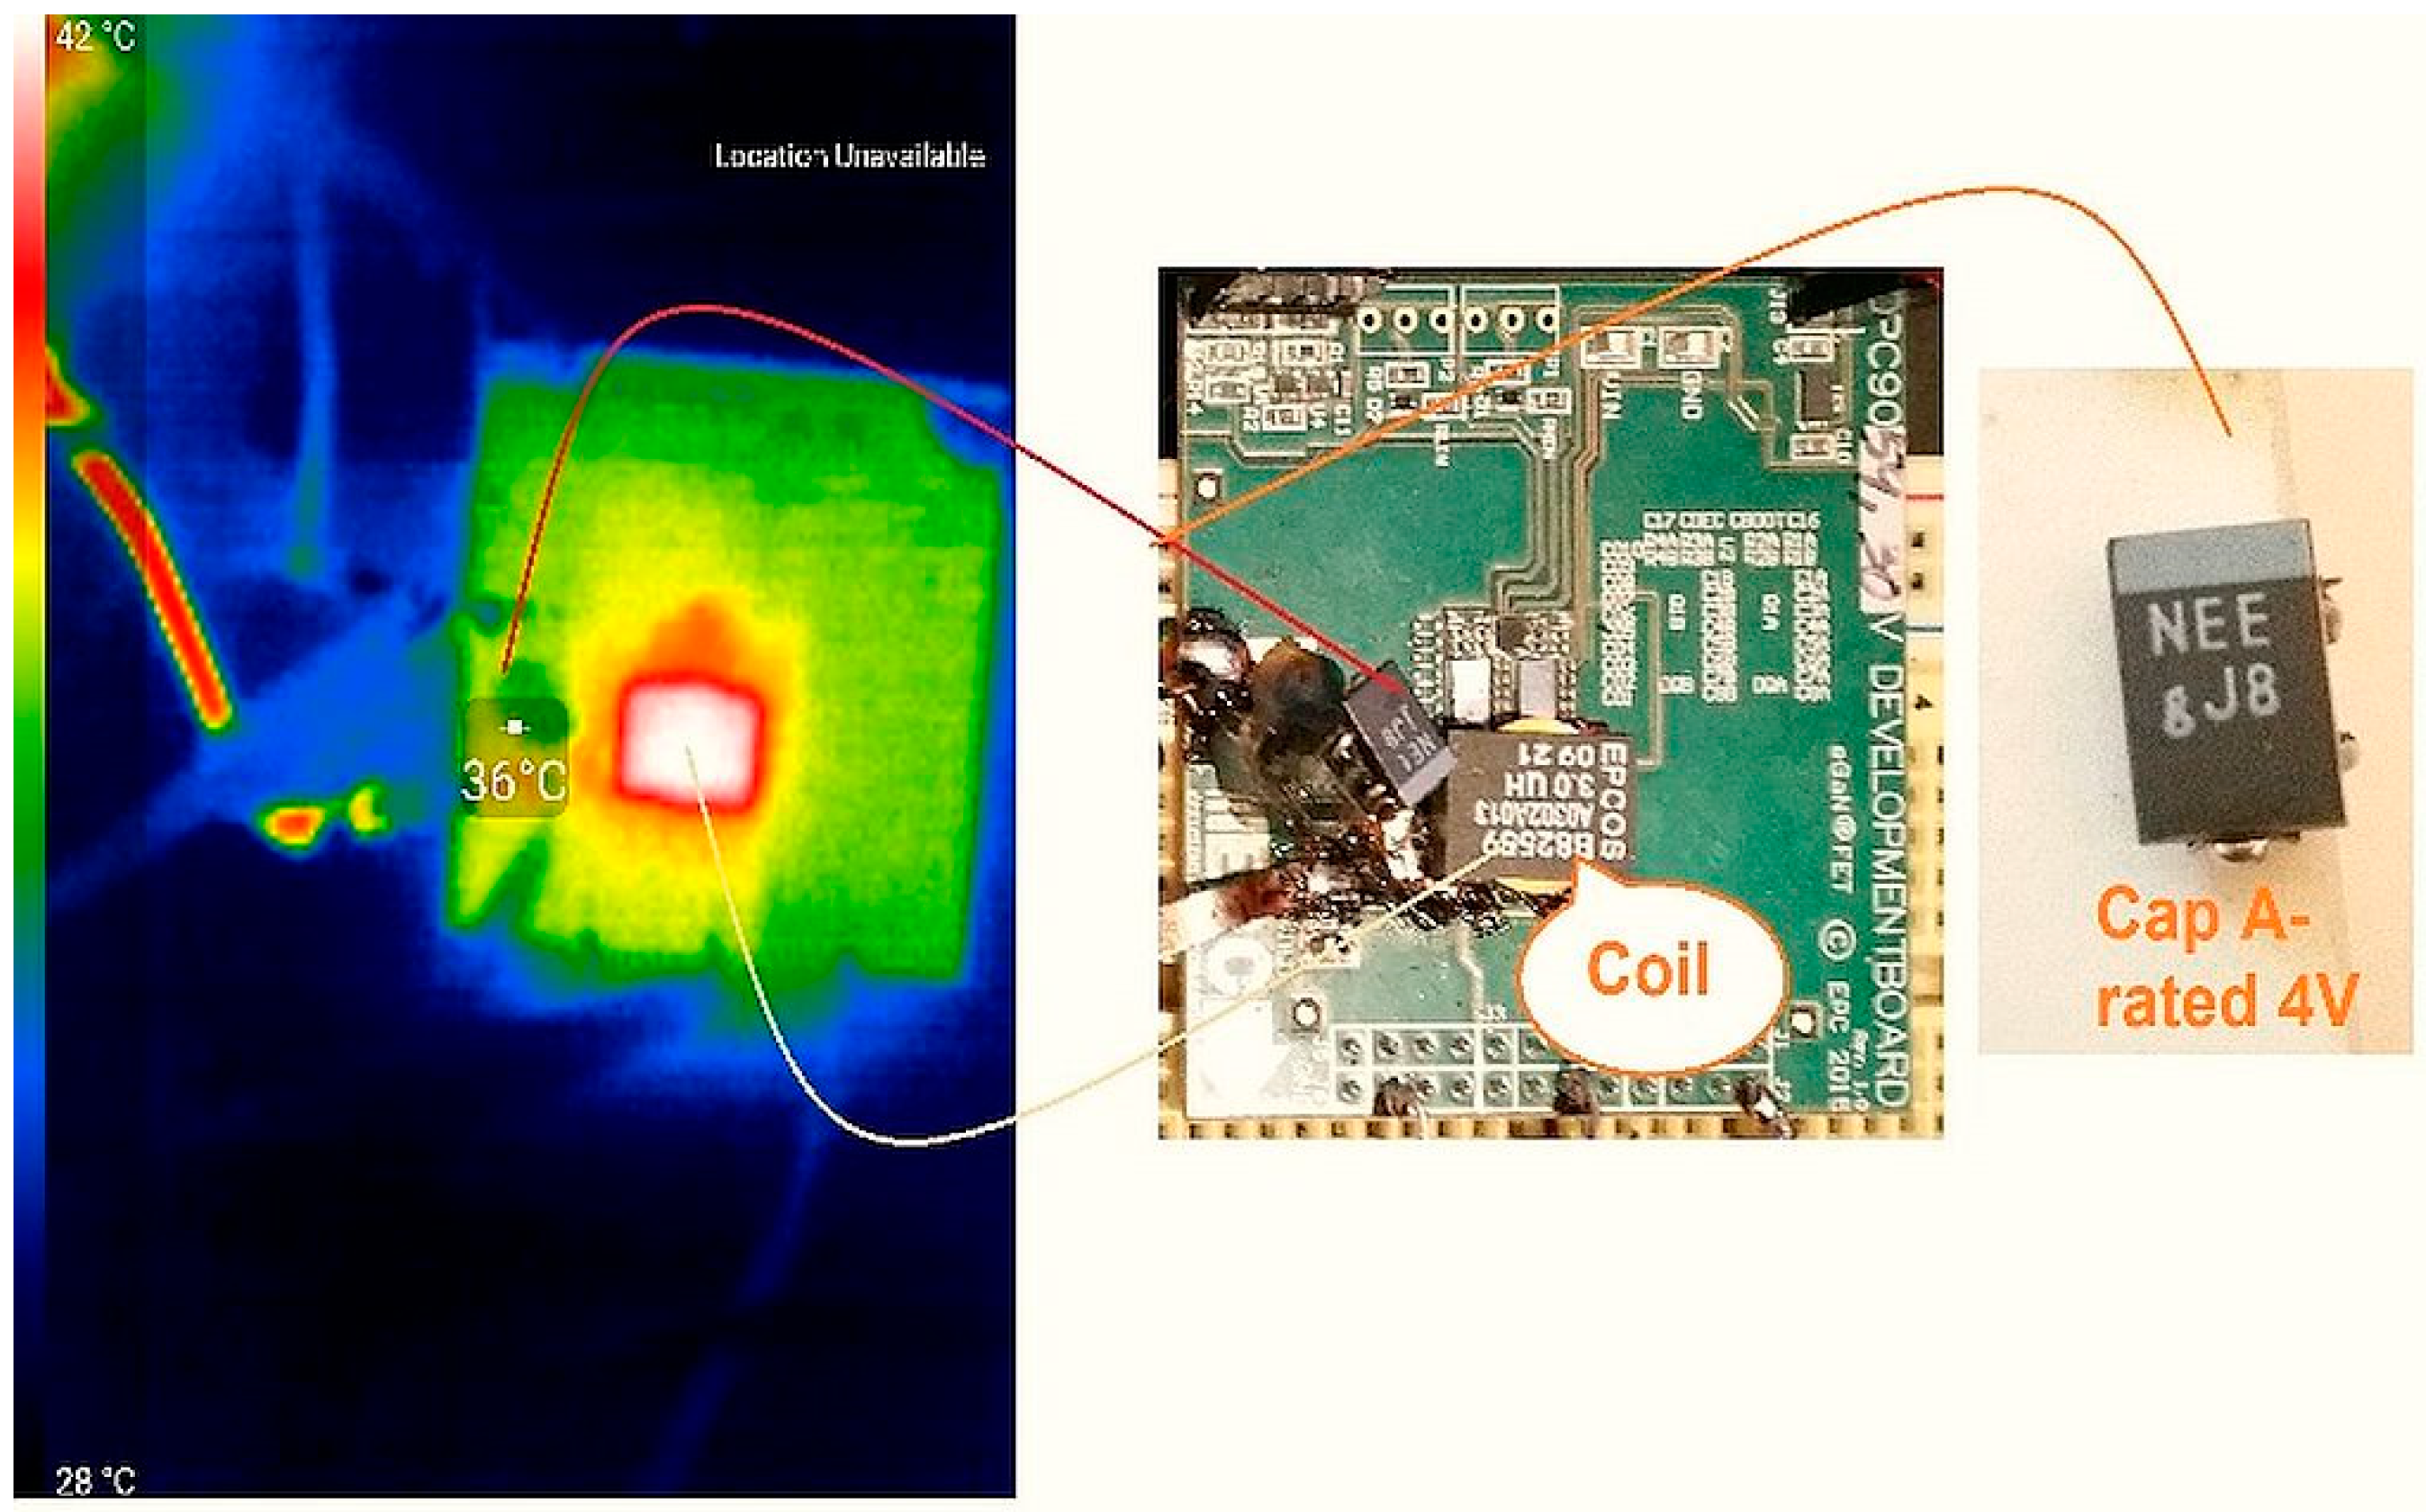
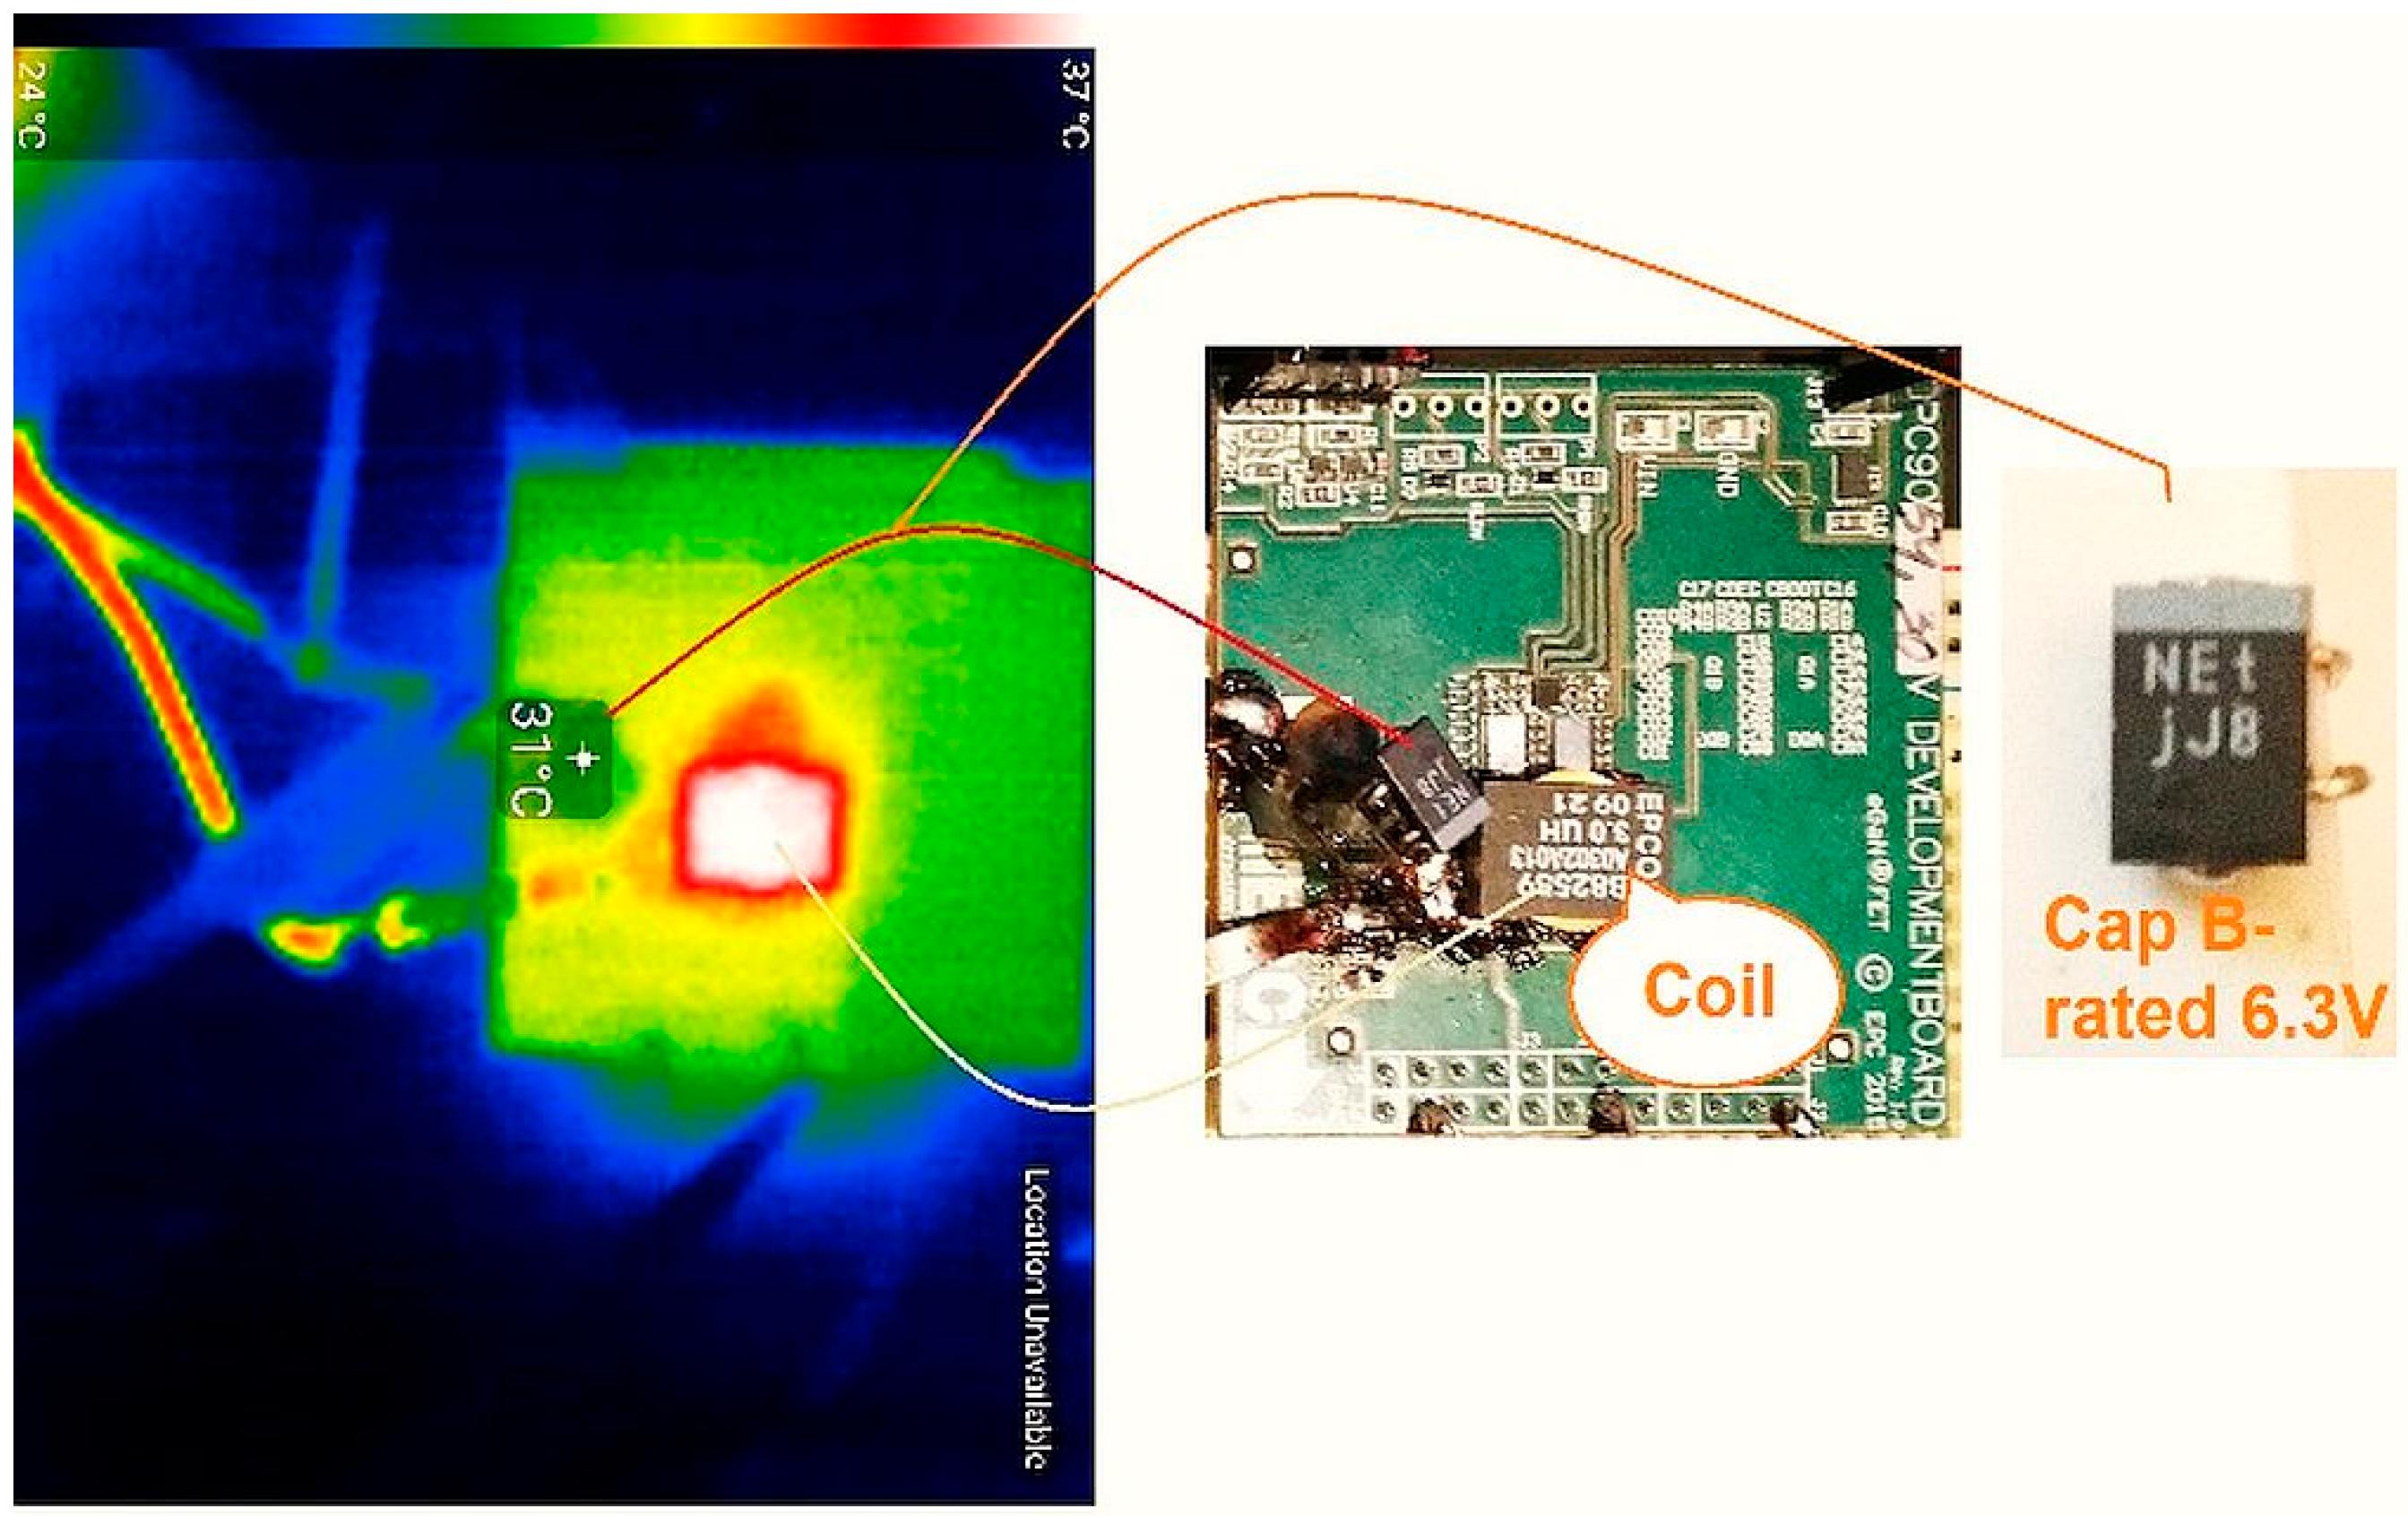
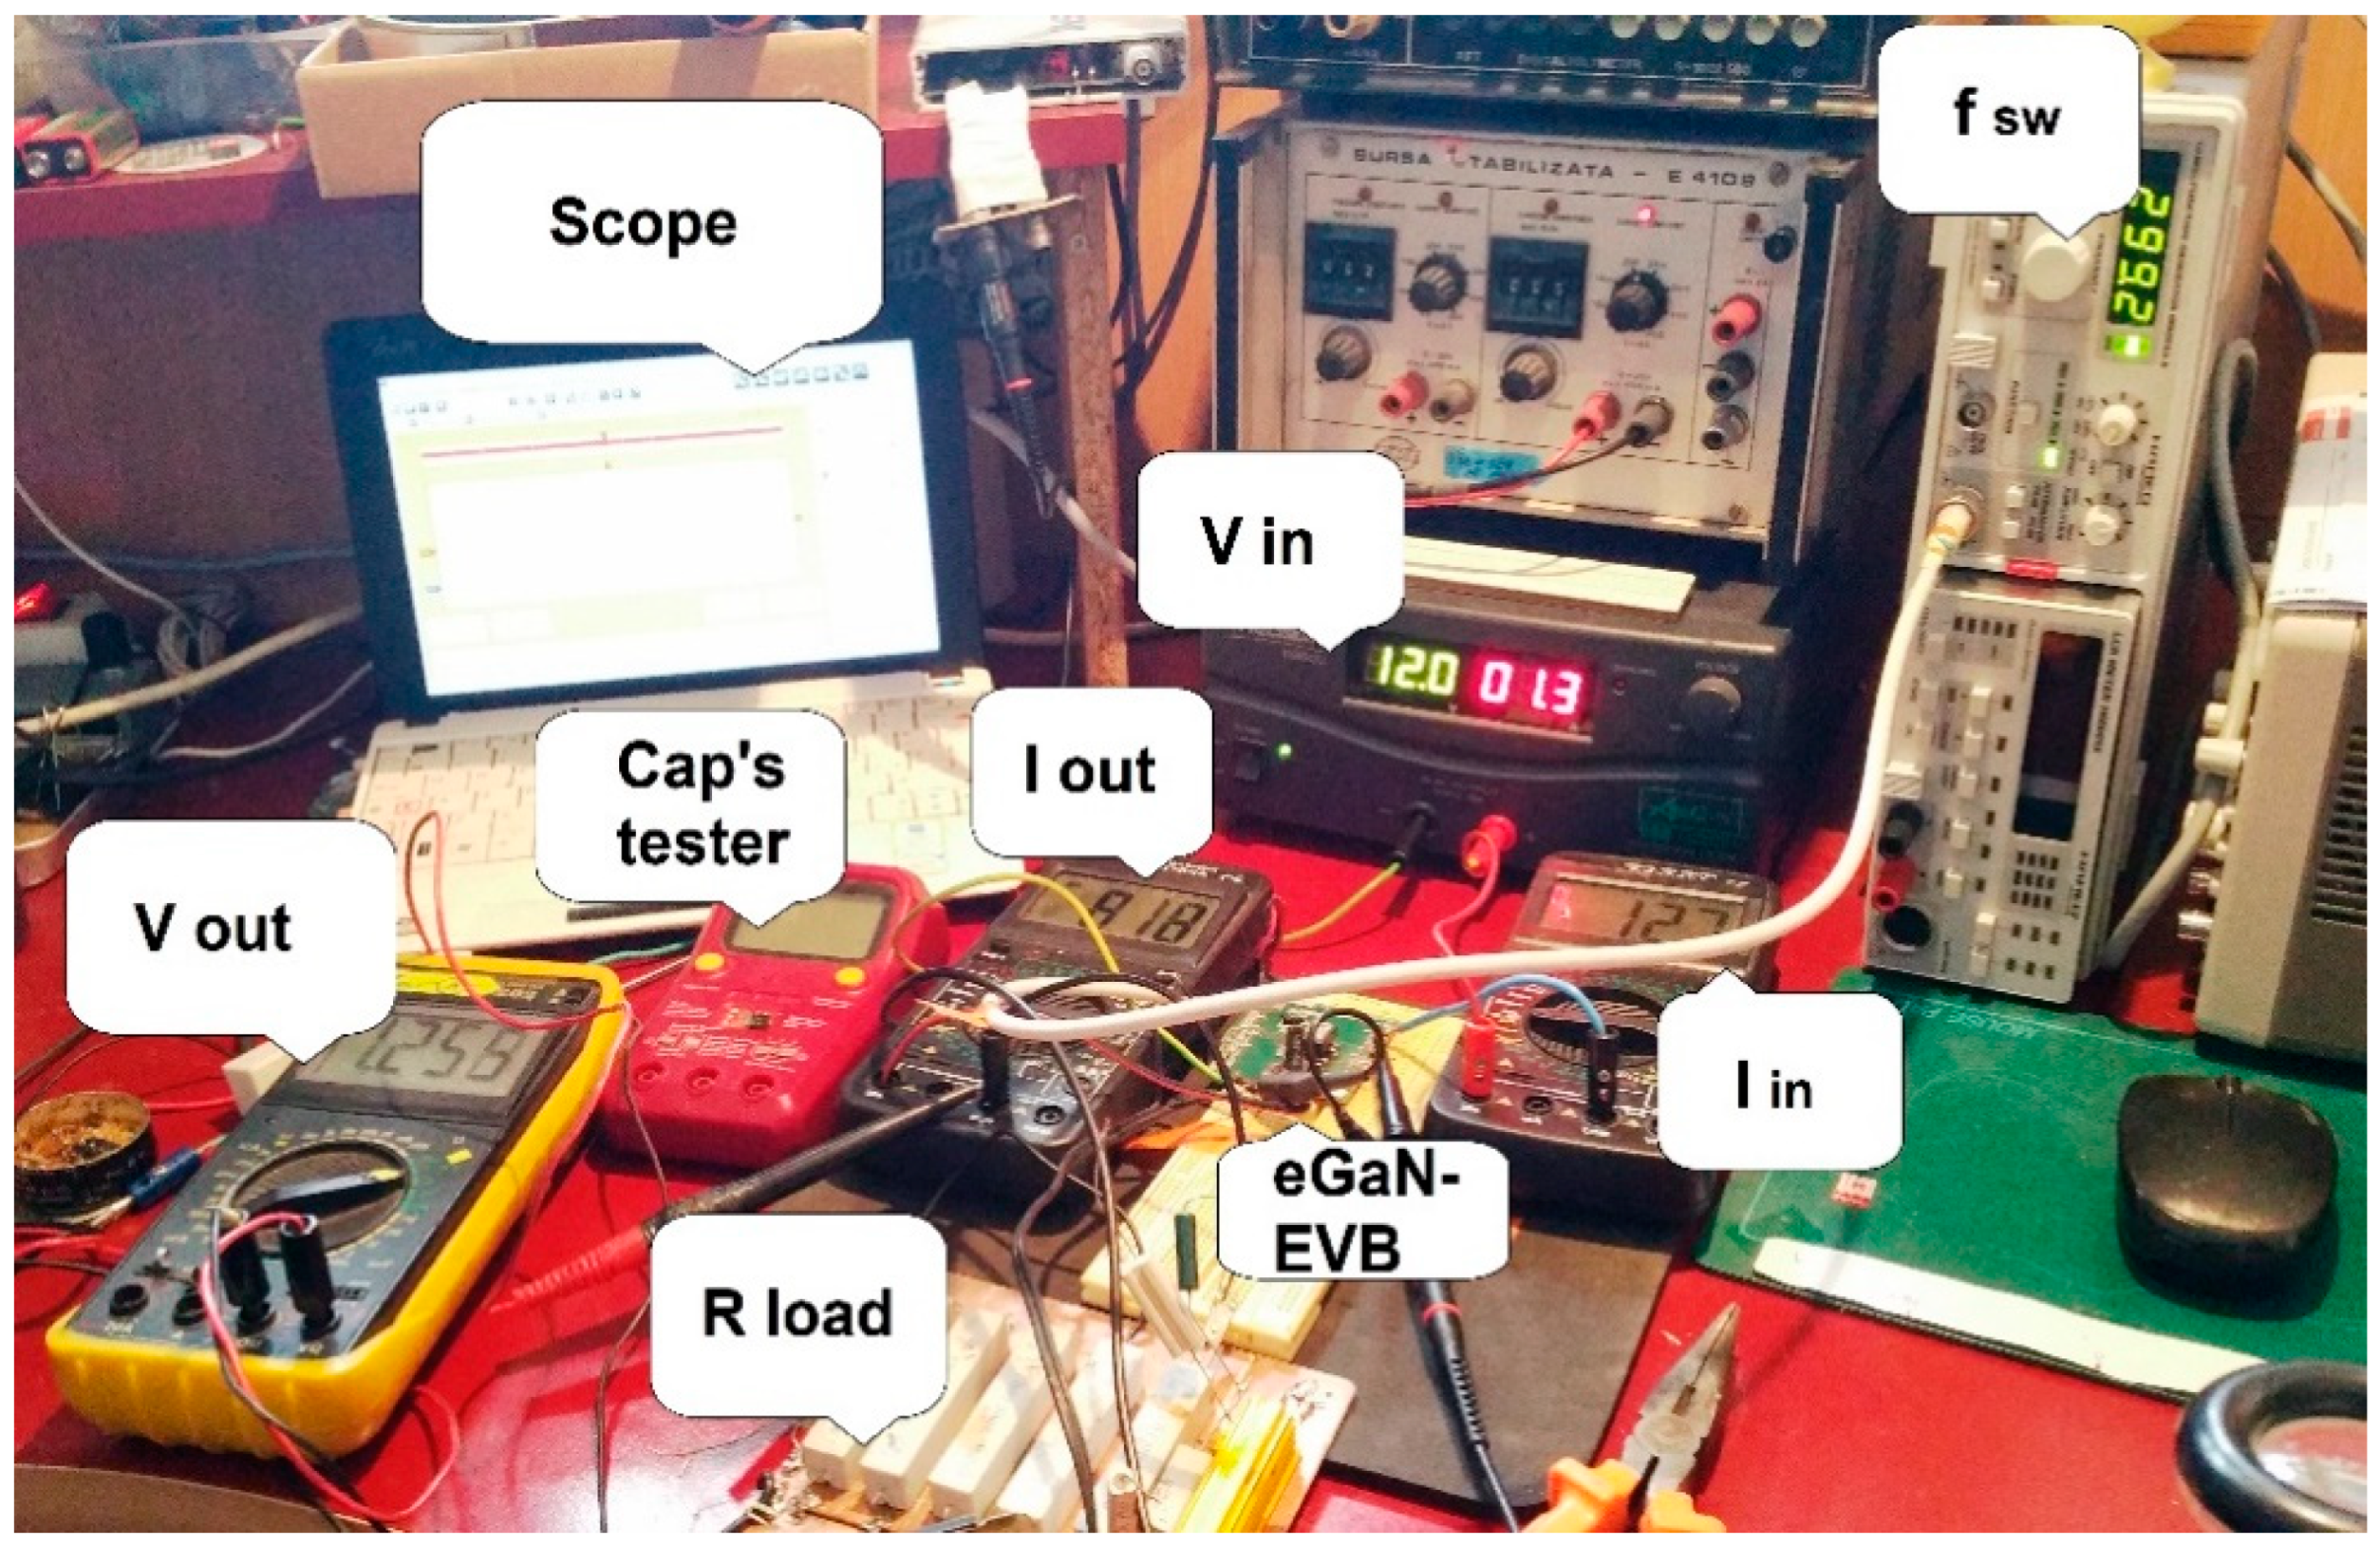
3.1. Experimental Workbench SET-UP, Key Measurements, and the Mode of Investigation
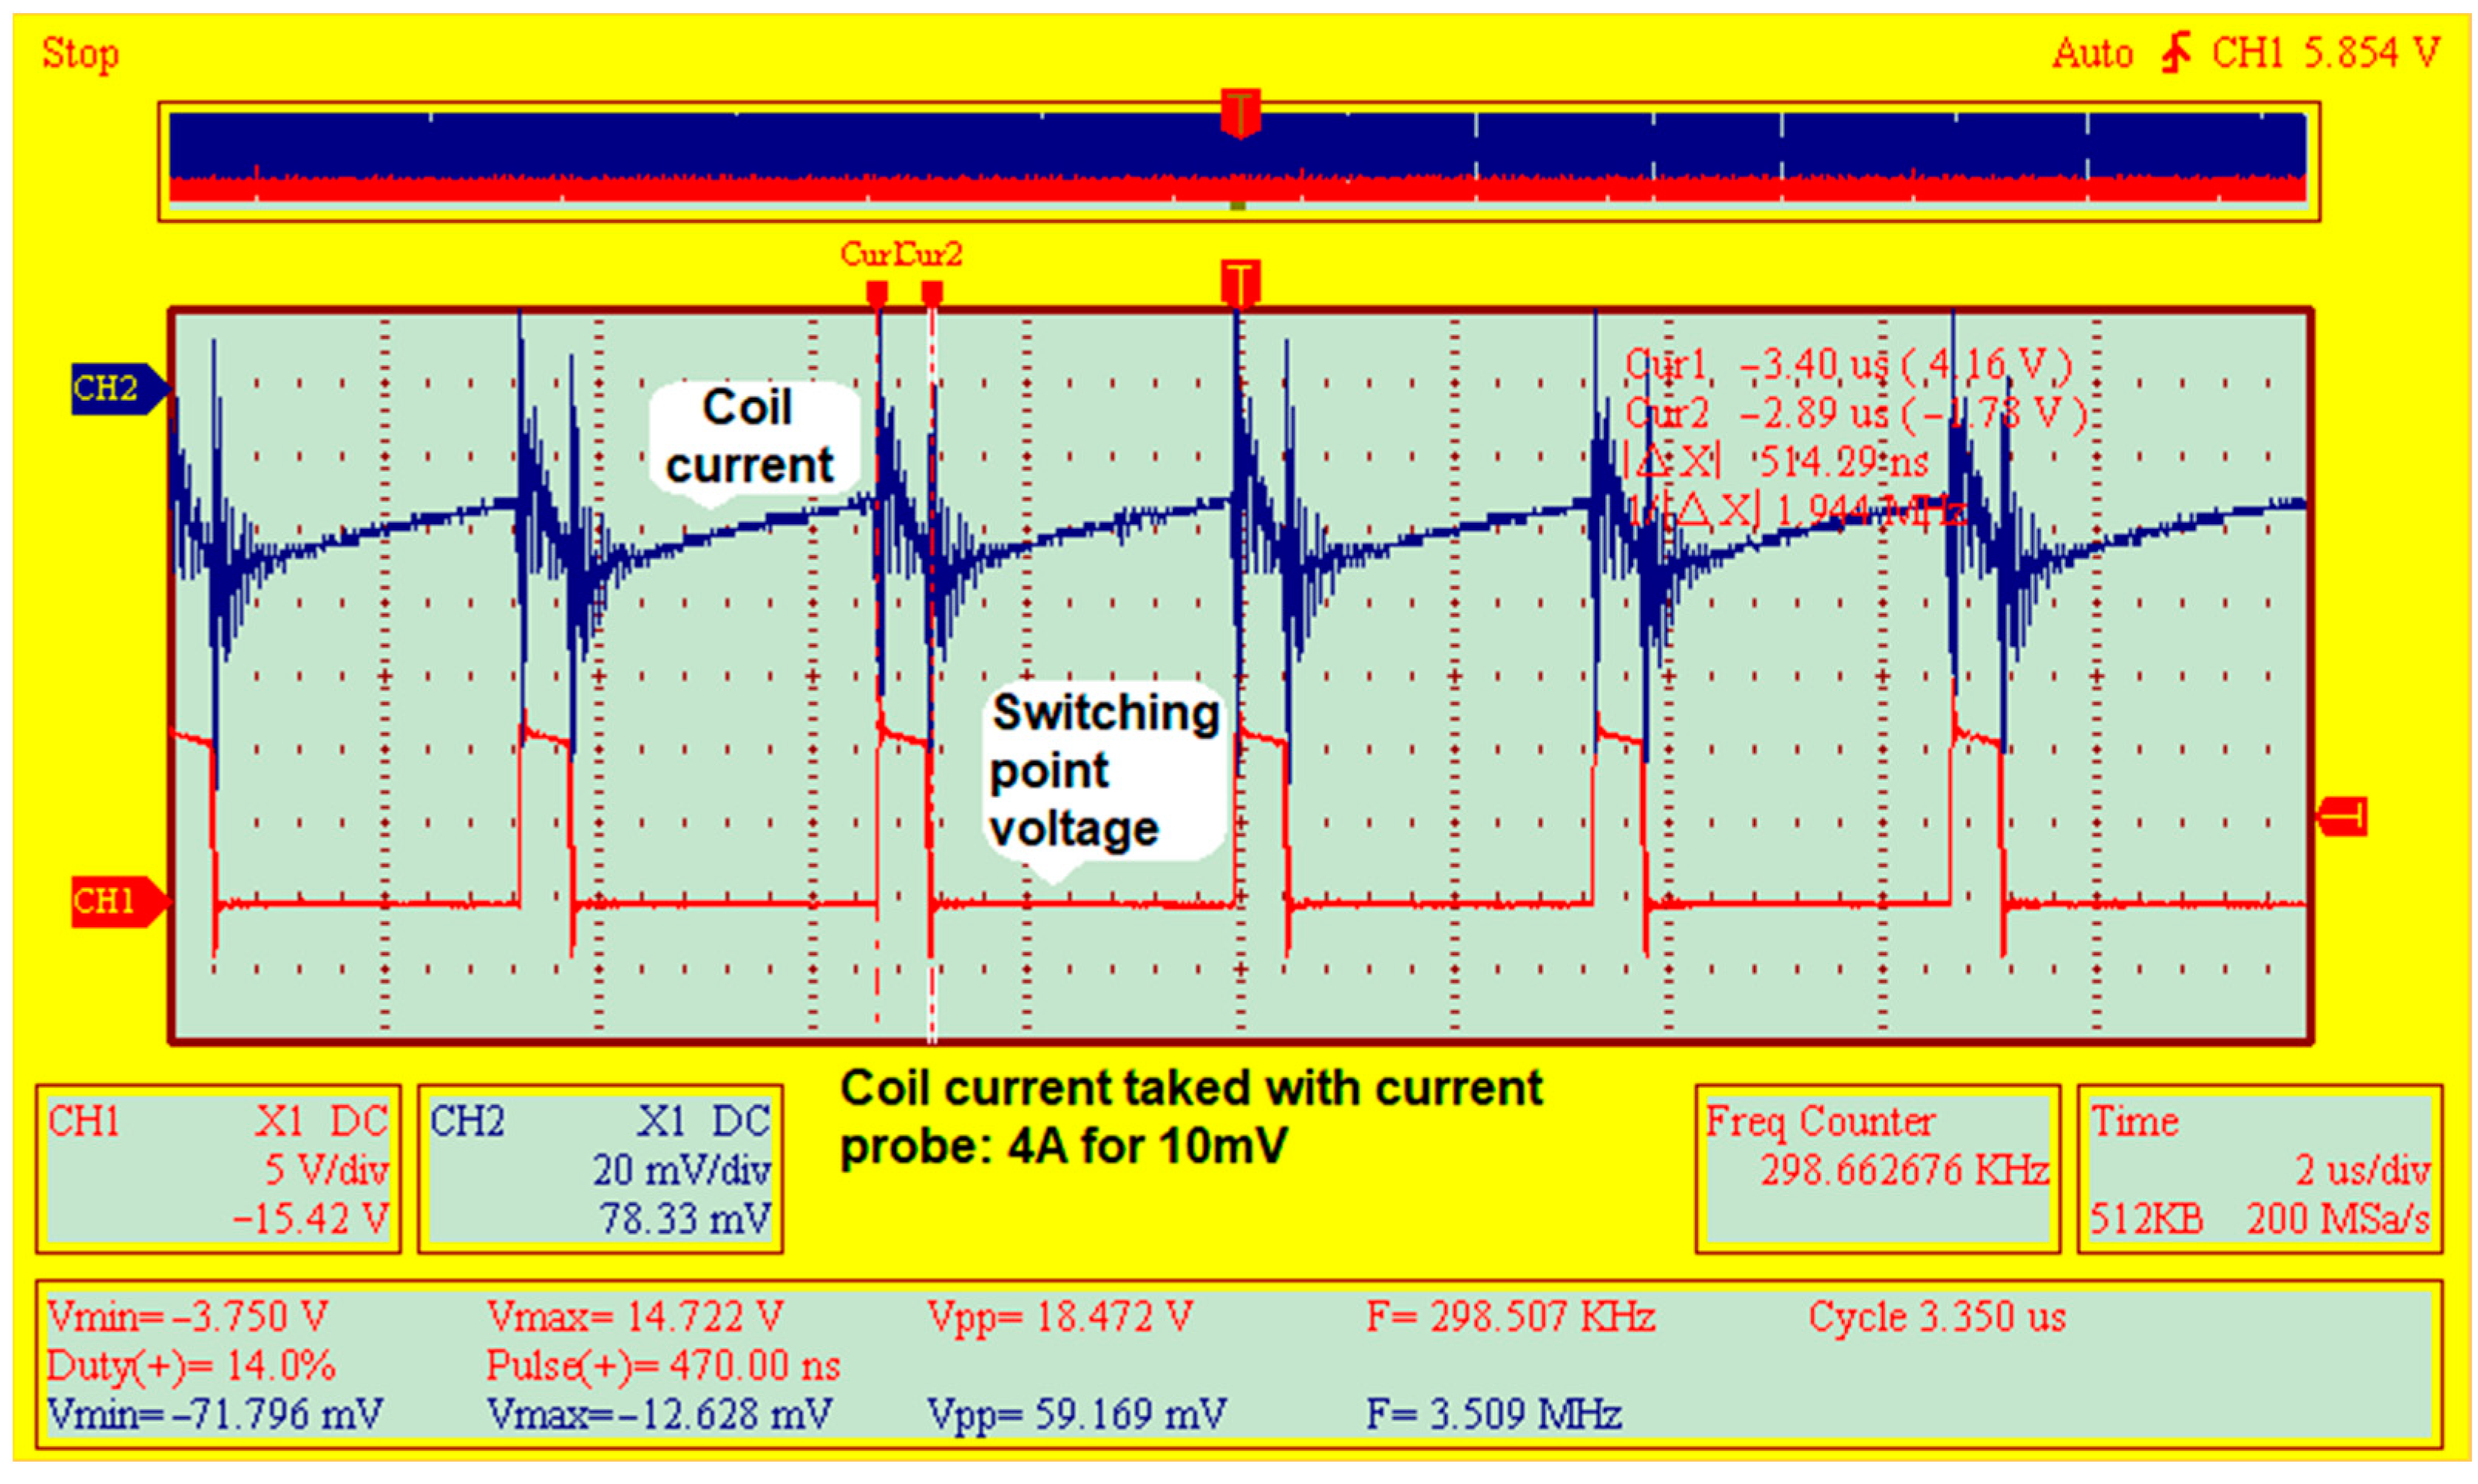
- The intensity of the current through the converter’s inductance L = 3 μH (a SMD power coil constructed with flat wire windings), which was collected by a current probe. The current probe used in the experiment had a 10-mV output voltage, corresponding to 4 A as measured.
- The voltage measured in the so-called “switching point” (at the junction between high FET and synchro FET).
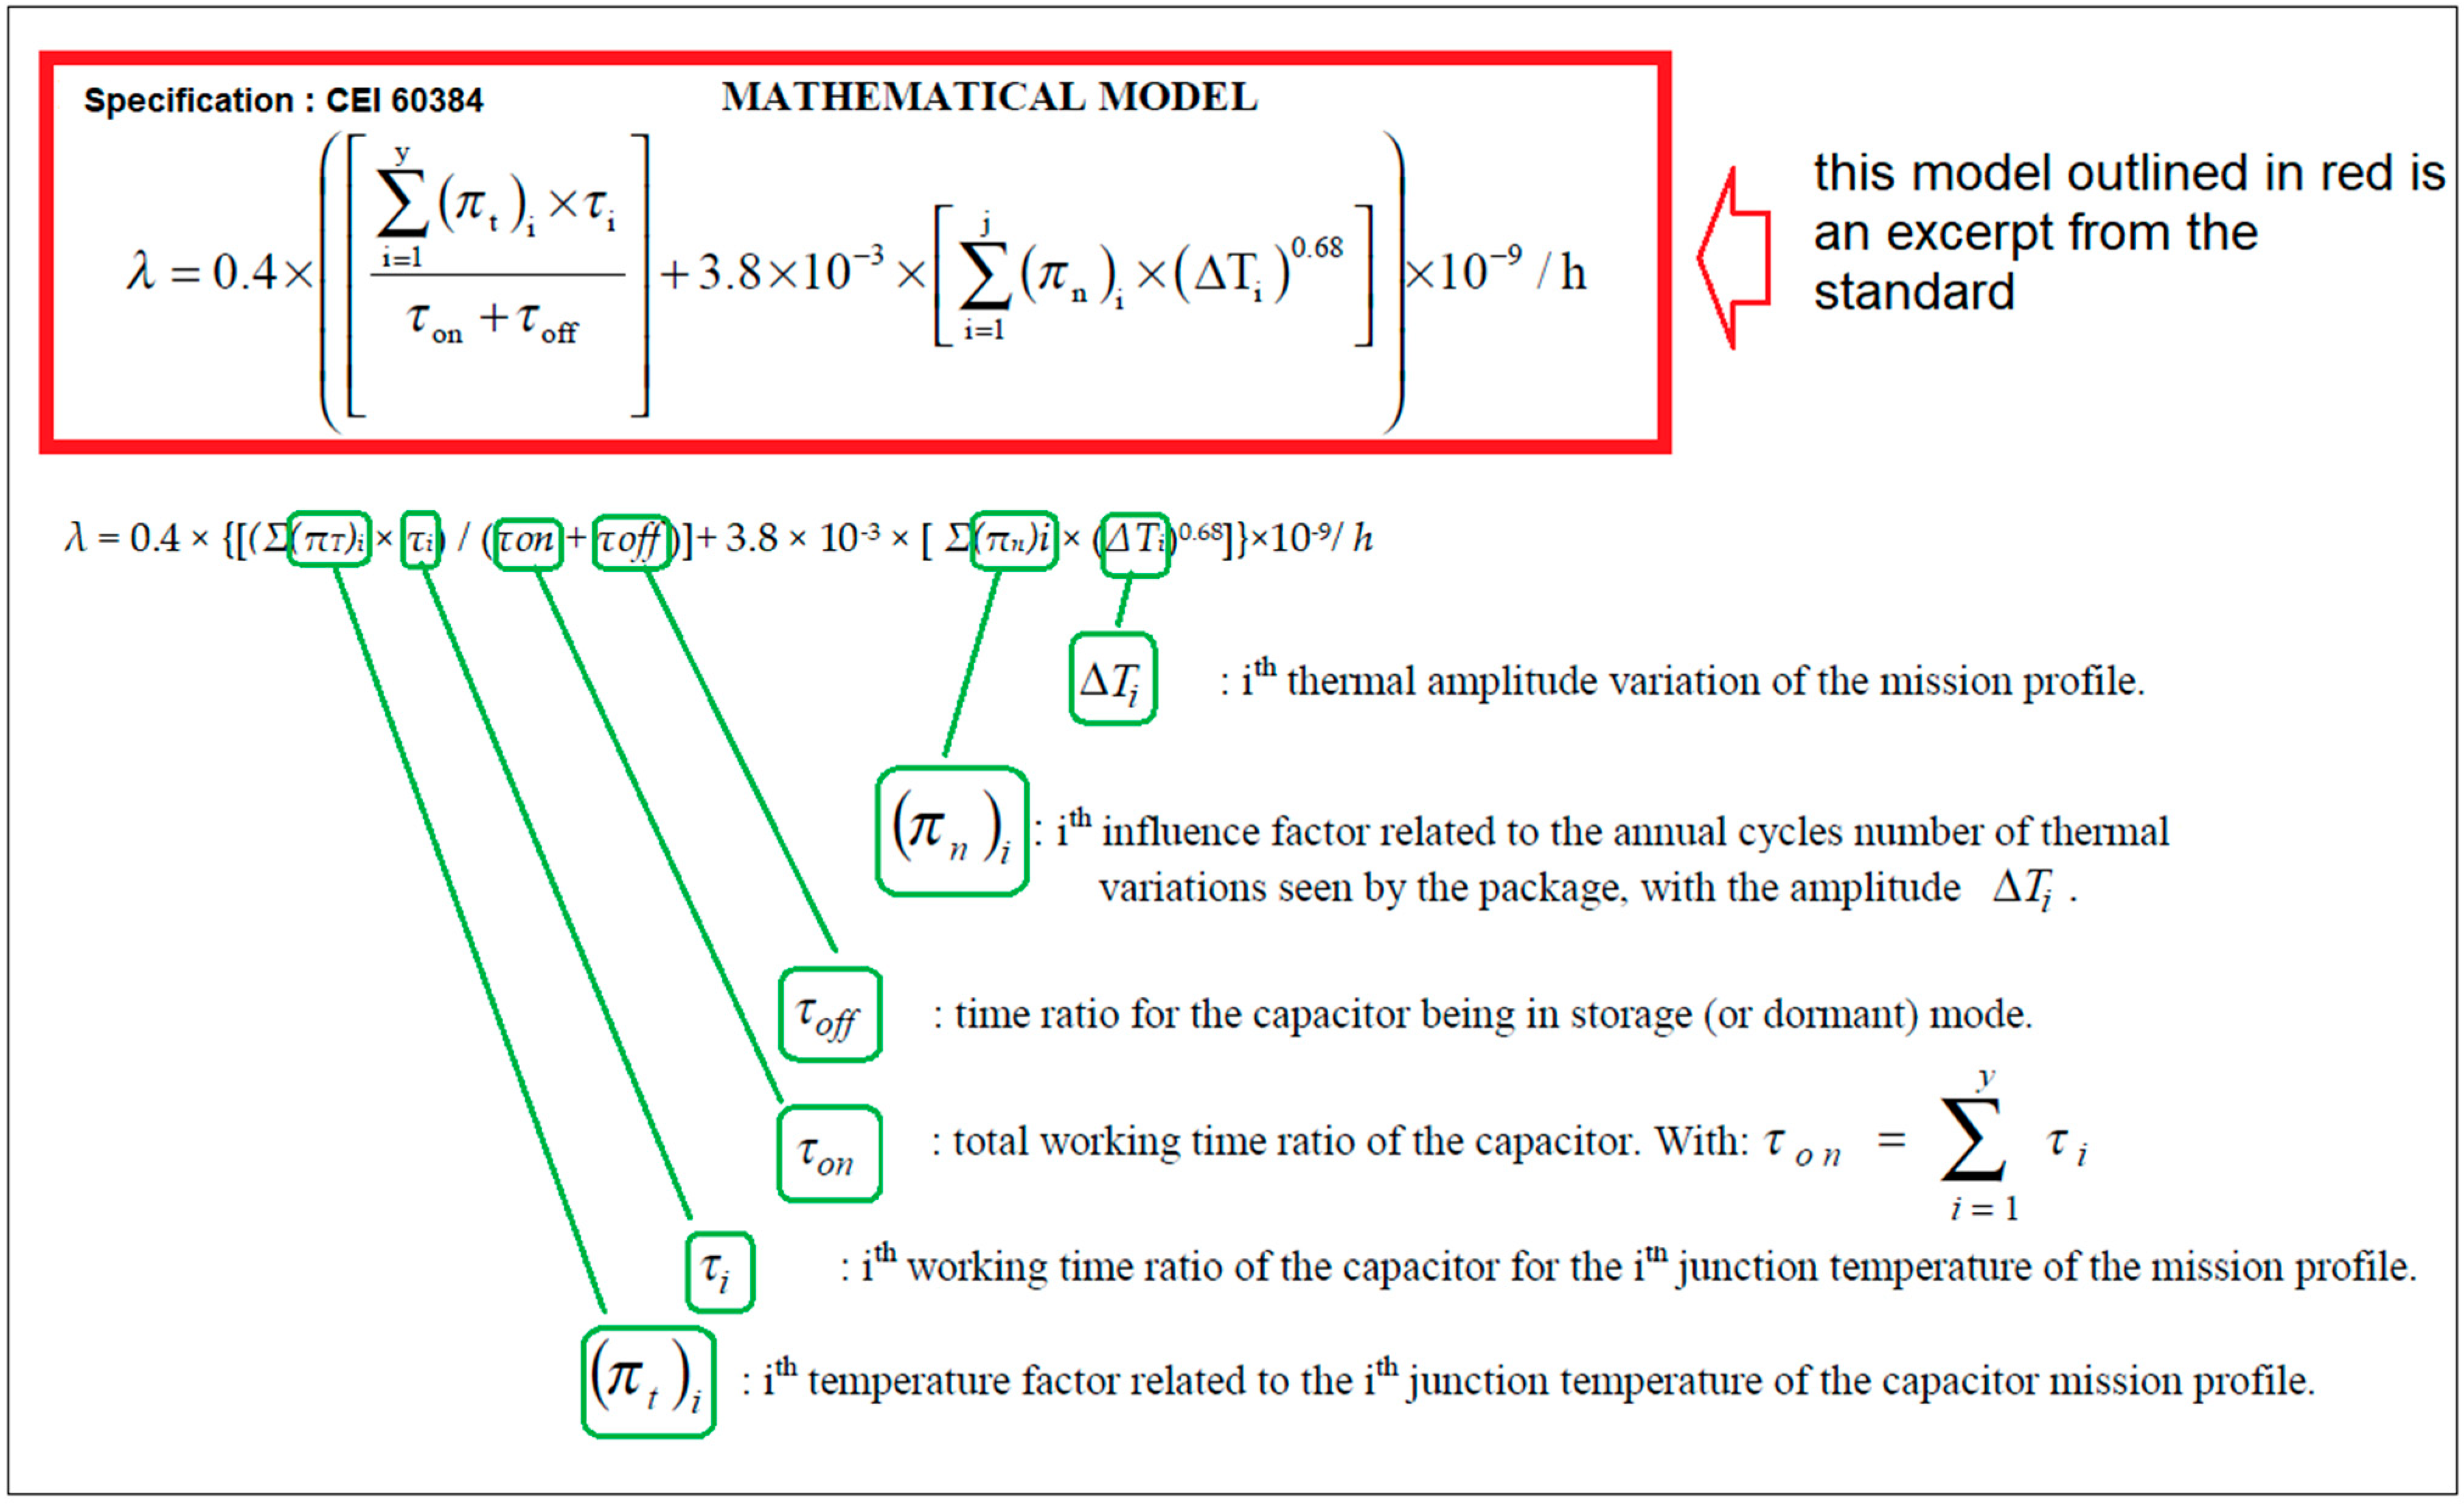
3.2. Reliability Calculation
- τi = 365 days × duty cycle = 365 × 0.13
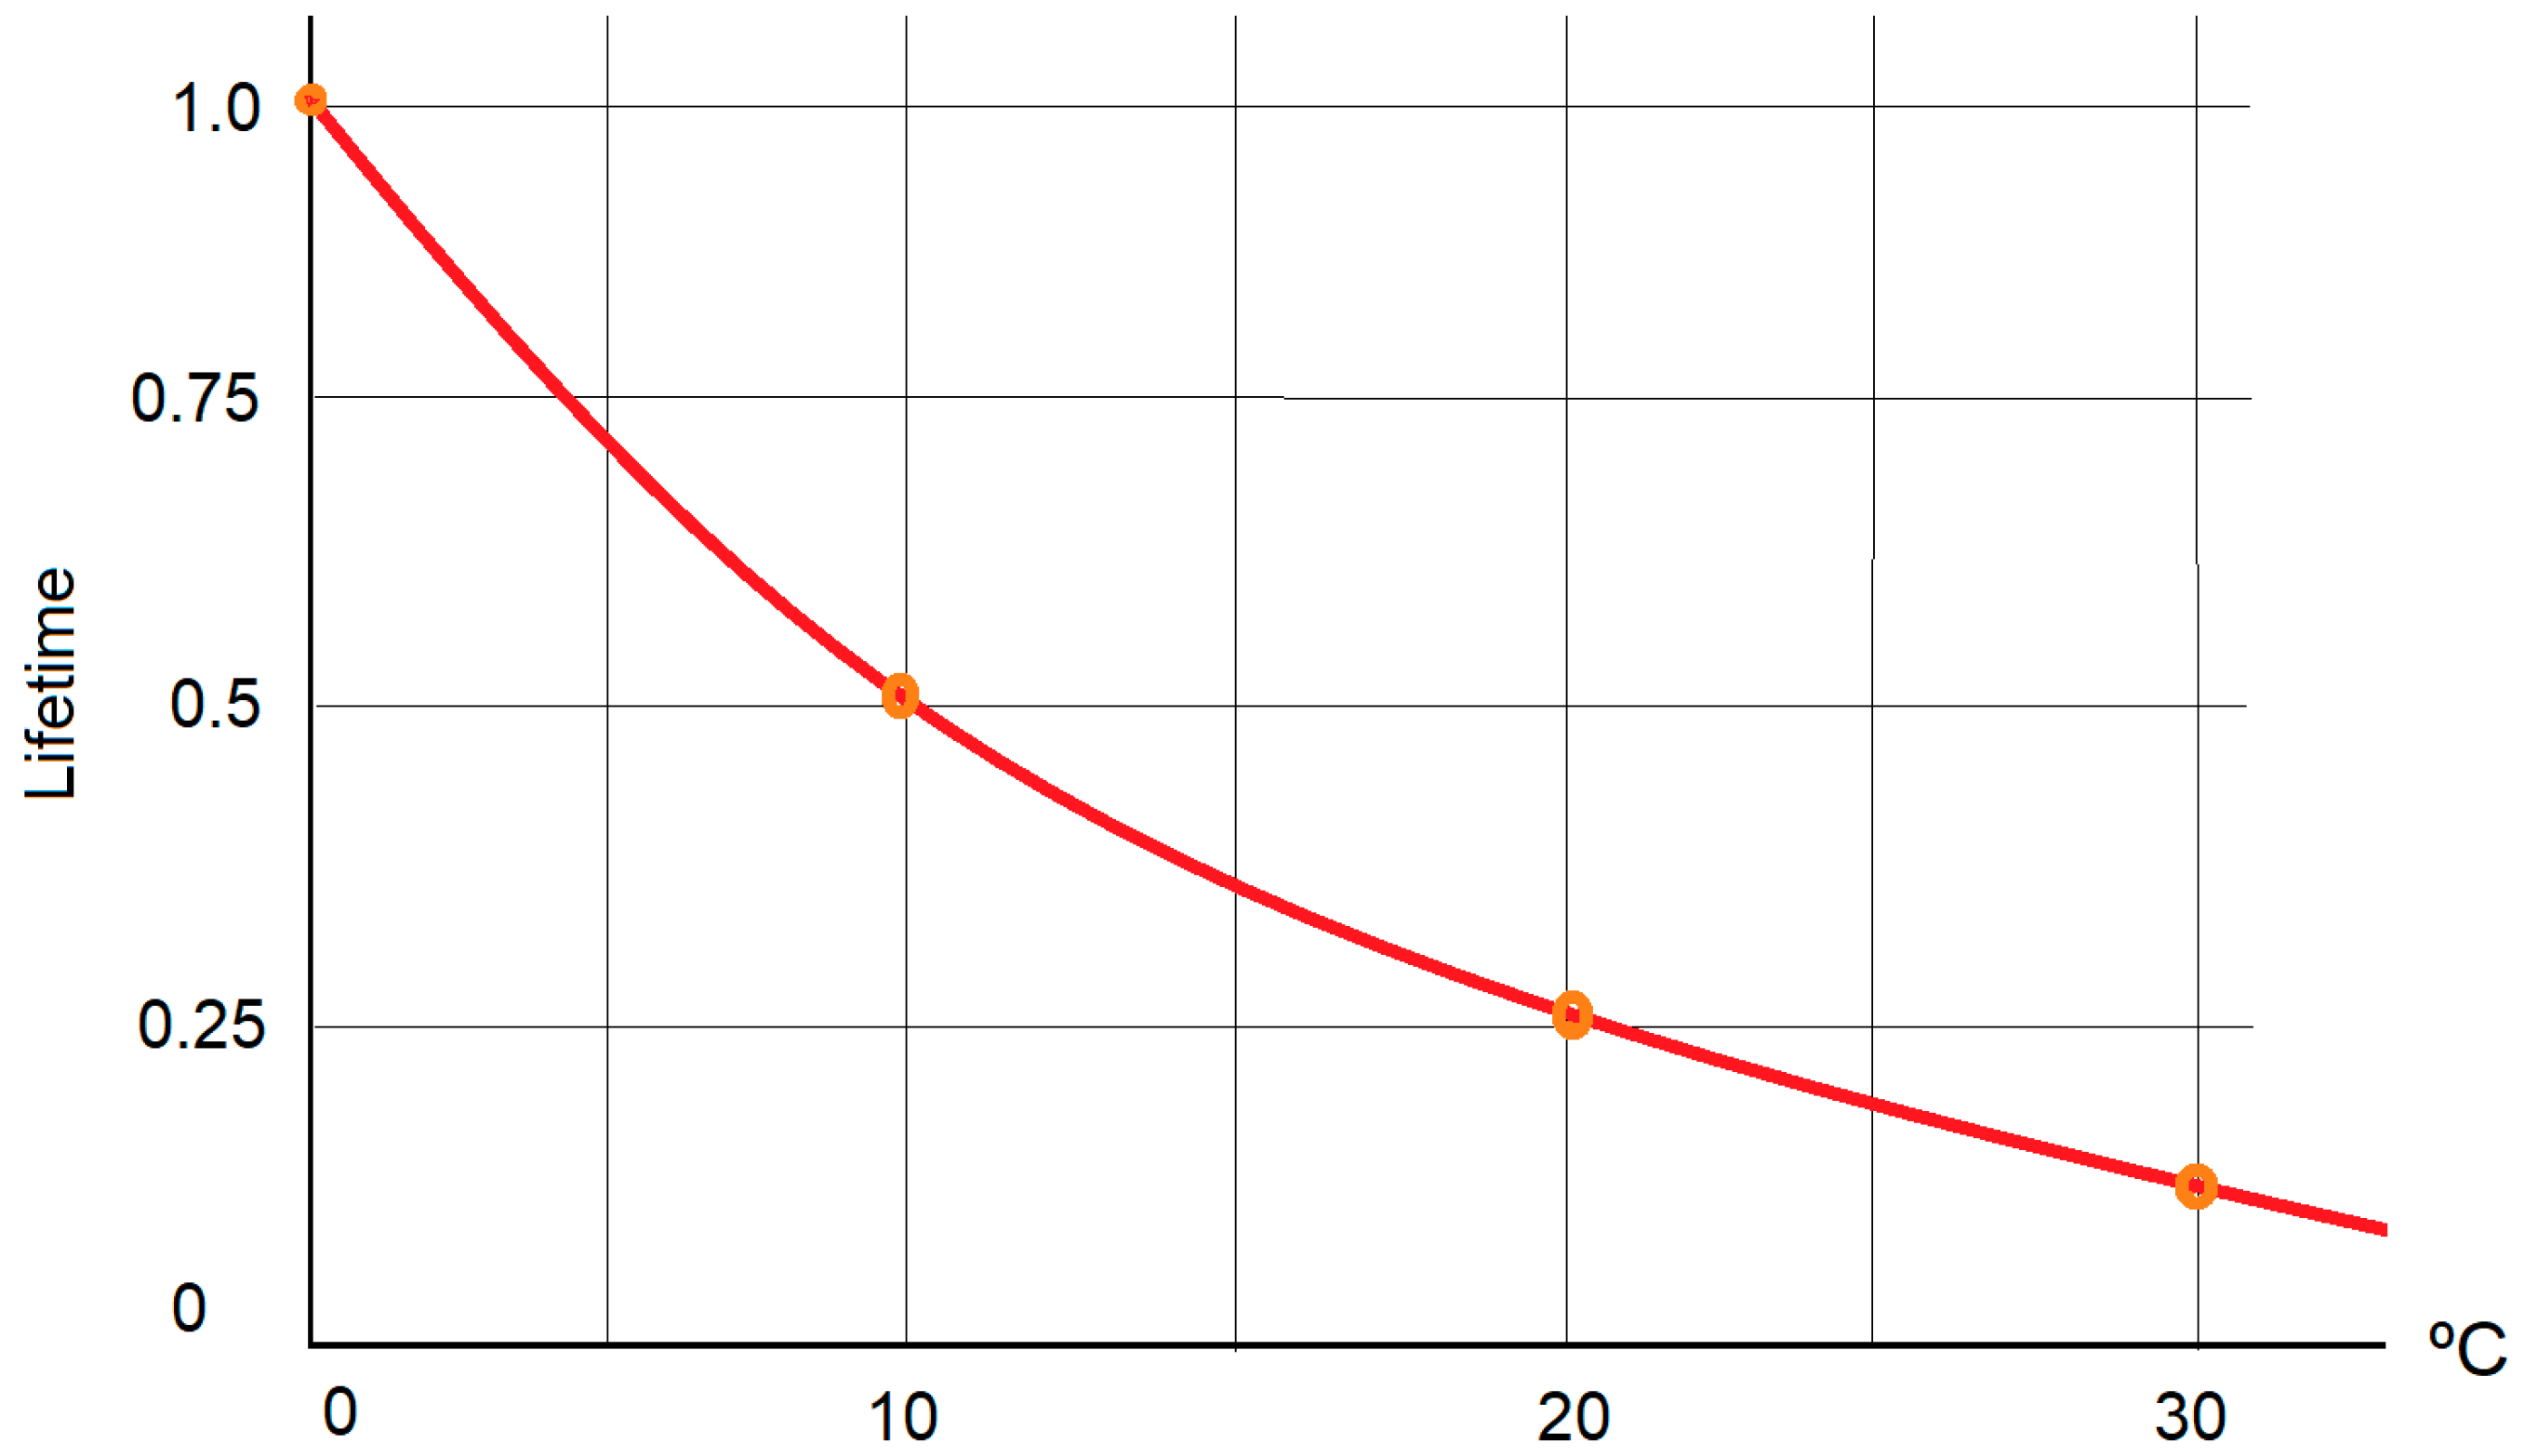
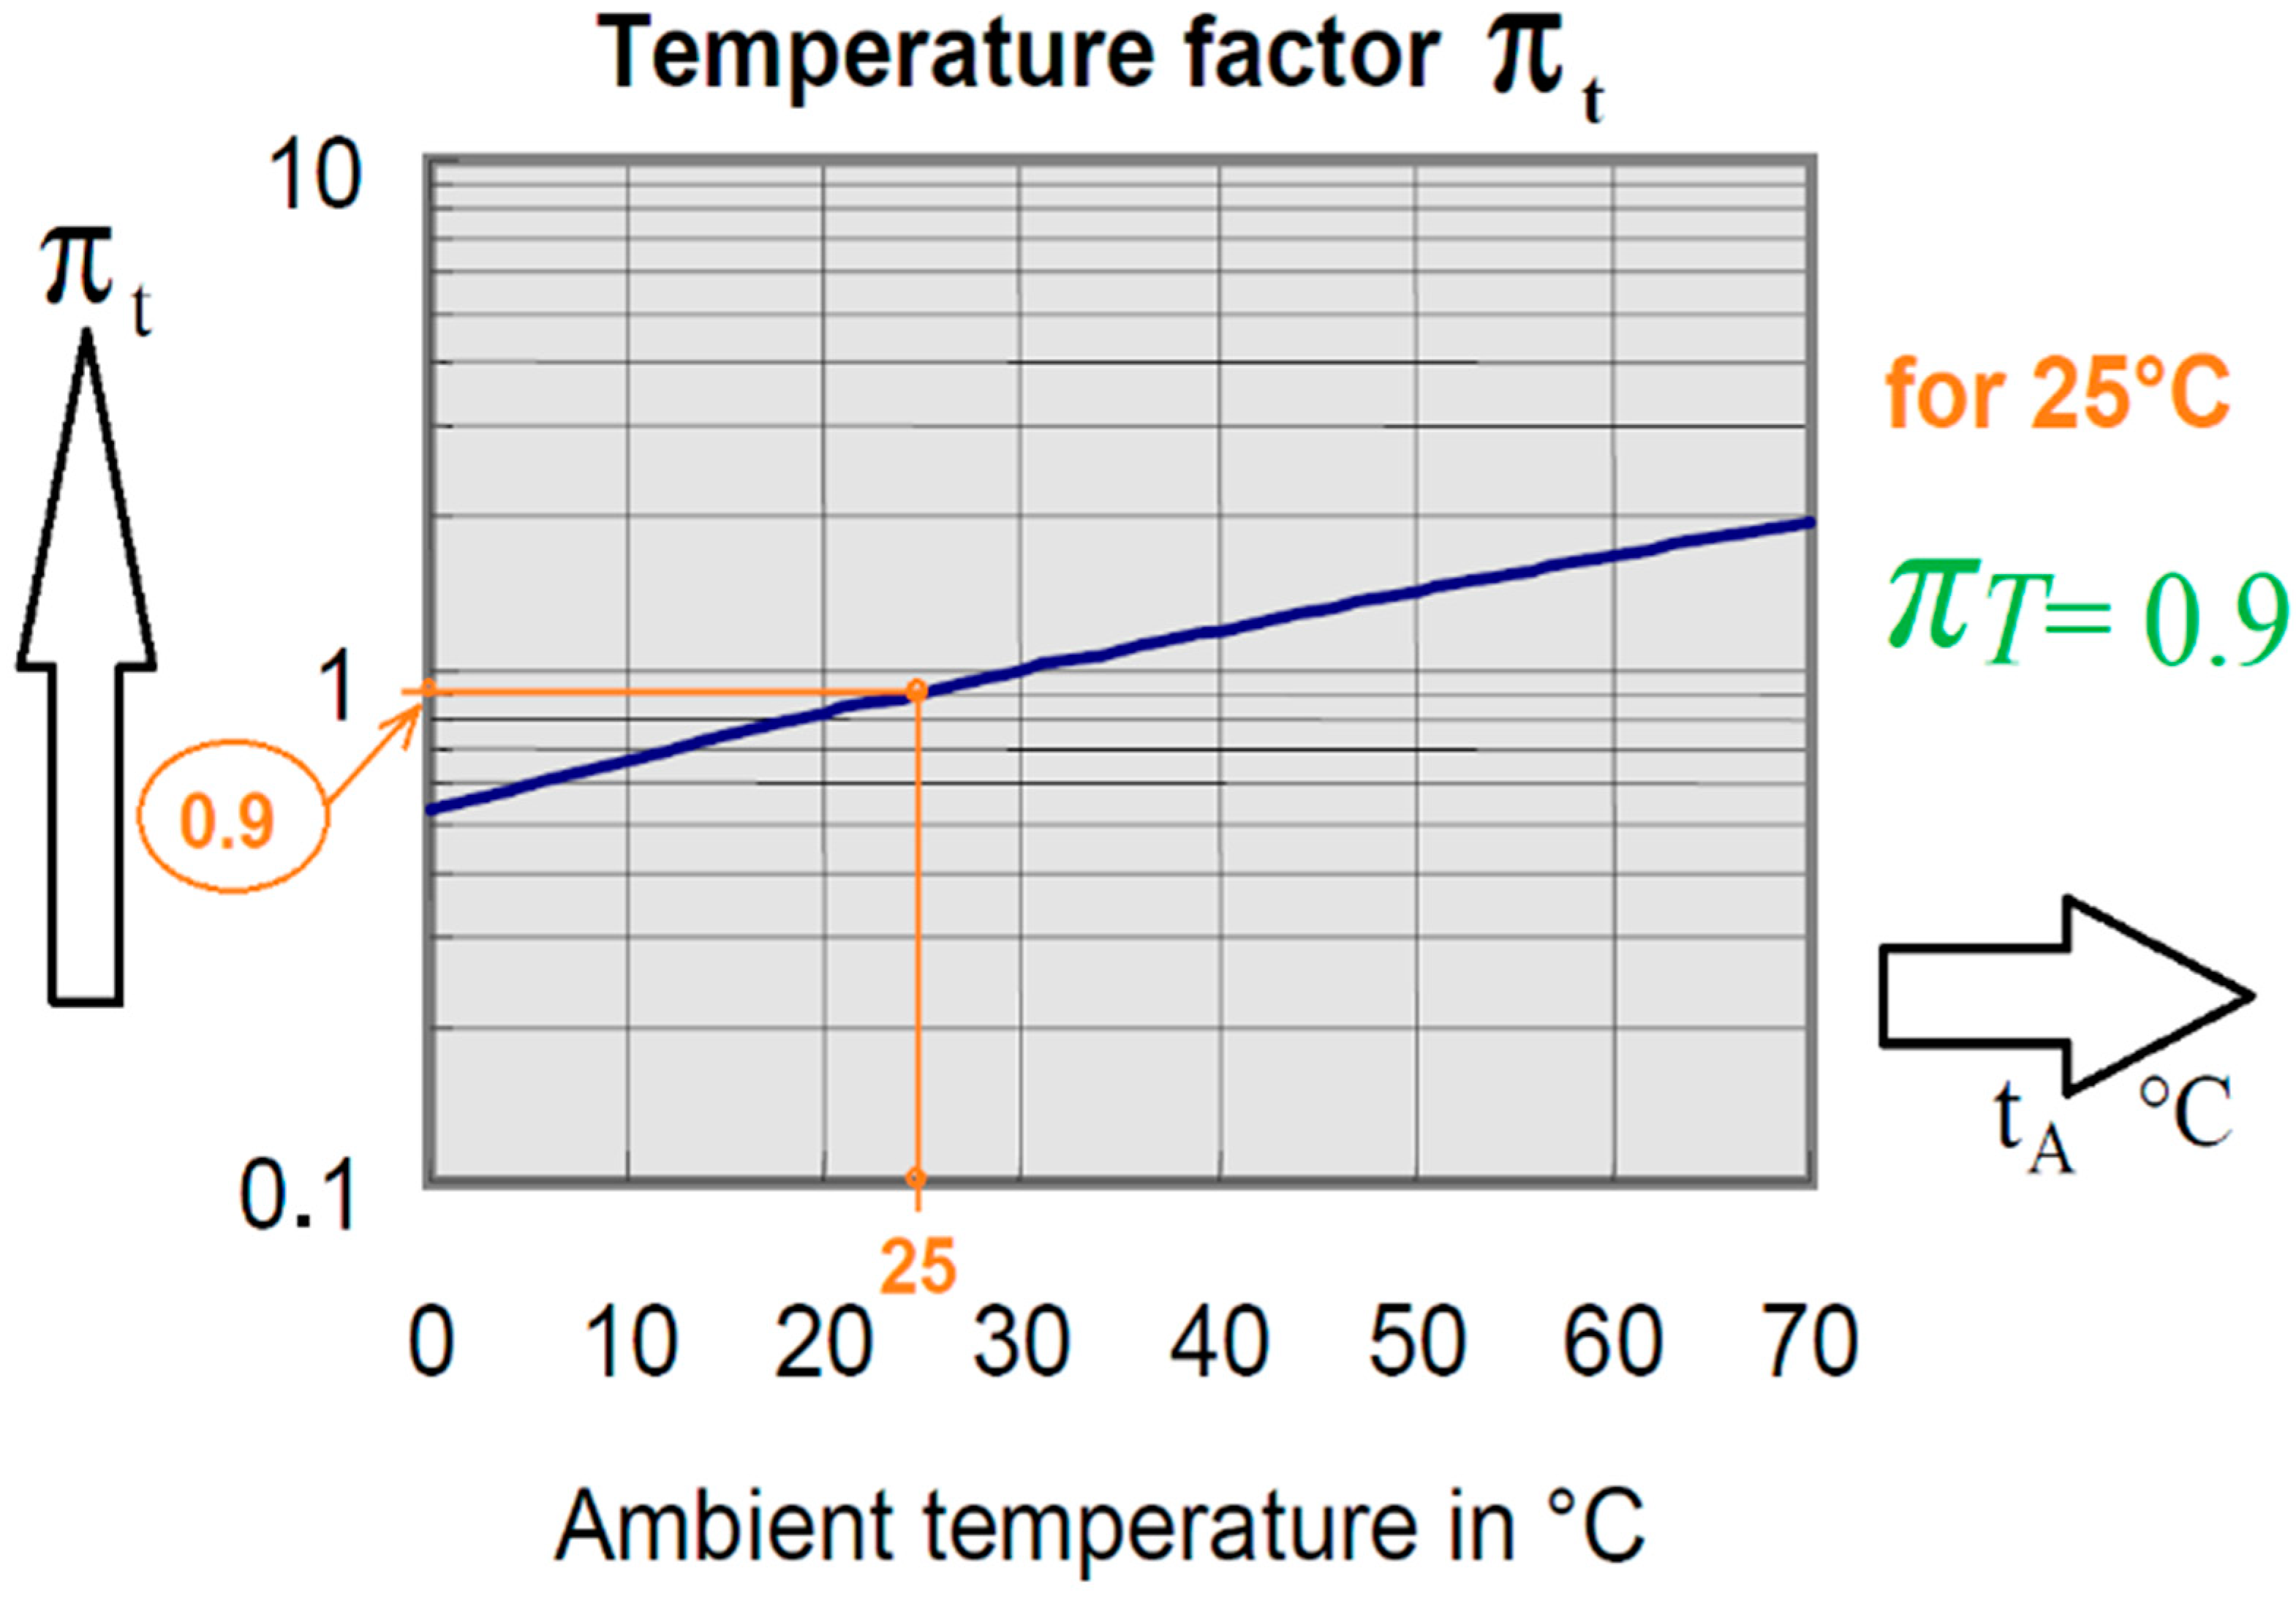
- πT = 0.9 derived from Figure 11 @ 25 °C
- ni = 365 and (πn)i = (ni0.76) × 1.7
- τon = 1 and τoff = 0
- Σ(πn)i = ni and Σ(πT)i = πT
- ΔTi = capacitor’s surface temperature—ambient temperature
- λpolimer capA = 0.4 × {[(0.9 × 54.75)/(1 + 0)] + 1.4 × (10−3) × [(1.7 × 3650.6) × (36 − 25)0.68]} × (10−9)/h = 7215.425 FIT = 7.215425 F/106 h
- λpolimer capB[derated] = 0.4 × {[(0.9 × 54.75)/(1 + 0)] + 1.4 × (10−3) × [(1.7 × 3650.6) × (31 − 25)0.68]} × (10−9)/h = 6821.755 FIT = 6.821755 F/106 h
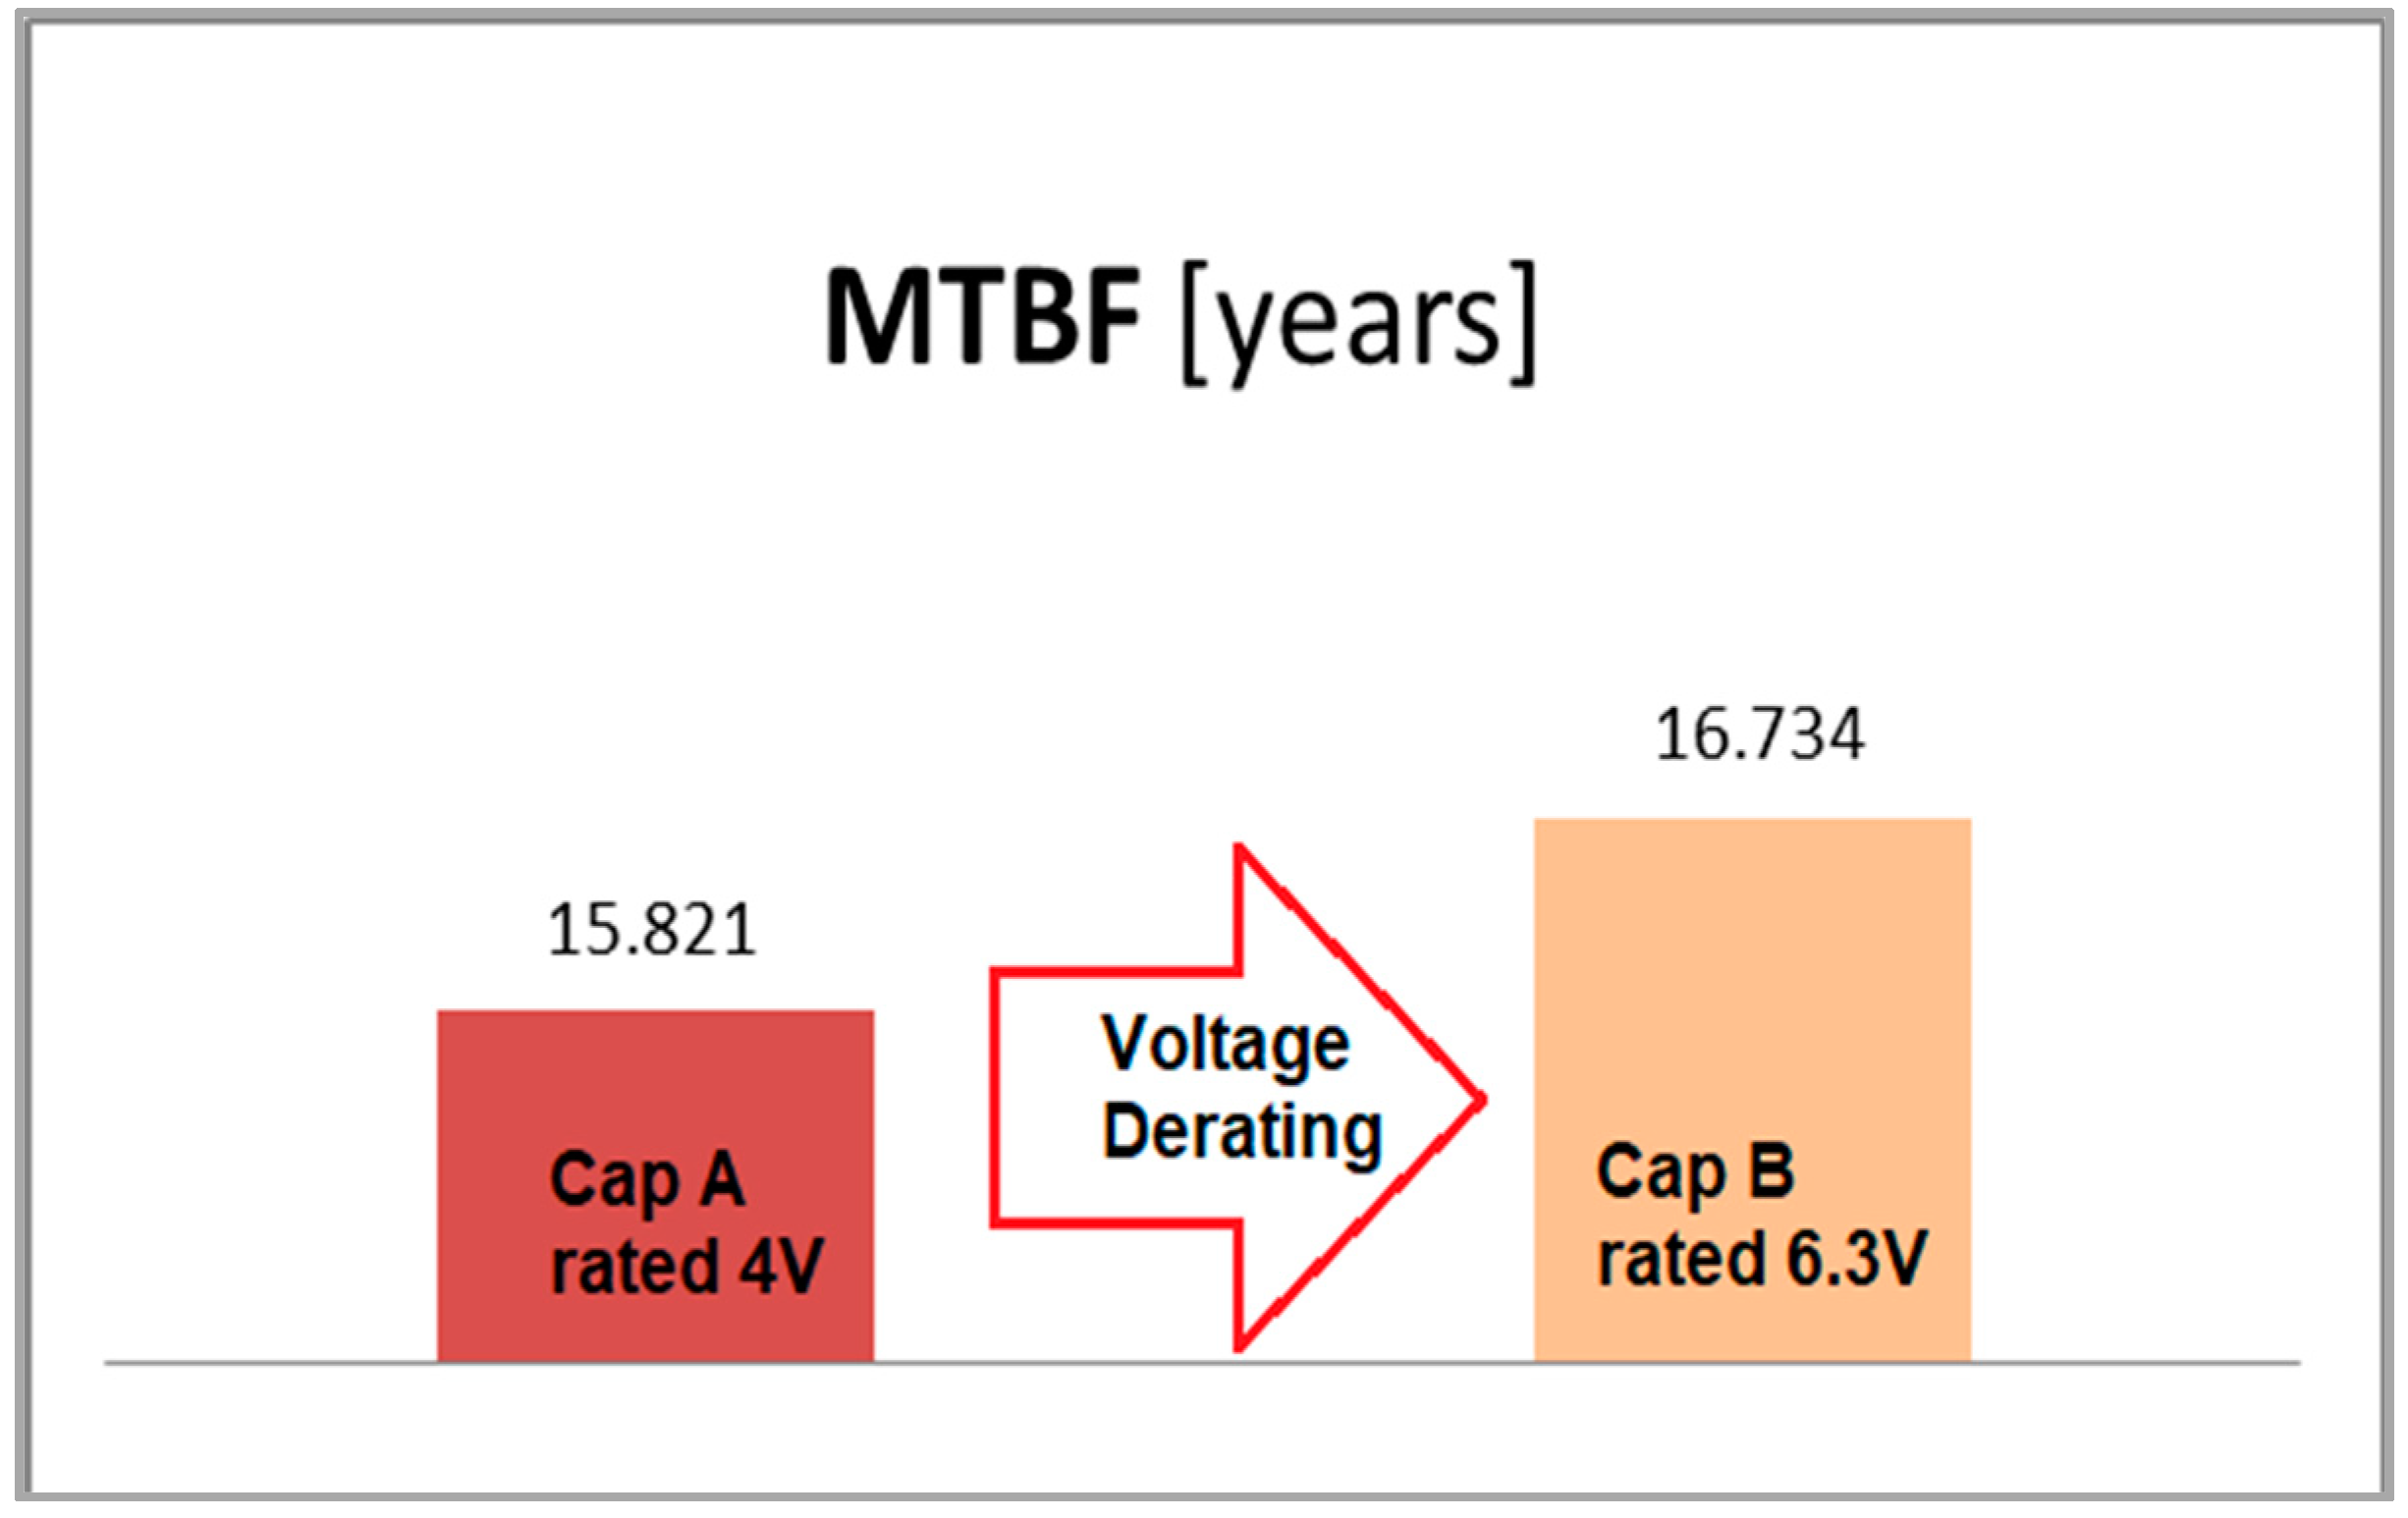
- MTBFpolimer capA = 138,591 h or 15.821 yr
- MTBFpolimer capB[derated] = 146,589 h or 16.734 yr
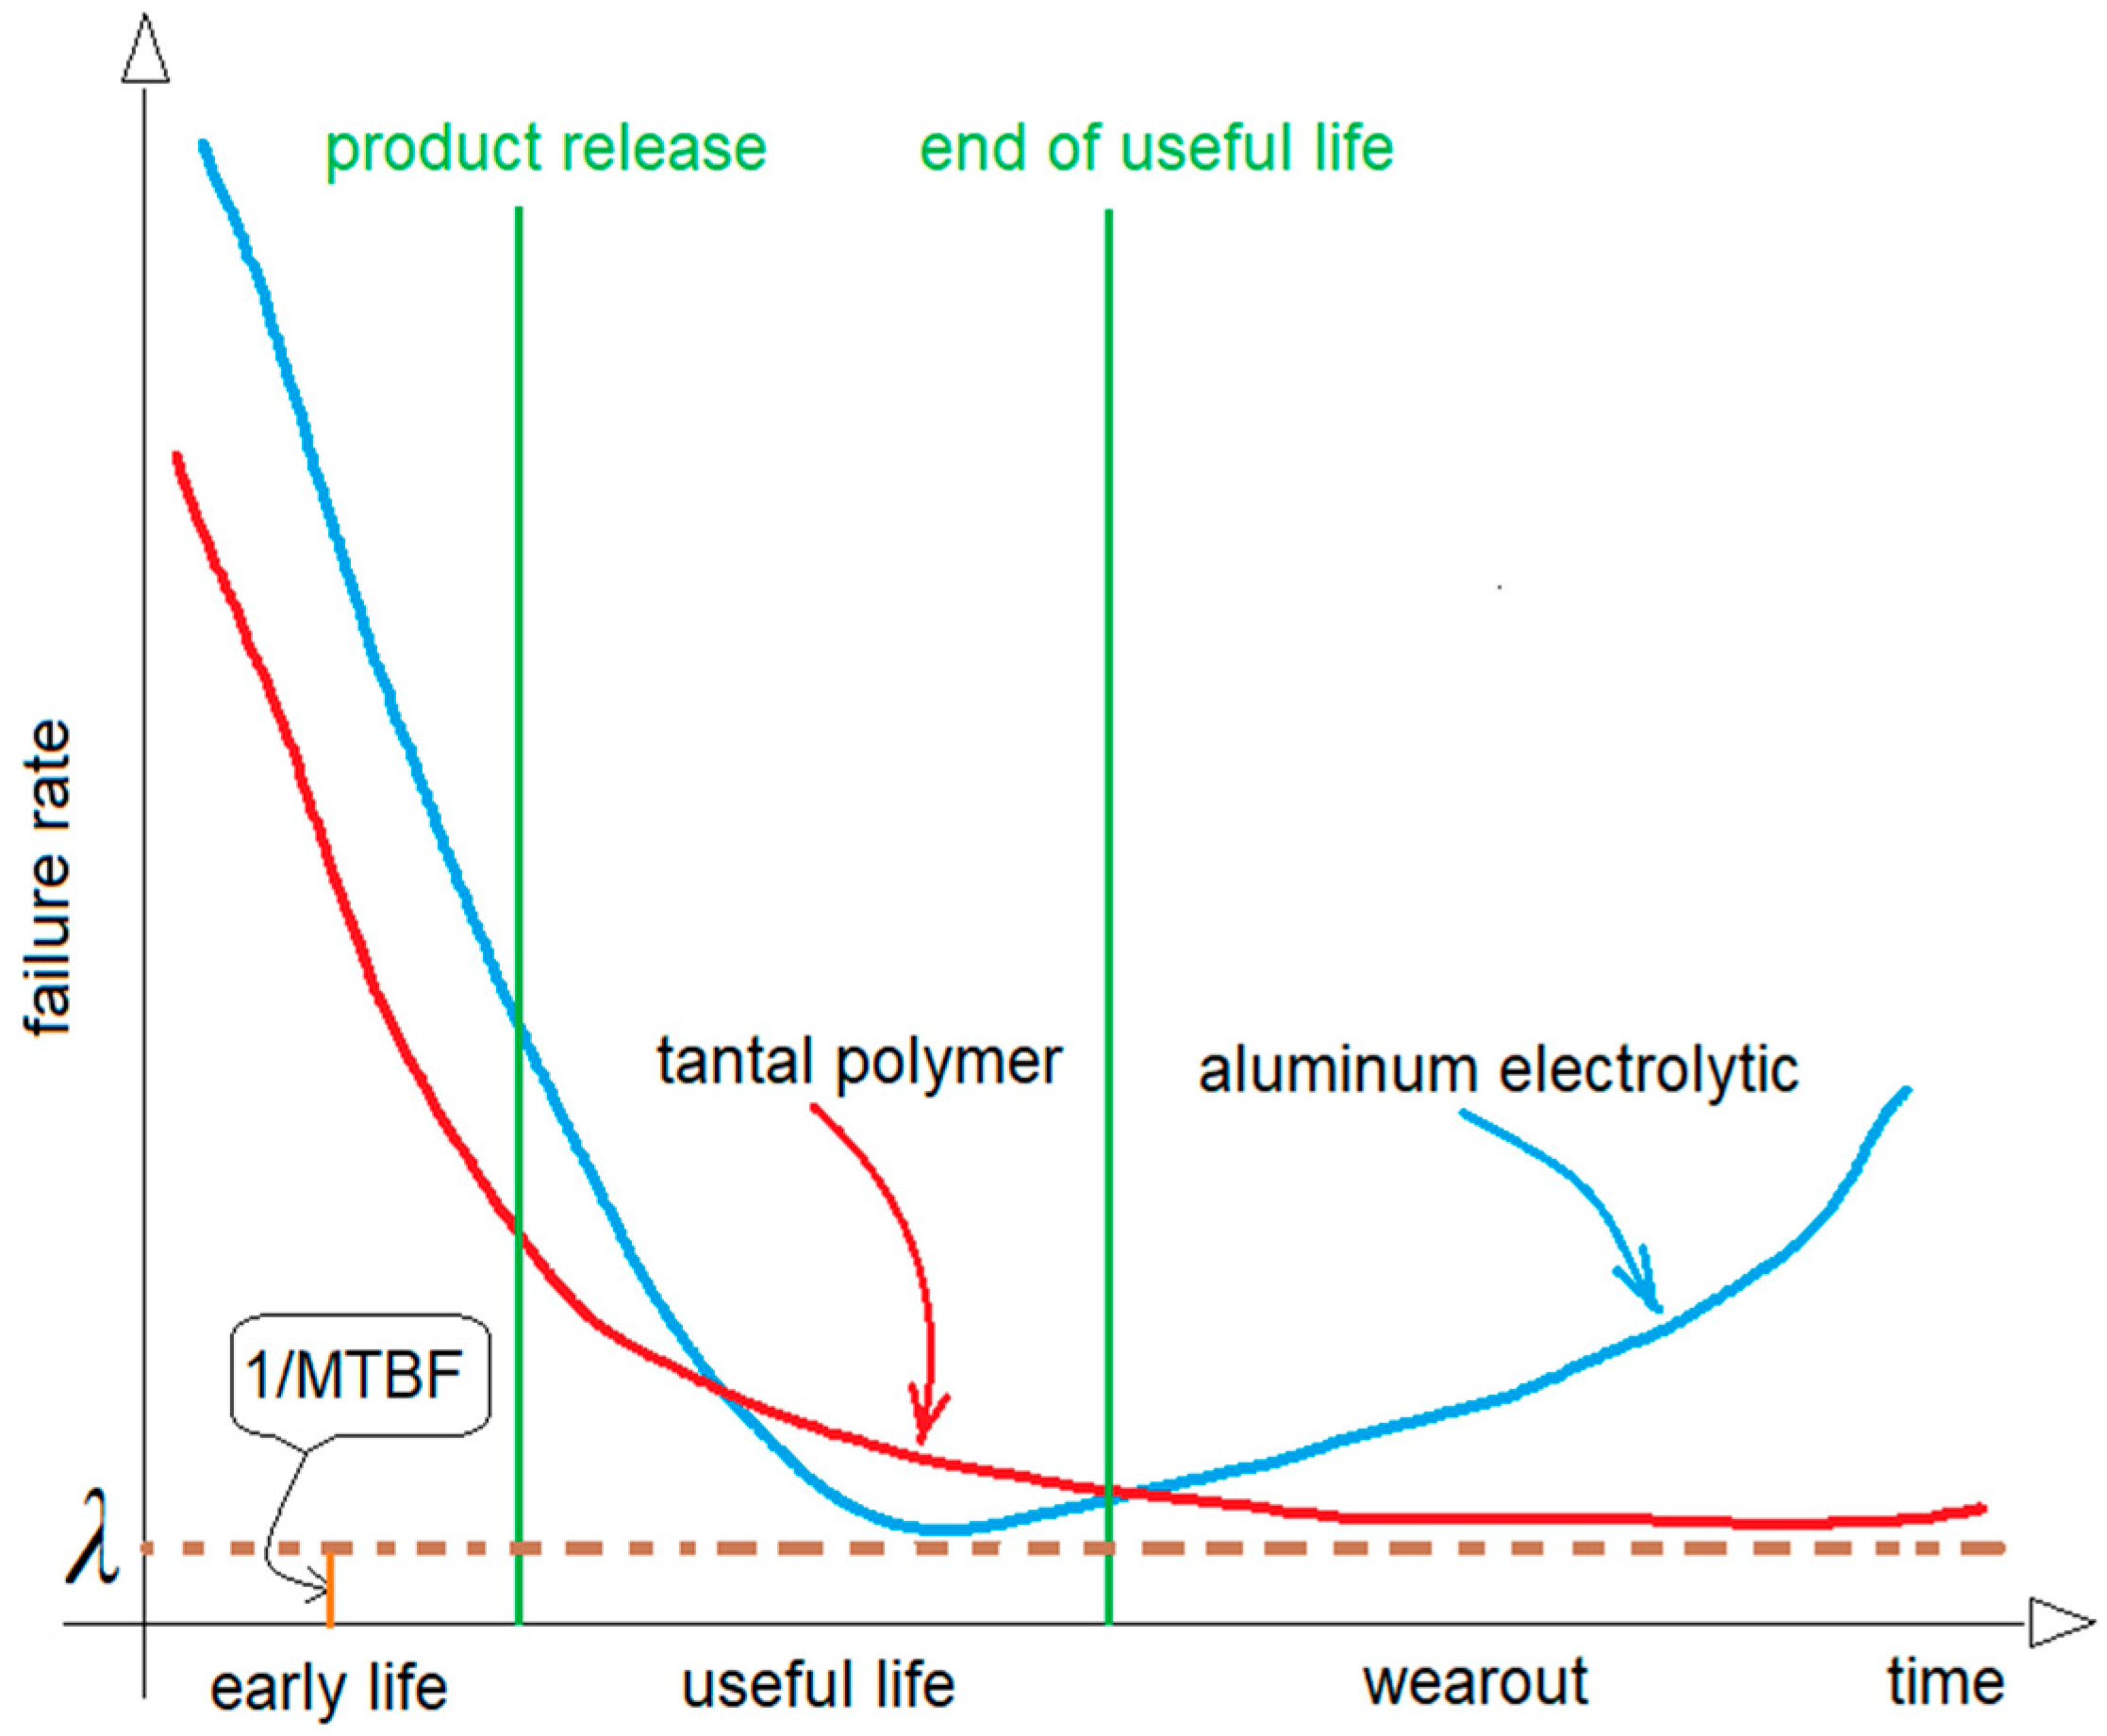
4. Discussion
Funding
Data Availability Statement
Acknowledgments
Conflicts of Interest
References
- Anon. Voltage Derating Rules for Solid Tantalum and Niobium Capacitors. Available online: https://www.avx.com/docs/techinfo/VoltageDeratingRulesforSolidTantalumandNiobiumCapacitors.pdf (accessed on 14 January 2023).
- Anon. Available online: chrome-extension://efaidnbmnnnibpcajpcglclefindmkaj/https://nepp.nasa.gov/docuploads/0EA22600-8AEC-4F47-9FE49BAABEAB569C/Tantalum%20Polymer%20Capacitors%20FY05%20Final%20Report.pdf (accessed on 14 January 2023).
- Anon. Polymer Tantalum Capacitors Continue to Toughen Up to Meet Automotive Demands. Available online: https://www.kemet.com/en/us/technical-resources/polymer-tantalum-capacitors-continue-to-toughen-up-to-meet-automotive-demands.html (accessed on 14 January 2023).
- Freeman, Y. Tantalum and Niobium-Based Capacitors, 1st ed.; Springer: Berlin/Heidelberg, Germany, 2017. [Google Scholar]
- Freeman, Y.; Lessner, P. Evolution of Polymer Tantalum Capacitors. Appl. Sci. 2021, 11, 5514. [Google Scholar] [CrossRef]
- Ma, C.; Wang, K.; Wang, J.F. Control Design and Realization of a Fast Transient Response, High-Reliability DC-DC Converter With a Secondary-Side Control Circuit. IEEE Access 2021, 9, 36976–36985. [Google Scholar] [CrossRef]
- Caldwell, B.; Bechtold, L.; Douty, B.; Murray, J. Optimized Derating to Support Reliable System Design. In Proceedings of the 2020 Annual Reliability and Maintainability Symposium (RAMS), Palm Springs, CA, USA, 27–30 January 2020; pp. 1–5. [Google Scholar] [CrossRef]
- Anon. Available online: http://everyspec.com/MIL-HDBK/MIL-HDBK-1500-1799/MIL_HDBK_1547A_2102 (accessed on 14 January 2023).
- Reusch, D.; Strydom, J. Evaluation of Gallium Nitride Transistors in High-Frequency Resonant and Soft-Switching DC-DC Converters. IEEE Trans. Power Electron. 2014, 30, 5151–5158. [Google Scholar] [CrossRef]
- Anon. Available online: https://epc-co.com/epc/products/demo-boards/epc9059 (accessed on 14 January 2023).
- Anon. Available online: https://epc-co.com/epc/products/gan-fets-and-ics/epc2100 (accessed on 14 January 2023).
- Anon. Available online: chrome-extension://efaidnbmnnnibpcajpcglclefindmkaj/https://www.ti.com/lit/ds/symlink/lm5113.pdf (accessed on 14 January 2023).
- IEC. TR 62380: Reliability Data Handbook; IEC: Geneva, Switzerland, 2006. [Google Scholar]

| Rated Voltage | Derated Voltage | ||
|---|---|---|---|
| −55 °C to 05 °C | −55 °C to 125 °C | −55 °C to 105 °C | −55 °C to 125 °C |
| 2.5 V | 1.7 V | 2.3 V | 1.5 V |
| 4 V | 2.7 V | 3.6 V | 2.4 V |
| 6.3 V | 4.2 V | 5.7 V | 3.8 V |
| 10 V | 6.7 V | 9 V | 6 V |
| 16 V | 10.7 V | 12.8 V | 8.6 V |
| 20 V | 13.4 V | 16 V | 10.7 V |
| 25 V | 16.8 V | 20 V | 13.4 V |
| 35 V | 23.5 V | 28 V | 18.8 V |
| Application Voltage | Mission Profile Temperature (up to 105 °C) | Mission Profile Temperature (up to 125 °C) |
|---|---|---|
| <1 V | 2.5 V | 2.5 V |
| 3.3 V | 4 V | 6.3 V |
| 5 V | 6.3 V | 10 V |
| 12 V | Minimum 35 V | Minimum 35 V |
| Parameter | Value |
|---|---|
| Load resistor | Rload = 0.1 Ω |
| Load current | Iout = 12 A |
| Input current | Iin = 1.2 A |
| Input voltage | Vin = 12 V |
| Output voltage | Vout =1.2V |
| Switching frequency | fsw = 300 kHz |
| Inductor | L = 3 μH |
| Ambient temperature | ~25 °C |
| Duty cycle | ~13% |
| Output Ctantalum-polyA | 220 μF/4 V |
| Output Ctantalum-polyB [derated] | 220 μF/6.3 V |
Disclaimer/Publisher’s Note: The statements, opinions and data contained in all publications are solely those of the individual author(s) and contributor(s) and not of MDPI and/or the editor(s). MDPI and/or the editor(s) disclaim responsibility for any injury to people or property resulting from any ideas, methods, instructions or products referred to in the content. |
© 2023 by the author. Licensee MDPI, Basel, Switzerland. This article is an open access article distributed under the terms and conditions of the Creative Commons Attribution (CC BY) license (https://creativecommons.org/licenses/by/4.0/).
Share and Cite
Butnicu, D. A Derating-Sensitive Tantalum Polymer Capacitor’s Failure Rate within a DC-DC eGaN-FET-Based PoL Converter Workbench Study. Micromachines 2023, 14, 221. https://doi.org/10.3390/mi14010221
Butnicu D. A Derating-Sensitive Tantalum Polymer Capacitor’s Failure Rate within a DC-DC eGaN-FET-Based PoL Converter Workbench Study. Micromachines. 2023; 14(1):221. https://doi.org/10.3390/mi14010221
Chicago/Turabian StyleButnicu, Dan. 2023. "A Derating-Sensitive Tantalum Polymer Capacitor’s Failure Rate within a DC-DC eGaN-FET-Based PoL Converter Workbench Study" Micromachines 14, no. 1: 221. https://doi.org/10.3390/mi14010221
APA StyleButnicu, D. (2023). A Derating-Sensitive Tantalum Polymer Capacitor’s Failure Rate within a DC-DC eGaN-FET-Based PoL Converter Workbench Study. Micromachines, 14(1), 221. https://doi.org/10.3390/mi14010221