Article

Tunable Visible Light and Energy Transfer Mechanism in Tm3+ and Silver Nanoclusters within Co-Doped GeO2-PbO Glasses

by
Marcos Vinicius de Morais Nishimura
1,*,
Augusto Anselmo Amaro
1,
Camila Dias da Silva Bordon
1,
Jessica Dipold
2,
Niklaus Ursus Wetter
2 and
Luciana Reyes Pires Kassab
3
1
Departamento de Engenharia de Sistemas Eletrônicos, Escola Politécnica da Universidade de São Paulo, Av. Prof. Luciano Gualberto, 158, Travessa 3, São Paulo 05508-900, SP, Brazil
2
Instituto de Pesquisas Energéticas e Nucleares, IPEN-CNEN, 2242, Av. Prof. Lineu Prestes, São Paulo 05508-000, SP, Brazil
3
Faculdade de Tecnologia de São Paulo, CEETEPS, Praça Cel. Fernando Prestes, 30, São Paulo 01124-060, SP, Brazil
*
Author to whom correspondence should be addressed.
Micromachines 2023, 14(11), 2078; https://doi.org/10.3390/mi14112078
Submission received: 11 October 2023 / Revised: 30 October 2023 / Accepted: 7 November 2023 / Published: 9 November 2023
(This article belongs to the Special Issue Nanomaterials Photonics)

Abstract

:
This study introduces a novel method for producing Ag nanoclusters (NCs) within GeO2-PbO glasses doped with Tm3+ ions. Sample preparation involved the melt-quenching method, employing adequate heat treatment to facilitate Ag NC formation. Absorption spectroscopy confirmed trivalent rare-earth ion incorporation. Ag NC identification and the amorphous structure were observed using transmission electron microscopy. A tunable visible emission from blue to the yellow region was observed. The energy transfer mechanism from Ag NCs to Tm3+ ions was demonstrated by enhanced 800 nm emission under 380 and 400 nm excitations, mainly for samples with a higher concentration of Ag NCs; moreover, the long lifetime decrease of Ag NCs at 600 nm (excited at 380 and 400 nm) and the lifetime increase of Tm3+ ions at 800 nm (excitation of 405 nm) corroborated the energy transfer between those species. Therefore, we attribute this energy transfer mechanism to the decay processes from S1→T1 and T1→S0 levels of Ag NCs to the 3H4 level of Tm3+ ions serving as the primary path of energy transfer in this system. GeO2-PbO glasses demonstrated potential as materials to host Ag NCs with applications for photonics as solar cell coatings, wideband light sources, and continuous-wave tunable lasers in the visible spectrum, among others.

1. Introduction

Glasses play a pivotal role in photonic device development and optical components due to their ease of manipulation and their ability to take on various shapes and sizes. Additionally, glasses offer unique characteristics, including exceptional transparency and the convenience of doping with active ions. Within this context, silver-containing amorphous materials have emerged as promising candidates for light-emitting devices. Silver (Ag) nanoclusters (NCs) embedded within glass matrices have demonstrated significant potential for photonic applications, including both undoped and rare-earth (RE)-doped configurations, all produced using the melt-quenching technique [1].
Initially, research efforts primarily focused on investigating Ag NCs within liquid, polymer, or organic matrices [2,3]. However, recent developments have shifted attention towards oxyfluoride glasses as the preferred host materials for Ag NCs [4,5,6,7,8,9,10,11,12]. This shift is primarily attributed to the advantageous properties of oxyfluoride glasses, particularly for fibers, thin films, and various manufacturing techniques with respect to alternative materials [5]. Consequently, the scientific literature has witnessed a surge in exploration involving diverse glass compositions as potential hosts for Ag NCs. These compositions span zinc borate CABAl [13], fluorophosphate [14,15,16,17,18,19], borates [20], and borosilicates [21,22], among other glass matrices [23,24,25,26,27], thereby broadening the possibilities of Ag NC-based photonic applications. The applications of this technology span a wide array of photonic advancements, including photovoltaic devices, flexible screens, sources for white light [28], fiber [29,30], including wavelength tuning [31,32]. It is important to note that Ag NCs stand apart from metallic nanoparticles (NPs) due to their unique composition, consisting of only small agglomerates of silver atoms, resulting in an amorphous structural arrangement [16]. This distinctiveness sets them apart from metallic NPs, which are characterized by their crystalline nature, larger physical dimensions, and the presence of an absorption plasmon band [33,34]. The discrete energy level of Ag NCs contributes to their exceptional photoluminescent (PL) properties, which are sensitive to various factors, including the excitation wavelength, glass composition, Ag dopant concentration, and the localized density of Ag NCs. It is worth noting that higher concentrations of Ag NCs can lead to agglomeration, potentially culminating in the formation of metallic NPs that can result in the coexistence of NCs and NPs simultaneously in the material.
Ag NCs exhibit distinctive optical properties that differentiate them from bulk silver and individual silver atoms. While bulk silver typically does not display luminescence, isolated silver atoms generate PL bands that normally cover the UV-blue region. In contrast, Ag NCs characteristically produce a broad PL band that encompasses the visible portion of the electromagnetic spectrum [2,7]. Furthermore, the PL characteristics of Ag NCs are intricately tied to their size and provide tuning across the UV to visible and near-infrared (NIR) regions by carefully selecting the appropriate excitation wavelength [31]. Both Ag NCs and Ag NPs have shown the ability to enhance the PL intensity of lanthanide ions. In the case of Ag NPs, this enhancement is due to the generation of an amplified local electromagnetic field in the neighborhood of the RE ions [35,36]. Conversely, in the case of Ag NCs, mechanisms involving direct energy transfer (ET) [9,10,11,12,13,18,19,20,21,22,27] and Förster resonance ET [15] have been reported as the means of achieving this enhancement. In certain instances, the overlap of the PL bands related to Ag NCs and the ones corresponding to RE ions can result in the production of white light and also the tuning of the visible emission as a function of the excitation wavelength.
Exploration into GeO2-based glasses containing Ag NCs has been limited, prompting the current investigation. These glasses possess noteworthy photonic-related characteristics, including a low cut-off phonon energy (between 500 and 800 cm−1) that is significant for reducing non-radiative losses, high refractive index when compared with silicate glasses, adequate properties for ultrafast devices, and a transmission region ranging from 400 to 5000 nm. Applications for these glasses have been reported, such as frequency upconversion [35], RE photoluminescence intensity enhancement with and without NPs [36], white light generation [35], pedestal waveguides for optical amplifier applications, and recently, nuclear shielding applications. The viscosity of these materials is influenced by the temperature used to anneal them, and the production of Ag NCs is facilitated in environments whose viscosity is higher. This aforementioned viscosity can be achieved by subjecting the material to annealing temperatures below the glass transition temperature, as demonstrated in previous reports [14,31]. Motivated by these findings, we have devised a method for cultivating Ag NCs within GeO2-PbO glasses by employing temperatures of 400 °C to anneal the material, which are situated below the temperature of the glass transition. Additionally, our research has revealed that elevated annealing temperatures, specifically at 470 °C, diminish the material’s viscosity, promoting the aggregation of Ag NCs and consequently facilitating the formation of Ag NPs [31]. The present study delves into the optical properties of GeO2-PbO glasses doped with Tm3+ ions containing Ag NCs. The investigation encompasses an analysis of absorbance, PL, and transmission electron microscopy (TEM) results. Furthermore, the study provides insights into the photoluminescence lifetime decay, elucidating the behavior of Ag NCs in the VIS region and Tm3+ ions in both the VIS and NIR regions, thereby shedding light on the ET mechanisms between these species. The research also explores the phenomenon of visible tunable light emission of Ag NCs under the influence of Tm3+ ions, which themselves emit in the visible range. The ET mechanisms among Ag NCs and Tm3+ ions have been previously documented in oxyfluoride glass systems. It is important to highlight that lead–germanate glasses exhibit distinct behavior compared to oxyfluoride glasses in the formation of silver nanoclusters. In oxyfluoride glasses, color centers form around F charges in the system [4,5,6]. In contrast, in lead–germanate glasses, these color centers exclusively originate around non-bridging oxygen sites through matrix-assisted reduction, which is the sole source of available negative charges [37].
The current investigation highlights the properties of GeO2-PbO glasses to serve as hosts for both Tm3+ ions and Ag NCs, while also elucidating the intricate ET processes among these entities. This work is also motivated by recent results of Yb3+-doped GeO2-PbO glasses that corroborated the ET mechanism between these species [32]. It also showed the possibility of hosting Ag NCs and Yb3+ ions in GeO2-PbO glasses. Upon optical excitation in the UV-blue region, the present study observed PL emissions in both the VIS and NIR regions, attributable to the combined emissions of Ag NCs and Tm3+ ions. These findings underscore the potential of such systems for applications in the development of exceptionally broad-band light sources, lasers, and solar cell coatings, among others.

2. Materials and Methods

Glass samples were composed of 40 wt.% GeO2 and 60 wt.% PbO (GP), with additions of Tm2O3 (1.5 wt.%) and AgNO3 (2.25/4.5 wt.%). Comparative samples containing only AgNO3 (4.5 wt.%) were also prepared. The glasses were labeled as: GP Tm, GP Tm 2.25% Ag, GP Tm 4.5% Ag, and GP 4.5% Ag. An alumina crucible was used to melt the reagents at 1200 °C for 1 h with mechanical stirring, which were swiftly cooled in ambient air using a preheated brass mold. Annealing at 400 °C (below the glass transition temperature) was performed for 1 h to reduce internal stresses. The annealed sample remained in the furnace, gradually cooling at a rate of approximately 1 °C per minute until it reached room temperature. This deliberate choice of annealing below the glass transition temperature was made to minimize the nucleation rate of Ag atoms dispersed within the glass matrix to favor Ag NC formation, as reported before [14,31].
Following this, the samples underwent precise polishing and cutting for characterization purposes. Absorption spectra were recorded using an OceanOptics QE65 PRO spectrometer, covering wavelengths from 400 to 800 nm, and an OceanOptics NIRQuest512 spectrometer, spanning the range of 900–1700 nm. PL measurements in different wavelengths (360, 380, and 400 nm) were used as excitation to perform PL measurements with a Varian Cary Eclipse fluorescence spectrophotometer in combination with the previously mentioned QE65 PRO spectrometer and a 3D printed adapter. This approach allows the collection of a higher-fidelity signal and solves some of the Varian Cary Eclipse limitations due to damage for detection above 700 nm. The chromaticity diagram (CIE-1931) was obtained from the PL spectra and used to evaluate the different emissions in the visible range. Additionally, correlated color temperature (CCT) was performed using McCamy isotherm equations [38], represented by Equations (1) and (2), as follows:
n = ( x x e ) ( y y e )
T = a n 3 + b n 2 + c n + d
The color temperature (T) is calculated with a polynomial function with the x and y coordinates derived from the CIE diagram (obtained from PL spectra) and correlates the color of the emission to the blackbody radiation (Tc). The resulting CCT is then employed to describe various shades of white, with reference to daylight. Lower temperatures correspond to colors closer to the red region of the visible spectrum, while higher temperatures are associated with the blue region.
To investigate the ET from Ag NCs to Tm3+ ions, we measured the PL decay lifetimes of Ag NCs using the fluorescence spectrophotometer. The PL decay lifetime for Ag NCs was obtained using a fit based on a double exponential decay function, as represented by Equation (3).
I t = A 1 · e x p t τ f a s t + A 2 · e x p t τ s l o w
The photoluminescence (PL) intensity, denoted as “I” in this equation, is expressed in terms of constants A1 and A2, where “t” represents the lifetime. The PL decay lifetimes, represented as τfast and τslow, correspond to the decay processes associated with spin-allowed (singlet–singlet and triplet–triplet) and spin-forbidden (singlet–triplet and triplet–singlet) electronic transitions, respectively. PL measurements in the NIR region were conducted with a CW diode laser that operates at 405 nm. The PL signal was collected in a direction perpendicular to the incident excitation beam and analyzed by a Newport Cornerstone 260 monochromator equipped with a photomultiplier tube and a connected lock-in amplifier. To perform the PL decay lifetime analysis of Tm3+ ions at 800 nm, we used the previously mentioned setup with a CW diode laser operating at 405 nm, complemented by a Keysight DSO1024A oscilloscope. The PL decay lifetimes were obtained by using a fit based on a single exponential decay function. We highlight that the CW laser operating at 405 nm had to be used due to the limitations of the fluorescence spectrometer and QE65 PRO spectrometer setup to determine the photoluminescence decay curves and obtain the short (τfast) and long (τslow) decay times with enough resolution. For the characterization of the Ag NCs, we employed TEM operating at both 200 and 300 kV, along with electron diffraction measurements of the samples. TEM sample preparation involved a series of steps, including milling, mixing with distilled water, and partial decantation. The suspended particles located at the mid-height of the reservoir were isolated and subsequently deposited onto ultra-thin carbon film-coated copper grids for analysis. It is important to note that all measurements were conducted under ambient conditions at room temperature.

3. Results

The results of the GP glass absorption containing AgNO3 and Tm2O3 are depicted in Figure 1. Within these spectra, distinct absorption bands corresponding to electronic transitions of Tm3+ ions from the ground state, namely (3H61G4), (3H63F2.3), (3H63H4), (3H63H5), and (3H63F4), are readily discerned. Notably, the absence of a plasmon absorption band in these samples suggests that the Ag species predominantly exist in the form of NCs, which represents the early step in the evolution towards the growth of Ag NPs. It is important to highlight that Ag NCs are characterized by the absence of the typical plasmon absorption band normally associated with well-defined crystalline structures of Ag NPs. Nonetheless, it should be noted that the possibility of metallic NP formation cannot be entirely dismissed, although it potentially occurs at a lower concentration compared to that of the prevailing NCs.
A broad PL band and tunable visible light emission can be observed for the GP 4.5% Ag sample reported in a previous work [39], which is attributed to NCs of varying sizes. As the Ag NC emission peak wavelength is size-dependent, the PL in the blue region corresponds to the emission by smaller-sized Ag NCs. On the other hand, the PL of the green and red regions is associated with the emission of larger Ag NCs [6,7,15]. For this sample, under different excitations in the UV spectrum, a redshift is observed, from greenish yellow at smaller wavelengths to orange at larger ones. This phenomenon serves as evidence for the existence of a substantial distribution of NCs with varying dimensions within the sample, offering the potential for a tailored selection of PL by manipulating the excitation wavelength.
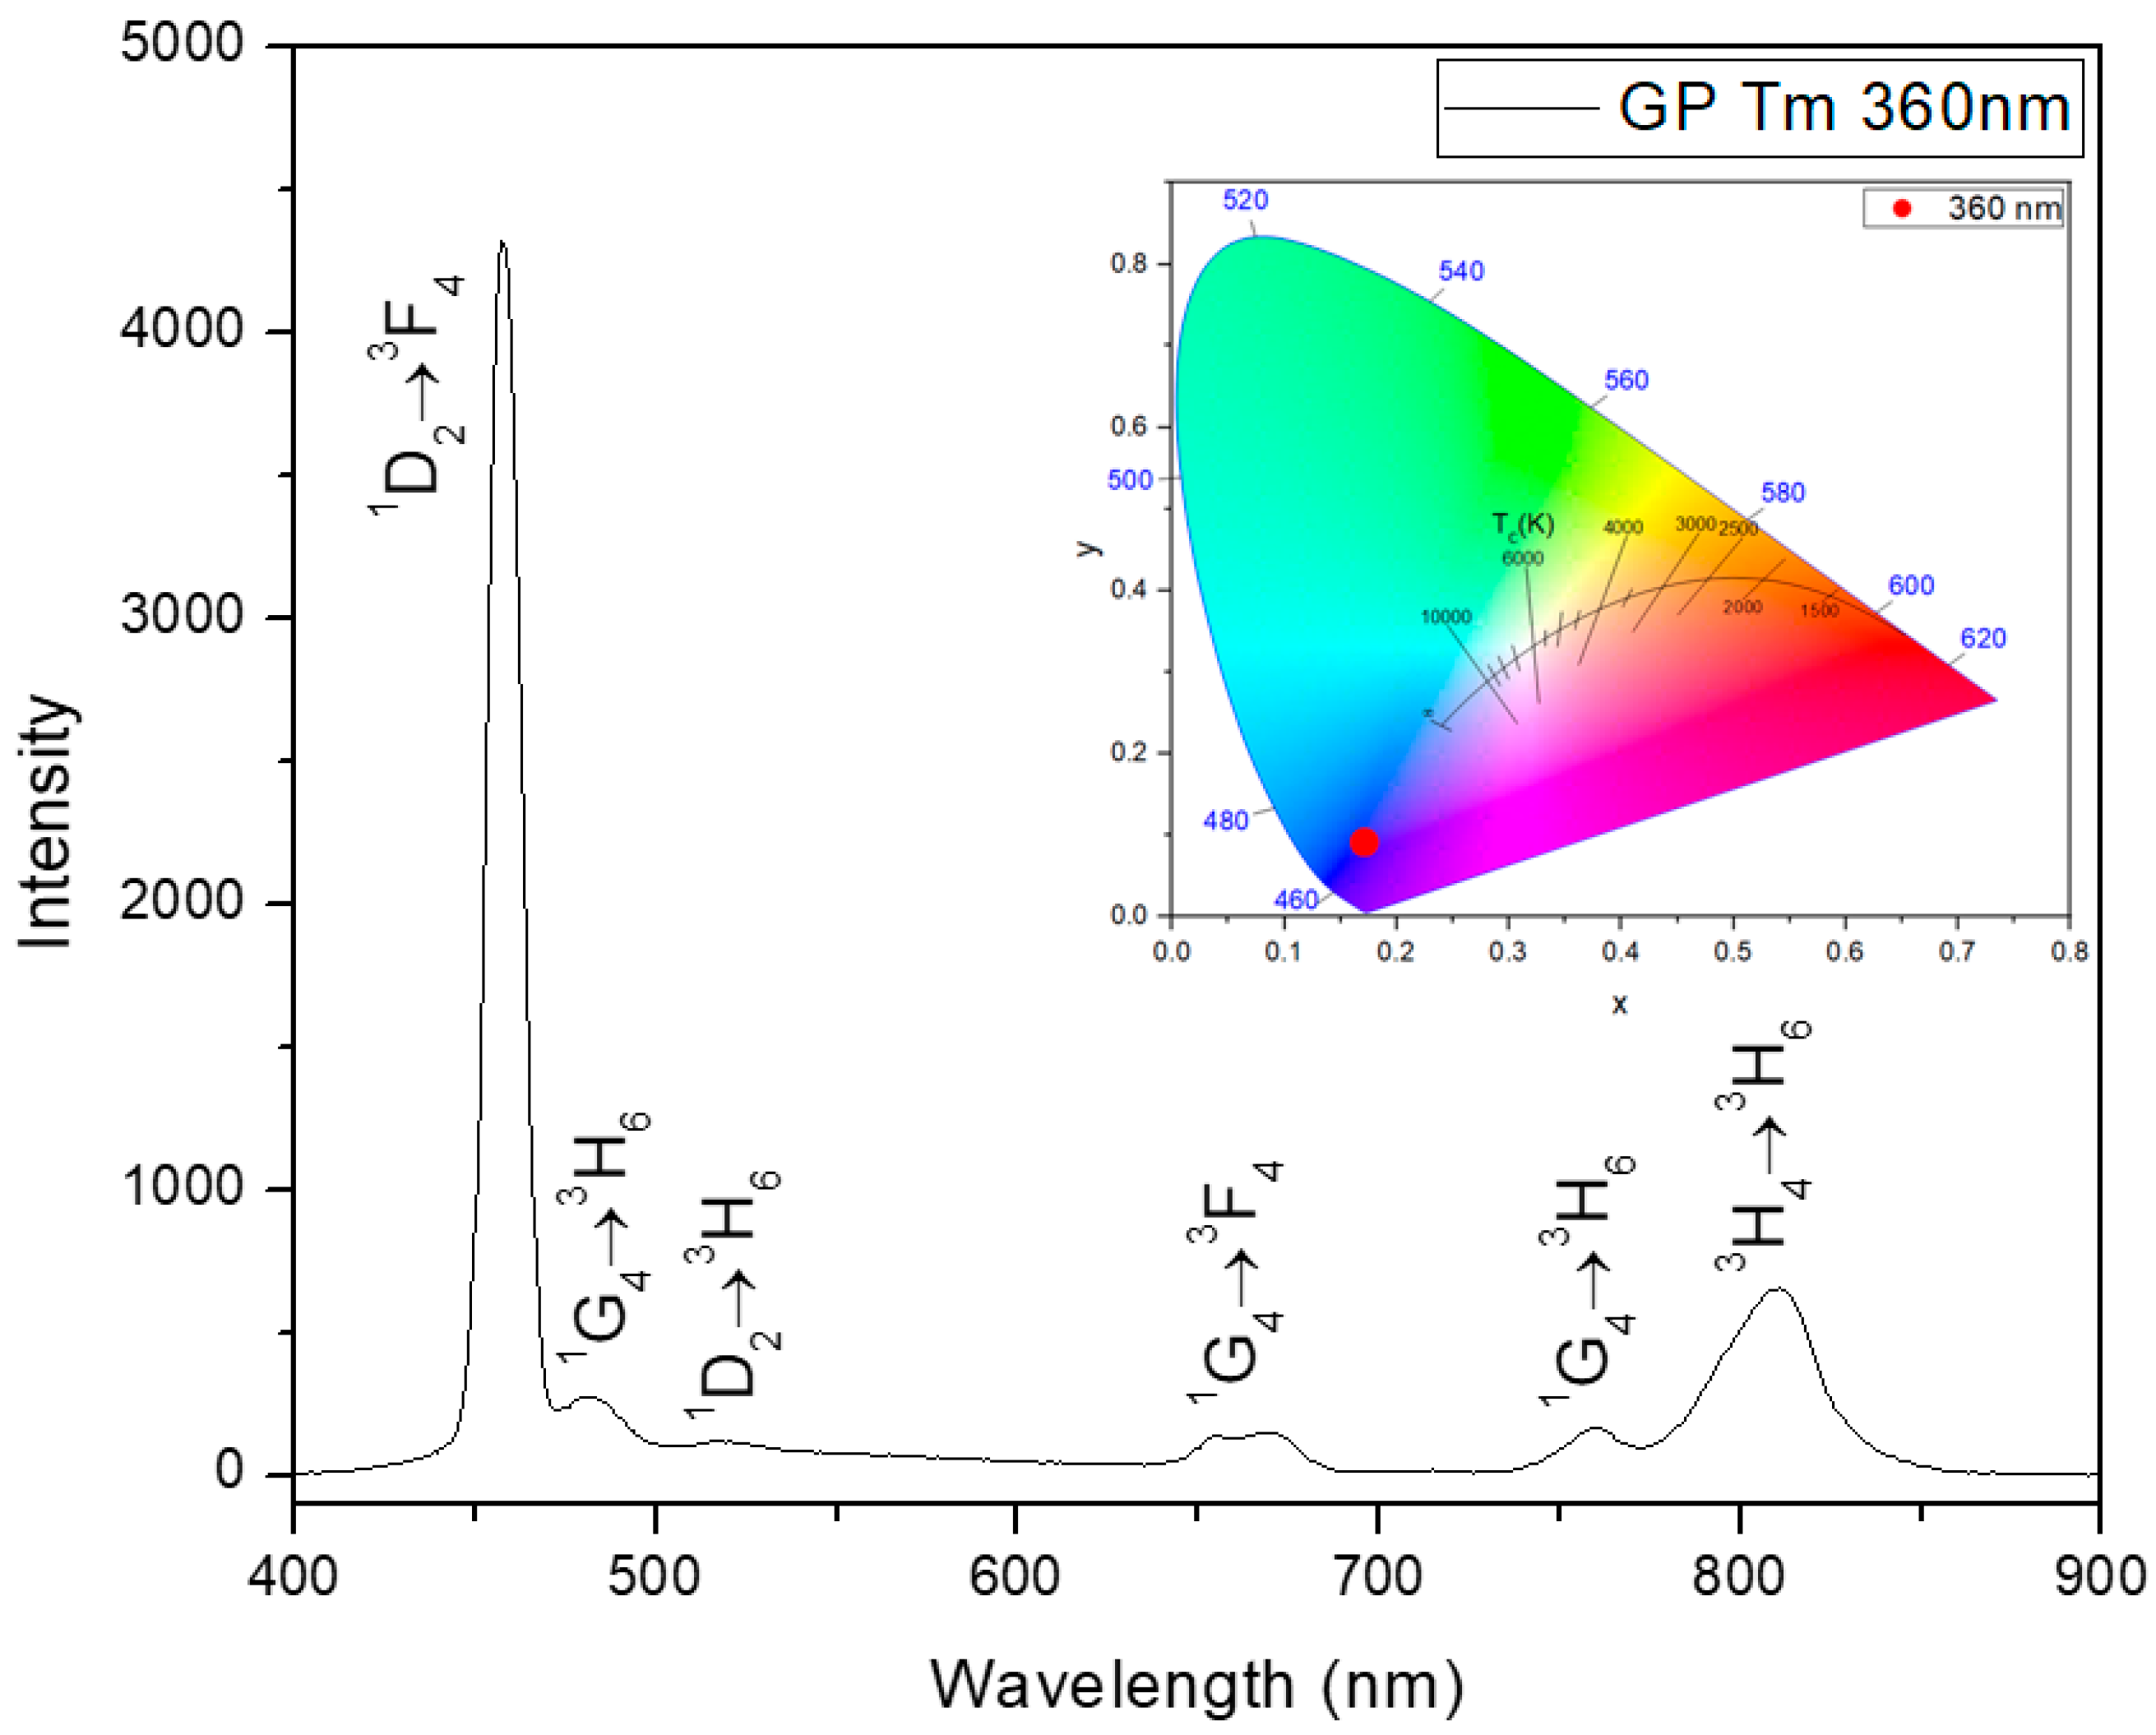
The PL characteristics of Tm3+ ions, when excited at 360 nm via the (3H61D2) transition [40], are illustrated in Figure 2. Notably, the emission spectra reveal a prominent presence in the blue region of the electromagnetic spectrum, as demonstrated in the CIE chromaticity diagram as inset in Figure 2, predominantly attributed to the (1D23F4) transition that corresponds to the large emission at 455 nm.
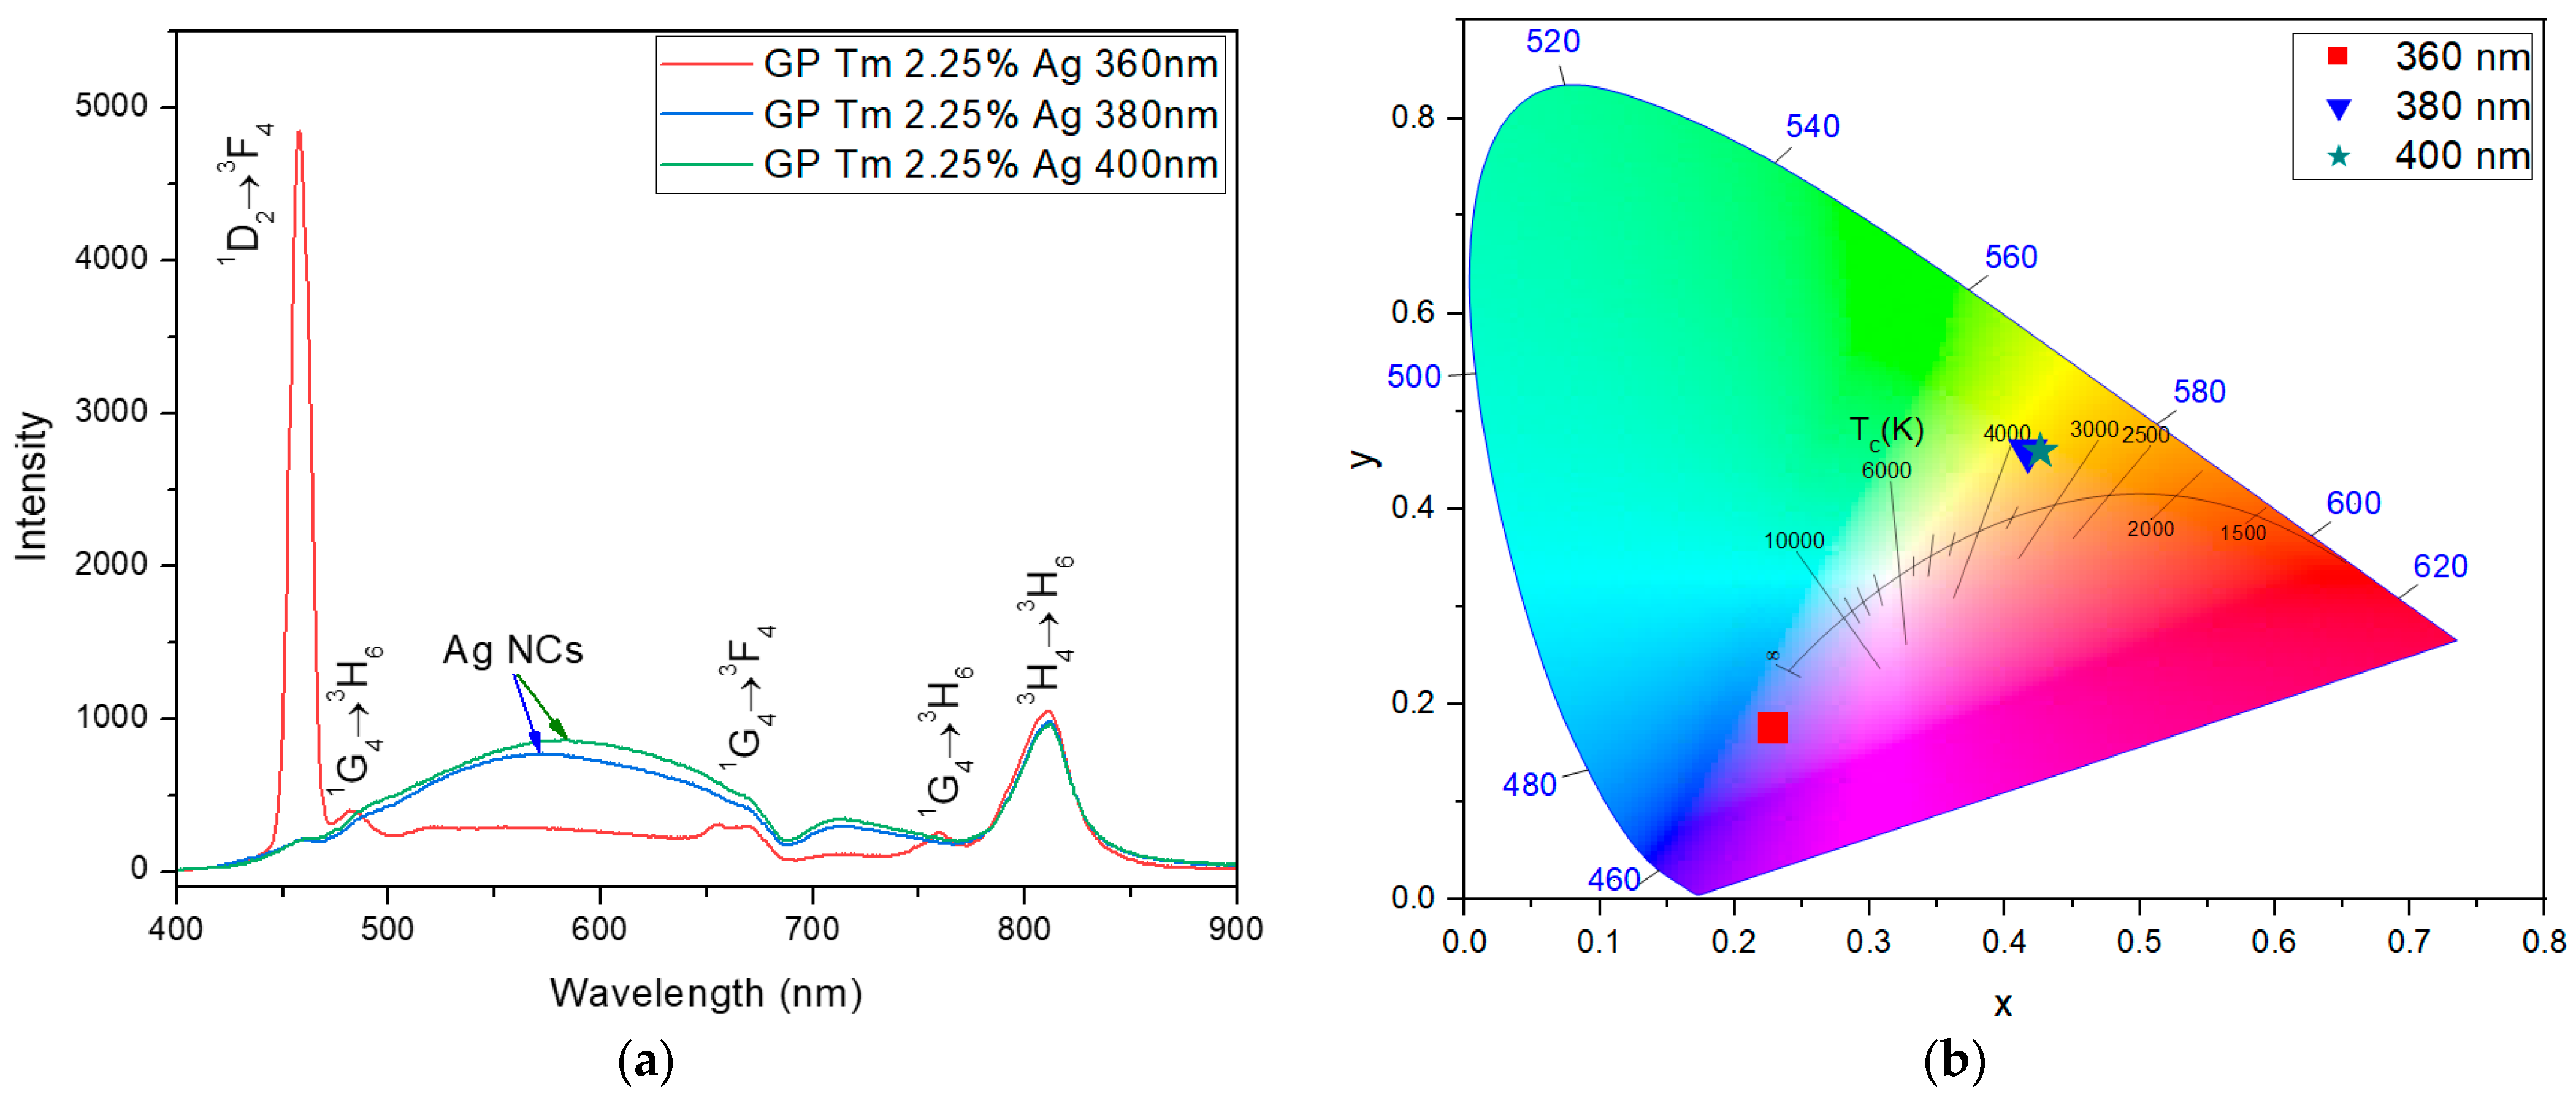
For the GP Tm 2.25% Ag sample, the PL emissions within the visible spectrum became evident upon excitation at 360, 380, and 400 nm, as presented in Figure 3a. Specifically, under excitation at 360 nm, the pronounced peak corresponding to Tm3+ ion emission at 455 nm was observed. Notably, this emission retained its preeminence in the spectrum, similar to the sample without AgNO3. Moreover, for excitations at 380 and 400 nm, we noticed a broad PL band within the range of 480–700 nm, due to the addition of Ag NCs, and a shift to the yellow region with a CCT around 3500 K, obtained through Equations (1) and (2), as presented in Figure 3b. Additionally, the emission at 800 nm corresponding to the 3H43H6 transition of Tm3+ ions was noticed, a phenomenon resulting from ET from larger-sized NCs, indicating their efficiency in mediating ET processes. Notably, these emissions solely originate from such transfers, as there is no significant absorption by Tm3+ ions at 380 and 400 nm [40].
Comparing the results of the GP Tm 2.25% Ag sample with those of the GP Tm 4.5% Ag sample (Figure 4a), we observe that the PL at 455 nm (1D23F4) decreased under excitation of 360 nm, as illustrated in Figure 4a. This suggests that, owing to the abundance of Ag NCs surrounding Tm3+ ions, a significant portion of the excitation at 360 nm was absorbed for the emission in the 480–700 nm range from Ag NCs, resulting in the decrease of the one at 455 nm and consequently resulting in a warm white emission with a CCT of 3730 K, as presented in Figure 4b. Simultaneously, the peak at 800 nm nearly matched the intensity of the one at 455 nm.
For excitations at 380 and 400 nm, situated outside the Tm3+ ions absorption band of 357.7 nm, due to the 3H61D2 transition [40], we notice a considerable intensity increase of Ag NCs PL (Figure 4a) and also an ET to Tm3+ ions at 800 nm (3H43H6 transition); moreover, a shift from warm white to yellow (CCT of 3300 K) took place, as shown in Figure 4b. This outcome corroborates data regarding the capacity of larger-sized NCs to promote ET to the lower energy levels of Tm3+. It is expected that the increased doping, leads to a higher population of Ag NCs that emit in the red spectral region, and consequently, ET to the 3H4 level will become more pronounced.
The influence of Ag NC doping is illustrated in Figure 5, which shows the chromaticity diagram (CIE-1931) for fixed excitation at 360 nm, for GP Tm, GP Tm 2.25% Ag, and GP Tm 4.5% Ag. The coordinates of the diagram were obtained by using the results of Figure 2, Figure 3a and Figure 4a for 360 nm excitation. When exposed to the same excitation wavelength at 360 nm, the GP Tm sample exhibited a strong blue emission. In contrast, the GP Tm 2.25% Ag sample shifted towards a lighter blue emission, whereas the GP Tm 4.5% Ag sample presented a redshift with a warm white emission at 3730 K. This alteration in PL was associated with the increase in the larger Ag NC concentration emitting in the red region. It is crucial to note that the emission observed at 360 nm excitation resulted from the combined contributions of both Tm3+ ions and Ag NCs emission. This occurred because, at this wavelength, there is simultaneous excitation of Ag NCs and Tm3+ ions (3H61D2 transition), as mentioned previously.
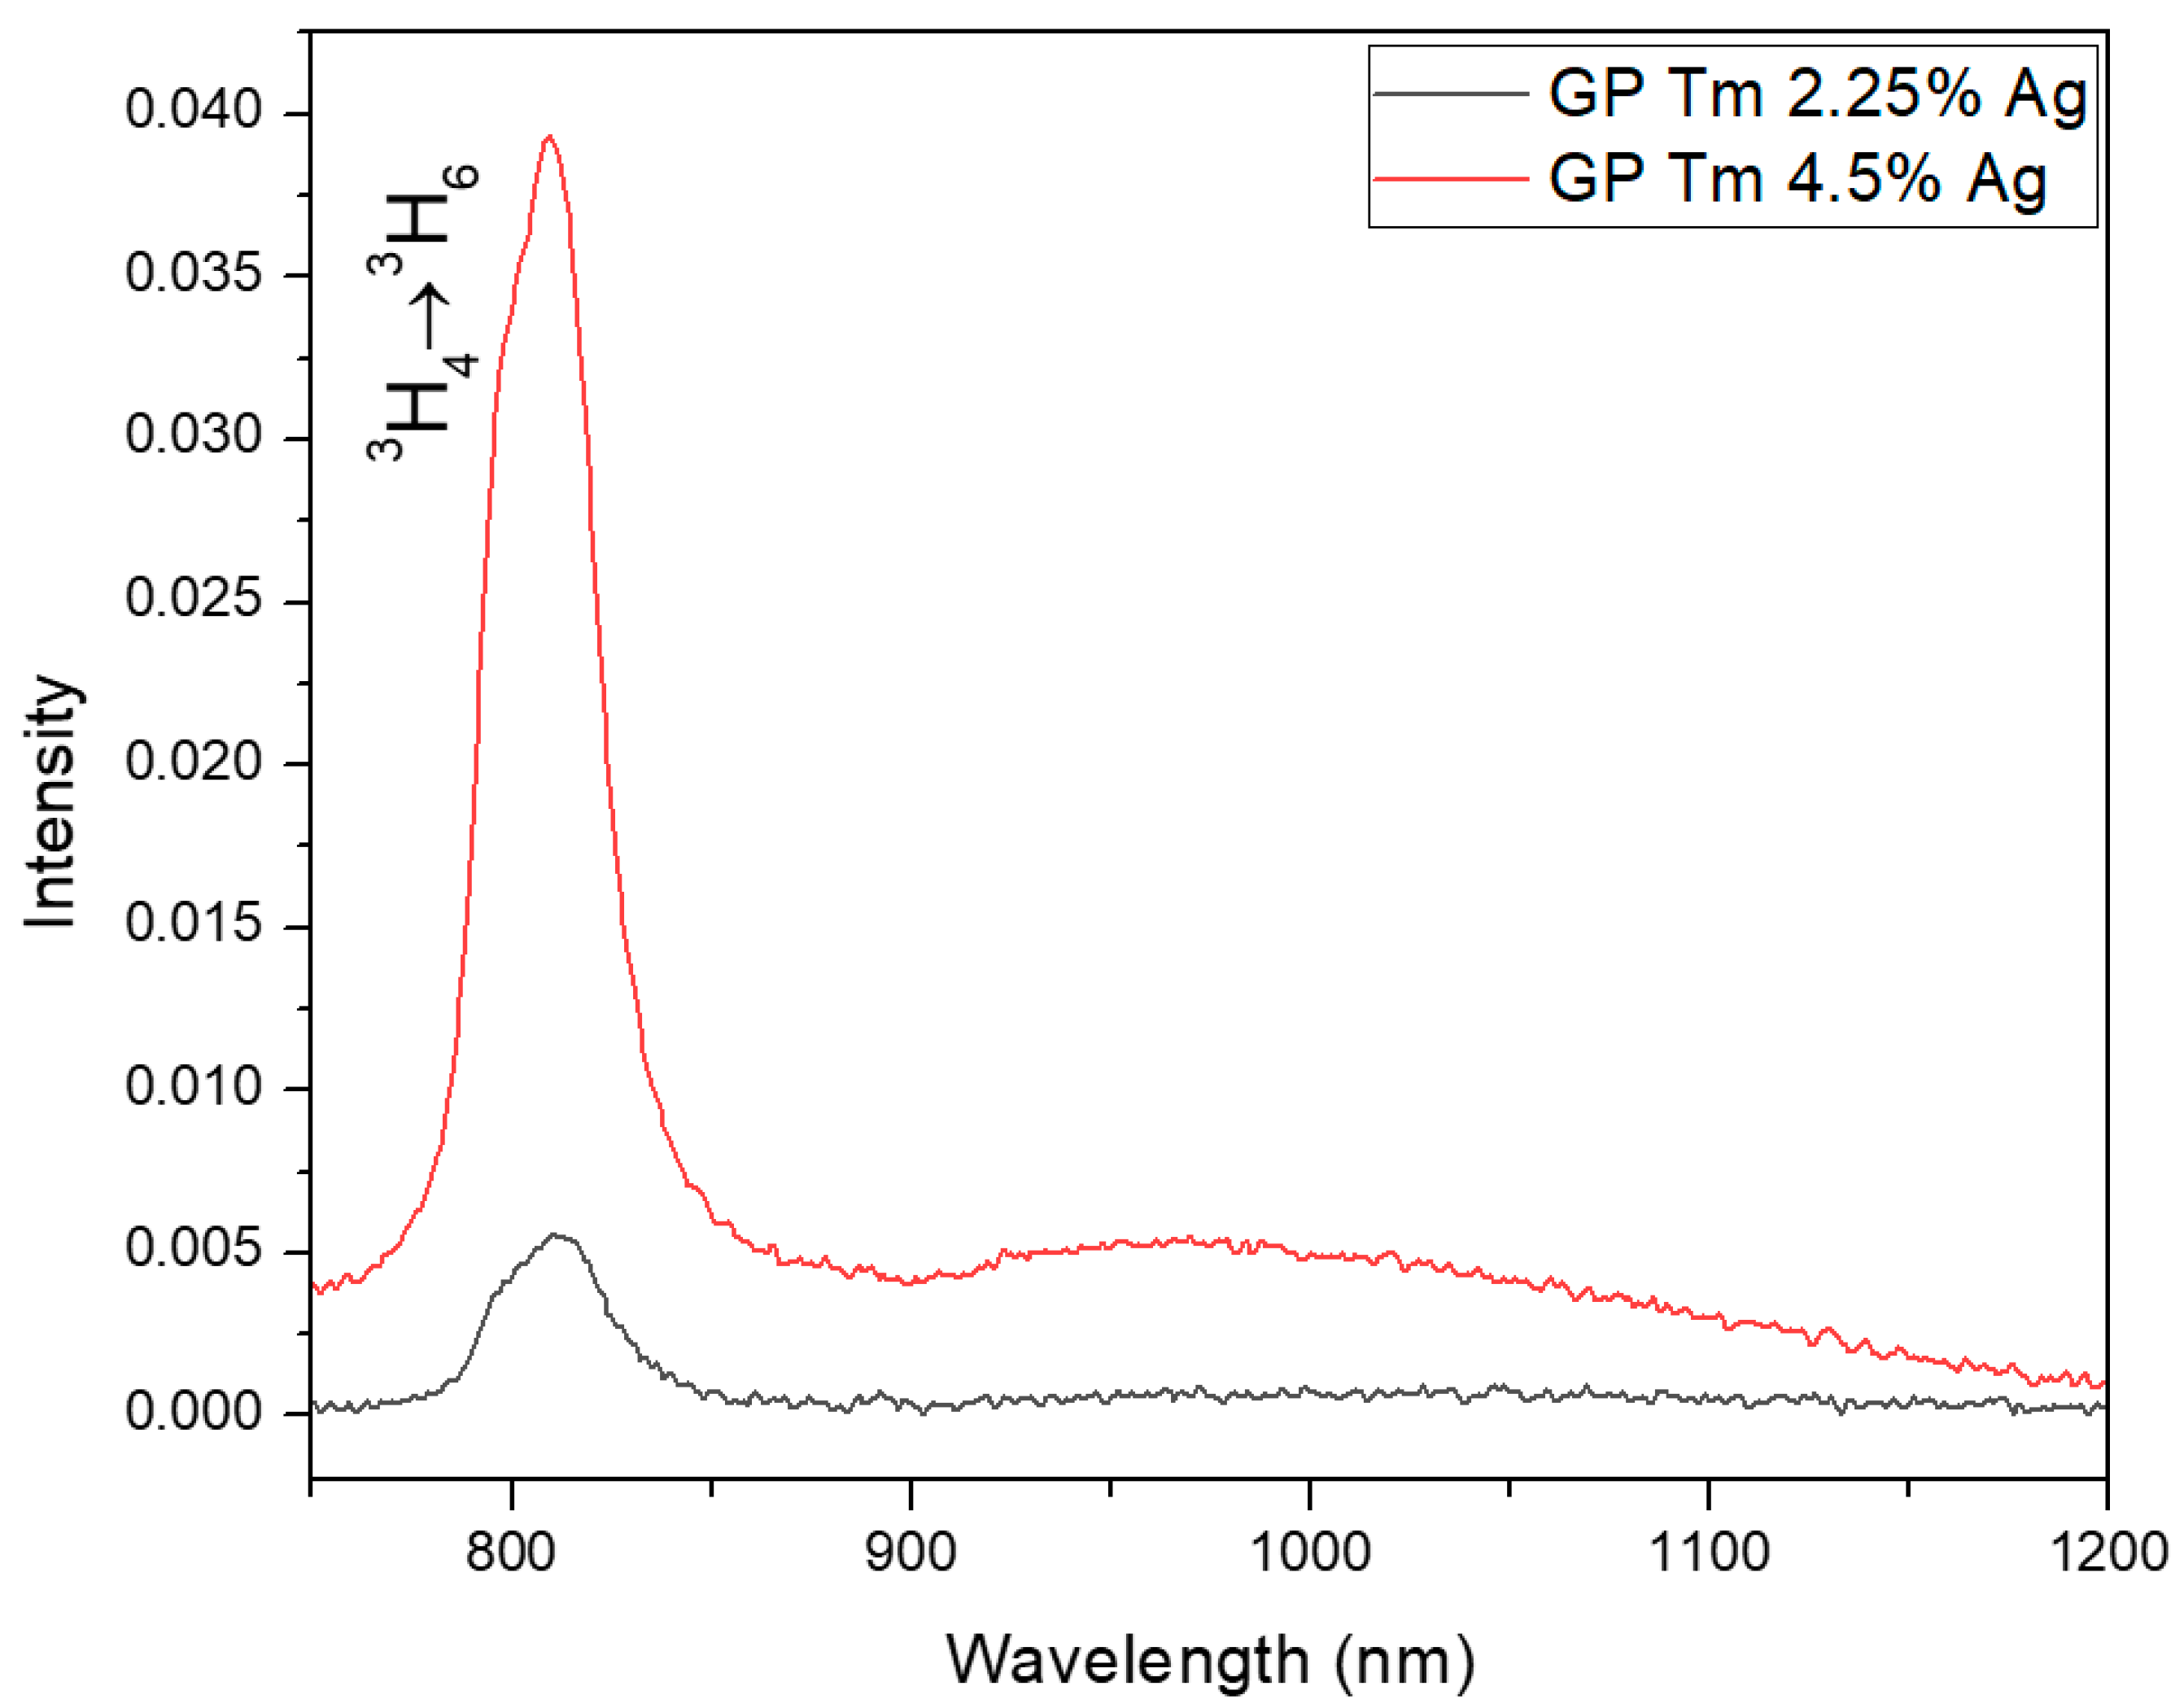
Regarding the emission at 800 nm (under 405 nm excitation) for samples with Tm3+ ions, we notice a PL intensity increase with AgNO3 concentration, as illustrated in Figure 6. This phenomenon indicates a larger ET in the GP Tm 4.5% Ag sample with respect to the GP Tm 2.25% Ag one. Then, the larger concentration of Ag NCs results in species with increased average size [15] that enable a more efficient ET to Tm3+ ions at 800 nm. Lastly, it is noteworthy that the AgNO3 concentration growth gave rise to Ag NCs that exhibited adequate sizes for excitation at 380 and 400 nm, leading to a more effective transfer energy to Tm3+ ions, as can also be seen when comparing Figure 3a and Figure 4a.
Studies have unveiled a clear correlation in the PL spectrum of Ag NCs where shorter-wavelength emissions are attributed to smaller-sized NCs, whereas longer wavelengths are associated with larger NCs. Consequently, Ag NCs emitting in the blue region exhibit the smallest dimensions, and a systematic increase in their size results in a pronounced redshift of the PL [7,14].
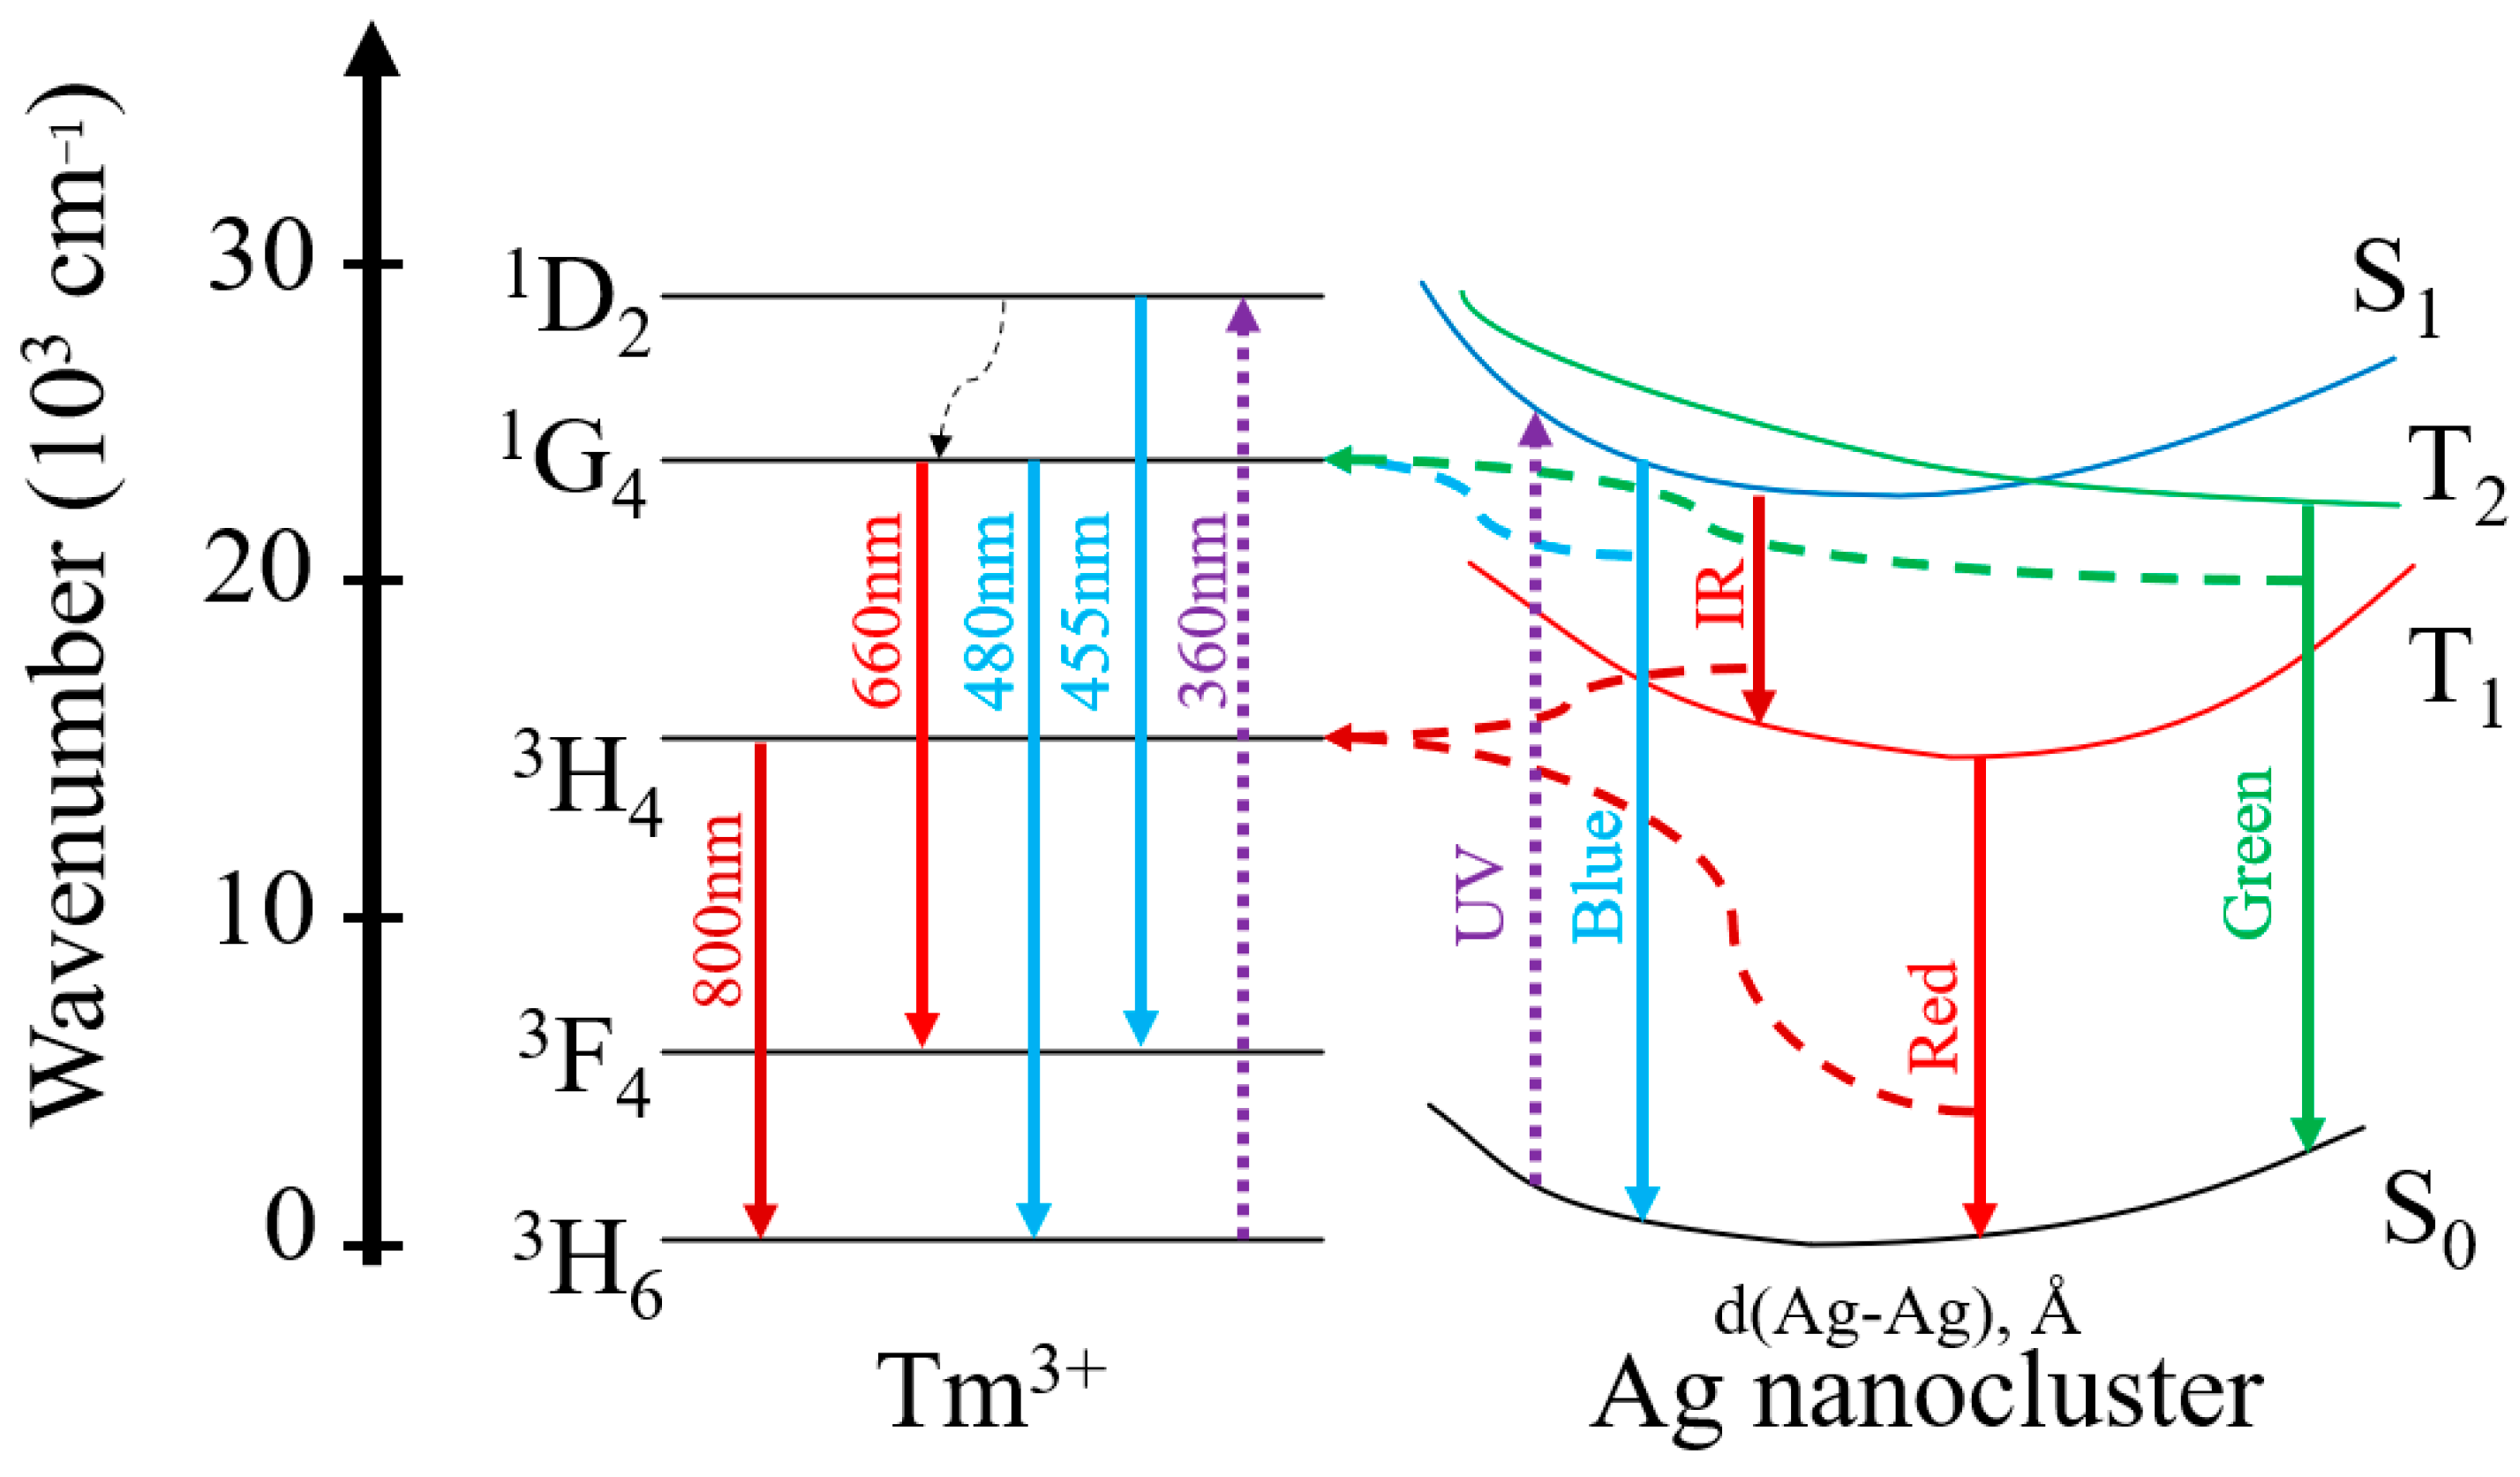
In Figure 7, we present a simplified energy diagram that elucidates the Tm3+ ion transitions upon excitation at 360 nm, as well as the Ag NCs excitation wavelengths at varying UV wavelengths. These insights are derived from the previously discussed PL findings presented in Figure 3 and Figure 4. The energy levels of Ag NCs depicted herein draw upon Velázquez’s model [7]. In this model, S0 represents the ground state, S1 the excited singlet state, and T1 the excited triplet state. Electronic transitions span various regions of the electromagnetic spectrum: blue (S1→S0), green–yellow (T2→S0), yellow–red (T1→S0), near-infrared (S1→T1), and far-infrared (T2→T1, omitted from illustration). Spin-allowed electronic transitions involve singlet–singlet (S1→S0) and triplet–triplet (T2→T1) states, characterized by relatively short decay lifetimes. In contrast, transitions encompassing singlet–triplet (S1→T1) and triplet–singlet (T2→S0 and T1→S0) states are classified as spin-forbidden, exhibiting non-spontaneous behavior and long decay lifetimes. Ag NCs PL in the UV-blue region is attributed to short decay times (τfast) governed by spin-allowed transitions between energy states. Conversely, PL emissions of Ag NCs in the green, yellow, red, and IR regions correspond to long decay times (τslow) that are associated with spin-forbidden transitions.
The PL decay curves of Ag NCs were measured for excitation at 380 nm, and the signal detection wavelength was set to 600 nm due to the broad emission profile of Ag NCs (Figure 3a and Figure 4a). The time decay curve was fitted using Equation (3) (Figure 8a), and the resulting short (τfast) and long (τslow) decay times are presented in Table 1.
Table 1 highlights a similar reduction in both short and long lifetimes with the introduction of Tm3+ ions. This observation corroborates the ET among the Ag NCs and the Tm3+ ions, consistent with the PL results discussed previously. As shown before, samples containing Tm3+ ions and Ag NCs exhibit emission at 800 nm when excited at wavelengths that do not correspond to the Tm3+ ion’s excitation range.
Figure 8b and Table 1 show the results for excitation at 400 nm and detection at 600 nm. In this case, the slight increase in short lifetimes in the GP Tm 4.5% Ag sample could possibly be due to the small dimension of Ag NCs. These smaller NCs may not efficiently absorb excitation at 400 nm, potentially resulting in the reception of energy from the larger-sized ones. Conversely, a reduction in Ag NC lifetime within the sample containing Tm3+ ions was observed for the long lifetime, associated with spin-forbidden transitions (T2→S0, T1→S0, and S1→T1). This decrease is a clear indicator of ET to the surrounding Tm3+ ions. This effect, observed for excitation at 380 nm, aligns with the phenomenon of ET to the ions, stemming from the larger-sized Ag NCs.
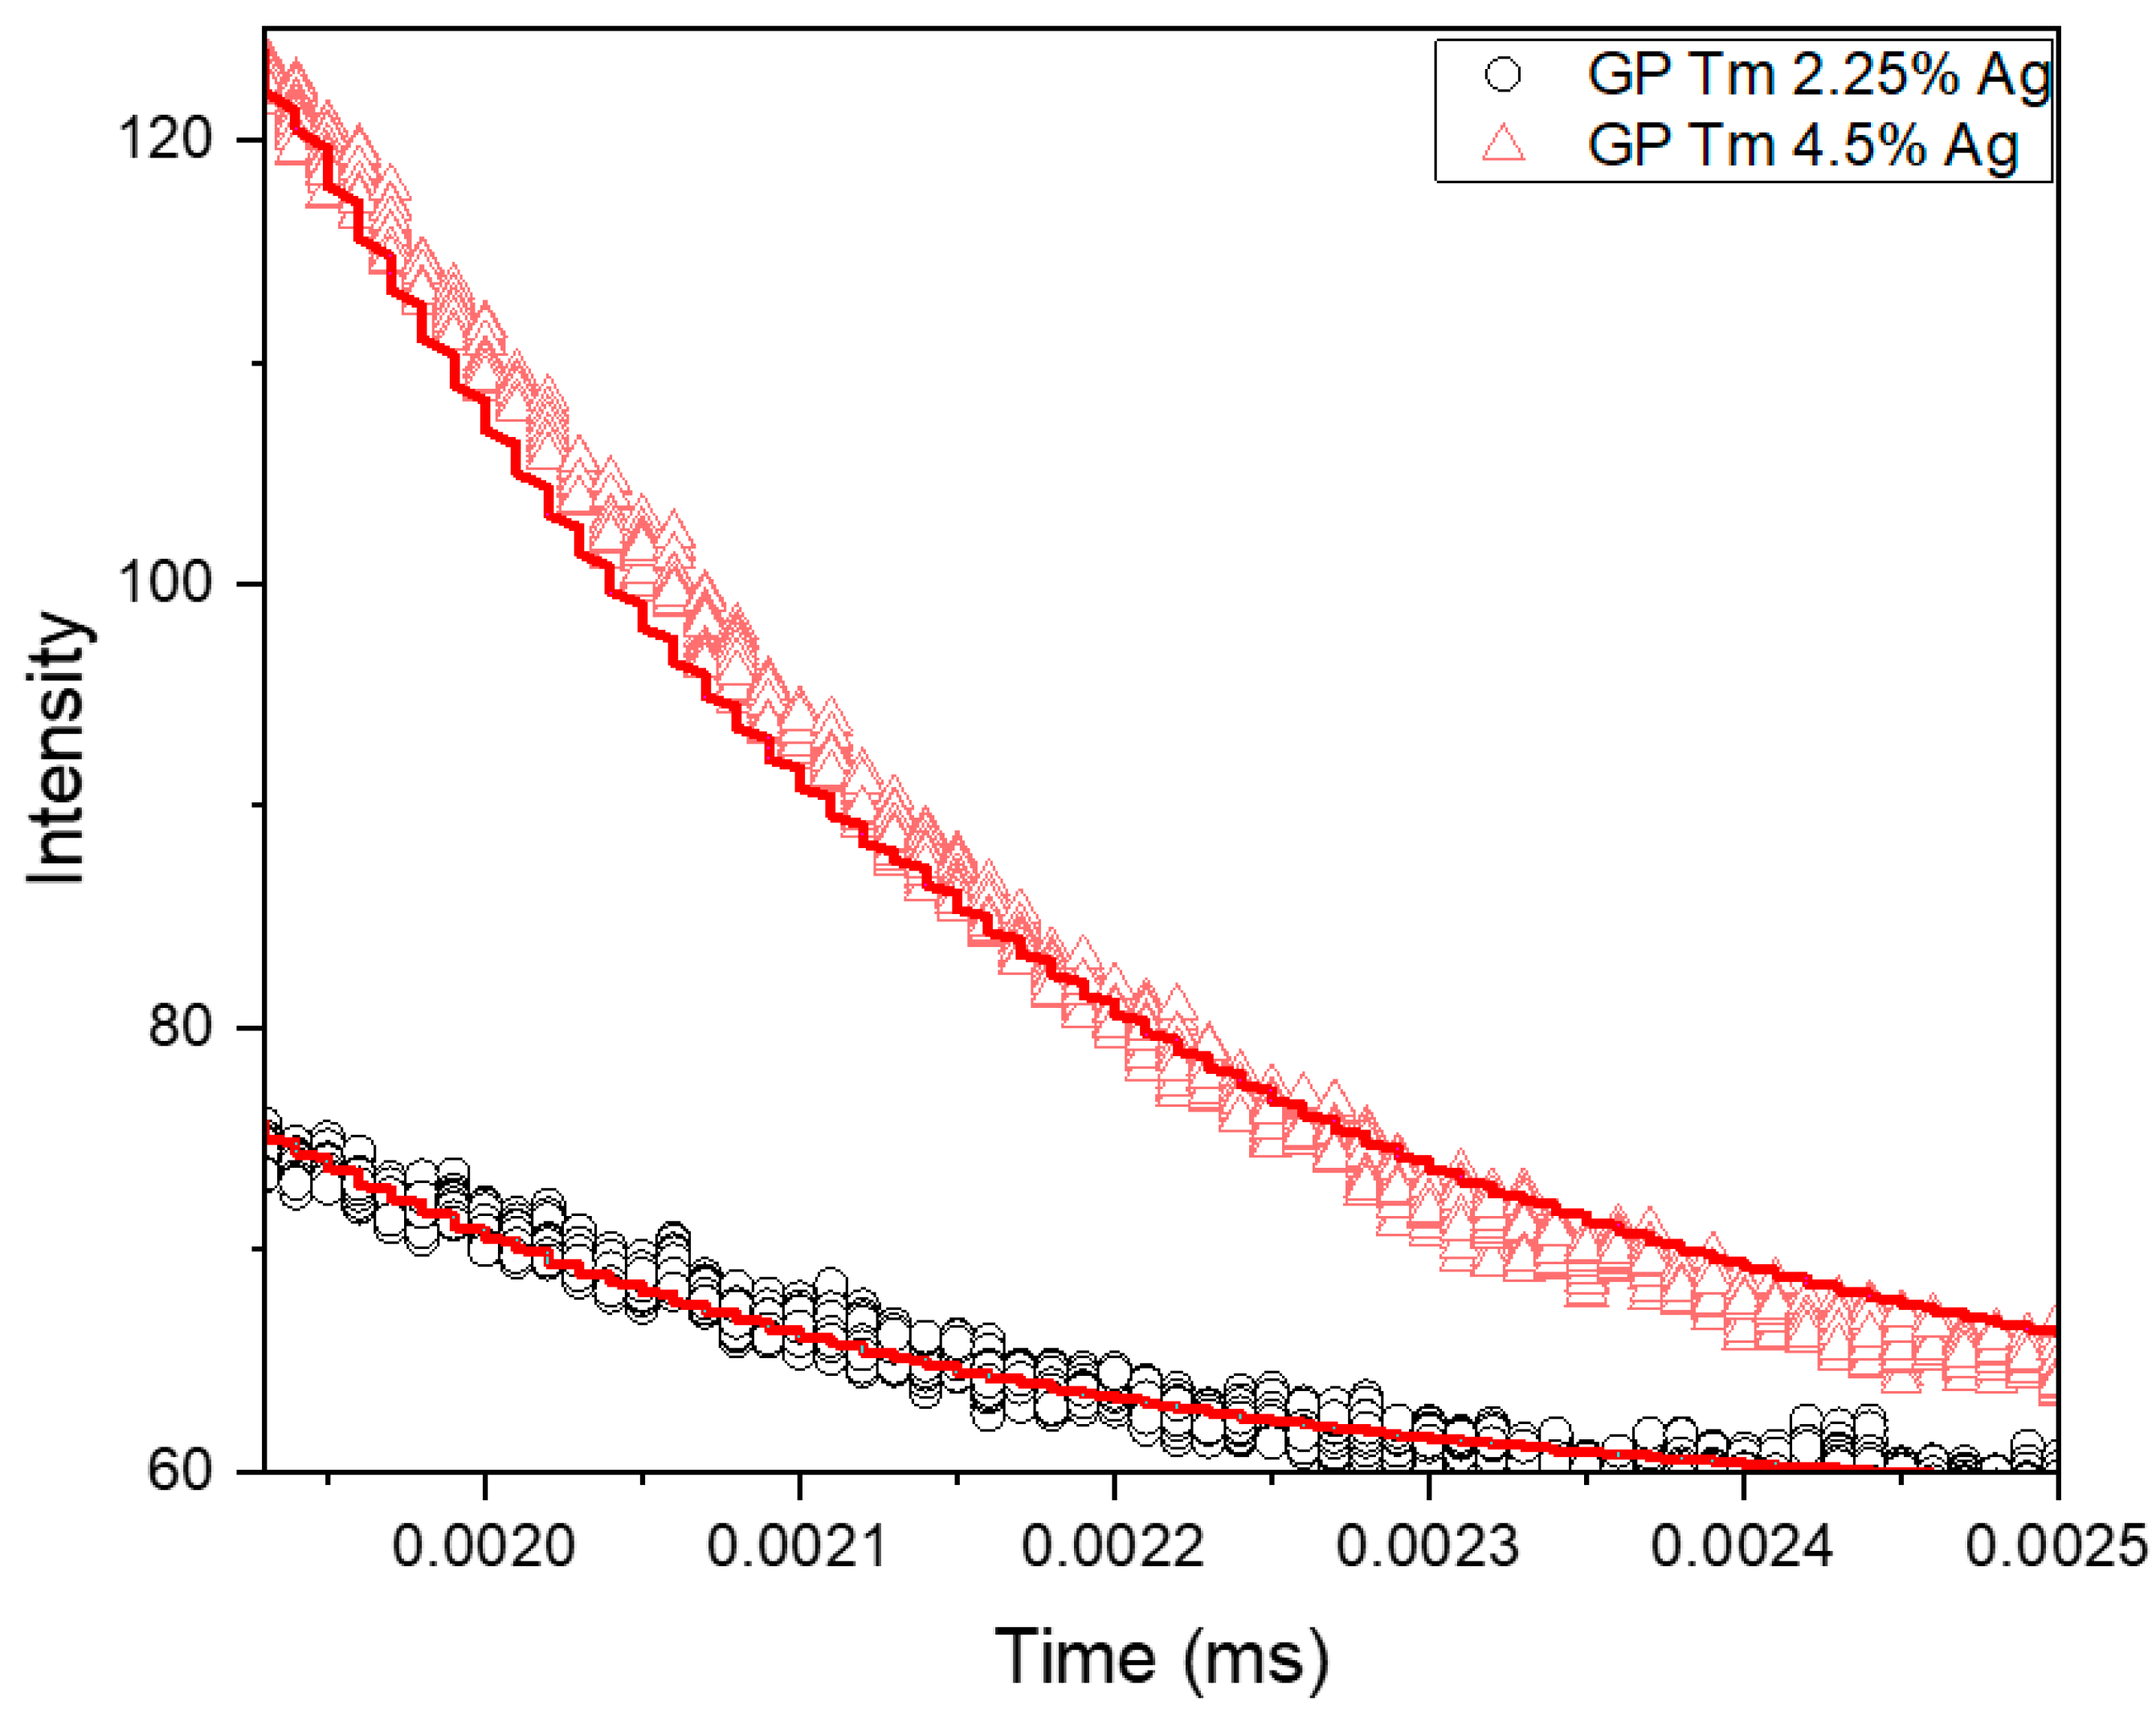
The results of Tm3+ ion decay lifetime measurements under excitation at a 405 nm diode laser are presented in Figure 9 and Table 2. Regarding the 800 nm emission (3H43H6 transition), as previously illustrated in Figure 6, a noticeable enhancement can be seen with the growth of AgNO3 concentration from 2.25 to 4.5 wt.%. This observed trend is further supported by the increase in the lifetime of Tm3+ ions, as evidenced in Table 2, as it changed from 220 μs to 239 μs, indicating a higher ET from the Ag NCs in the sample containing 4.5 wt.% AgNO3. A similar behavior was observed for Yb3+ ions due to Ag NCs in oxyfluoride glasses [8] and for Pr3+ in oxyfluoro tellurite glasses [41]. We attribute the mentioned ET mechanism to the decay processes from S1→T1 and T1→S0 levels of Ag NCs to the 3H4 level of Tm3+ ions serving as the primary path of ET in this system.
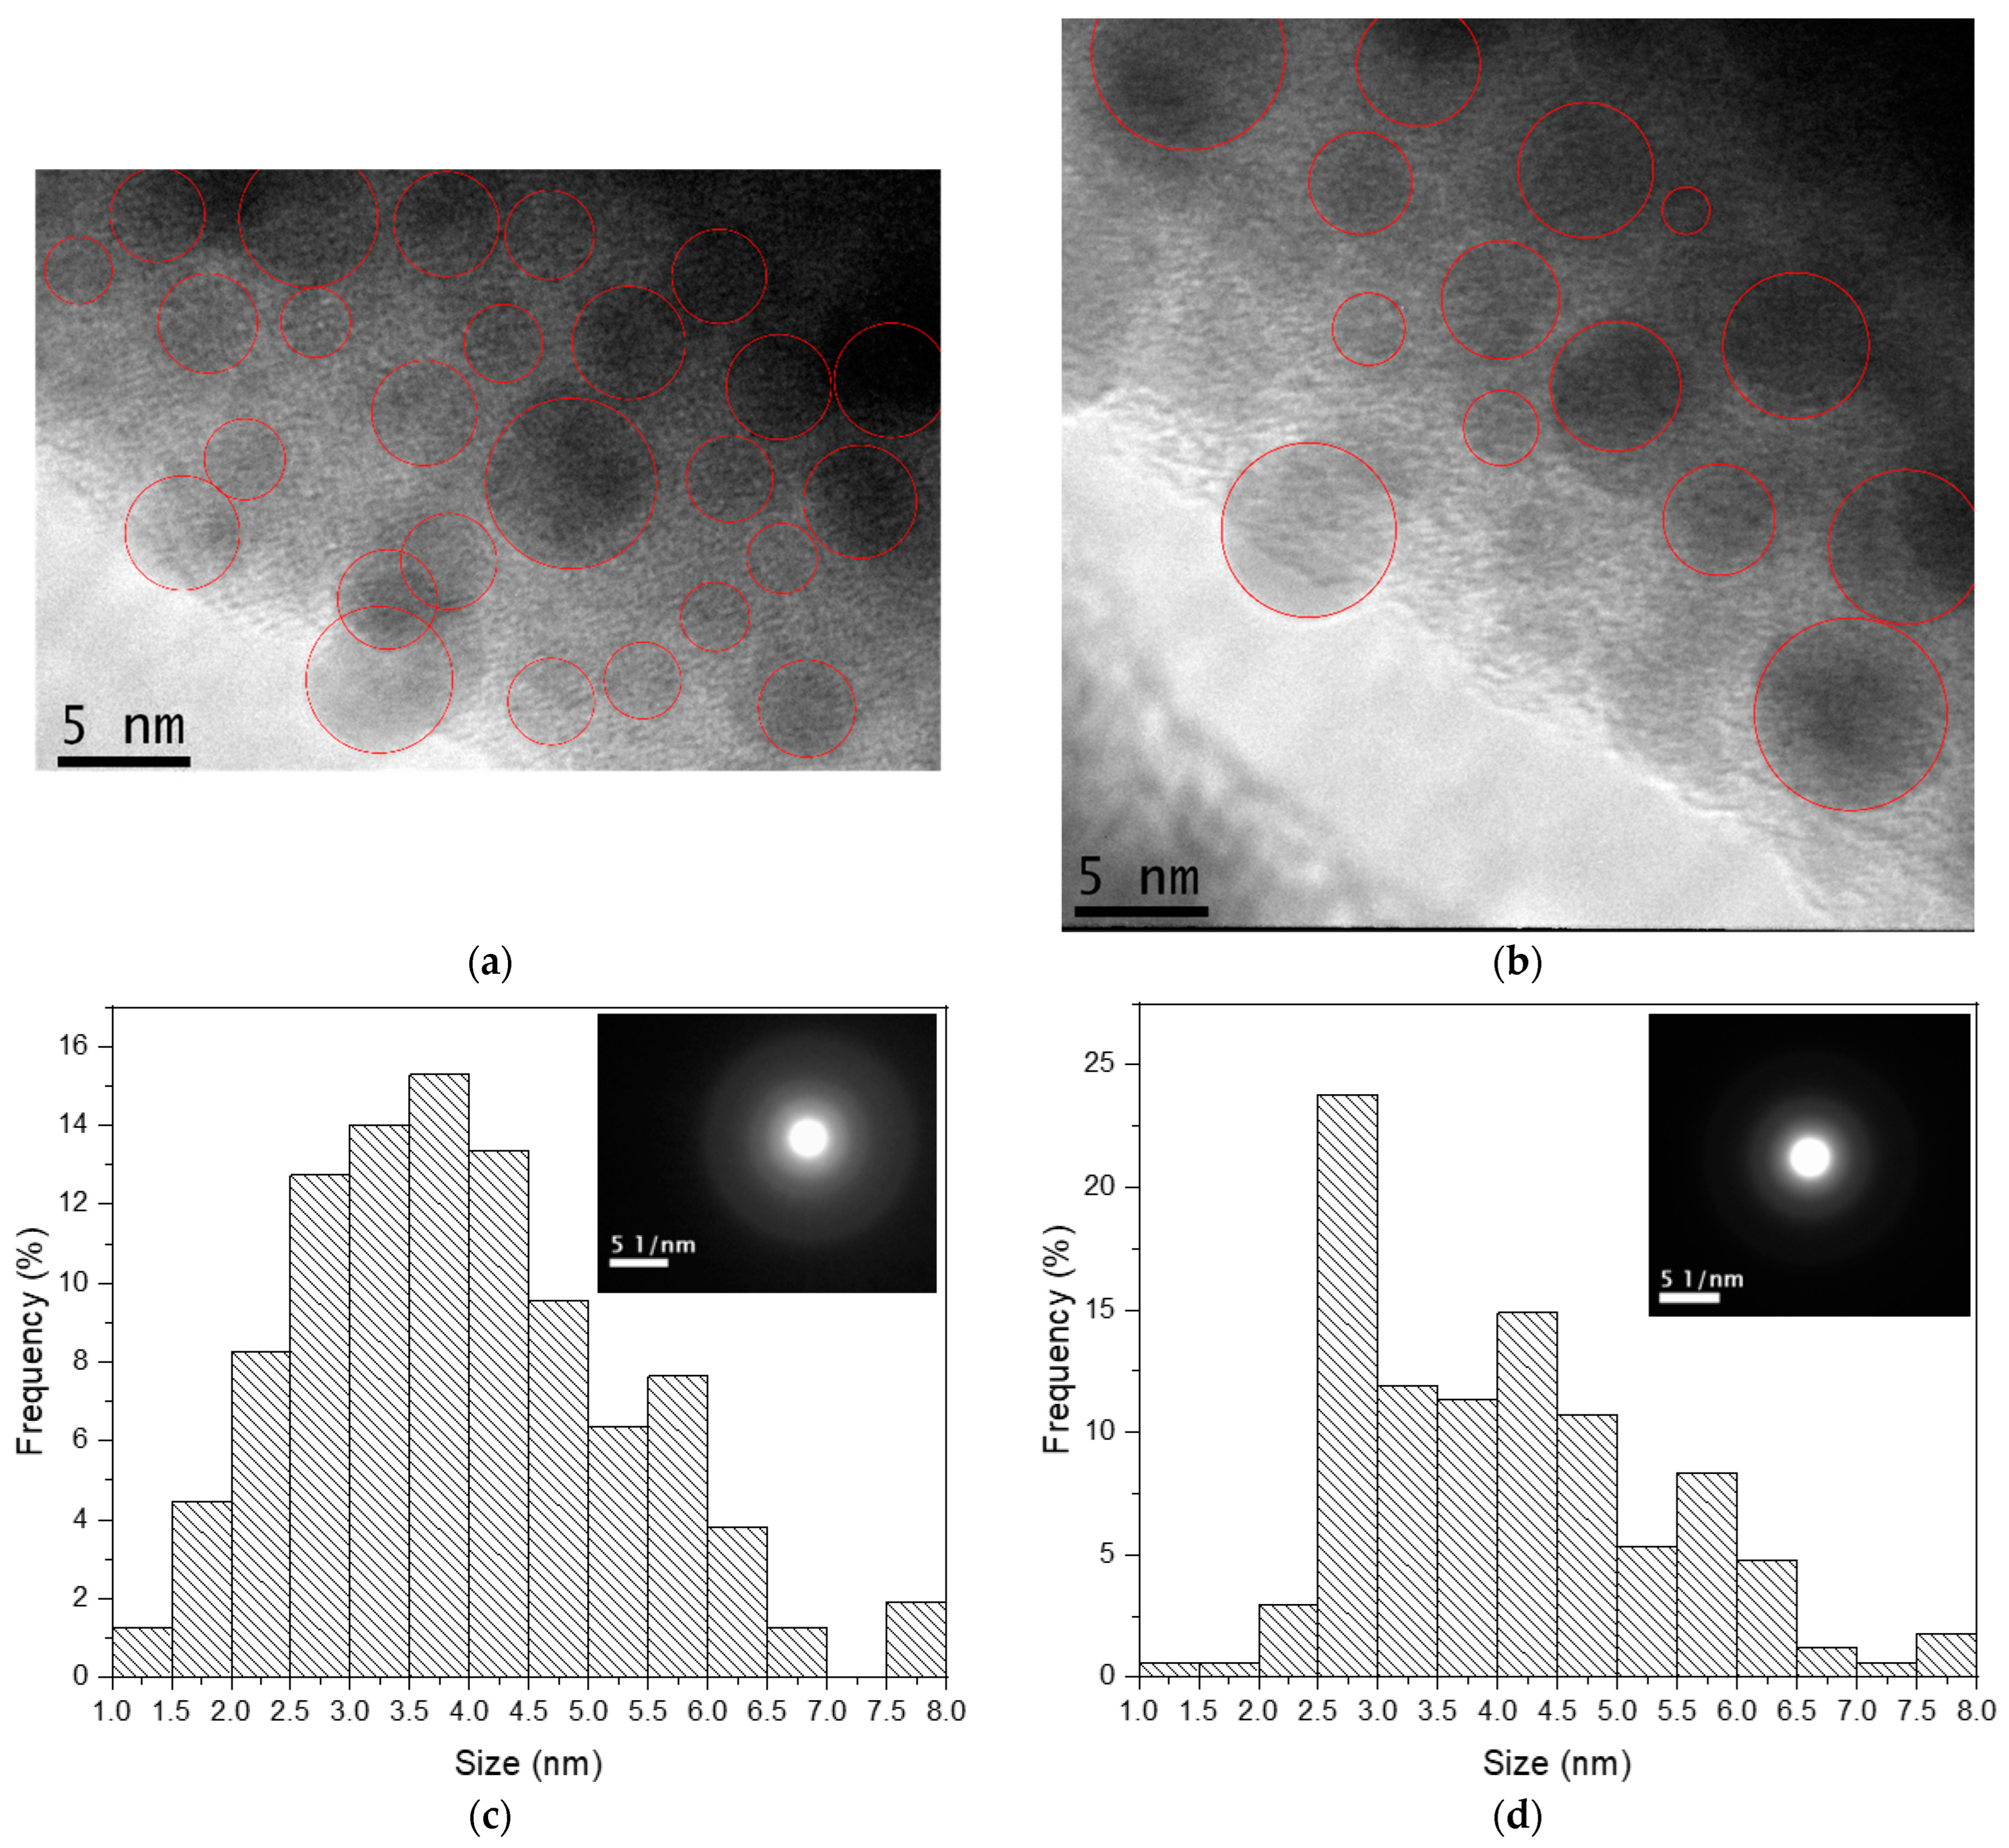
TEM analyses were carried out on the GP 4.5% Ag and GP Tm 4.5% Ag samples, as illustrated in Figure 10. We highlight that the TEM results for the GP 4.5% Ag sample, used as a reference in the present study, were already reported [39], and further analysis is provided in this work.
In the case of the GP Tm 4.5% Ag sample, the histogram presented in Figure 10c demonstrates that the highest density of Ag NCs was centered around 3.5–4.0 nm in size. The diffraction patterns were conspicuously absent, as evidenced by the inset in Figure 10c, validating the amorphous state of Ag NCs. It is worth noting that both histograms were performed based on several TEM images for each sample.
In the GP 4.5% Ag sample, there was also clear evidence of Ag NCs and a lack of diffraction patterns, as shown in the inset in Figure 10d. However, these Ag NCs exhibited a size distribution primarily concentrated between 2.5 and 3.0 nm, as delineated in the accompanying histogram. The notable Ag NC size enhancement of the previous sample, with respect to this one, indicates a potential involvement of Tm3+ ions in a mechanism that favors the nucleation of Ag species, as already reported for Eu3+-doped glasses [42]. It is noteworthy to emphasize that the presence of these amorphous Ag NCs does not preclude the possibility of Ag NPs forming within the glass matrix.

4. Conclusions

This study presents a novel technology for the fabrication of Ag NCs within GeO2-PbO glasses doped with Tm3+ ions. The glasses were prepared using the melt-quenching method, employing an annealing temperature below the glass transition point to facilitate the growth of Ag NCs. Characterization of these samples encompassed absorption, luminescence, lifetime, and transmission electron microscopy. The absorption spectroscopy results confirmed the successful integration of trivalent RE ions into the glass matrix. Transmission electron microscopy and electron diffraction techniques were employed to discern the presence of Ag NCs and their amorphous structure. The fact that the Ag NCs were amorphous was further confirmed through electron diffraction measurements. Visible light emission from the blue to the yellow region was observed for samples containing both Tm2O3 and Ag NCs; an increase in Ag doping led to a redshift in the PL spectra. This shift was attributed to the growth of larger Ag NCs and to the local concentration enhancement of emitting species, favoring emission in the red region. This investigation delved into ET mechanisms, which were scrutinized through luminescence and lifetime measurements. These mechanisms were linked to the proximity of energy levels among Ag NCs and RE ions. The experimental results corroborated ET from Ag NCs to Tm3+ ions, demonstrated by the increased emission of the 3H43H6 transition of Tm3+ ions at 800 nm (under excitation at 380 and 400 nm), mainly for the sample with a higher concentration of Ag NCs, which can be due to the presence of larger Ag NCs. These larger Ag NCs are more suitable for excitation at 380 nm and 400 nm, and they demonstrate higher efficiency for transferring energy to Tm3+ ions. Concurrently, the reduced long lifetimes of Ag NCs with the addition of Tm3+ ions at 600 nm (excitations at 380 and 400 nm) and the prolonged lifetimes of Tm3+ ions at 800 nm (excitation at 405 nm) corroborated the ET processes. Therefore, we attribute the ET of the present work to the decay processes from the S1→T1 and T1→S0 levels of Ag NCs to the 3H4 level of Tm3+ ions serving as the primary path of ET in this system. These findings unveil the potential of GeO2-PbO glasses as a promising host medium for Ag NCs, affirming their viability for photonic applications. The implications extend to diverse technological domains, including coatings for solar cells, broad-band visible light sources, and devices featuring adjustable light emission. Additionally, the potential for CW-tunable lasers operating in the visible region of the electromagnetic spectrum holds promise, paving the way for further exploration involving different RE ions. To the best of our knowledge, there are few studies that have investigated this mechanism in other hosts. Moreover, the GeO2-PbO glasses were not studied to demonstrate the possibility to host Ag NCs with Tm3+ ions or to show the ET mechanism between them. The present work represents a contribution for those who are interested in hosting Ag NCs in oxide glasses and fills a lack in the literature, as mainly fluorophosphate and oxyfluoride glasses have been exploited up to now.

Author Contributions

Conceptualization, M.V.d.M.N., L.R.P.K. and N.U.W.; methodology, M.V.d.M.N., A.A.A., C.D.d.S.B. and J.D.; investigation, M.V.d.M.N., A.A.A., C.D.d.S.B. and J.D.; data curation, M.V.d.M.N., A.A.A. and C.D.d.S.B.; writing—original draft preparation, M.V.d.M.N., A.A.A., C.D.d.S.B., J.D., N.U.W. and L.R.P.K.; supervision, L.R.P.K.; project administration, L.R.P.K.; funding acquisition, L.R.P.K. and N.U.W.; resources, L.R.P.K. and N.U.W. All authors have read and agreed to the published version of the manuscript.

Funding

This research was funded by Coordenação de Aperfeiçoamento de Pessoal de Ensino Superior (CAPES-PROEX 1345/2023) and from Conselho Nacional de Desenvolvimento Científico e Tecnológico—Grant: INCT/CNPq 465.763/2014 (Instituto Nacional de Ciência e Tecnologia de Fotônica) and Grant: 302532/2019-6. We also acknowledge Fundação de Amparo à Pesquisa do Estado de São Paulo—Grant: FAPESP 2019/06334-4. Additionally, the Nanotechnology National Laboratory (LNNano) of the CNPEM-Campinas/Brazil, and LMM/IPEN-SP are acknowledged for the TEM measurements.

Data Availability Statement

Data presented in this study are available upon request from the corresponding author.

Conflicts of Interest

The authors declare no conflict of interest.

References

  1. Kuznetsov, A.S.; Tikhomirov, V.K.; Shestakov, M.V.; Moshchalkov, V.V. Ag Nanocluster Functionalized Glasses for Efficient Photonic Conversion in Light Sources, Solar Cells and Flexible Screen Monitors. Nanoscale 2013, 5, 10065–10075. [Google Scholar] [CrossRef]
  2. Díez, I.; Ras, R.H.A. Fluorescent Silver Nanoclusters. Nanoscale 2011, 3, 1963–1970. [Google Scholar] [CrossRef]
  3. Choi, S.; Dickson, R.M.; Yu, J. Developing Luminescent Silver Nanodots for Biological Applications. Chem. Soc. Rev. 2012, 41, 1867–1891. [Google Scholar] [CrossRef]
  4. Tikhomirov, V.K.; Rodríguez, V.D.; Kuznetsov, A.; Kirilenko, D.; Tendeloo, G.V.; Moshchalkov, V.V. Preparation and Luminescence of Bulk Oxyfluoride Glasses Doped with Ag Nanoclusters. Opt. Express 2010, 18, 22032–22040. [Google Scholar] [CrossRef]
  5. Kuznetsov, A.S.; Velázquez, J.J.; Tikhomirov, V.K.; Mendez-Ramos, J.; Moshchalkov, V.V. Quantum Yield of Luminescence of Ag Nanoclusters Dispersed within Transparent Bulk Glass vs. Glass Composition and Temperature. Appl. Phys. Lett. 2012, 101, 251106. [Google Scholar] [CrossRef]
  6. Tikhomirov, V.K.; Vosch, T.; Fron, E.; Rodríguez, V.D.; Velázquez, J.J.; Kirilenko, D.; Van Tendeloo, G.; Hofkens, J.; Van der Auweraer, M.; Moshchalkov, V.V. Luminescence of Oxyfluoride Glasses Co-Doped with Ag Nanoclusters and Yb3+ Ions. RSC Adv. 2012, 2, 1496–1501. [Google Scholar] [CrossRef]
  7. Velázquez, J.J.; Tikhomirov, V.K.; Chibotaru, L.F.; Cuong, N.T.; Kuznetsov, A.S.; Rodríguez, V.D.; Nguyen, M.T.; Moshchalkov, V.V. Energy Level Diagram and Kinetics of Luminescence of Ag Nanoclusters Dispersed in a Glass Host. Opt. Express 2012, 20, 13582–13591. [Google Scholar] [CrossRef] [PubMed]
  8. Ma, R.; Qian, J.; Cui, S.; Qiao, X.; Wang, F.; Fan, X. Enhancing NIR Emission of Yb3+ by Silver Nanoclusters in Oxyfluoride Glass. J. Lumin. 2014, 152, 222–225. [Google Scholar] [CrossRef]
  9. Shestakov, M.V.; Chen, X.M.; Kaydashev, V.; Baeckelant, W.; Tikhomirov, V.K.; Vanacken, J.; Hofkens, J.; Moshchalkov, V.V. Oxyfluoride Glass (SiO2-PbF2) Co-Doped with Ag Nanoclusters and Tm3+ Ions for UV-Driven, Hg-Free, White Light Generation with a Tuneable Tint. Opt. Mater. Express 2014, 4, 1227–1235. [Google Scholar] [CrossRef]
  10. Wei, R.; Li, J.; Gao, J.; Guo, H. Enhancement of Eu3+ Luminescence by Ag Species (Ag NPs, ML-Ag, Ag+) in Oxyfluoride Glasses. J. Am. Ceram. Soc. 2012, 95, 3380–3382. [Google Scholar] [CrossRef]
  11. Ye, S.; Guo, Z.; Wang, H.; Li, S.; Liu, T.; Wang, D. Evolution of Ag Species and Molecular-like Ag Cluster Sensitized Eu3+ Emission in Oxyfluoride Glass for Tunable Light Emitting. J. Alloys Compd. 2016, 685, 891–895. [Google Scholar] [CrossRef]
  12. Guo, Z.; Ye, S.; Qiao, X.; Wang, D. Luminescence Properties and Tunable Emission of Ag NCs in Oxyfluoride Glass through REF3 (RE = Y, La and Gd) Doping. J. Am. Ceram. Soc. 2018, 101, 732–738. [Google Scholar] [CrossRef]
  13. Sandrini, M.; Muniz, R.F.; Zanuto, V.S.; Pedrochi, F.; Guyot, Y.; Bento, A.C.; Baesso, M.L.; Steimacher, A.; Neto, A.M. Enhanced and Tunable White Light Emission from Ag Nanoclusters and Eu3+-Co-Doped CaBAl Glasses. RSC Adv. 2018, 8, 35263–35270. [Google Scholar] [CrossRef]
  14. Fares, H.; Santos, S.N.; Santos, M.V.; Franco, D.F.; Souza, A.E.; Manzani, D.; Mendonça, C.R.; Nalin, M. Highly Luminescent Silver Nanocluster-Doped Fluorophosphate Glasses for Microfabrication of 3D Waveguides. RSC Adv. 2017, 7, 55935–55944. [Google Scholar] [CrossRef]
  15. Fares, H.; Castro, T.; Franco, D.F.; Fucikova, A.; da Silva, R.R.; Valenta, J.; Ribeiro, S.J.L.; Nalin, M. Tuning Multicolor Emission in AgNCs/Tm3+/Mn2+-Doped Fluorophosphate Glasses. J. Non-Cryst. Solids 2020, 535, 119968. [Google Scholar] [CrossRef]
  16. Fares, H.; Castro, T.; Orives, J.R.; Franco, D.F.; Nalin, M. White Light and Multicolor Emission Tuning in Ag Nanocluster Doped Fluorophosphate Glasses. RSC Adv. 2017, 7, 44356–44365. [Google Scholar] [CrossRef]
  17. Aseev, V.A.; Burdaev, P.A.; Kolobkova, E.V.; Nikonorov, N.V. Fluorophosphate Glasses Activated by Rare-Earth Ions and AgBr. Glass Phys. Chem. 2012, 38, 366–372. [Google Scholar] [CrossRef]
  18. Ennouri, M.; Gelloz, B.; Elhouichet, H. Impact of Ag Species on Luminescence and Spectroscopic Properties of Eu3+ Doped Fluoro-Phosphate Glasses. J. Non-Cryst. Solids 2021, 570, 120938. [Google Scholar] [CrossRef]
  19. Castro, T.; Jubera, V.; Fares, H.; Petit, Y.; Fargues, A.; Cardinal, T.; Nalin, M.; Ribeiro, S. Photoluminescence of Ag+ and Agmn+in Co-Doped Pr3+/Yb3+ Fluorophosphate Glasses: Tuning Visible Emission and Energy Transfer to Pr3+/Yb3+ Ions through Excitation in Different Silver Species. J. Mater. Sci. Mater. Electron. 2019, 30, 16878–16885. [Google Scholar] [CrossRef]
  20. Jiao, Q.; Wang, X.; Qiu, J.; Zhou, D. Effect of Silver Ions and Clusters on the Luminescence Properties of Eu-Doped Borate Glasses. Mater. Res. Bull. 2015, 72, 264–268. [Google Scholar] [CrossRef]
  21. Liao, H.; Ye, S.; Shen, R.; Li, X.; Wang, D. Effective Formation of Ag Nanoclusters and Efficient Energy Transfer to Yb3+ Ions in Borosilicate Glasses for Photovoltaic Application. Mater. Res. Bull. 2019, 111, 113–117. [Google Scholar] [CrossRef]
  22. Shi, Y.; Ye, S.; Yu, J.; Liao, H.; Liu, J.; Wang, D. Simultaneous Energy Transfer from Molecular-like Silver Nanoclusters to Sm3+/Ln3+ (Ln = Eu or Tb) in Glass under UV Excitation. Opt. Express 2019, 27, 38159–38167. [Google Scholar] [CrossRef]
  23. Speranza, G.; Minati, L.; Chiappini, A.; Chiasera, A.; Duverger, C.A.; Ferrari, M.; Righini, G.C. Electron Confinement Effects in Silver Nanocluster Embedded in Sodalime Glasses. In Silicon Photonics and Photonic Integrated Circuits; SPIE: Bellingham, WA, USA, 2008; Volume 6996, pp. 63–69. [Google Scholar]
  24. Li, L.; Yang, Y.; Zhou, D.; Yang, Z.; Xu, X.; Qiu, J. Investigation of the Interaction between Different Types of Ag Species and Europium Ions in Ag+-Na+ Ion-Exchange Glass. Opt. Mater. Express 2013, 3, 806–812. [Google Scholar] [CrossRef]
  25. Dubrovin, V.D.; Ignatiev, A.I.; Nikonorov, N.V.; Sidorov, A.I.; Shakhverdov, T.A.; Agafonova, D.S. Luminescence of Silver Molecular Clusters in Photo-Thermo-Refractive Glasses. Opt. Mater. 2014, 36, 753–759. [Google Scholar] [CrossRef]
  26. Hamzaoui, H.E.; Capoen, B.; Razdobreev, I.; Bouazaoui, M. In Situ Growth of Luminescent Silver Nanoclusters inside Bulk Sol-Gel Silica Glasses. Mater. Res. Express 2017, 4, 076201. [Google Scholar] [CrossRef]
  27. Ghafoor, M.; Sgibnev, Y.; Marasanov, D.; Nikonorov, N. Energy Transfer between Silver Clusters and Europium Eu3+ Ions in Photo-Thermo-Refractive Glasses. In Third International Conference on Applications of Optics and Photonics; SPIE: Bellingham, WA, USA, 2017; Volume 10453, pp. 138–143. [Google Scholar]
  28. Nishimura, M.V.M.; Bordon, C.D.S.; da Silva, D.M.; Kassab, L.R.P. Tunable visible emission and white light generation by Ag nanoclusters in Tm3+/Yb3+ doped GeO2-PbO glasses. In Proceedings of the 2021 35th Symposium on Microelectronics Technology and Devices (SBMicro), Campinas, Brazil, 23–27 August 2021. [Google Scholar]
  29. Chattopadhyay, R.; Haldar, A.; Paul, M.C.; Das, S.; Bhadra, S.K. Fluorescence Enhancement in Tm-Yb-Ag Codoped Fiber by Super-Radiance. In Proceedings of the 12th International Conference on Fiber Optics and Photonics (2014), paper T4A.5, Kharagpur, India, 13–16 December 2014; p. T4A.5. [Google Scholar]
  30. Halder, A.; Chattopadhyay, R.; Majumder, S.; Bysakh, S.; Paul, M.C.; Das, S.; Bhadra, S.K.; Unnikrishnan, M. Highly Fluorescent Silver Nanoclusters in Alumina-Silica Composite Optical Fiber. Appl. Phys. Lett. 2015, 106, 011101. [Google Scholar] [CrossRef]
  31. Nishimura, M.V.M.; Bordon, C.D.S.; Miretzcky, L.M.; Kassab, L.R.P. Broadband visible light emission by GeO2-PbO glasses doped with Ag nanoclusters. In Proceedings of the 2021 SBMO/IEEE MTT-S International Microwave and Optoelectronics Conference (IMOC), Fortaleza, Brazil, 24–27 October 2021. [Google Scholar]
  32. Amaro, A.A.; Mattos, G.R.d.S.; Nishimura, M.V.d.M.; Dipold, J.; Wetter, N.U.; Kassab, L.R.P. Silver Nanoclusters Tunable Visible Emission and Energy Transfer to Yb3+ Ions in Co-Doped GeO2-PbO Glasses for Photonic Applications. Nanomaterials 2023, 13, 1177. [Google Scholar] [CrossRef] [PubMed]
  33. Halperin, W.P. Quantum Size Effects in Metal Particles. Rev. Mod. Phys. 1986, 58, 533–606. [Google Scholar] [CrossRef]
  34. Dousti, M.R.; Amjad, R.J. Plasmon Assisted Luminescence in Rare Earth Doped Glasses. In Reviews in Plasmonics 2015; Geddes, C.D., Ed.; Reviews in Plasmonics; Springer International Publishing: Cham, Switzerland, 2016; pp. 339–386. [Google Scholar]
  35. Camilo, M.E.; Assumpção, T.A.A.; da Silva, D.M.; da Silva, D.S.; Kassab, L.R.P.; de Araújo, C.B. Influence of Silver Nanoparticles on the Infrared-to-Visible Frequency Upconversion in Tm3+/Er3+/Yb3+ Doped GeO2-PbO Glass. J. Appl. Phys. 2013, 113, 153507. [Google Scholar] [CrossRef]
  36. Kassab, L.R.P.; Bomfim, F.A.; Martinelli, J.R.; Wetter, N.U.; Neto, J.J.; de Araújo, C.B. Energy Transfer and Frequency Upconversion in Yb3+–Er3+-Doped PbO-GeO2 Glass Containing Silver Nanoparticles. Appl. Phys. B 2009, 94, 239–242. [Google Scholar] [CrossRef]
  37. Pontuschka, W.M.; Giehl, J.M.; Miranda, A.R.; Da Costa, Z.M.; Alencar, A.M. Effect of the Al2O3 Addition on the Formation of Silver Nanoparticles in Heat Treated Soda-Lime Silicate Glasses. J. Non-Cryst. Solids 2016, 453, 74–83. [Google Scholar] [CrossRef]
  38. McCamy, C.S. Correlated Color Temperature as an Explicit Function of Chromaticity Coordinates. Color Res. Appl. 1992, 17, 142–144. [Google Scholar] [CrossRef]
  39. Nishimura, M.V.M.; Bordon, C.D.S.; Miretzcky, L.M.; Kassab, L.R.P. A review of recent results of white light generation and tunable visible light emission by Ag nanoclusters: Undoped and doped Tm3+/Yb3+ doped GeO2-BbO glasses. In Smart Systems: Theory and Advances; Amplla Editora: Campina Grande, Brazil, 2022; pp. 57–73. [Google Scholar] [CrossRef]
  40. Lim, K.-S.; Babu, P.; Jayasankar, C.K.; Lee, S.; Pham, V.-T.; Seo, H.-J. Optical Spectroscopy of Thulium-Doped Oxyfluoroborate Glass. J. Alloys Compd. 2004, 385, 12–18. [Google Scholar] [CrossRef]
  41. Rajesh, D.; Amjad, R.J.; Reza Dousti, M.; de Camargo, A.S.S. Enhanced VIS and NIR Emissions of Pr3+ Ions in TZYN Glasses Containing Silver Ions and Nanoparticles. J. Alloys Compd. 2017, 695, 607–612. [Google Scholar] [CrossRef]
  42. Jiao, Q.; Qiu, J.; Zhou, D.; Xu, X. Contribution of Eu Ions on the Precipitation of Silver Nanoparticles in Ag-Eu Co-Doped Borate Glasses. Mater. Res. Bull. 2014, 51, 315–319. [Google Scholar] [CrossRef]
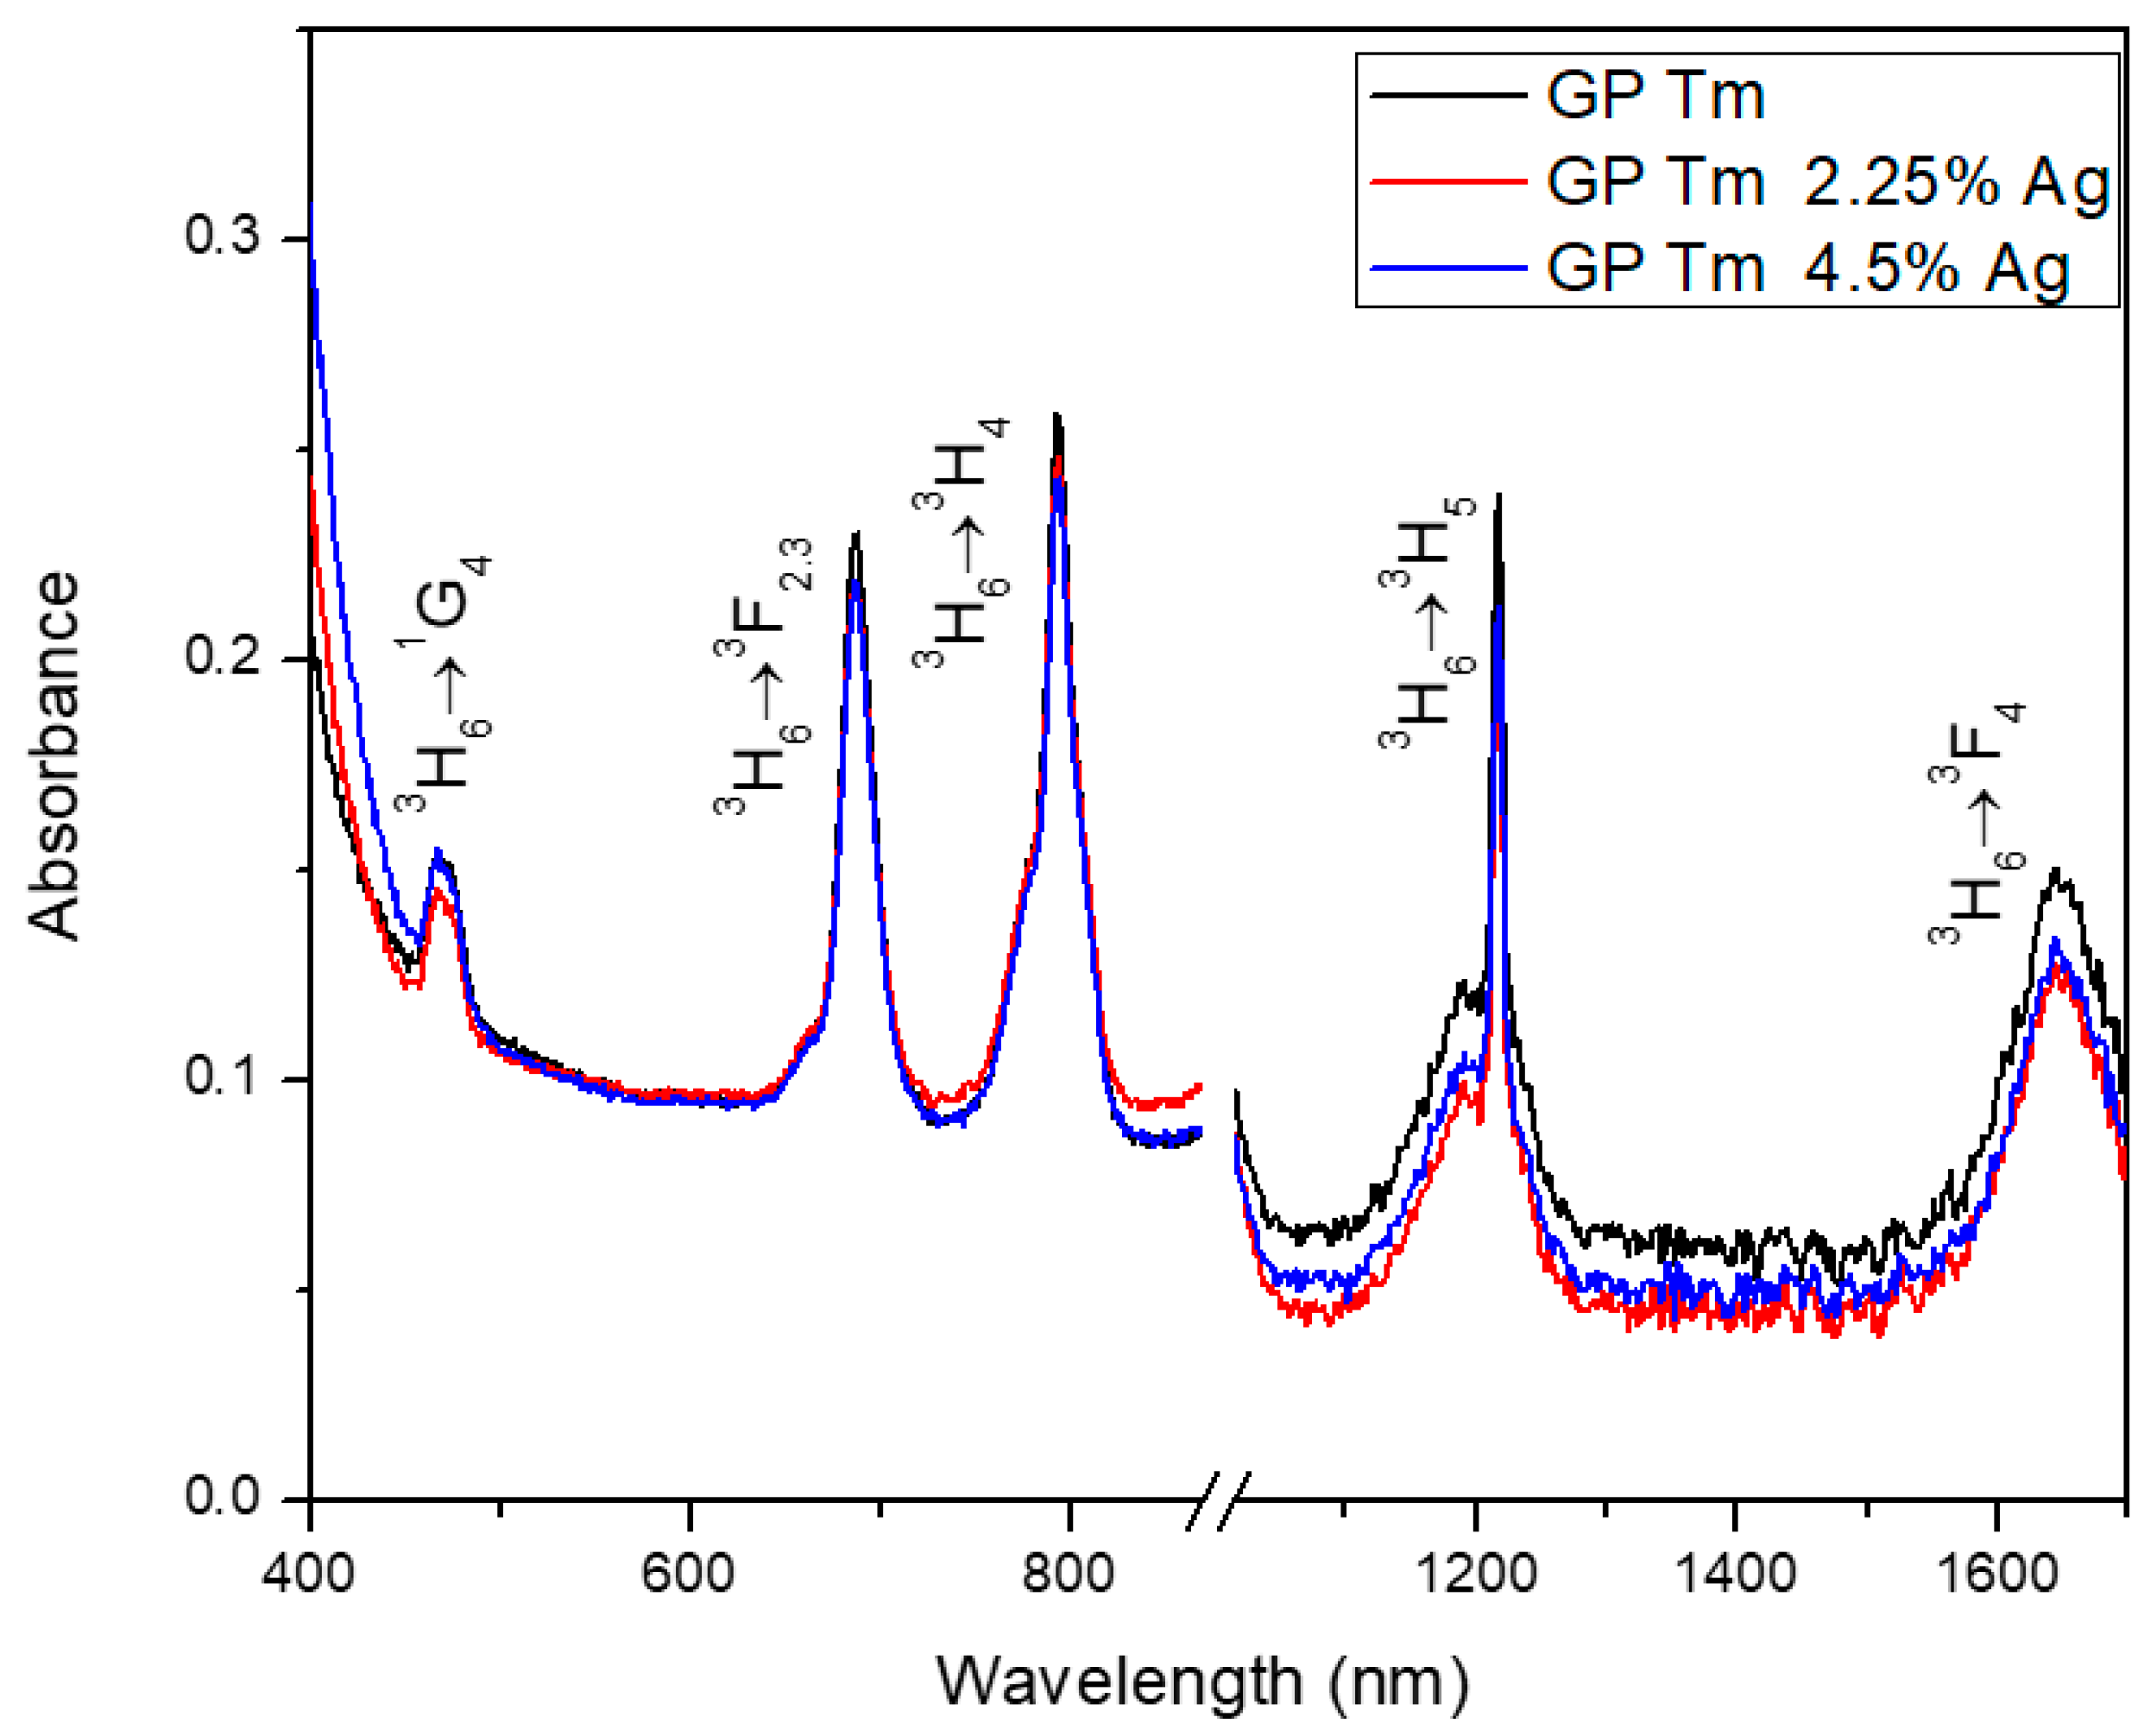
Figure 1. Absorption spectra of GP Tm, GP Tm 2.25% Ag, and GP Tm 4.5% Ag glass samples.
Micromachines 14 02078 g001
Figure 2. PL spectra of GP Tm sample at 360 nm excitation. The inset shows the sample chromaticity diagram (CIE-1931).
Micromachines 14 02078 g002
Figure 3. (a) PL spectra of GP Tm 2.25% Ag and (b) chromaticity diagram (CIE-1931) under varying excitation at 360, 380, and 400 nm.
Micromachines 14 02078 g003
Figure 4. (a) PL spectra of GP Tm 4. 5% Ag and (b) chromaticity diagram (CIE-1931) under varying excitation at 360, 380, and 400 nm.
Micromachines 14 02078 g004
Figure 5. Chromaticity diagram (CIE-1931) for fixed excitation at 360 nm for GP Tm, GP Tm 2.25% Ag, and GP Tm 4.5% Ag.
Micromachines 14 02078 g005
Figure 6. PL spectra of GP Tm 2.25% Ag and GP Tm 4.5% Ag samples under 405 nm CW laser diode excitation.
Micromachines 14 02078 g006
Figure 7. Simplified energy diagram of Ag NCs with ET to Tm3+ ions.
Micromachines 14 02078 g007
Figure 8. Ag NC PL decay curves of GP 4.5% Ag and GP Tm 4.5% Ag samples under (a) 380 and (b) 400 nm excitation and detection at 600 nm.
Micromachines 14 02078 g008
Figure 9. Tm3+ ions PL decay curves of GP Tm 2.25% Ag and GP Tm 4.5% Ag, with excitation at 405 nm and signal collected at 800 nm.
Micromachines 14 02078 g009
Figure 10. (a,b) TEM images and size distribution of (c) GP Tm 4.5% Ag and (d) GP 4.5% Ag with ED pattern as inset.
Micromachines 14 02078 g010
Table 1. PL decay lifetimes (fast and slow components) of GP 4.5% Ag and GP Tm 4.5% Ag samples under 380 and 400 nm excitations and detection at 600 nm.
SampleExcitation Wavelength (nm)τfast (μs)τslow (μs)
GP 4.5% Ag38011.7 ± 0.385 ± 2
4003.7 ± 0.472 ± 8
GP Tm 4.5% Ag3803.3 ± 0.126.2 ± 0.3
4005.8 ± 0.238 ± 2
Table 2. PL decay lifetimes of Tm3+ ions for of GP Tm 2.25% Ag and GP Tm 4.5% Ag samples with excitation at 405 nm and detection at 800 nm.
SampleΤime (μs)
GP Tm 2.25% Ag220 ± 4
GP Tm 4.5% Ag239 ± 9
Disclaimer/Publisher’s Note: The statements, opinions and data contained in all publications are solely those of the individual author(s) and contributor(s) and not of MDPI and/or the editor(s). MDPI and/or the editor(s) disclaim responsibility for any injury to people or property resulting from any ideas, methods, instructions or products referred to in the content.