Article

Research on Determining Elastic–Plastic Constitutive Parameters of Materials from Load Depth Curves Based on Nanoindentation Technology

1
State Key Laboratory of Advanced Design and Manufacturing for Vehicle Body, Hunan University, Changsha 410082, China
2
Institute of New Materials, Guangdong Academy of Sciences, National Engineering Laboratory of Modern Materials Surface Engineering Technology, Guangdong Provincial Key Laboratory of Modern Surface Engineering Technology, Guangzhou 510651, China
3
Laboratory of Science and Technology on Integrated Logistics Support, College of Intelligence Science and Technology, National University of Defense Technology, Changsha 410073, China
*
Authors to whom correspondence should be addressed.
Micromachines 2023, 14(5), 1051; https://doi.org/10.3390/mi14051051
Submission received: 18 April 2023 / Revised: 8 May 2023 / Accepted: 10 May 2023 / Published: 15 May 2023

Abstract

:
It is of great significance for structural design and engineering evaluation to obtain the elastic–plastic parameters of materials. The inverse estimation of elastic–plastic parameters of materials based on nanoindentation technology has been applied in many pieces of research, but it has proved to be difficult to determine the elastic–plastic properties of materials by only using a single indentation curve. A new optimal inversion strategy based on a spherical indentation curve was proposed to obtain the elastoplastic parameters (the Young’s modulus E, yield strength σy, and hardening exponent n) of materials in this study. A high-precision finite element model of indentation with a spherical indenter (radius R = 20 µm) was established, and the relationship between the three parameters and indentation response was analyzed using the design of experiment (DOE) method. The well-posed problem of inverse estimation under different maximum indentation depths (hmax1 = 0.06 R, hmax2 = 0.1 R, hmax3 = 0.2 R, hmax4 = 0.3 R) was explored based on numerical simulations. The results show that the unique solution with high accuracy can be obtained under different maximum press-in depths (the minimum error was within 0.2% and the maximum error was up to 1.5%). Next, the load-depth curves of Q355 were obtained by a cyclic loading nanoindentation experiment, and the elastic–plastic parameters of Q355 were determined by the proposed inverse-estimation strategy based on the average indentation load-depth curve. The results showed that the optimized load-depth curve was in good agreement with the experimental curve, and the optimized stress–strain curve was slightly different from the tensile test, and the obtained parameters were basically consistent with the existing research.

1. Introduction

Characterization of the elastic–plastic properties of materials is of great significance for the structural design and engineering evaluation. Due to the incomparable advantages in the measurement of nondestructive and micro-mechanical properties [1,2], nanoindentation technology has been widely used in the research of mechanical properties of metals [3,4,5,6], films [7,8,9], and biomaterials [10,11,12], particularly in the elastic–plastic properties.
For several decades, many researchers have focused on extracting the Young’s modulus (E), yield strength (σy), and hardening exponent (n) of elastic–plastic materials from indentation load-depth curves. Based on the method of Oliver and Pharr [13,14] or Hertzian contact theory [15], Young’s modulus can be determined from the indentation curve. However, the material parameters obtained from these experiments depend heavily on the contact radius [16,17], which plays an important role in the effects of the accuracy of measurement of parameters. Although many scholars have revised the calibration of contact function which plays an important role in the calculation of the tip area function, it is still difficult to obtain a high-precision area radius [18,19]. Moreover, the parameters directly obtained such as the indentation modulus and hardness are not enough to characterize the elastic–plastic properties of materials.
The difficulty in obtaining the elastic–plastic parameters of materials from the load-depth curve is that the relationship between them is not one-to-one, which means the combination of different material parameters will produce the same load-depth curve [20,21,22,23,24]. Based on the reverse method, some scholars have used dual indenters to distinguish the load-depth curves of different material combinations for determining the unique solution of elastic–plastic parameters [25,26,27,28]. However, it is difficult to find a suitable indenter to distinguish the indentation curves of different material parameter combinations, especially for some unknown materials [29]. In addition, the number of solving parameters corresponds to the number of indenters, and a large number of coefficients need to be fitted by finite element calculation in practical application. The representative strain proposed by Tabor [30] has been applied to solve the elastic–plastic parameters of different materials [31,32,33,34], which effectively reduces the fitting coefficient. The key of this method is to determine the appropriate representative strain; however, unfortunately, the definition of this is still controversial [32,34,35,36].
The inverse estimation approach of elastoplastic parameters is also often used in research. Ensuring the uniqueness of the material parameter is the main problem in the inverse estimation process. By introducing an additional indentation parameter, pile-up/sink-in, some scholars [22,37,38] have obtained the unique solution of elastic–plastic properties of materials combined with the load-depth curve. However, accurately measuring the morphology of residual indentation is difficult and costly. Moreover, there is no pile-up/sink-in observed in the indentation process for some materials [39,40,41]. A spherical indenter can separate the elasticity and plasticity of materials [42], and it had been always used to solve multi-solution problems [42,43,44]. In recent years, cyclic loading with a spherical indenter has been gradually applied to obtain the solution of elastic–plastic properties of materials [3,4,45,46,47,48,49]. As far as this is concerned, only a few researchers have carried out the reverse engineering of elastic–plastic properties of materials based on the depth curve of cyclic loading [49], and the uniqueness of solutions has not been explained in their research. In addition, it is still unknown what kind of influence the coupling relationship between the elastic–plastic parameters of various materials has on the cyclic loading–unloading curve.
The purpose of this study is to acquire the elastic–plastic constitutive parameters of materials from the load-depth curve obtained based on nanoindentation indentation technology. The uniqueness of the solution at different indentation depths was discussed in detail using finite element simulation. Combined with the design of experiment (DOE) method, the relationship between elastic–plastic parameters and indentation curve was further studied. Finally, the proposed inverse estimation strategy was used to determine the elastic–plastic parameters of steel Q355 based on the indentation experiment load-depth curve, and the results were compared with those of the tensile test.

2. Identification Procedure

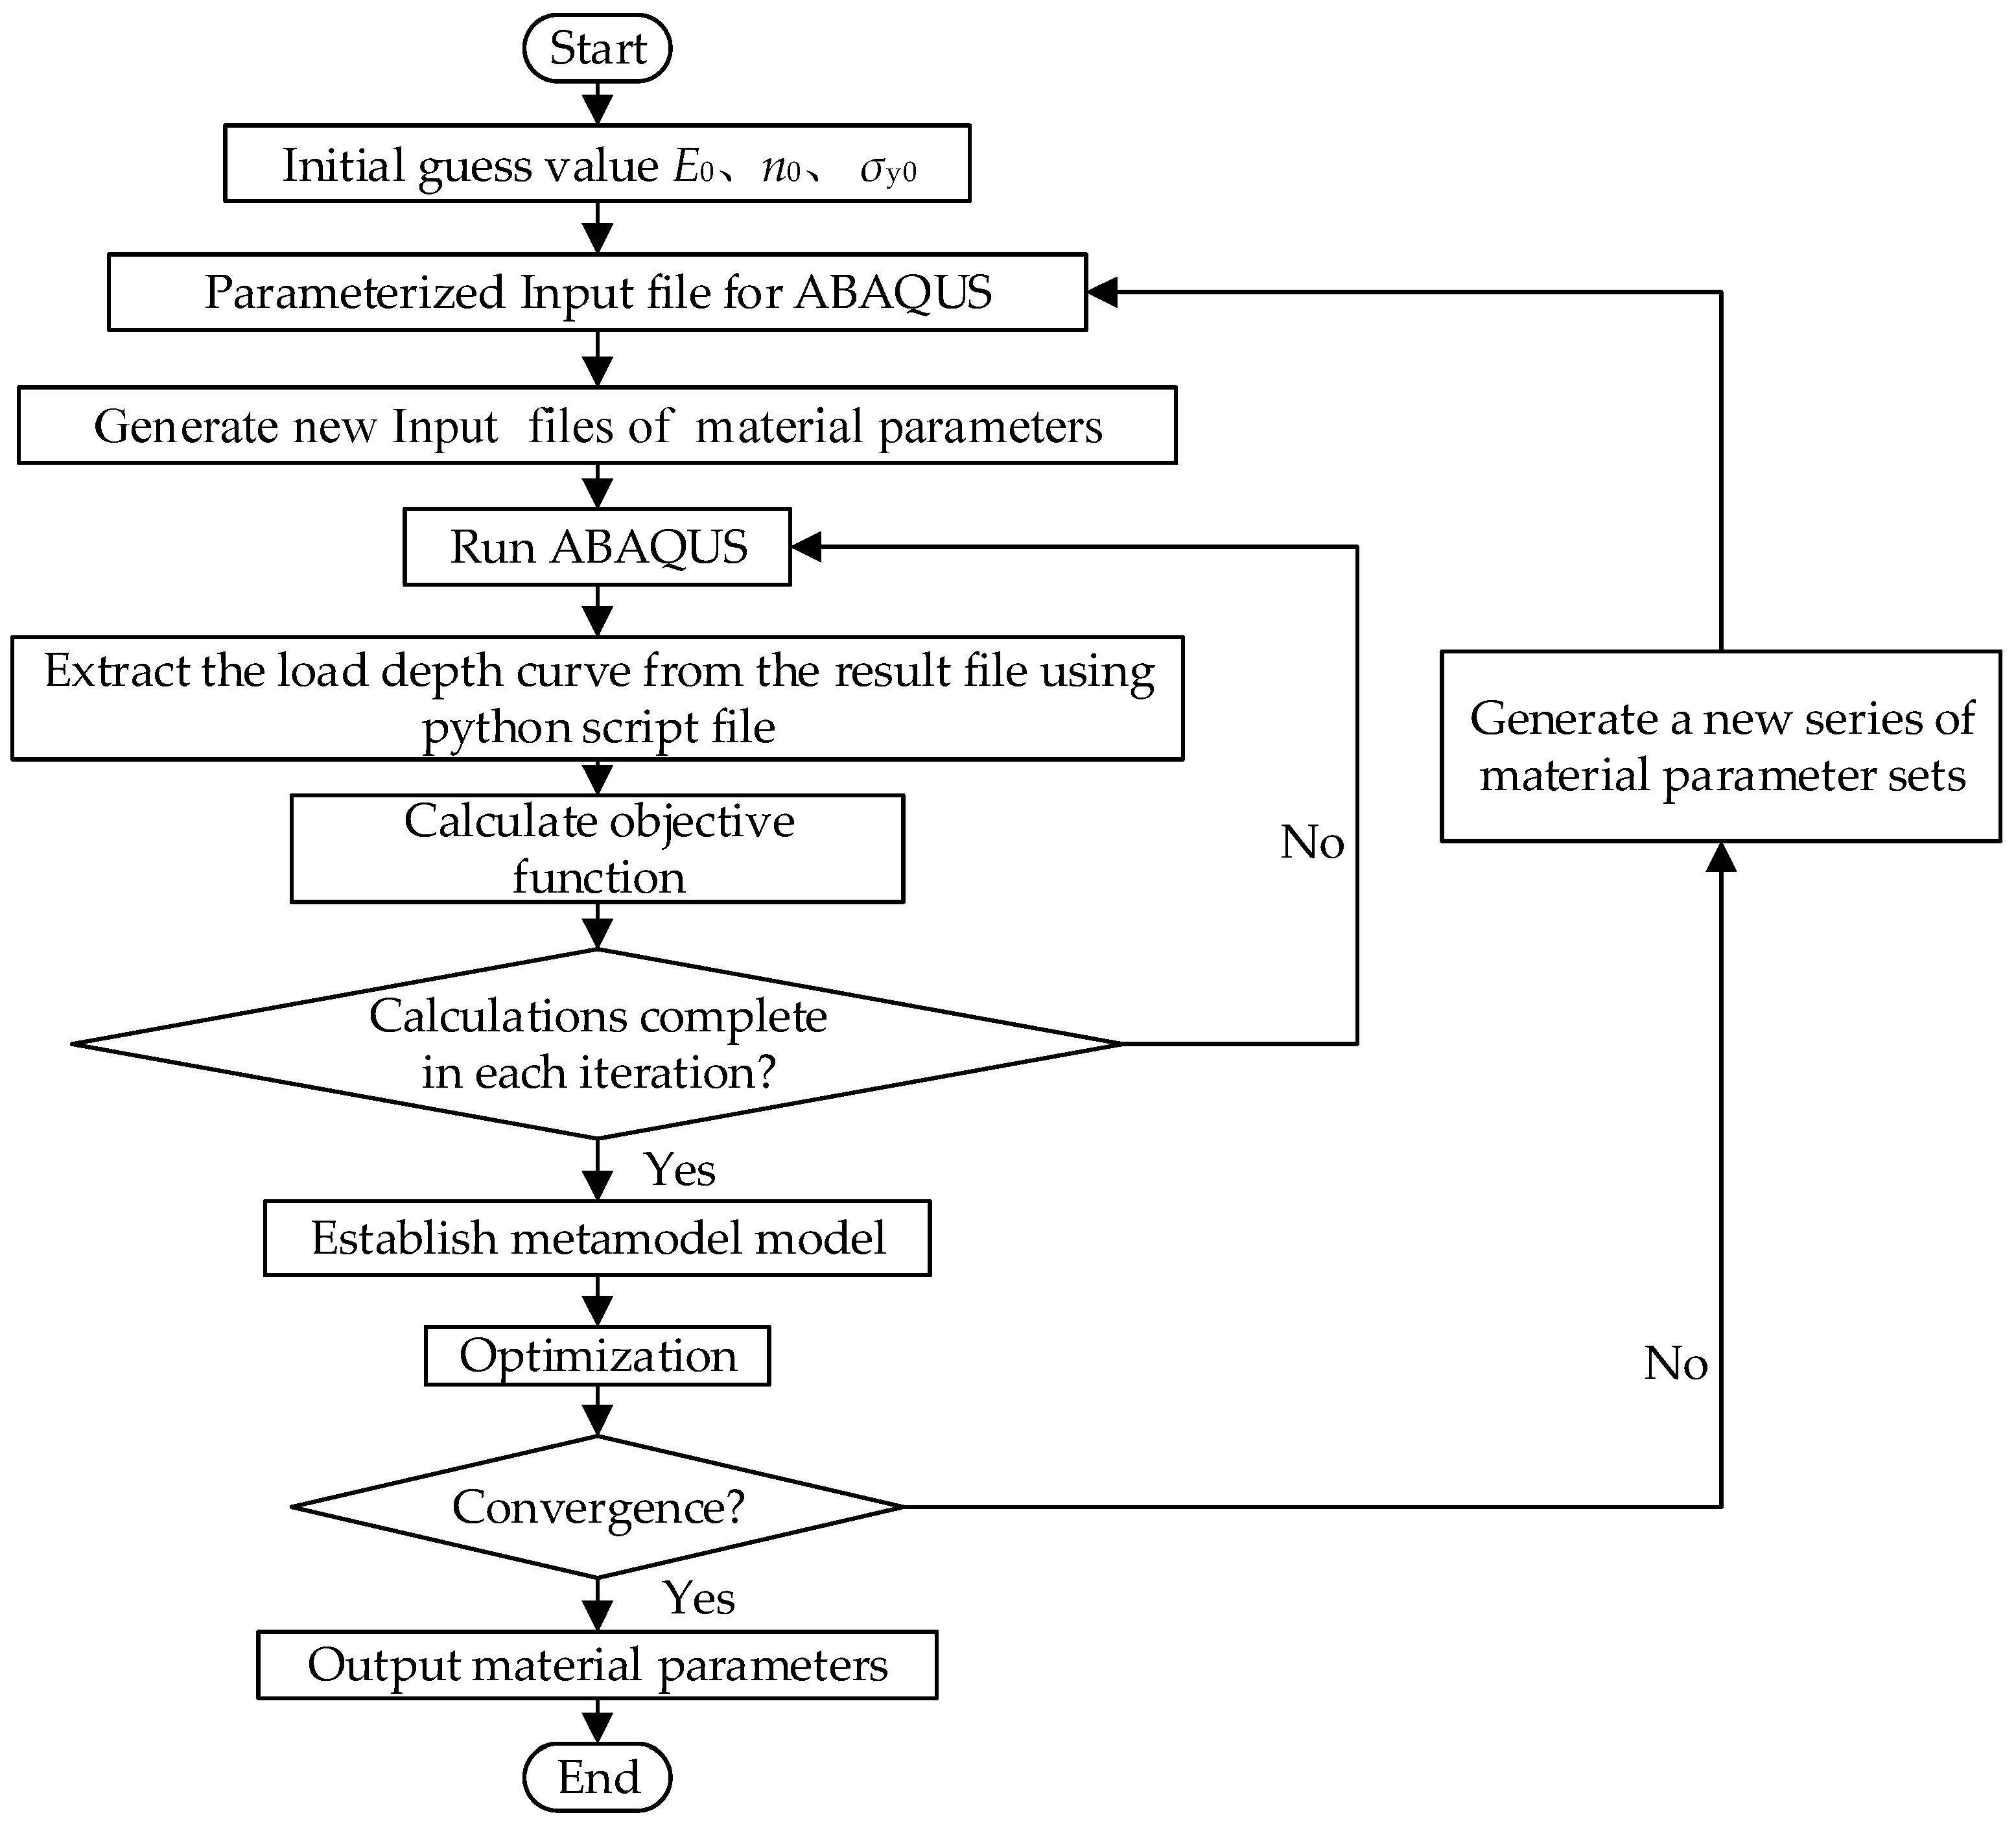
In this study, a metamodel-based global optimization strategy has been implemented in LSOPT. By parameterizing the material parameters in ABAQUS calculation input files, the material parameters were modified and new input files were generated. The ABAQUS run for calculation was based on a batch file by using the user-defined interface, and the python script was used to extract the load-depth curves from the resulting ABAQUS output files which were successfully calculated. The genetic algorithm (GA) provided by LSOPT was widely used in engineering optimization because of its powerful global optimal search ability [50,51]. The Kriging metamodel was used to replace the complicated finite element calculation in optimization to improve the calculation efficiency [52,53].
In this study, a power law strain-hardening curve was used to simulate the indentation experiments. The stress–strain relationship can be described as:
σ = E ε ; σ σ y σ = K ε n , σ σ y
where E is the Young’s modulus; σy the yields tress; K the strength coefficient; n the strain hardening component. By enforcing continuity at σ = σy,
σ y = E ε y = K ε y n
The decomposition of the strain into elastic and plastic parts is given by:
ε = ε y + ε p
Then, the stress equation can be written as:
σ = σ y ( 1 + E σ y ε p ) n
E, n, and σy, are used to define the elastic–plastic relationship of materials in ABAQUS simulation by Equation (4).
The procedure (Figure 1) can be described in the following steps: firstly, the load-depth curves of multiple cyclic loading are obtained by nanoindentation experiment; secondly, a high-precision model of indentation simulation was established by finite element analysis; next, a set of conjectured initial values (E0, n0, σy0) were substituted into the finite element model for calculation, and the error value of the area between the simulation curve and the experimental curve was defined as the objective function, which could be automatically interpolated in LSOPT by Equation (5):
F E , n , σ y = h 1 h 2 P s i m h P e x p ( h )
In the process of iteration, the design variables were constantly changing in the set domain of interest to complete the new calculation. After finishing an iteration, a Kriging metamodel was established according to a series of material parameters and corresponding objective function responses, and the optimal solution in this iteration was predicted based on the metamodel so that the indentation simulation curve can better match the experimental curve. The optimization model can be described as:
min F ( E , n , σ y )
When the convergence condition reached the objective function tolerance or maximum number of iterations, the optimization process would be completed, and the material parameters would be determined with the simulation curve consistent with the experimental curve.
Figure 1. Flow chart of the optimization to determine the properties from the load-depth curves.
Micromachines 14 01051 g001

3. Numerical Study

3.1. Finite Element Simulation

The commercial finite element software ABAQUS was used to establish an axisymmetric two-dimensional model to simulate the indentation test of spherical indenter [49]. In order to avoid the size effect [54], the sensitivity analysis of the model size (simulated volume) was carried out. When the length and width of the model were less than 10 times and 5 times of the radius (R) of the indenter, respectively, the size effect was obvious (Figure 2) which was consistent with the conclusion obtained by Huang et al. (2019) [49]. Finally, the indentation model size was 150 μm × 100 μm, it should be noted that the same color (green) in Figure 2 means that they are perfectly superimposed.
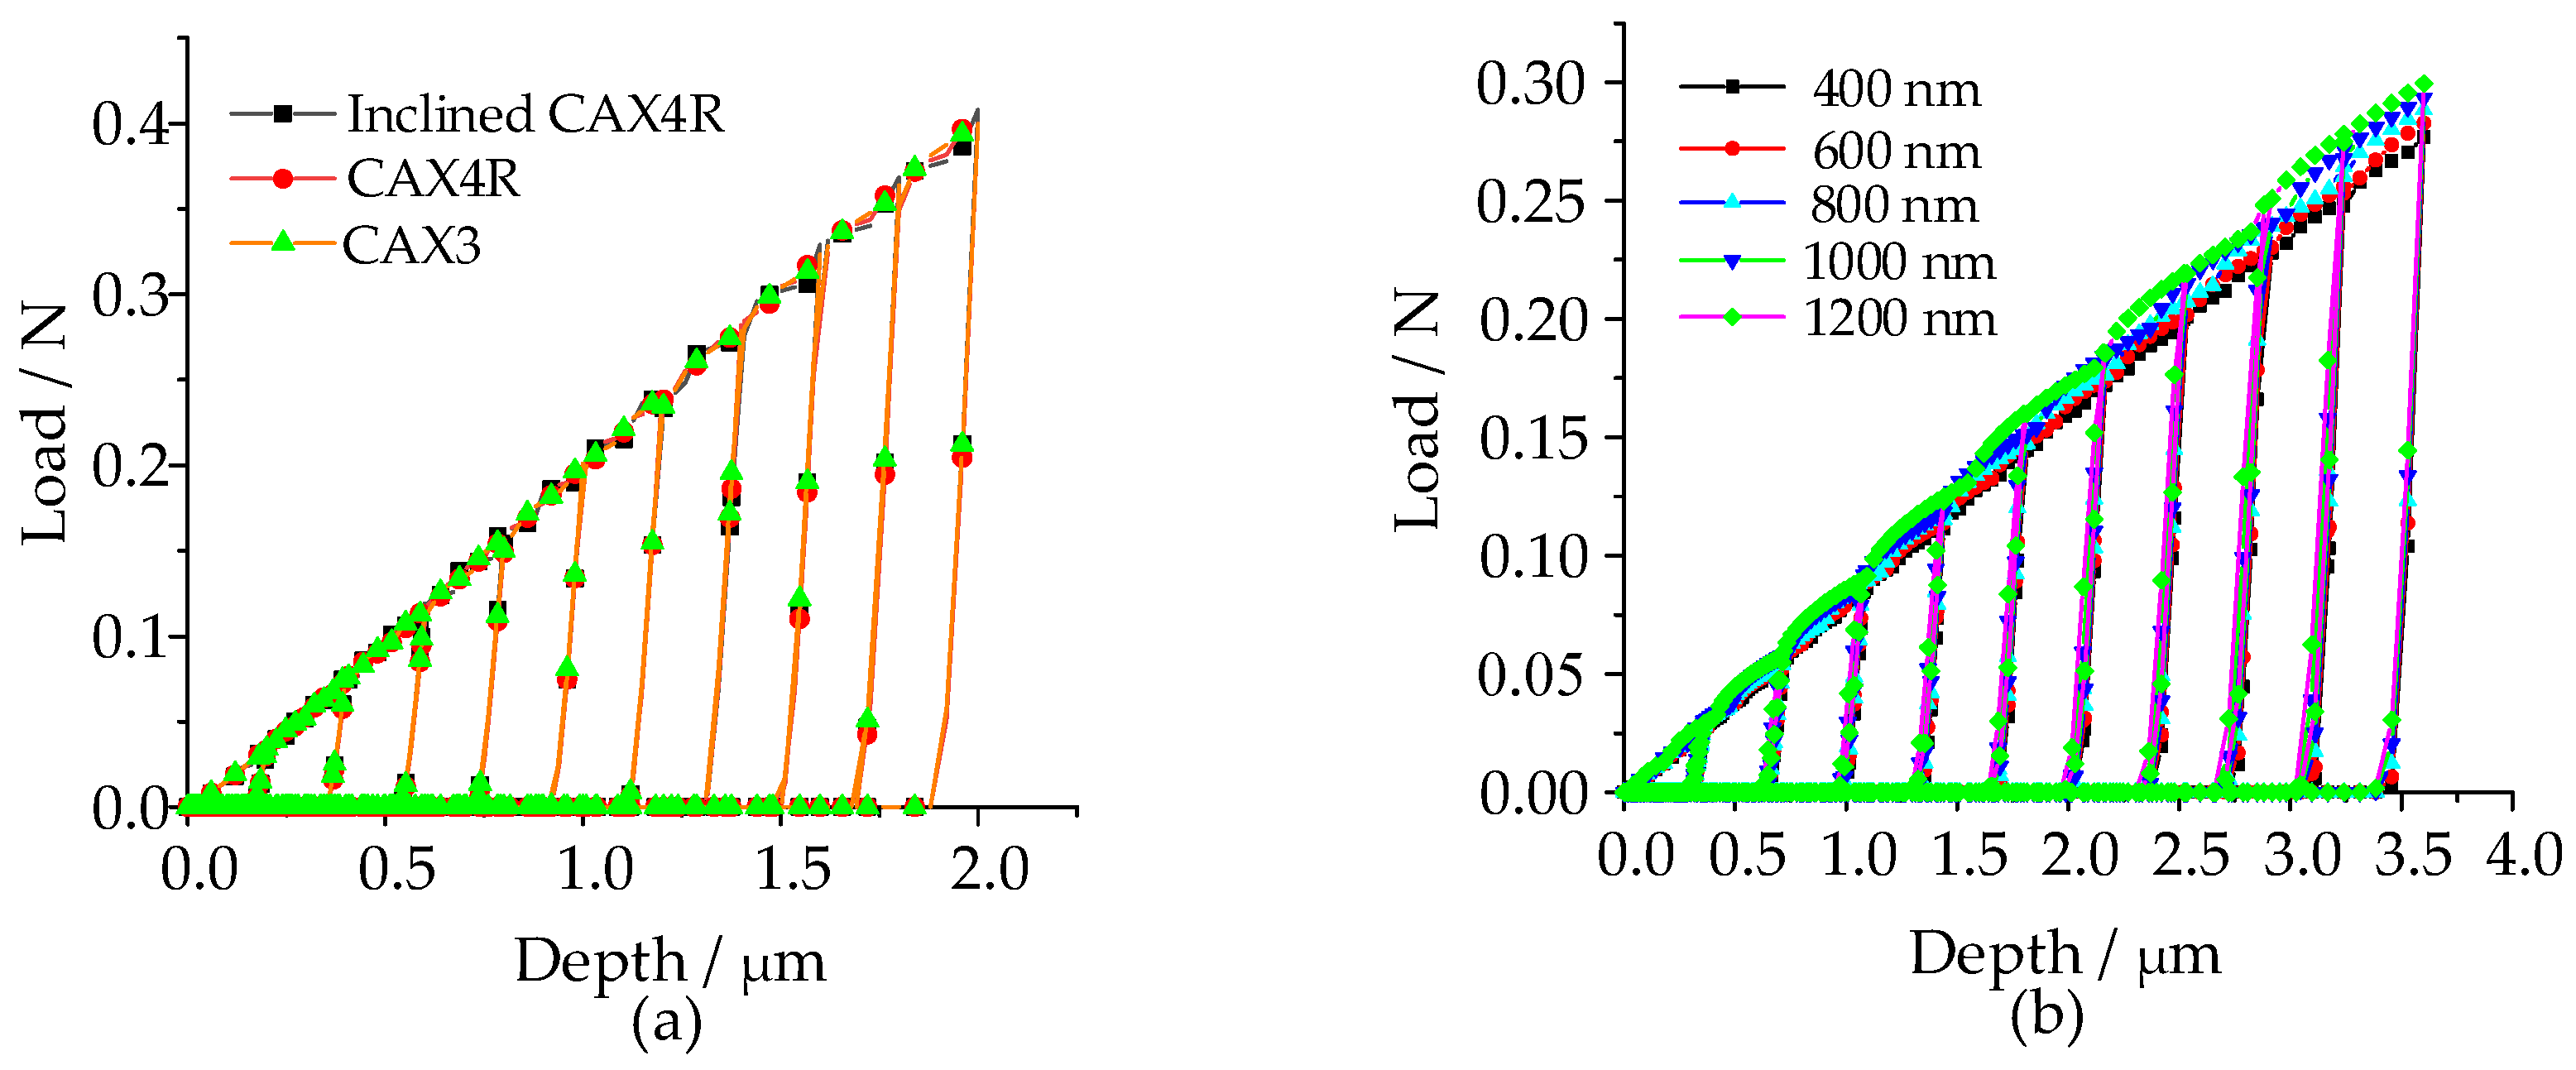
The spherical indenter was defined as an analytical rigid surface with a radius of 20 µm, and three types of elements (Figure 3) [27,37,55], and the size of the element was discussed in detail. The results of the mesh sensitivity analysis showed (Figure 4a) that the load-depth curves obtained by three commonly used mesh types were consistent with each other, among which the 3-node asymmetric linear triangular elements (CAX3) had a fast convergence speed. Hence, asymmetric linear triangular elements of type CAX3 were used to divide samples. Element accuracy not only affects the convergence result, but also affects the load depth curve (Figure 4b). The area contacted with the indenter was divided into finer meshes while other areas were divided into coarser meshes (Figure 5, minimum mesh size: 400 nm, maximum mesh size: 1.2 µm, total mesh number: 11,368, node number: 5841).
A reference point was defined on the indenter, where the displacement loading of 10% (0.1 µm) of the maximum indentation depth in each analysis step was applied. The contact between the indenter and the sample surface was set to face-to-face contact, the friction coefficient was set to 0.1 to reduce the influence [56], and the Poisson’s ratio was fixed to 0.3 [45,49].

3.2. DOE Analysis

DOE analysis was carried out in commercial software ISIGHT to study the influence of material parameters on indentation response. Three material parameters were used as the input variables of the design, and the difference between the “experimental” load-depth curve and the simulated load experiment curve was taken as the response. Latin hypercube design method was used to uniformly sample the design space to evaluate the main effect and interaction effect between material parameters (the Young’s modulus spanning from 100 GPa to 300 GPa, the yield stress spanning from 100 MPa to 550 MPa, the hardening exponent spanning from 0.1 to 0.6). A total of 50 groups of material combinations were evenly obtained in the design space, and 0.1% correction was adopted to replace the wrong points in the middle calculation to recalculate to ensure the number of samples (for more details please see Table A1 in Appendix A).
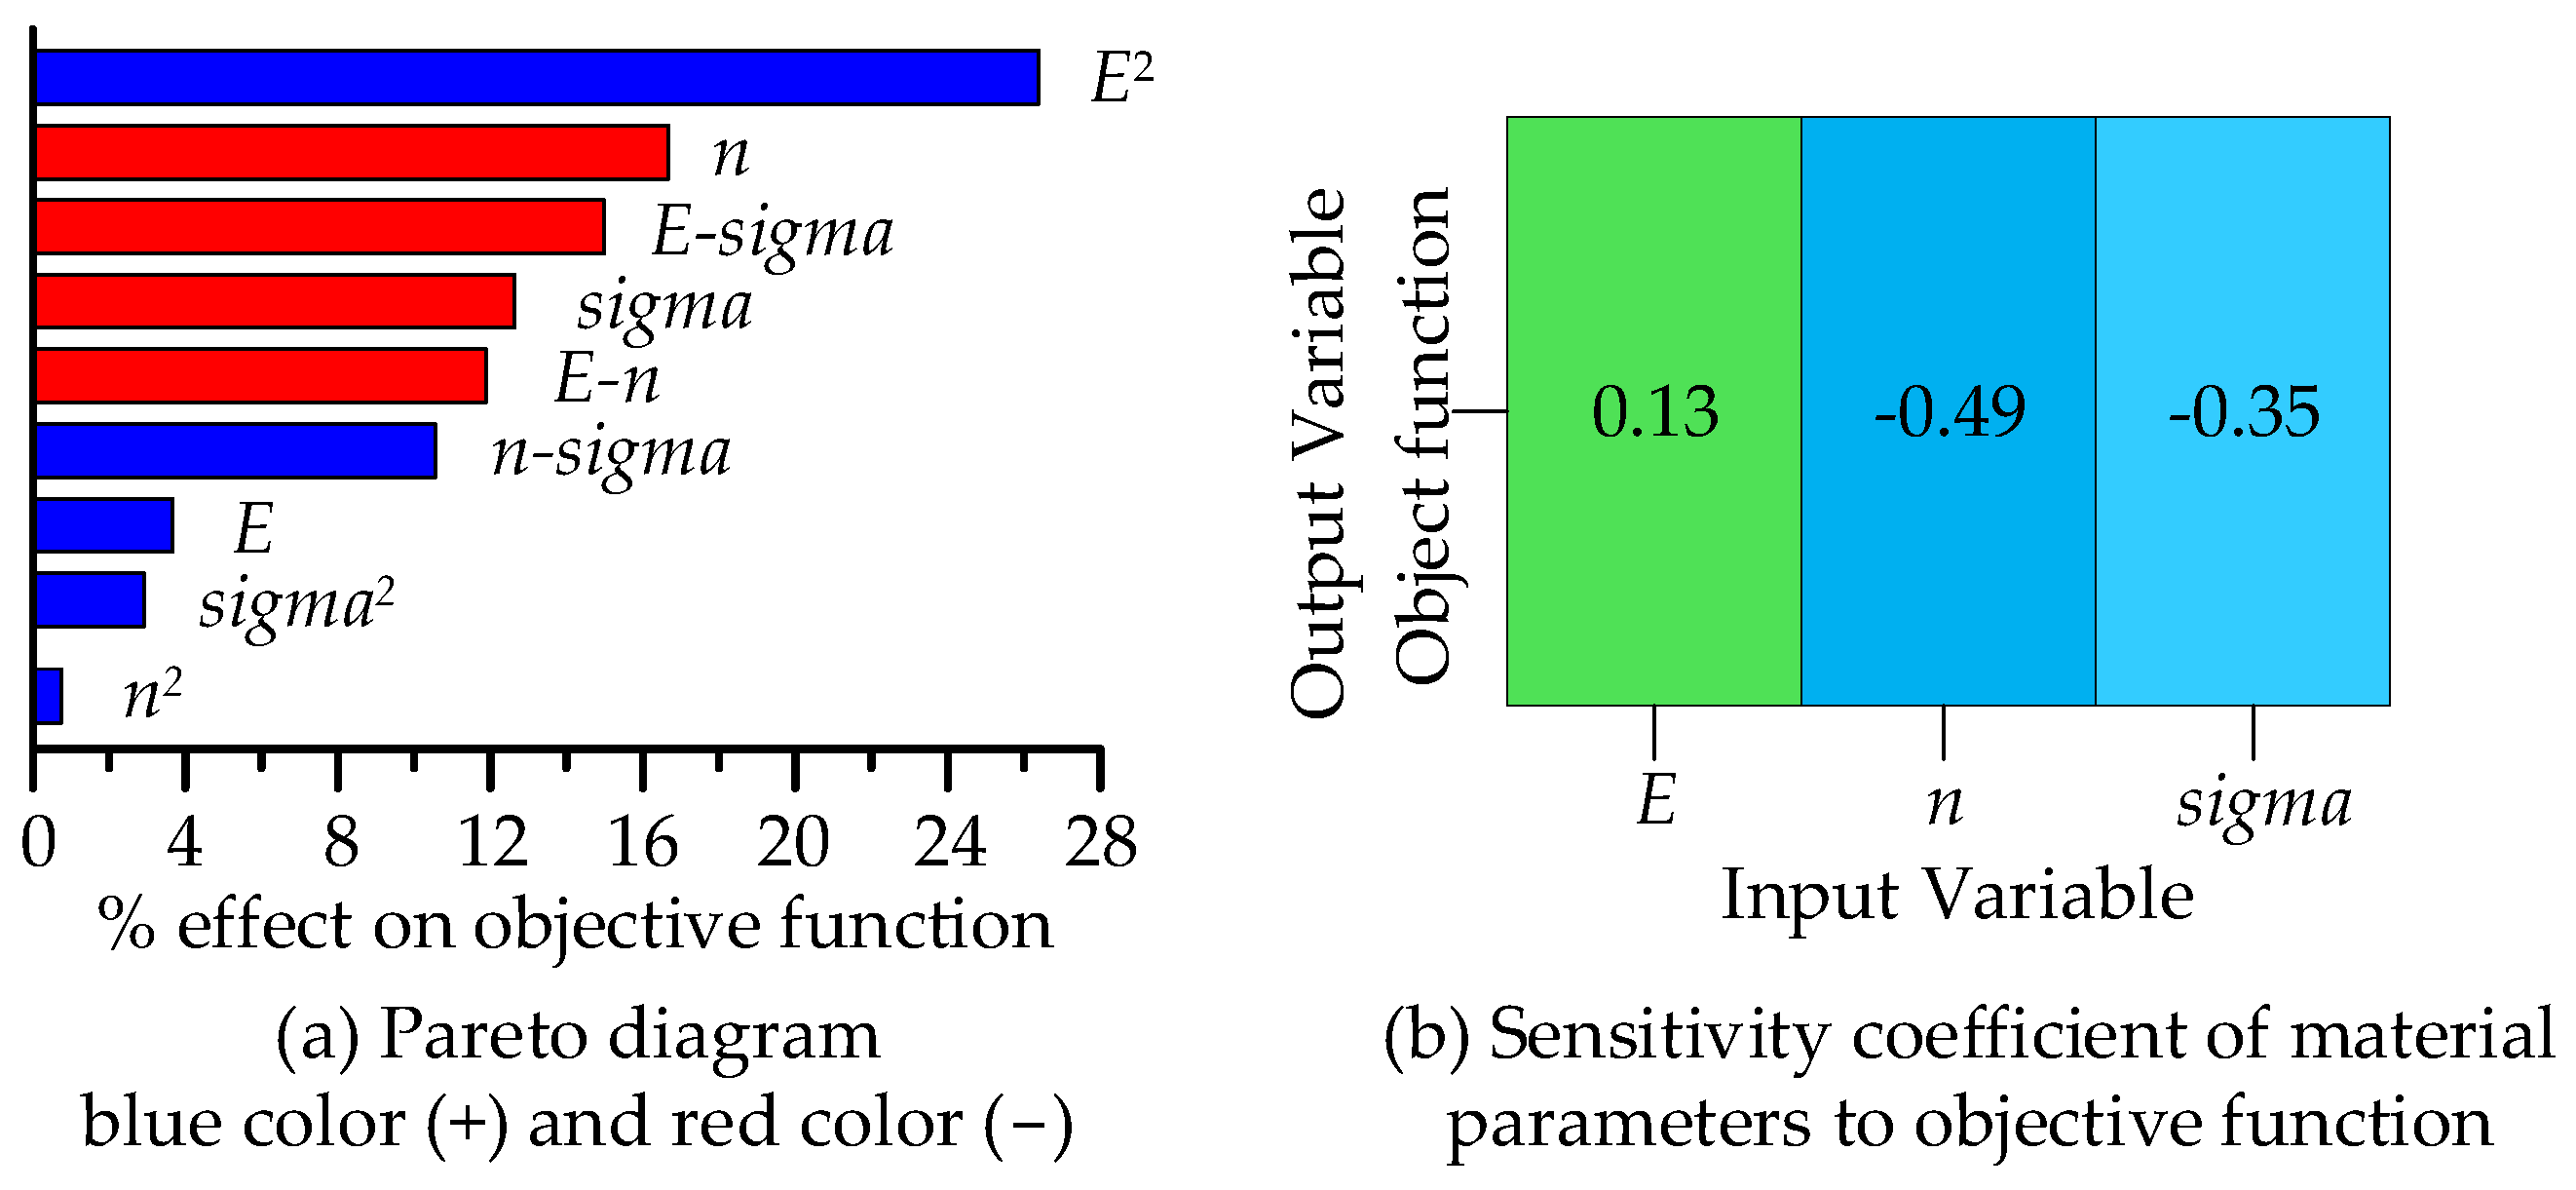
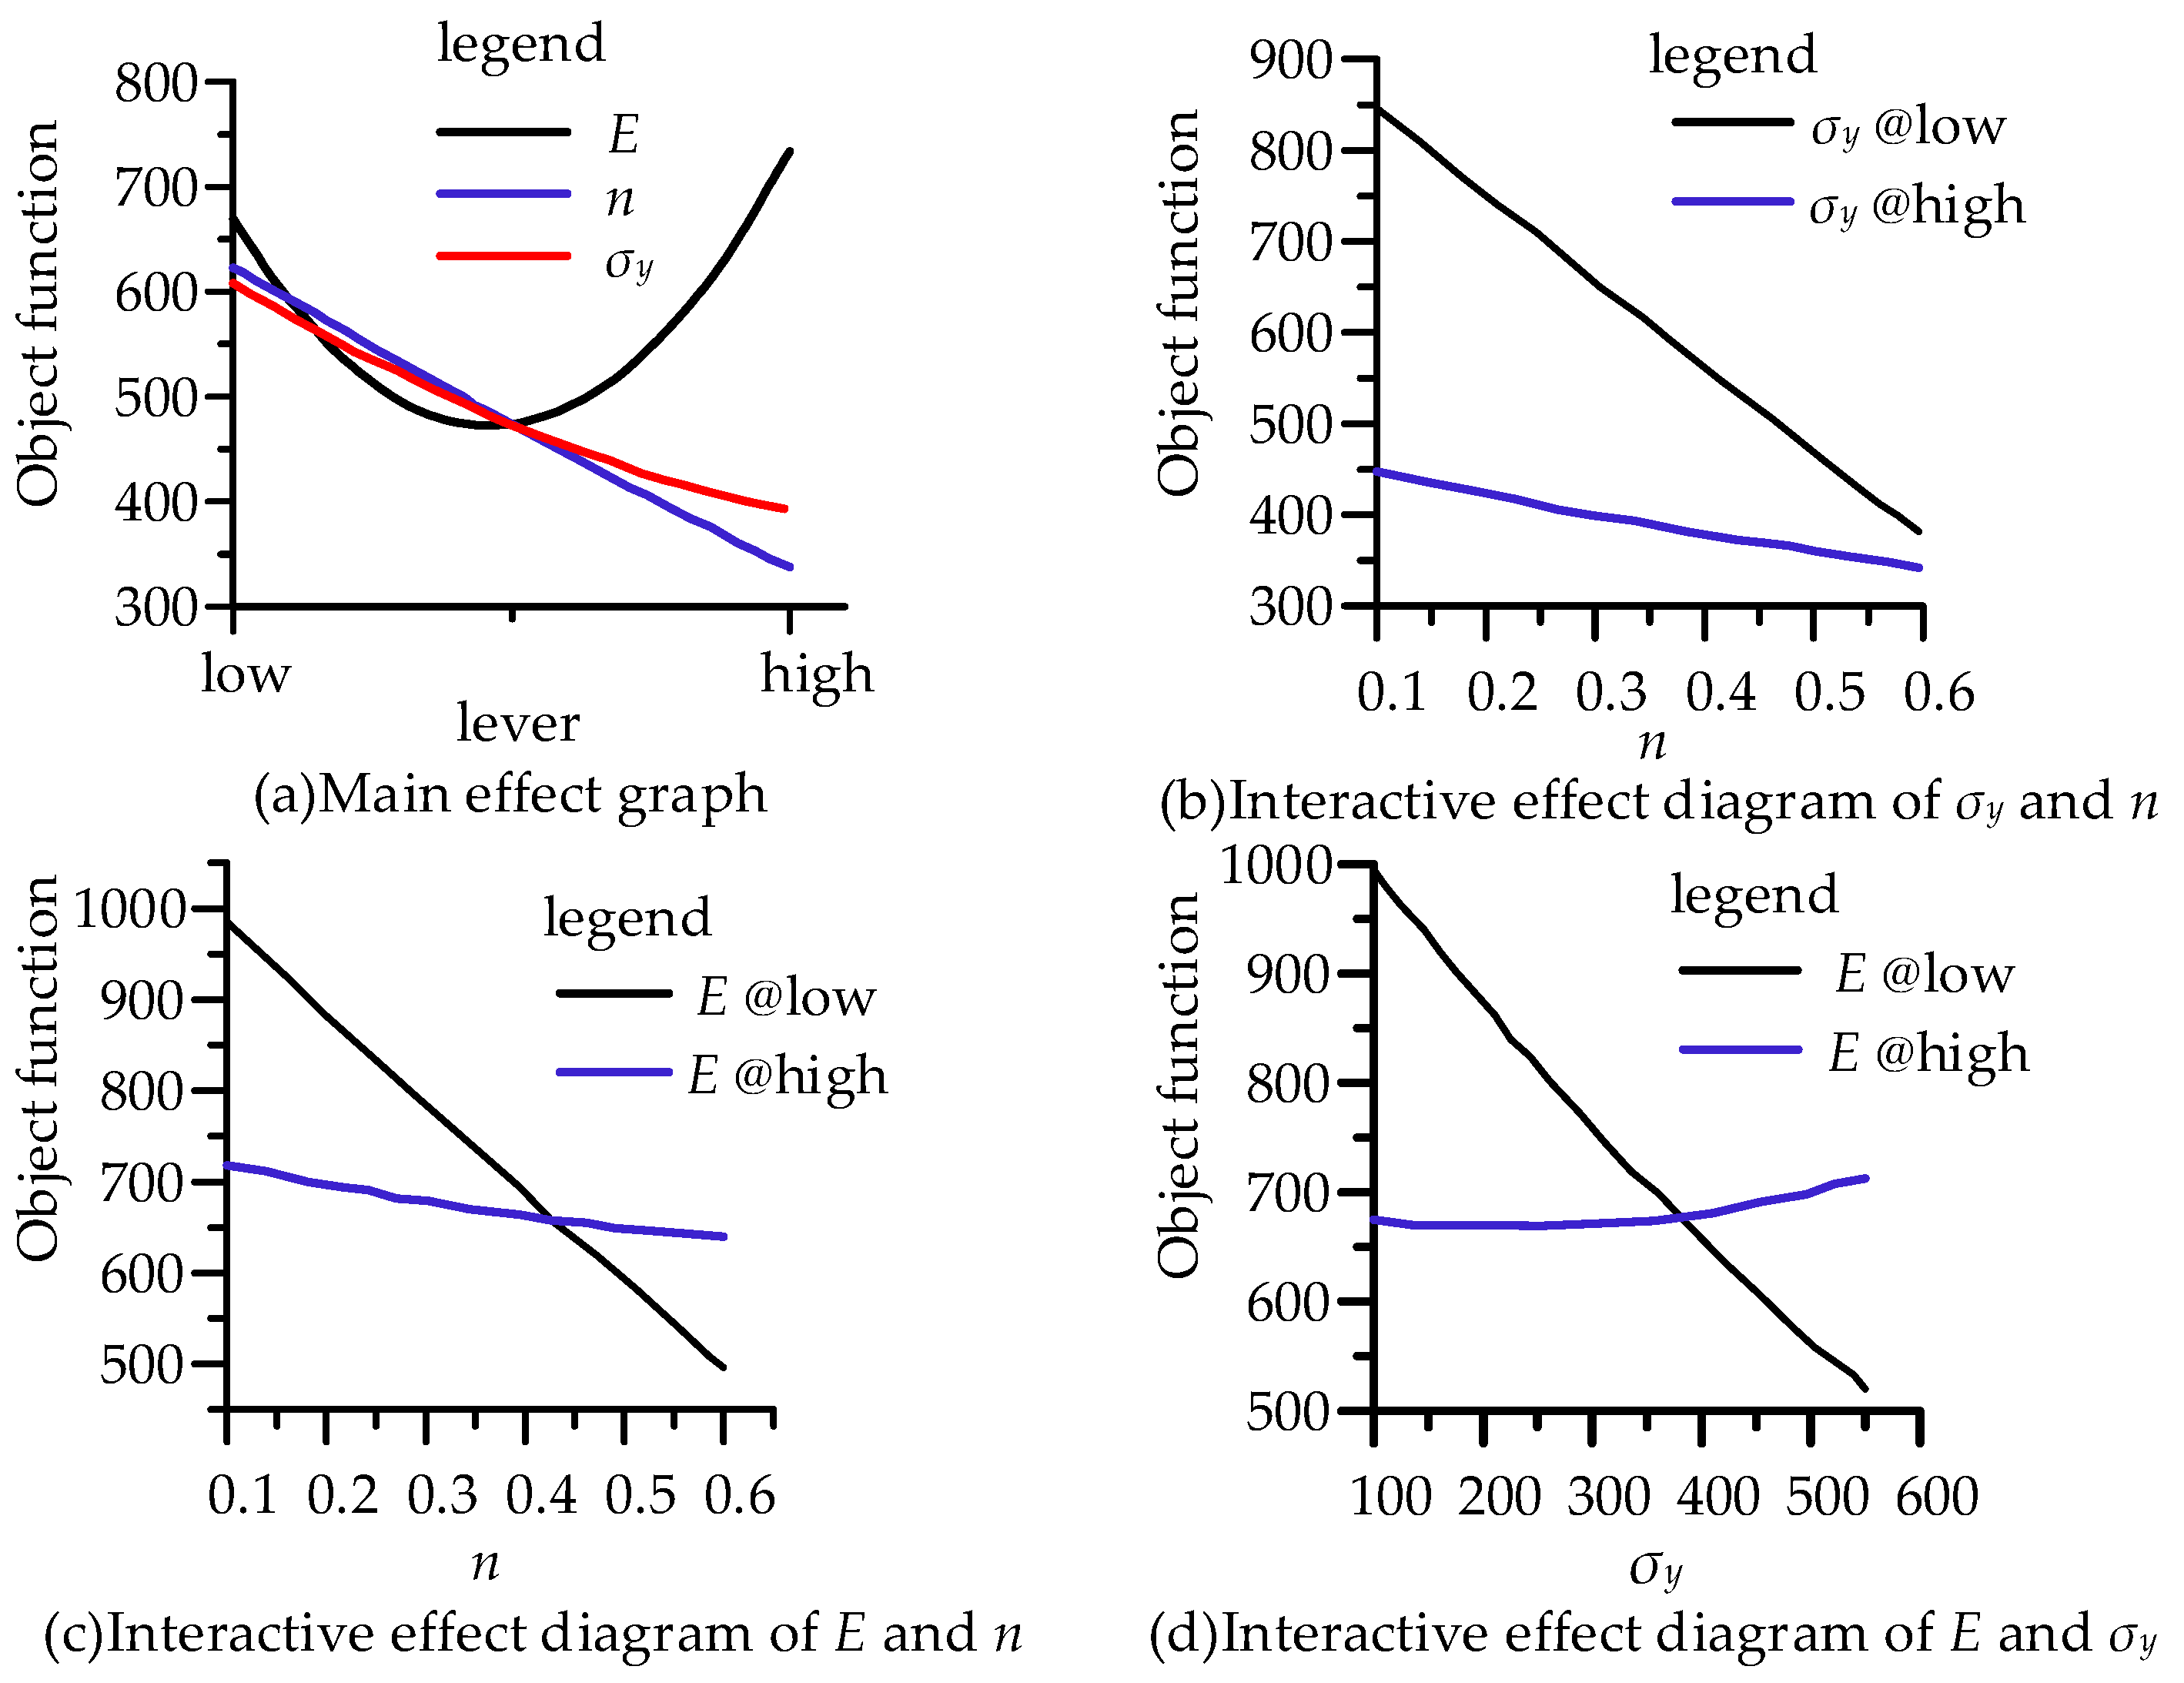
The hardening component and yield stress had a linear negative main effect on the objective function, while Young’s modulus had a second-order main effect on the objective function (Figure 6a). The interaction among the three parameter factors was significant (Figure 6). The interaction between Young’s modulus and the yield stress had the greatest influence on the objective function, while the interaction between the yield stress and the hardening component had the smallest influence. These were also reflected in the Pareto analysis diagram (Figure 7a) by the contribution degree of the main effect and interaction effect to the objective function, in which the blue bar represents the positive effect and the red represents the negative effect. Figure 7a describes the influence of Young’s modulus, yield stress, hardening component, and factor interaction on the response in detail, and Figure 7b gives the global sensitivity coefficients of the three variables to the response, which can specifically show the sensitivity of Young’s modulus, the yield stress, and the hardening index to the response results. Among them, Young’s modulus had a positive effect on the objective function (Figure 7b), but the influence was the smallest (13%). The yield stress and the hardening component had negative effects on the objective function, and the influence of the hardening component (49%) was greater than that of the yield stress (35%).

3.3. Study of the Uniqueness of the Solution
Most researchers have used the maximum indentation depth spanning from 0.1 R to 0.3 R to study the elastic–plastic properties of materials. In fact, the indentation depth of a spherical indenter at 0.2 R can effectively identify the plastic characteristics of materials [56]. However, in the shallow indentation test of a spherical indenter (hmax ≤ 0.06 R), different materials would produce the same load-depth curve [57], which means that the different indentation depths may also bring multi-solution problems. Hence, the uniqueness of the solution of mechanical property parameters with the inverse solution strategy was analyzed under different maximum indentation depths.
The material parameters of Al5083 in the literature (E: 80 GPa, σy: 140 MPa, n: 0.21) [58] were given to the finite element model, and four different maximum indentation depths were applied, respectively: hmax1 = 1200 nm (0.06 R), hmax2 = 2000 nm (0.1 R), hmax3 = 4000 nm (0.2 R), hmax4 = 6000 nm (0.3 R). Finally, four load-depth curves of cyclic loading at different maximum indentation depths were obtained, which were taken as the test target curves. Three groups of different initial values (E0, n0, σy0) in the same domain of interest were set to identify the material parameters (Table 1) and the optimized results were compared with the experimental values to study the uniqueness of the solution.
Figure 6. Main effect graph and interactive effect diagram.
Micromachines 14 01051 g006
Figure 7. Pareto diagram (a) and global sensitivity analysis (b).
Micromachines 14 01051 g007
Table 1. Initial value and domain of interest.
E0 (GPa)n0σy0 (MPa)
T1500.280
T2900.5120
T31200.8200
Boundaries20 < E < 1500.01 < n < 130 < σy < 600
The optimization results are summarized in Table 2. In the optimization process, three parameters were changed simultaneously to obtain the optimal solution to match the target curve. Various ranges of initial values were used to exploring the uniqueness of solutions. In the solution results of three maximum indentation depths (0.06 R, 0.1 R, 0.2 R), the three material parameters optimized with different initial values were basically consistent with the real target values, and the relative error was less than 0.2%. When the maximum indentation depth increased to 6 µm (0.3 R), only the T1 group could finish the optimization normally, and the other two groups could not finish the optimization to the non-convergence of finite element calculation in the iterations, and the final parameter optimization error was less than 1.5%. Compared with other indentation depths, the error of optimized values at this indentation depth increased. With the increase in the maximum indentation depth, the finite element model needed a more precise mesh to achieve convergence; otherwise, the finite element mesh with a high degree of dispersion will have a larger error on the load-depth curve, which will lead to an increase in the error of the parameters.
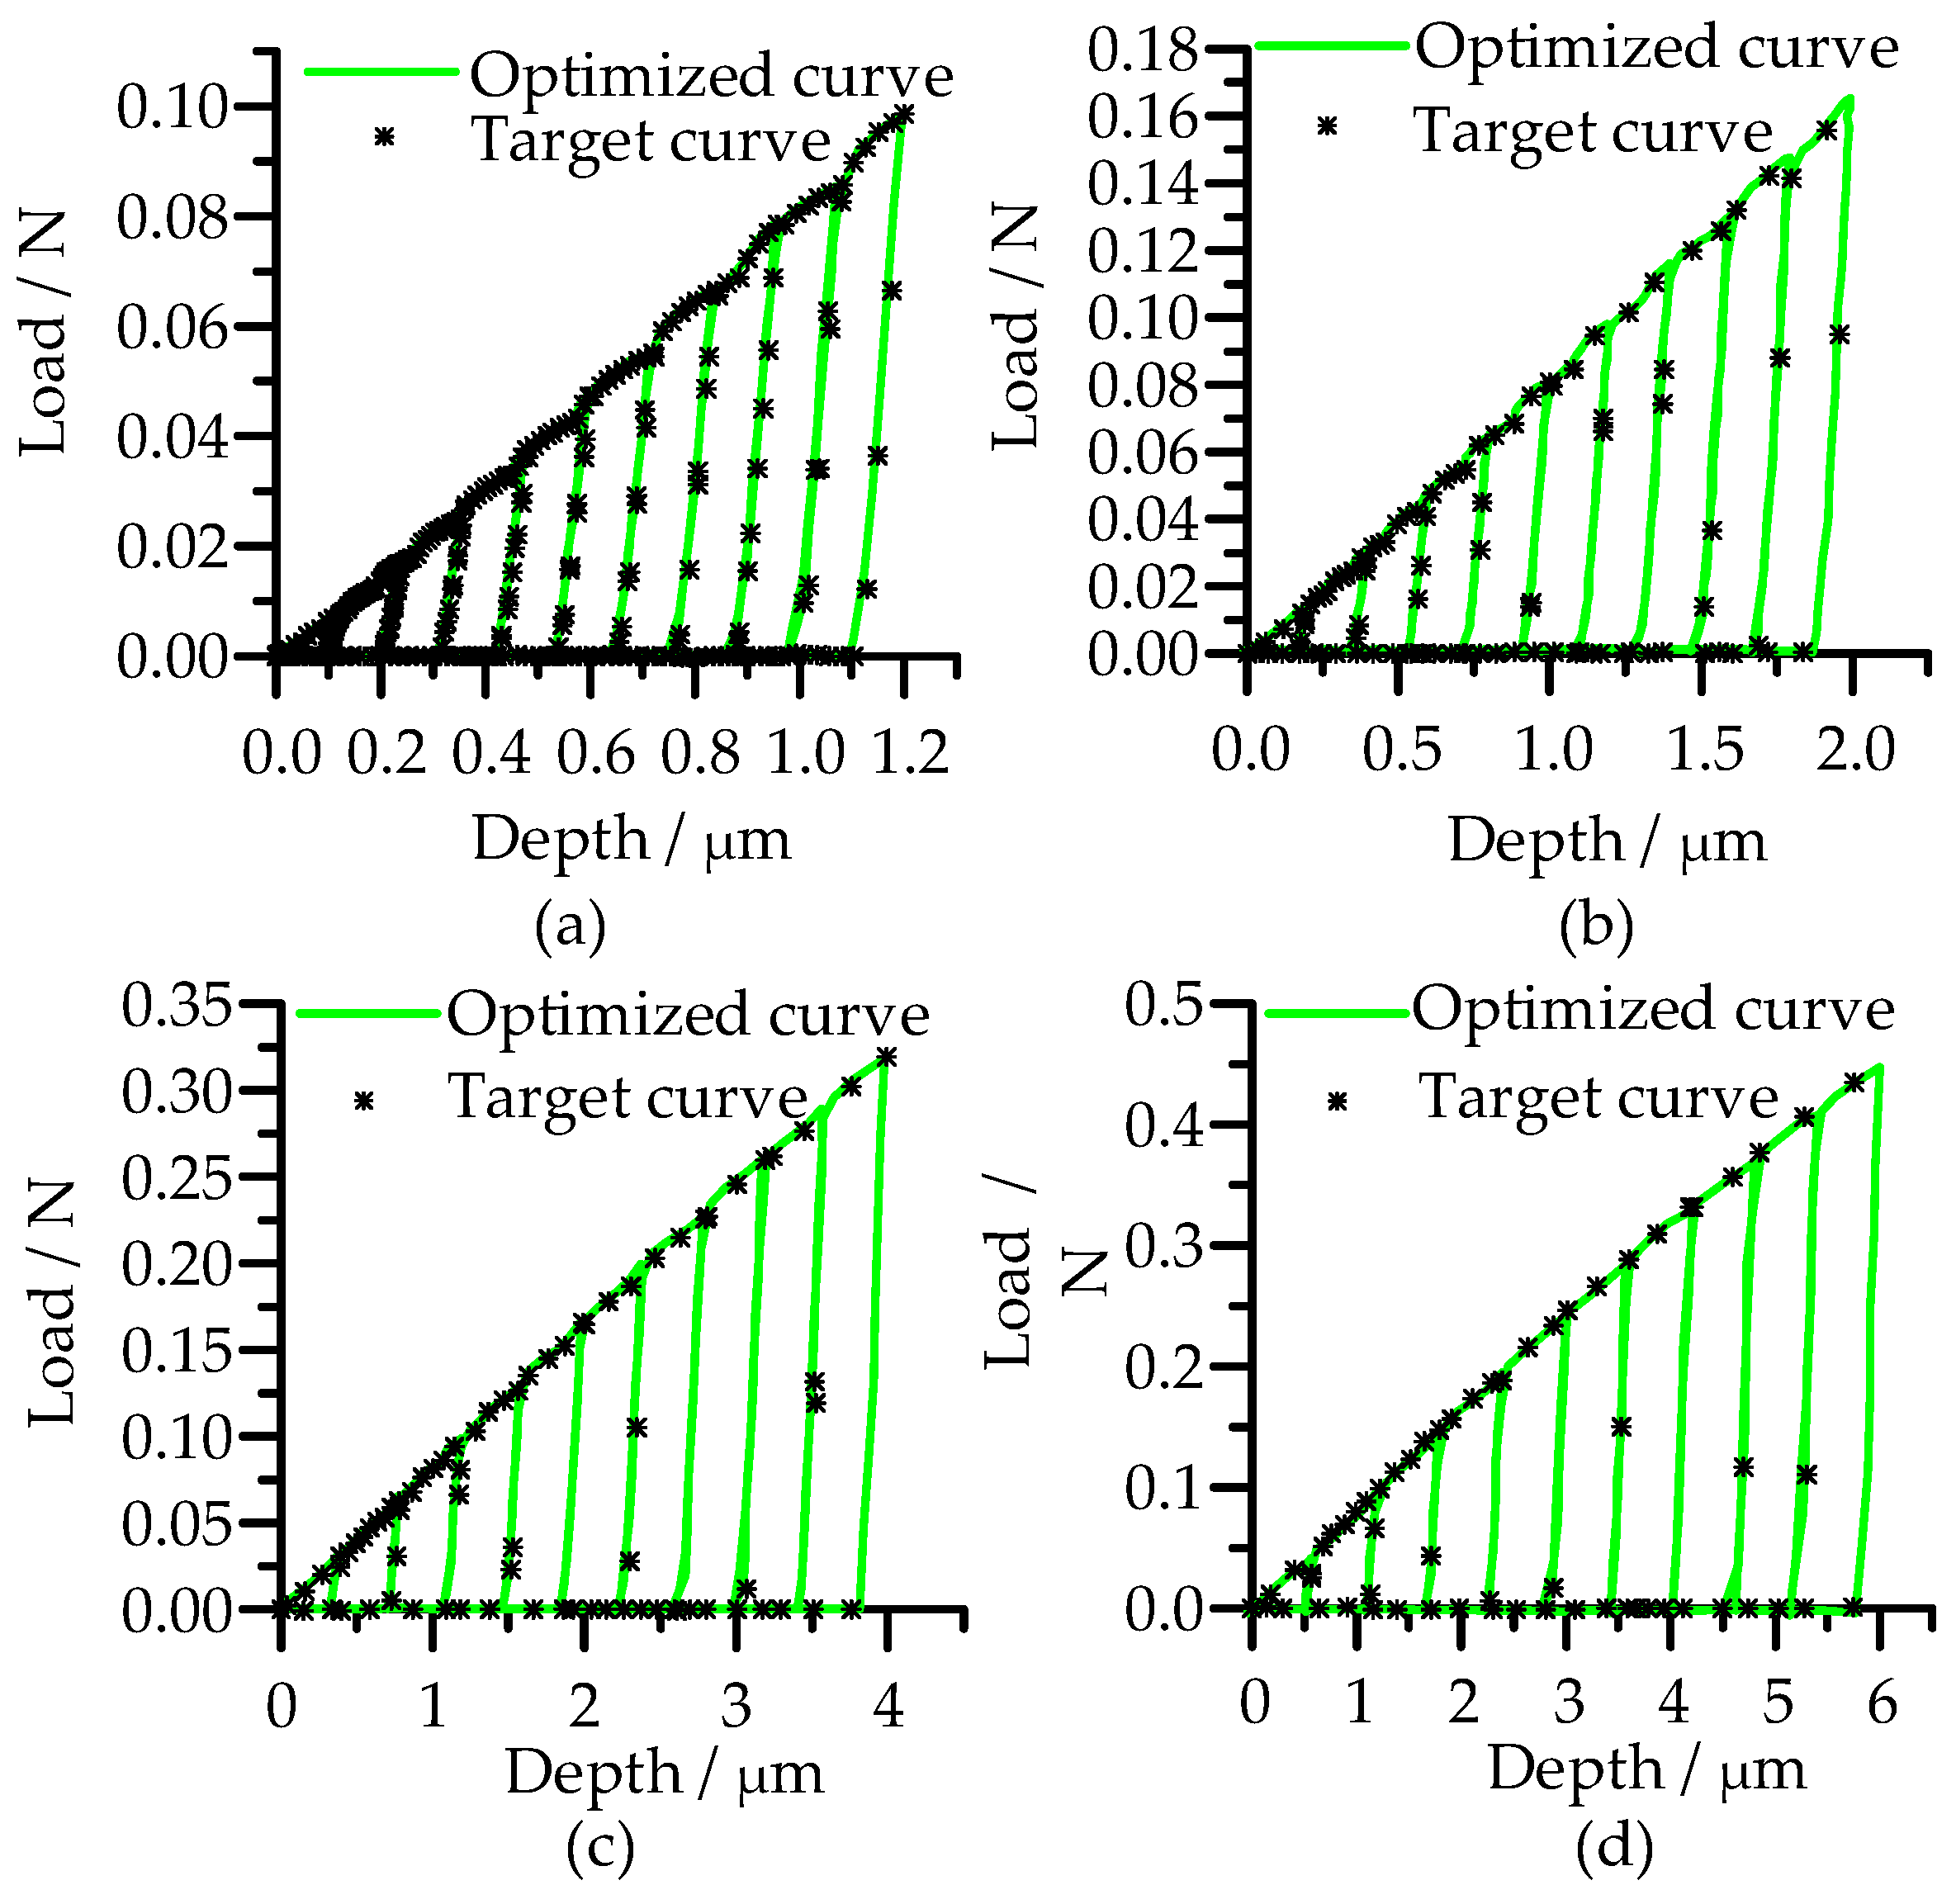
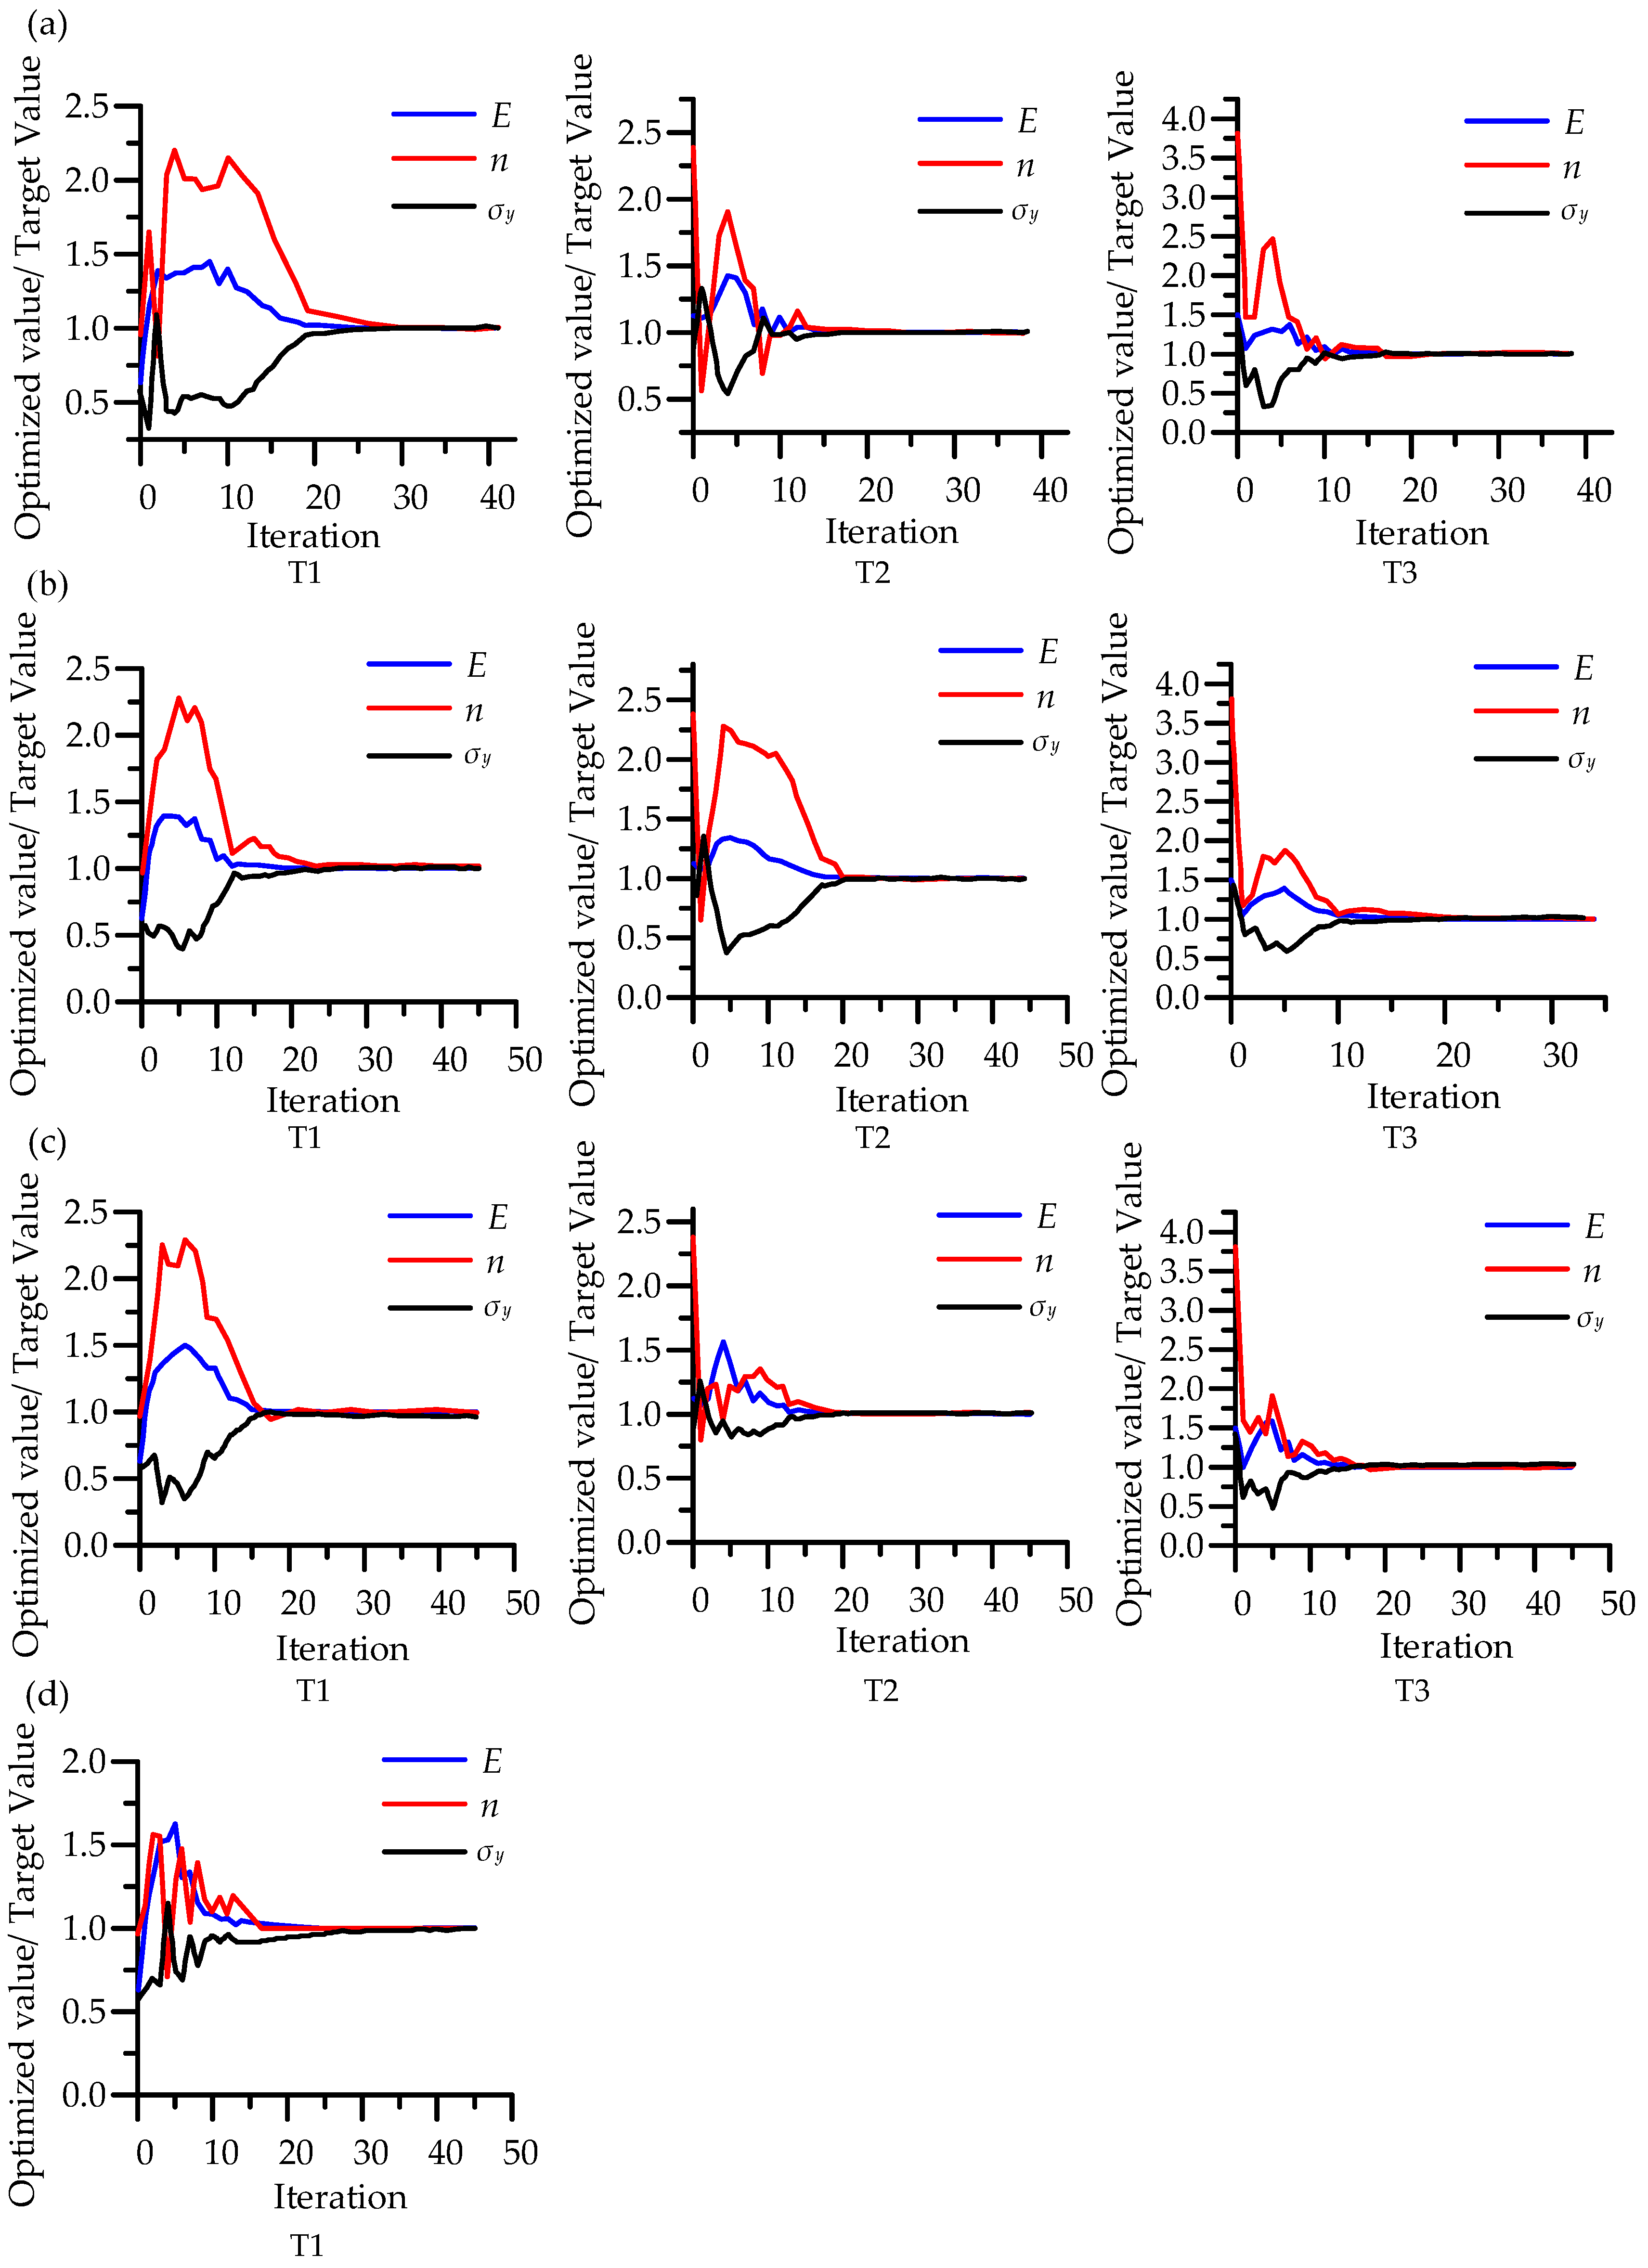
When different initial values were used, the number of parameter iterations would be slightly different, and the closer the initial value was to the target value, the less the number of iterations would be in optimization. In any case, the optimized load-depth curves at different maximum indentation depths all matched well with the target curves (Figure 8). With the increase in indentation depth, the number of iterations of parameter optimization convergence increase, but they all converge on the target value at last (Figure 9).

4. Experimental Validation

4.1. Sample Preparation

Q355 steel was used for the experiment to verify the optimization method. The steel plate was processed into a 10 mm × 10 mm × 3 mm nanoindentation prefabricated sample by wire cutting, which was enough to ensure the spacing of indentation points (the spacing distance was 100 µm). The tensile specimens were obtained using wire cutting from the same plate. The samples were processed in three directions to eliminate the influence of material anisotropy. After the prefabricated sample was cleaned by ultrasonic wave, the nanoindentation sample was obtained by thermal inlay with epoxy resin. The sample was ground with P80, P1000, and P2000 sandpaper in turn, and then the surface was polished to be smooth and scratch-free using a 3 µm, 1 µm, and 0.05 µm polishing flannel with the corresponding suspension.

4.2. Mechanical Test

The micro-nanoindentation test was carried out by using a NHT3 indenter (Anton Paar, Switzerland and Austria) and a diamond spherical indenter with a radius of 20 μm, the maximum indentation load of which can reach up to 500 mN. Considering the load range and proper indentation depth of the instrument, the maximum indentation depth of Q355 was 2 µm (0.1 R). A cyclic loading experiment was carried out on a nanoindentation specimen, and six load-depth curves of the Q355 indentation test were obtained. In the experiment, the displacement loading mode was adopted. The experiment was carried out by loading and unloading at a constant rate of 1.2 µm/min to the maximum indentation depth. The sampling frequency was set to 100 Hz to record the time history of load and depth, and finally the load-depth curve was output.
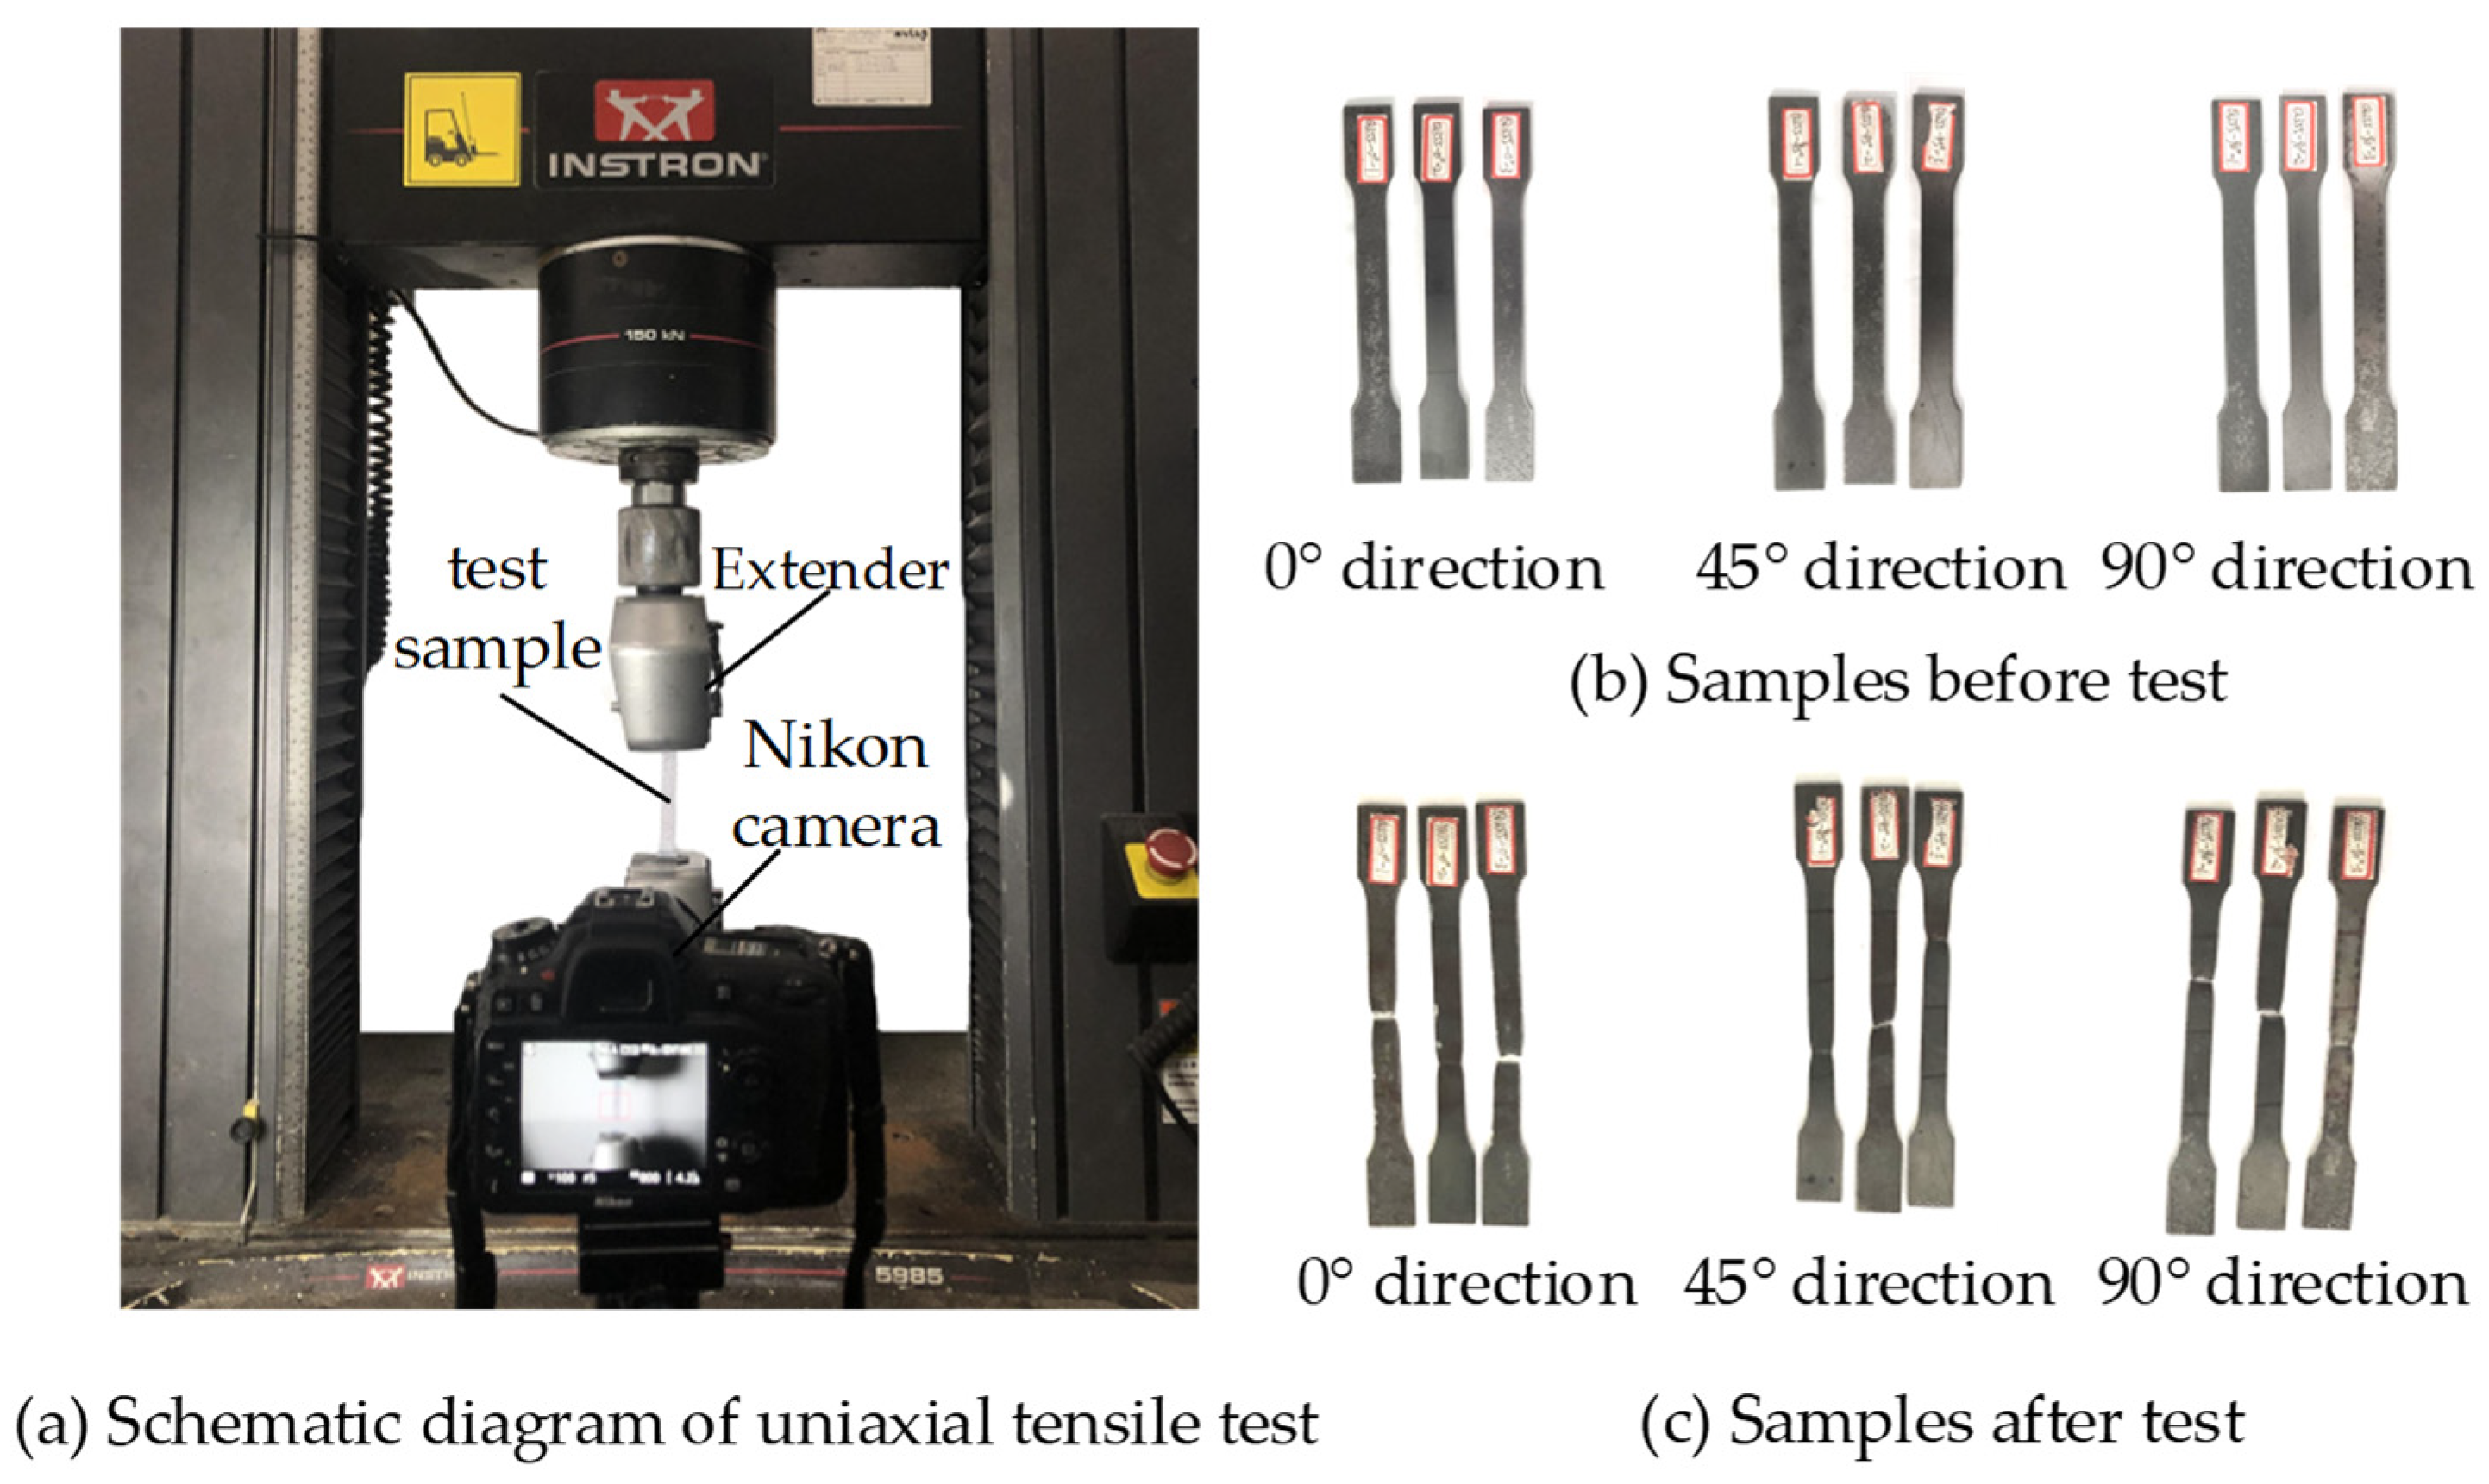
The INSTRON5985 tensile testing machine and VIC-2D (CSI, USA) strain measurement system were used for the tensile test (Figure 10). Before the test, the VIC system was calibrated to ensure that the Nikon D7100 camera had high accuracy (the deviation was less than 0.3 pixels and the size deviation was less than 0.03 mm). The sampling frequency of the camera was set to 1 frame/4 s. The test was carried out at room temperature (temperature 25 °C, humidity 33%), and the displacement loading control mode was adopted. The loading rate was 2 mm/min, and the strain rate was within 0.01/s until the specimen was pulled off. The samples before and after the experiment are showed as Figure 10.

4.3. Comparations and Results

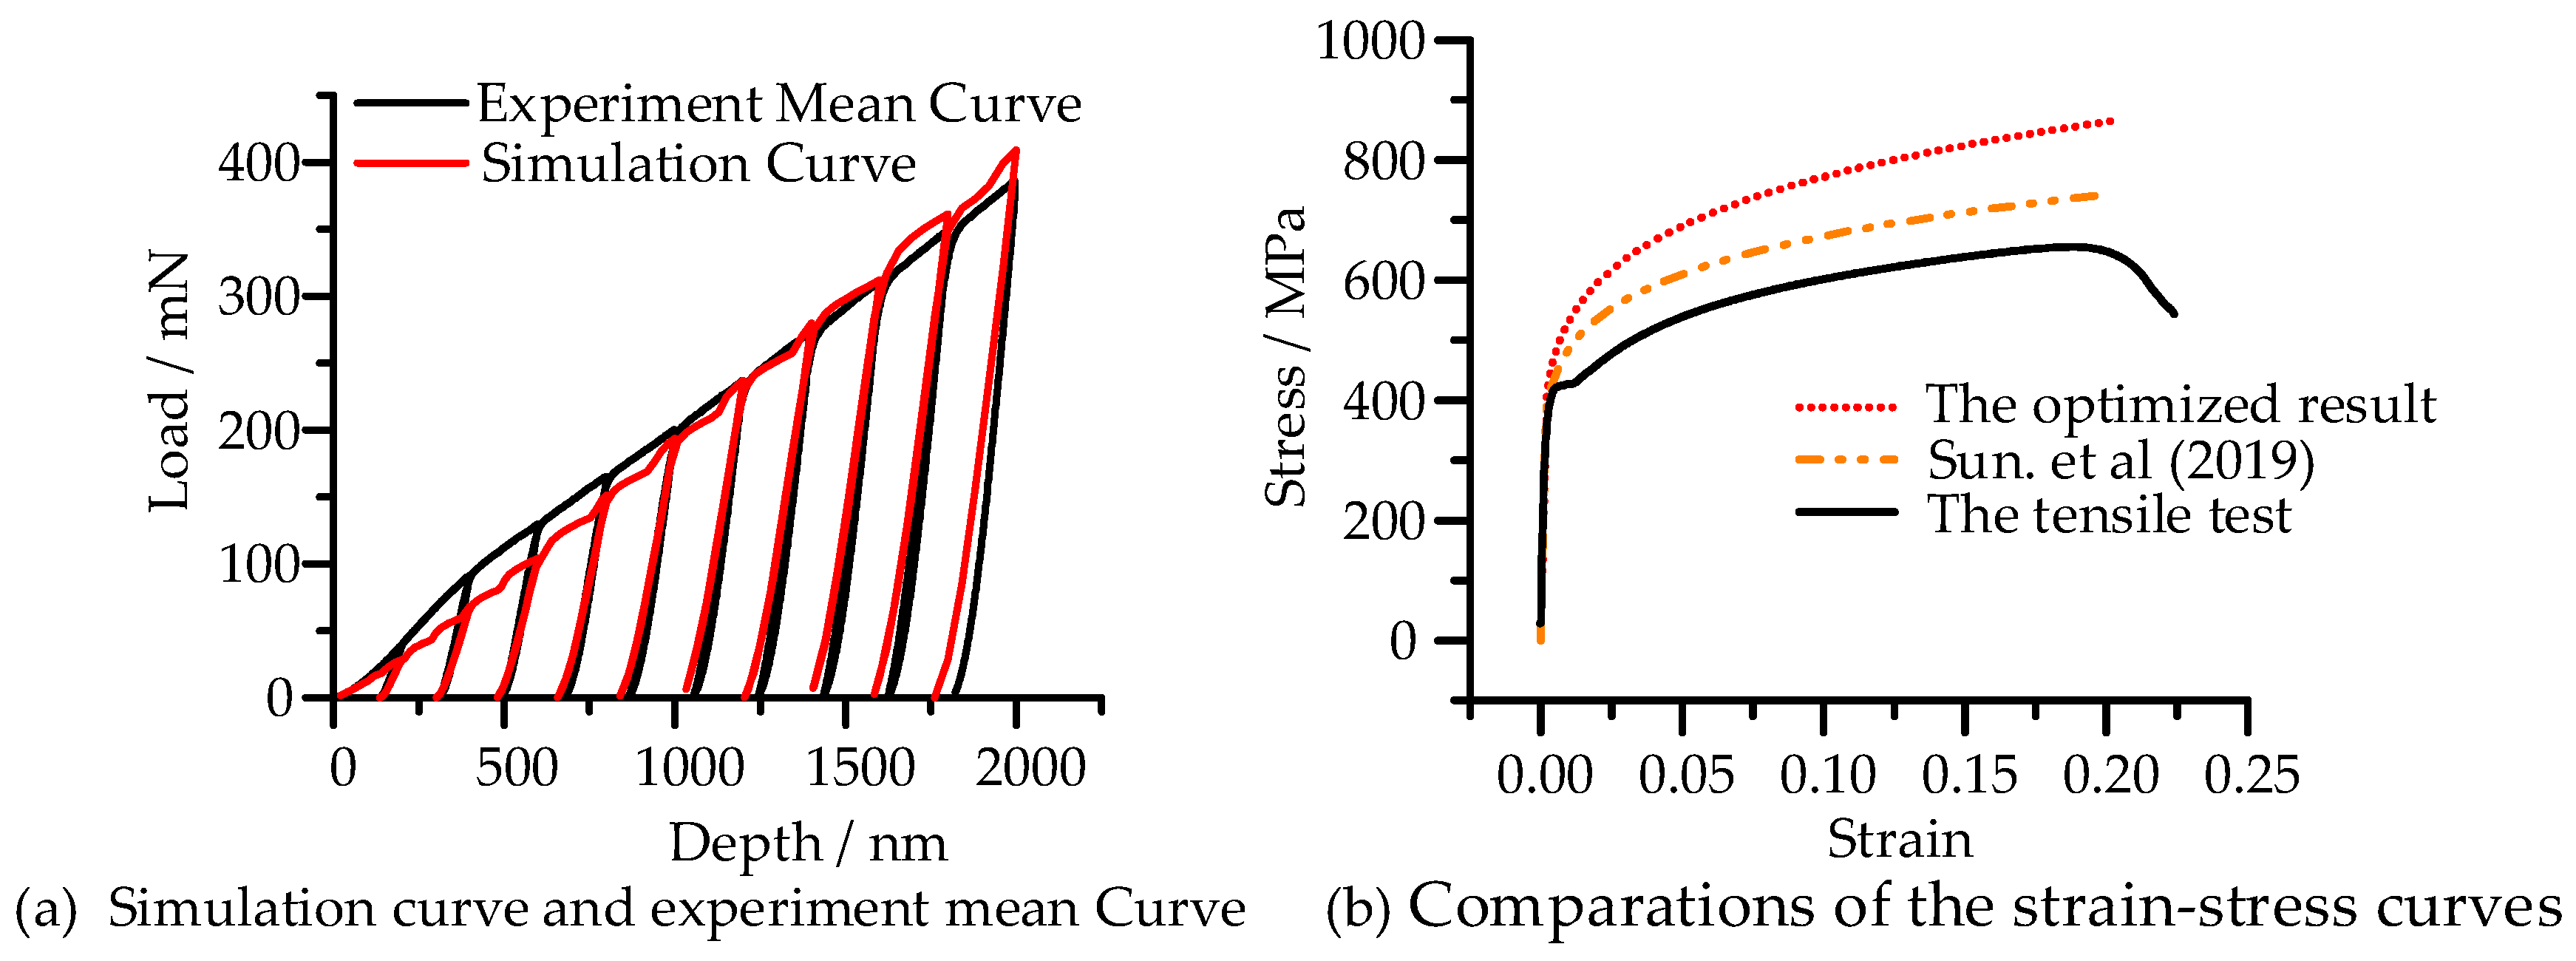
Figure 11a shows the residual morphology characteristics of six spherical indentation tests, and the load-depth curves of six indentation tests had high consistency and repeatability (Figure 11b). The mean curve of six load-depth curves was obtained through normalization solution, which was used as the target curve for solution (Figure 11b) The initial values and the lower and upper boundaries of the design variables in the optimization process and the optimized value are shown in Table 3. From the results of the benchmark curve (Figure 12a), the simulation curve basically matches the experimental curve well into the loading stage. However, in the unloading section, the simulation curve was steeper than the experimental curve, which reflected that the elastic modulus calculated by simulation was slightly smaller than the value measured by experiment. The hardening exponent was close to the result of Sun et al. (n = 0.142) (2019) [4] and the yield stress was larger than their research result (σy = 381 MPa), which was basically consistent with the results obtained by Li et al. (2020) [59] by cyclic loading indentation test with a spherical indenter (R = 500 µm, σy = 424 MPa) and slightly larger than the yield stress obtained by the compression test (σy = 392 MPa). From the comparations of the stress–strain curve in Figure 12b, it shows that the stress–strain curve of tensile experiment was lower than that of the indentation experiment in the study of Sun et al. (2019), and the stress–strain curve obtained in this study was higher than both of them [4].
Figure 10. Schematic diagram of tensile test.
Micromachines 14 01051 g010

5. Discussion

In this study, the feasibility of the proposed optimization reverse algorithm was verified by numerical simulation and experiment. In the solution of numerical simulation, the optimized load-depth curve under each maximum indentation depth was in good agreement with the “simulation” test curve, and the solution relative error of the three material parameters was controlled within 0.01%, which was much higher than the parameter accuracy obtained by Collin et al. (2008) using the reverse method based on the spherical indentation load curve (the relative error is 9% on σy, 21% on K and 3% on m) [45]. However, when applied to the real test load curve, although the real test load curve basically coincided with the curve calculated by optimization, and the obtained parameters were basically consistent with those in the literature, we found that the stress–strain curve fitted by optimization was obviously different from that obtained by tensile test, which may be caused by different test methods.
The difference between simulated load-depth curve and experimental curve may affect the result of the identification algorithm. There is a difference between the real cyclic loading–unloading curve and the simulation test curve; in particular, in the unloading section, the real pressure-head shape may affect the unloading curve, which could influence the Young’s modulus [45]. In addition, the effect of cyclic loading strengthens the hardening characteristics of the material, which can effectively reflect the plasticity and hardening characteristics of the material. Based on the parameters in the literature (E: 210 GPa, n: 0.14, σy: 381 MPa), the finite element simulation of steel was carried out to study the influence of the reduction in cyclic loading times on parameter identification (for more details please see Table A2 and Figure A1 in Appendix B). The results showed that the higher the number of cyclic loading and unloading, the higher the accuracy of the sigma and hardening exponent; however, with the increase in cyclic loading and unloading times, the error of Young’s modulus may be accumulated and superimposed.
The sensitivity of material parameters to objective function may also affect the identification results. In the DOE analysis, the sensitivity of the elastic modulus to objective function was the lowest (negative effect), and the interactions between the elastic modulus and hardening exponent, Young’s modulus, and yield stress were the most obvious (positive effect). The relationship among the three parameters was complex and highly coupled, which made it difficult to judge how much the elastic modulus was helpful in solving the objective function, which may cause the influence of the elastic modulus to be offset when solving the objective function based on the experimental curve.

6. Conclusions

In this study, a new inverse method of elastic–plastic parameters based on the load curve of a spherical indenter was proposed. The results of the numerical analysis showed that the proposed recognition algorithm could obtain high-precision solutions (0.2%) at different pressing depths. At the same time, the results of the DOE analysis showed that there was a high coupling relationship among the three parameters. The elastic modulus has the least influence on the objective function with a second-order nonlinear relationship. In the reverse verification of our experiment, the elastic modulus is smaller than that of the tensile test, but the obtained three parameters are still acceptable compared with the literature, which indicates that the results based on the proposed algorithm are reliable.

Author Contributions

Conceptualization, L.Z.; methodology, Z.L. and G.Z.; Software, J.L.; validation, J.L.; formal analysis, G.Z., F.G., J.L. and J.Z.; investigation, Y.Y., P.W. and J.Z.; resources, F.G., P.W., J.Z. and L.Z.; data curation, Y.Y.; writing—original draft, Z.L.; writing—review & editing, Z.L., Y.Y. and G.Z.; project administration, G.Z. and L.Z.; funding acquisition, Y.Y., G.Z., F.G. and L.Z. All authors have read and agreed to the published version of the manuscript.

Funding

This research was funded by the Natural Science Foundation of Hunan Province (2019JJ50721 FG and 2019JJ40034 GZ) and the Guangdong science and technology program (2020B1212060049).

Data Availability Statement

Data available on request due to restrictions eg privacy or ethical. The data presented in this study are available on request from the corresponding author. The data are not publicly available due to confidentiality of institutional data.

Acknowledgments

We thank everyone for the contribution of the research. Special thanks to Huiqin Chen from College of Mechanical Engineering and Hangzhou Dianzi University for her contribution to the research, and also to National Engineering Laboratory of Modern Materials Surface Engineering Technology and Guangdong Provincial Key Laboratory of Modern Surface for its support to the research.

Conflicts of Interest

The authors declare no conflict of interest.

Appendix A. Latin Hypercube Design Matrix of Material Parameters

Table A1. Latin hypercube sampling design matrix of three material parameters used for DOE analysis in Section 3.2, DOE analysis.
NumberE (MPa)nσy (MPa)NumberE (MPa)nσy (MPa)
1294,081.6330.294292.86026146,122.4490.518155.100
2199,387.7550.437467.35027163,877.5510.304504.080
3234,897.9590.386338.7802821,836.7350.447366.330
4175,714.2860.508338.7802998,775.5100.457274.490
5205,306.1220.222100.0003057,346.9390.549145.920
681,020.4080.355550.00031157,959.1840.171320.410
763,265.3060.314302.04032104,693.8780.243412.240
8217,142.8570.253403.0603310,000.0000.202357.140
9122,448.9800.600265.31034163,877.5510.365109.180
10193,469.3880.416228.5703592,857.1430.559393.880
11252,653.0610.141311.2203669,183.6730.151246.940
12128,367.3470.284201.0203733,673.4690.569283.670
1345,510.2040.488494.90038110,612.2450.161118.370
14187,551.0200.590458.16039264,489.7960.529522.450
1515,918.3670.427210.20040181,632.6530.120191.840
16288,163.2650.467256.12041223,061.2240.580219.390
1758,571.4290.539375.5104239,591.8370.273173.470
1827,755.1020.324439.8004351,428.5710.192513.270
19228,979.5920.110448.9804475,102.0410.100384.690
20270,408.1630.345164.29045276,326.5310.182182.650
2186,938.7760.396136.73046211,224.4900.263237.760
22134,285.7140.498540.82047282,244.8980.365476.530
23116,530.6120.406430.61048300,000.0000.212421.430
24246,734.6940.233531.63049140,204.0820.131485.710
25152,040.8160.335329.59050240,816.3270.478127.550

Appendix B. Inversion Results of Parameters with Different Loading Times

Table A2. Results of optimization strategy under different loading times in Section 5, Discussions.
Loading TimesE (GPa)Error (%)nError (%)σy (MPa)Error (%)
1211.5470.7370.10028.618403.5185.910
5207.2151.3260.11120.435398.4574.582
10210.0890.0420.1432.235380.3540.170
Figure A1. Parameter iteration history and curve matching results of different cyclic loading times for exploring the influence of loading times on parameter inverse estimation in Section 5, Discussions.
Micromachines 14 01051 g0a1

References

  1. Kang, J.J.; Becker, A.A.; Wen, W.; Sun, W. Extracting elastic-plastic properties from experimental loading-unloading indentation curves using different optimization techniques. Int. J. Mech. Sci. 2018, 144, 102–109. [Google Scholar] [CrossRef]
  2. Goto, K.; Watanabe, I.; Ohmura, T. Determining suitable parameters for inverse estimation of plastic properties based on indentation marks. Int. J. Plast. 2019, 116, 81–90. [Google Scholar] [CrossRef]
  3. Chen, H.; Cai, L.X.; Bao, C. Equivalent-energy indentation method to predict the tensile properties of light alloys. Mater. Des. 2018, 362, 322–330. [Google Scholar] [CrossRef]
  4. Sun, M.C.; Yang, C.; Xiao, S.Y.; Tan, W.; Zhou, G.P. Analysis of the mechanical properties of Q345R steel in deep-regulating units by the spherical indentation method. IOP Conf. Ser. Mater. Sci. Eng. 2019, 668, 012017. [Google Scholar] [CrossRef]
  5. Chen, H.; Cai, L.X.; Li, C. An elastic-plastic indentation model for different geometric indenters and its applications. Mater. Today Commun. 2020, 25, 101440. [Google Scholar] [CrossRef]
  6. Ruiz-Moreno, A.; Hähner, P.; Fumagalli, F.; Haiblikova, V.; Conte, M.; Randall, N. Stressstrain curves and derived mechanical parameters of P91 steel from spherical nanoindentation at a range of temperatures. Mater. Des. 2020, 194, 108950. [Google Scholar] [CrossRef]
  7. Chudoba, T.; Schwarzer, N.; Richter, F. Determination of elastic properties of thin films by indentation measurements with a spherical indenter. Surf. Coat Tech. 2000, 127, 9–17. [Google Scholar] [CrossRef]
  8. Moy, C.K.S.; Bocciarelli, M.; Ringer, S.P.; Ranzi, G. Indentation and imprint mapping for the identification of material properties in multi-layered systems. Comp. Mater. Sci. 2011, 50, 1681–1691. [Google Scholar] [CrossRef]
  9. Wen, W.; Becker, A.A.; Sun, W. Determination of material properties of thin films and coatings using indentation tests: A review. J. Mater. Sci. 2017, 52, 12553–12573. [Google Scholar] [CrossRef]
  10. Boughton, O.R.; Ma, S.C.; Zhao, S.; Arnold, M.; Lewis, A.; Hansen, U.; Cobb, J.P.; Giuliani, F.; Abel, R.L. Measuring bone stiffness using spherical indentation. PLoS ONE 2018, 13, e0200475. [Google Scholar] [CrossRef]
  11. Boughton, O.R.; Ma, S.C.; Cai, X.R.; Yan, L.Y.; Peralta, L.; Laugier, P.; Marrow, J.; Giuliani, F.; Hansen, U.; Abel, R.L.; et al. Computed tomography porosity and spherical indentation for determining cortical bone millimetre-scale mechanical properties. Sci. Rep. 2019, 9, 7416. [Google Scholar] [CrossRef] [PubMed]
  12. Vachhani, S.J.; Kalidindi, S.R.; Burr, T.; Pathak, S. Lamellar Level Correlations between Mechanical Behavior and Composition in Mouse Bone. JOM 2021, 73, 3034–3045. [Google Scholar] [CrossRef]
  13. Oliver, W.C.; Pharr, G.M. An improved technique for determining hardness and elastic modulus using load and displacement sensing indentation experiments. J. Mater. Res. 1992, 7, 1564–1583. [Google Scholar] [CrossRef]
  14. Oliver, W.C.; Pharr, G.M. Measurement of hardness and elastic modulus by instrumented indentation: Advances in understanding and refinements to methodology. J. Mater. Res. 2004, 19, 3–20. [Google Scholar] [CrossRef]
  15. Hertz, H. Miscellaneous Papers; Macmillan: New York, NY, USA, 1896. [Google Scholar]
  16. Pharr, G.M.; Oliver, W.C.; Brotzen, F.R. On the generality of the relationship among contact stiffness, contact area, and elastic modulus during indentation. J. Mater. Res. 1992, 7, 613–617. [Google Scholar] [CrossRef]
  17. Hernot, X.; Bartier, O.; Bekouche, Y.; El Abdi, R.; Mauvoisin, G. Influence of penetration depth and mechanical properties on contact radius determination for spherical indentation. Int. J. Solids Struct. 2006, 43, 4136–4153. [Google Scholar] [CrossRef]
  18. Bec, S.; Tonck, A.; Georges, J.M.; Georges, E.; Loubet, J.L. Improvements in the indentation method with a surface force apparatus. Philos. Mag. A 1996, 74, 1061–1072. [Google Scholar] [CrossRef]
  19. Hsueh, C.-H.; Miranda, P. Combined empirical–analytical method for determining contact radius and indenter displacement during Hertzian indentation on coating/substrate systems. J. Mater. Res. 2004, 19, 2774–2781. [Google Scholar] [CrossRef]
  20. Cheng, Y.-T.; Cheng, C.-M. Can stress–strain relationships be obtained from indentation curves using conical and pyramidal indenters. J. Mater. Res. 1999, 14, 3493–3496. [Google Scholar] [CrossRef]
  21. Chollacoop, N.; Ramamurty, U. Robustness of the algorithms for extracting plastic properties from the instrumented sharp indentation data. Mater. Sci. Eng. A 2006, 423, 41–45. [Google Scholar] [CrossRef]
  22. Moy, C.K.S.; Bocciarelli, M.; Ringer, S.P.; Ranzi, G. Identification of the material properties of Al 2024 alloy by means of inverse analysis and indentation tests. Mater. Sci. Eng. A 2011, 529, 119–130. [Google Scholar] [CrossRef]
  23. Tho, K.K.; Swaddiwudhipong, S.; Liu, Z.S.; Zeng, K.; Hua, J. Uniqueness of reverse analysis from conical indentation tests. J. Mater. Res. 2011, 19, 2498–2502. [Google Scholar] [CrossRef]
  24. Cheng, Y.T.; Cheng, C.M. Scaling, dimensional analysis, and indentation measurements. Mat. Sci. Eng. R 2004, 44, 91–149. [Google Scholar] [CrossRef]
  25. Futakawa, M.; Wakui, T.; Tanabe, Y.; Ioka, I. Identification of the constitutive equation by the indentation technique using plural indenters with different apex angles. J. Mater. Res. 2001, 16, 2283–2292. [Google Scholar] [CrossRef]
  26. Cheng, Y.T.; Li, Z.Y.; Cheng, C.M. Scaling, relationships for indentation measurements. Philos. Mag. A 2002, 82, 1821–1829. [Google Scholar] [CrossRef]
  27. Swaddiwudhipong, S.; Tho, K.K.; Liu, Z.S.; Zeng, K. Material characterization based on dual indenters. Int. J. Solids Struct. 2005, 42, 69–83. [Google Scholar] [CrossRef]
  28. Nakamura, T.; Gu, Y. Identification of elastic-plastic anisotropic parameters using instrumented indentation and inverse analysis. Mech. Mater. 2007, 39, 340–356. [Google Scholar] [CrossRef]
  29. Chen, X.; Ogasawara, N.; Zhao, M.; Chiba, N. On the uniqueness of measuring elastoplastic properties from indentation: The indistinguishable mystical materials. J. Mech. Phys. Solids 2007, 55, 1618–1660. [Google Scholar] [CrossRef]
  30. Tabor, D. The hardness and strength of metals. J. Inst. Metals 1951, 79, 1. [Google Scholar]
  31. Chollacoop, N.; Dao, M.; Suresh, S. Depth-sensing instrumented indentation with dual sharp indenters. Acta Mater. 2003, 51, 3713–3729. [Google Scholar] [CrossRef]
  32. Zhao, M.H.; Ogasawara, N.; Chiba, N.; Chen, X. A new approach to measure the elastic-plastic properties of bulk materials using spherical indentation. Acta Mater. 2006, 54, 23–32. [Google Scholar] [CrossRef]
  33. Yonezu, A.; Yoneda, K.; Hirakata, H.; Sakihara, M.; Minoshima, K. A simple method to evaluate anisotropic plastic properties based on dimensionless function of single spherical indentation—Application to SiC whisker-reinforced aluminum alloy. Mater. Sci. Eng. A 2010, 527, 7646–7657. [Google Scholar] [CrossRef]
  34. Kang, J.J.; Becker, A.A.; Sun, W. A combined dimensional analysis and optimization approach for determining elastic-plastic properties from indentation tests. J. Strain. Anal. Eng. 2011, 46, 749–759. [Google Scholar] [CrossRef]
  35. Ogasawara, N.; Chiba, N.; Chen, X. Representative strain of indentation analysis. J. Mater. Res. 2005, 20, 2225–2234. [Google Scholar] [CrossRef]
  36. Luo, J.; Lin, J.; Dean, T.A. A study on the determination of mechanical properties of a power law material by its indentation force-depth curve. Philos. Mag. A 2006, 86, 2881–2905. [Google Scholar] [CrossRef]
  37. Khan, M.K.; Hainsworth, S.V.; Fitzpatrick, M.E.; Edwards, L. A combined experimental and finite element approach for determining mechanical properties of aluminium alloys by nanoindentation. Comp. Mater. Sci. 2010, 49, 751–760. [Google Scholar] [CrossRef]
  38. Sun, G.Y.; Wang, E.D.; Zhao, T.; Zheng, G.; Li, Q. Inverse identification of cell-wall material properties of closed-cell aluminum foams based upon Vickers nano-indentation tests. Int. J. Mech. Sci. 2020, 176, 105524. [Google Scholar] [CrossRef]
  39. Fan, Z.; Rho, J.Y.; Swadener, J.G. Three-dimensional finite element analysis of the effects of anisotropy on bone mechanical properties measured by nanoindentation. J. Mater. Res. 2004, 19, 114–123. [Google Scholar] [CrossRef]
  40. Mullins, L.R.; Bruzzi, M.S.; McHugh, P.E. Calibration of a constitutive model for the post-yield behaviour of cortical bone. J. Mech. Behav. Biomed. 2009, 2, 460–470. [Google Scholar] [CrossRef]
  41. Schwiedrzik, J.J.; Zysset, P.K. Quantitative analysis of imprint shape and its relation to mechanical properties measured by microindentation in bone. J. Biomech. 2015, 48, 210–216. [Google Scholar] [CrossRef]
  42. Field, J.S.; Swain, M.V. Determining the mechanical properties of small volumes of material from submicrometer spherical indentations. J. Mater. Res. 1995, 10, 101–112. [Google Scholar] [CrossRef]
  43. Taljat, B.; Zacharia, T.; Kosel, F. New analytical procedure to determine stress-strain curve from spherical indentation data. Int. J. Solids Struct. 1998, 35, 4411–4426. [Google Scholar] [CrossRef]
  44. Nayebi, A.; El Abdi, R.; Bartier, O.; Mauvoisin, G. New procedure to determine steel mechanical parameters from the spherical indentation technique. Mech. Mater. 2002, 34, 243–254. [Google Scholar] [CrossRef]
  45. Collin, J.-M.; Mauvoisin, G.; Pilvin, P.; ElAbdi, R. Use of spherical indentation data changes to materials characterization based on a new multiple cyclic loading protocol. Mater. Sci. Eng. A 2008, 488, 608–622. [Google Scholar] [CrossRef]
  46. Feng, C.; Kang, B.S. Young’s Modulus Measurement Using a Simplified Transparent Indenter Measurement Technique. Exp. Mech. 2008, 48, 9–15. [Google Scholar] [CrossRef]
  47. Feng, C.; Tannenbaum, J.M.; Kang, B.S.; Alvin, M.A. A Load-Based Multiple-Partial Unloading Micro-Indentation Technique for Mechanical Property Evaluation. Exp. Mech. 2010, 50, 737–743. [Google Scholar] [CrossRef]
  48. Kim, K.H.; Kim, Y.C.; Jeon, E.C.; Kwon, D. Evaluation of indentation tensile properties of Ti alloys by considering plastic constraint effect. Mater. Sci. Eng. A 2011, 528, 5259–5263. [Google Scholar] [CrossRef]
  49. Huang, L.Y.; Guan, K.S.; Xu, T.; Zhang, J.M.; Wang, Q.Q. Investigation of the mechanical properties of steel using instrumented indentation test with simulated annealing particle swarm optimization. Theor. Appl. Fract. Mech. 2019, 102, 116–121. [Google Scholar] [CrossRef]
  50. Mirjalili, S. Genetic Algorithm. In Evolutionary Algorithms and Neural Networks: Theory and Applications; Mirjalili, S., Ed.; Springer International Publishing: Cham, Switzerland, 2019; pp. 43–55. [Google Scholar]
  51. Katoch, S.; Chauhan, S.S.; Kumar, V. A review on genetic algorithm: Past, present, and future. Multimed. Tools Appl. 2021, 80, 8091–8126. [Google Scholar] [CrossRef]
  52. Li, M.; Li, G.; Azarm, S. A kriging metamodel assisted multi-objective genetic algorithm for design optimization. J. Mech. Des. 2008, 130, 031401. [Google Scholar] [CrossRef]
  53. Kleijnen, J.P.C. Kriging metamodeling in simulation: A review. Eur. J. Oper. Res. 2009, 192, 707–716. [Google Scholar] [CrossRef]
  54. Tyurin, A.I.; Victorov, S.D.; Kochanov, A.N.; Shuklinov, A.V.; Pirozhkova, T.S. Methods of Micro- and Nanoindentation for Characterization of Local Physical and Mechanical Properties of Multiphase Materials. In Proceedings of the AIP Conference Proceedings, Tomsk, Russia, 19–23 September 2016; Volume 1783. [Google Scholar] [CrossRef]
  55. Remache, D.; Semaan, M.; Rossi, J.M.; Pithioux, M.; Milan, J.L. Application of the Johnson-Cook plasticity model in the finite element simulations of the nanoindentation of the cortical bone. J. Mech. Behav. Biomed. 2020, 101, 103426. [Google Scholar] [CrossRef] [PubMed]
  56. Lee, H.; Lee, J.H.; Pharr, G.M. A numerical approach to spherical indentation techniques for material property evaluation. J. Mech. Phys. Solids 2005, 53, 2037–2069. [Google Scholar] [CrossRef]
  57. Lee, J.H.; Kim, T.; Lee, H. A study on robust indentation techniques to evaluate elastic–plastic properties of metals. Int. J. Solids Struct. 2010, 47, 647–664. [Google Scholar] [CrossRef]
  58. Jiang, P.; Zhang, T.; Yang, R. Experimental verification for an instrumented spherical indentation technique in determining mechanical properties of metallic materials. J. Mater. Res. 2011, 26, 1414–1420. [Google Scholar] [CrossRef]
  59. Li, C.J.; Liu, K.; Wang, H.R.; Li, L.; Xue, T. Study on Determination of Mechanical Properties of Metal by Indentation Test. In Proceedings of the 2020 IEEE 4th Information Technology, Networking, Electronic and Automation Control Conference (Itnec 2020), Chongqing, China, 12–14 June 2020; pp. 1961–1965. [Google Scholar]
Figure 2. Model dimension size sensitivity analysis. (a) length and width; (b) width.
Micromachines 14 01051 g002
Figure 3. Schematic diagram of three types of elements.
Micromachines 14 01051 g003
Figure 4. Mesh sensitivity analysis. (a) element types; (b) element size.
Micromachines 14 01051 g004
Figure 5. Indentation simulation model.
Micromachines 14 01051 g005
Figure 8. Target load-depth curves and optimized curves under different maximum indentation depth: (a) hmax1: 1.2 µm; (b) hmax2: 2 µm; (c) hmax3: 4 µm; (d) hmax4: 6 µm.
Micromachines 14 01051 g008
Figure 9. Optimized parameter values versus iterations for different maximum indentation depths (a) hmax1: 1.2 µm; (b) hmax2: 2 µm; (c) hmax3: 4 µm; (d) hmax4: 6 µm.
Micromachines 14 01051 g009
Figure 11. Results of the indentation experiment.
Micromachines 14 01051 g011
Figure 12. Optimized results of indentation test curve based on Q355 [4].
Micromachines 14 01051 g012
Table 2. Optimization results of three parameters with different maximum indentation depths.
hmaxTestE (GPa)Error (%)nError (%)σy (MPa)Error (%)
1200 nmT180.0010 0.00125 0.2100260.01238 139.99400 0.00429
T280.0009 0.00112 0.210022 0.01048 139.99500 0.00357
T380.0001 0.00013 0.209998 0.00095 140.00100 0.00071
2000 nmT180.0074 0.00925 0.210284 0.13524 139.93700 0.04500
T279.9991 0.00112 0.209971 0.01381 140.00700 0.00500
T379.9990 0.00125 0.209993 0.00333 140.00200 0.00143
4000 nmT179.9836 0.02050 0.209773 0.10810 140.05800 0.04143
T279.9942 0.00725 0.209912 0.04190 140.02200 0.01571
T379.9821 0.02237 0.209741 0.12333 140.06600 0.04714
6000 nmT180.1152 0.14400 0.212645 1.25952 139.36300 0.45500
Table 3. Initial values and the lower and upper boundaries of the design variables in the optimization process and the optimized value.
Variable NameInitial ValueLower BoundUpper BoundOptimized Value
E (GPa)210189231189.000
n0.20.10.30.162
σy (GPa)350300500416.071
Disclaimer/Publisher’s Note: The statements, opinions and data contained in all publications are solely those of the individual author(s) and contributor(s) and not of MDPI and/or the editor(s). MDPI and/or the editor(s) disclaim responsibility for any injury to people or property resulting from any ideas, methods, instructions or products referred to in the content.