

Advances in Integration, Wearable Applications, and Artificial Intelligence of Biomedical Microfluidics Systems
Abstract
:
1. Introduction
2. Integrated Microfluidic Systems
2.1. Microfluidics Integrated with External Techniques
2.1.1. Magnetic Fields and Microfluidics
2.1.2. Acoustic Fields and Microfluidics
2.1.3. Electric Fields and Microfluidics
2.1.4. Optical Fields and Microfluidics

2.2. Introduction of Electrochemical Biosensors
2.3. The Protocols and Applications of Electrochemical Microfluidics
2.3.1. Amperometry
2.3.2. Voltammetry
2.3.3. Potentiometry
2.3.4. Conductometry
2.3.5. Electrochemical Impedance Spectroscopy (EIS)
2.4. Conclusions
3. Wearable Microfluidics
3.1. Introduction
3.2. General Functions
3.2.1. Sample Collection
Capillary Force
Osmotic Property
3.2.2. Sample Transmission
3.2.3. Sample Analysis
Colorimetric Detection
Electrochemical Detection
3.2.4. Signal Transformation
Bluetooth
NFC
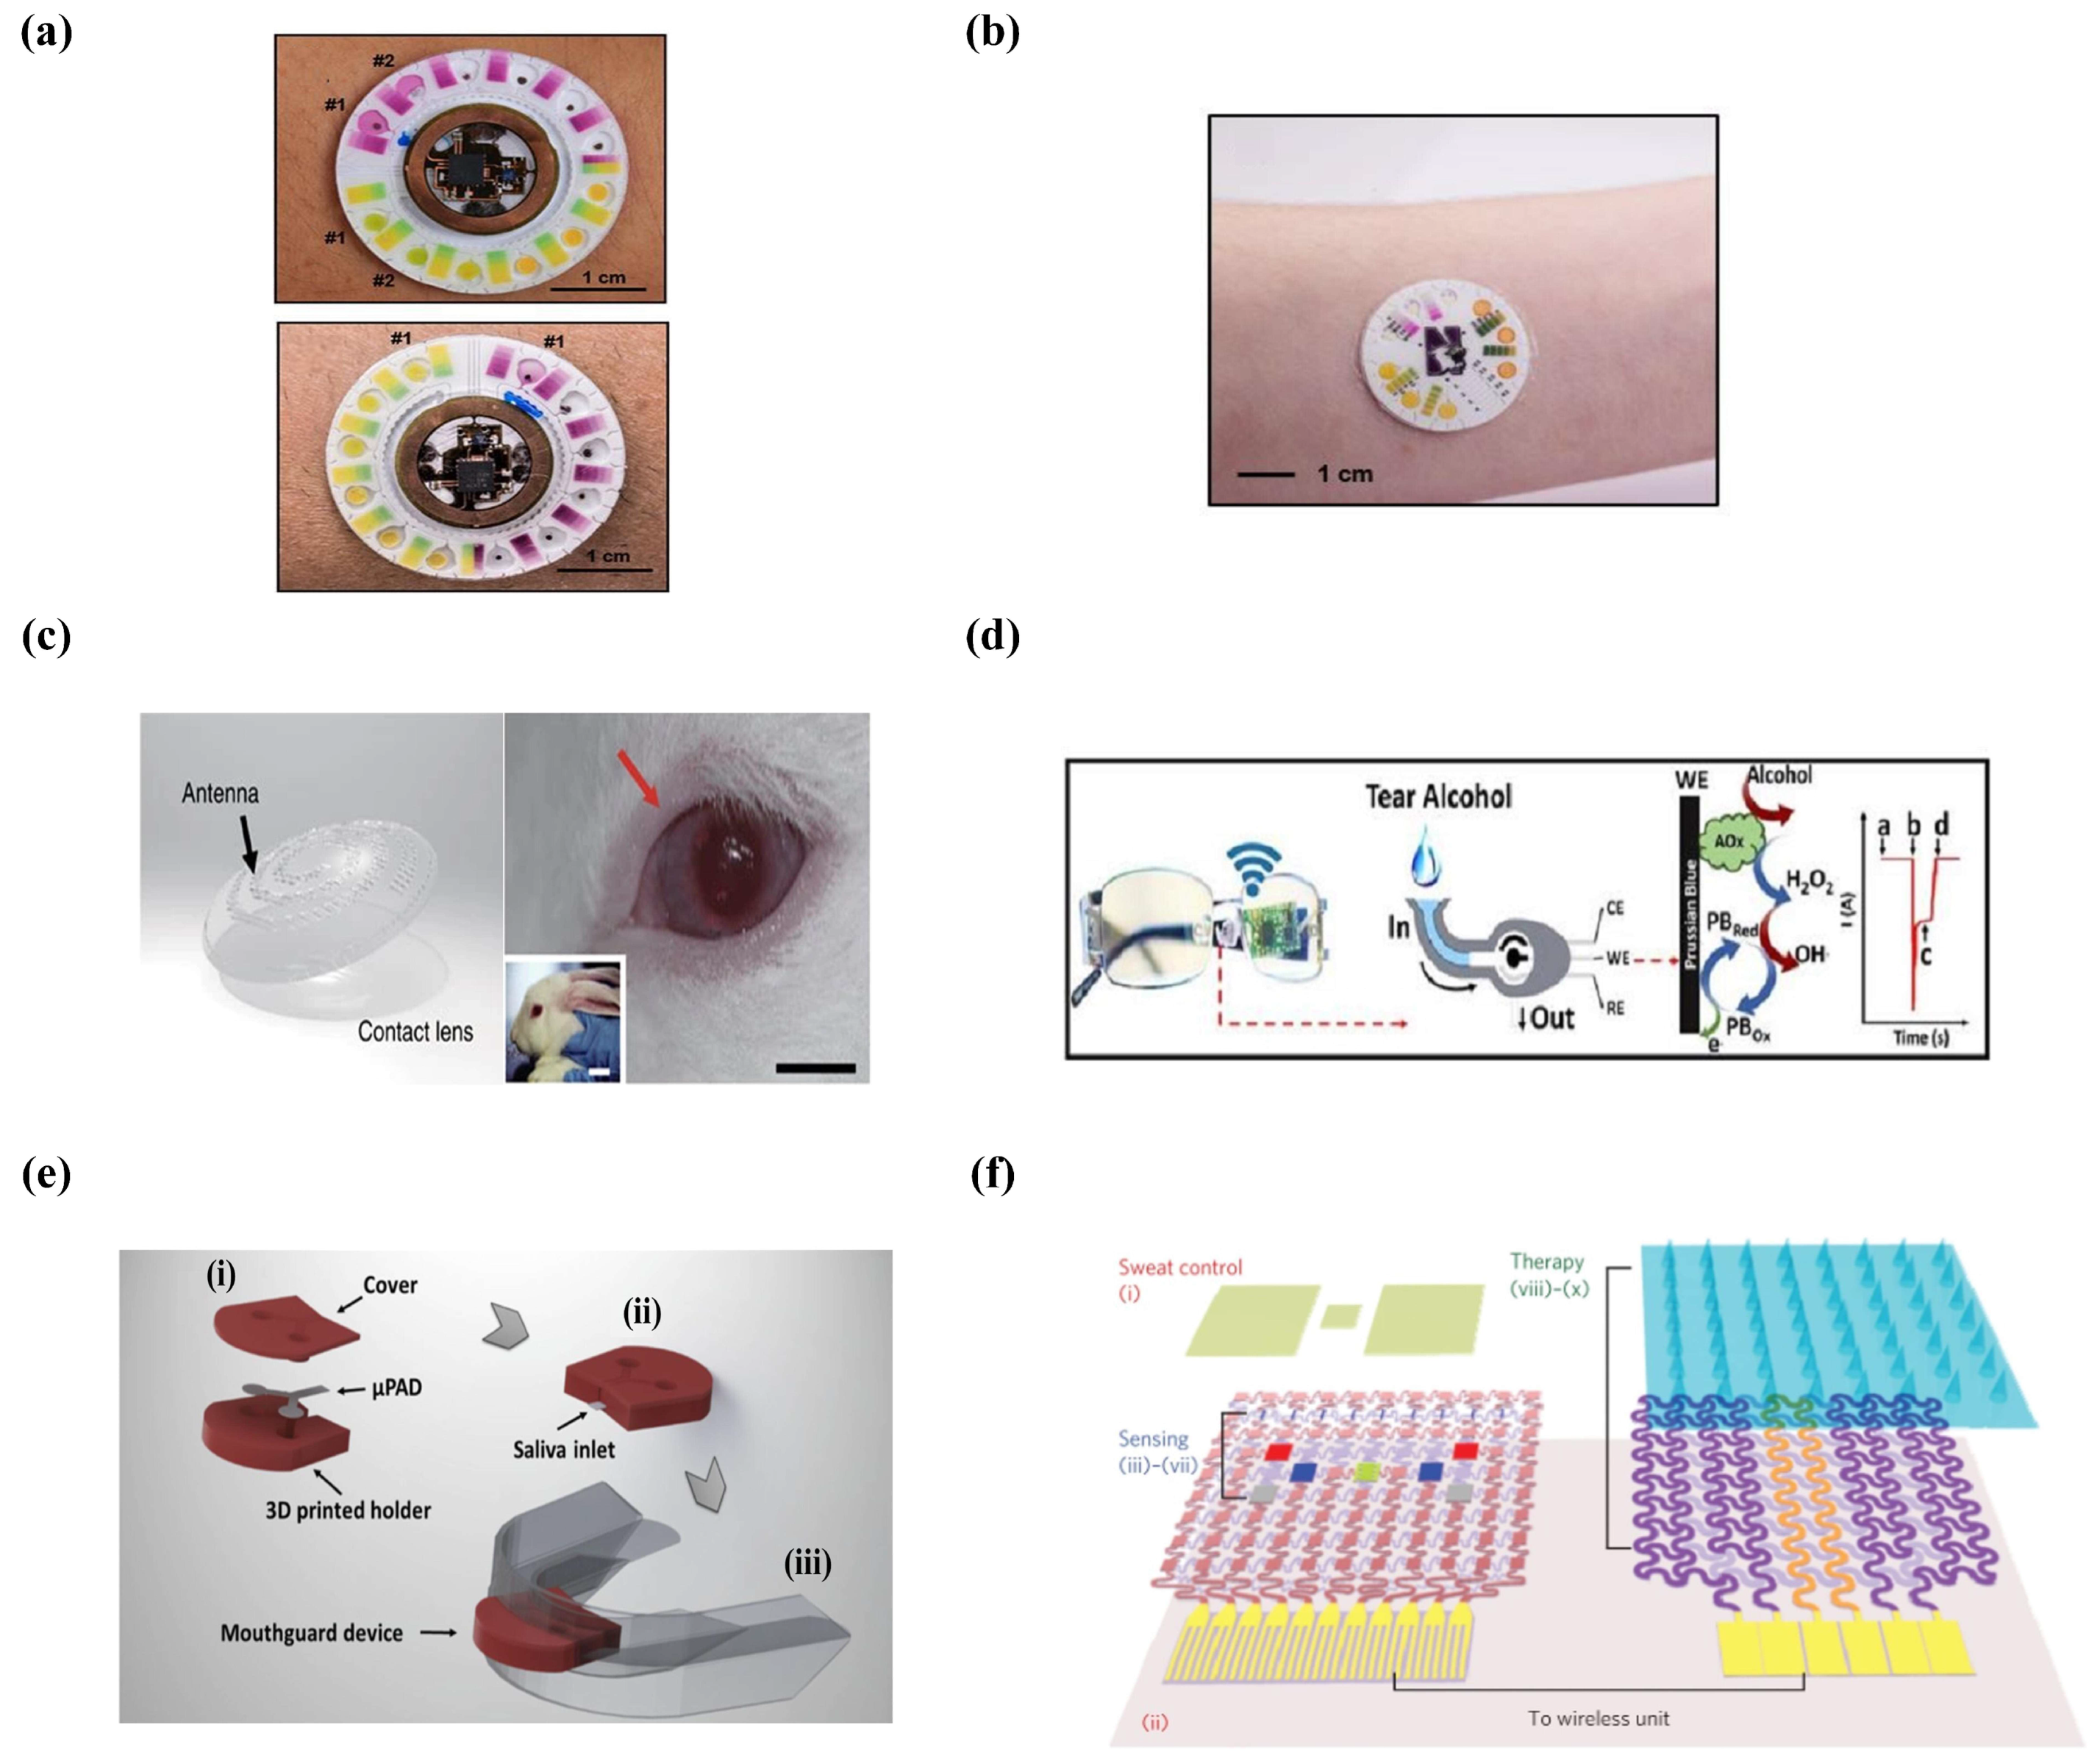
3.3. Applications
3.3.1. Sample Analysis
Sweat
Tears
Saliva
3.3.2. Drug Delivery
3.4. Conclusions
4. Artificial Intelligence
4.1. Introduction
4.2. Machine Learning in Microfluidics
4.2.1. Traditional Machine Learning and Microfluidics
Supervised Learning
Unsupervised Learning
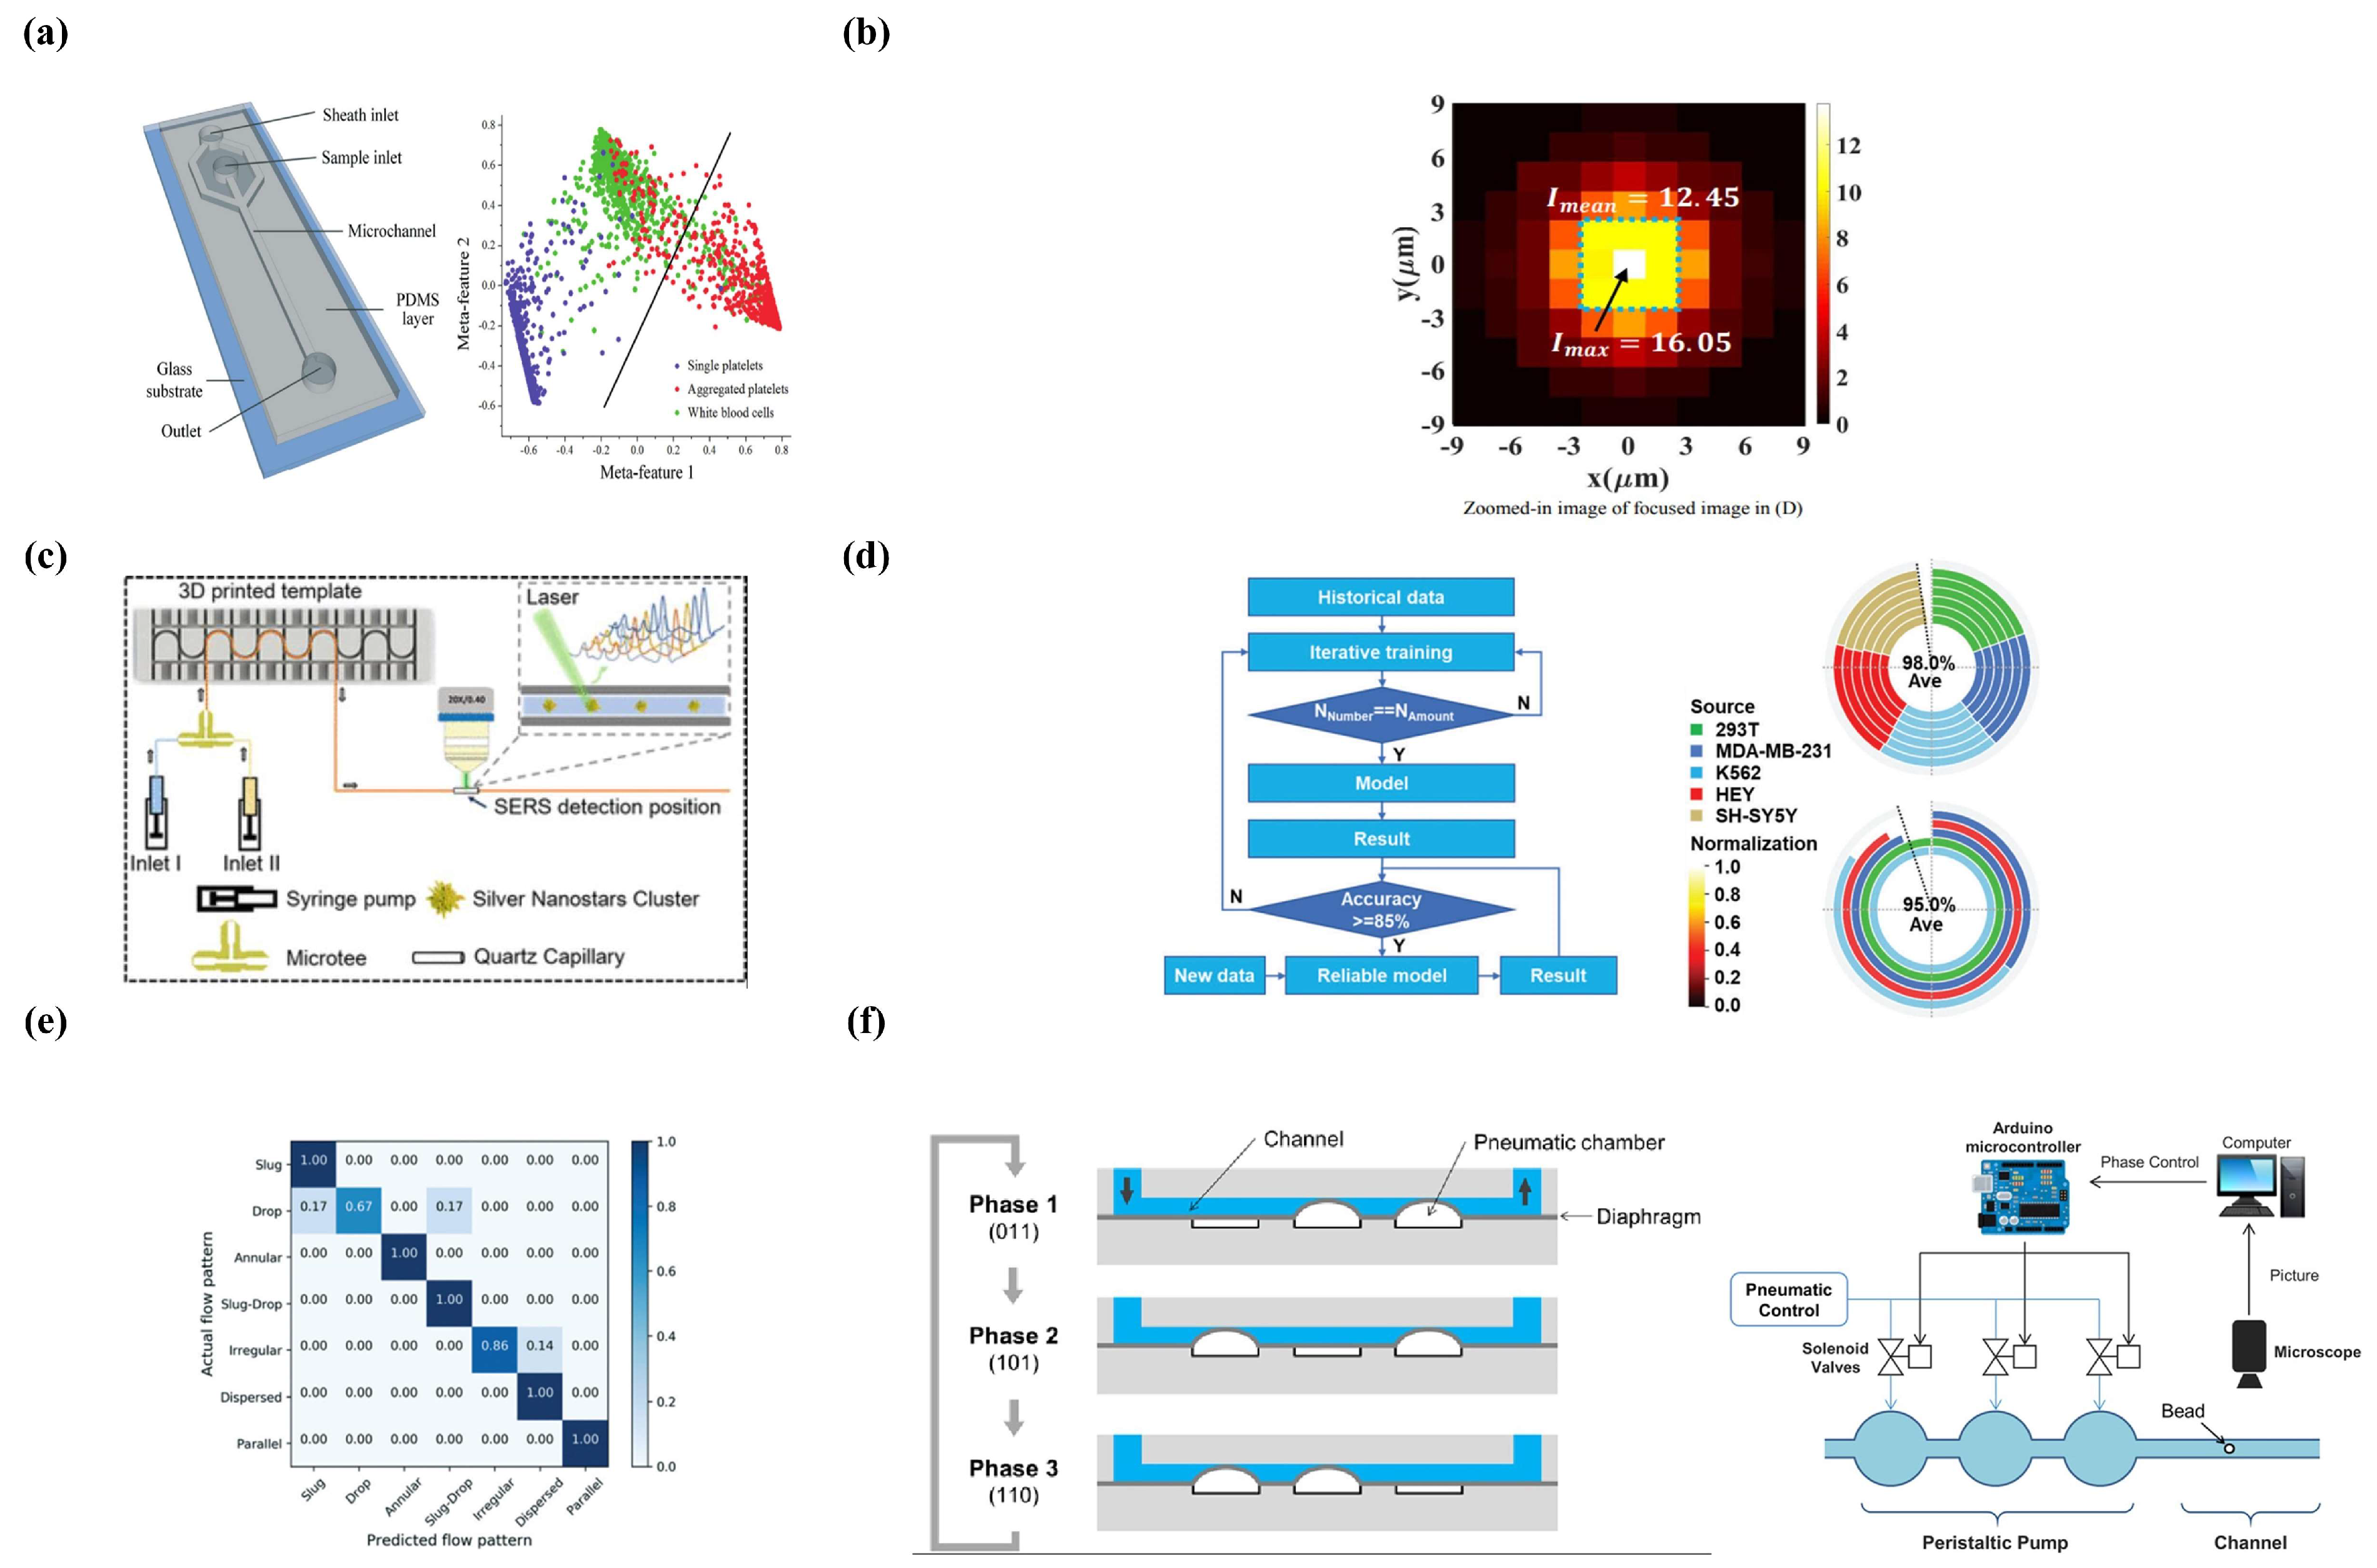
Reinforcement Learning
4.2.2. Deep Learning and Microfluidics
Supervised Learning
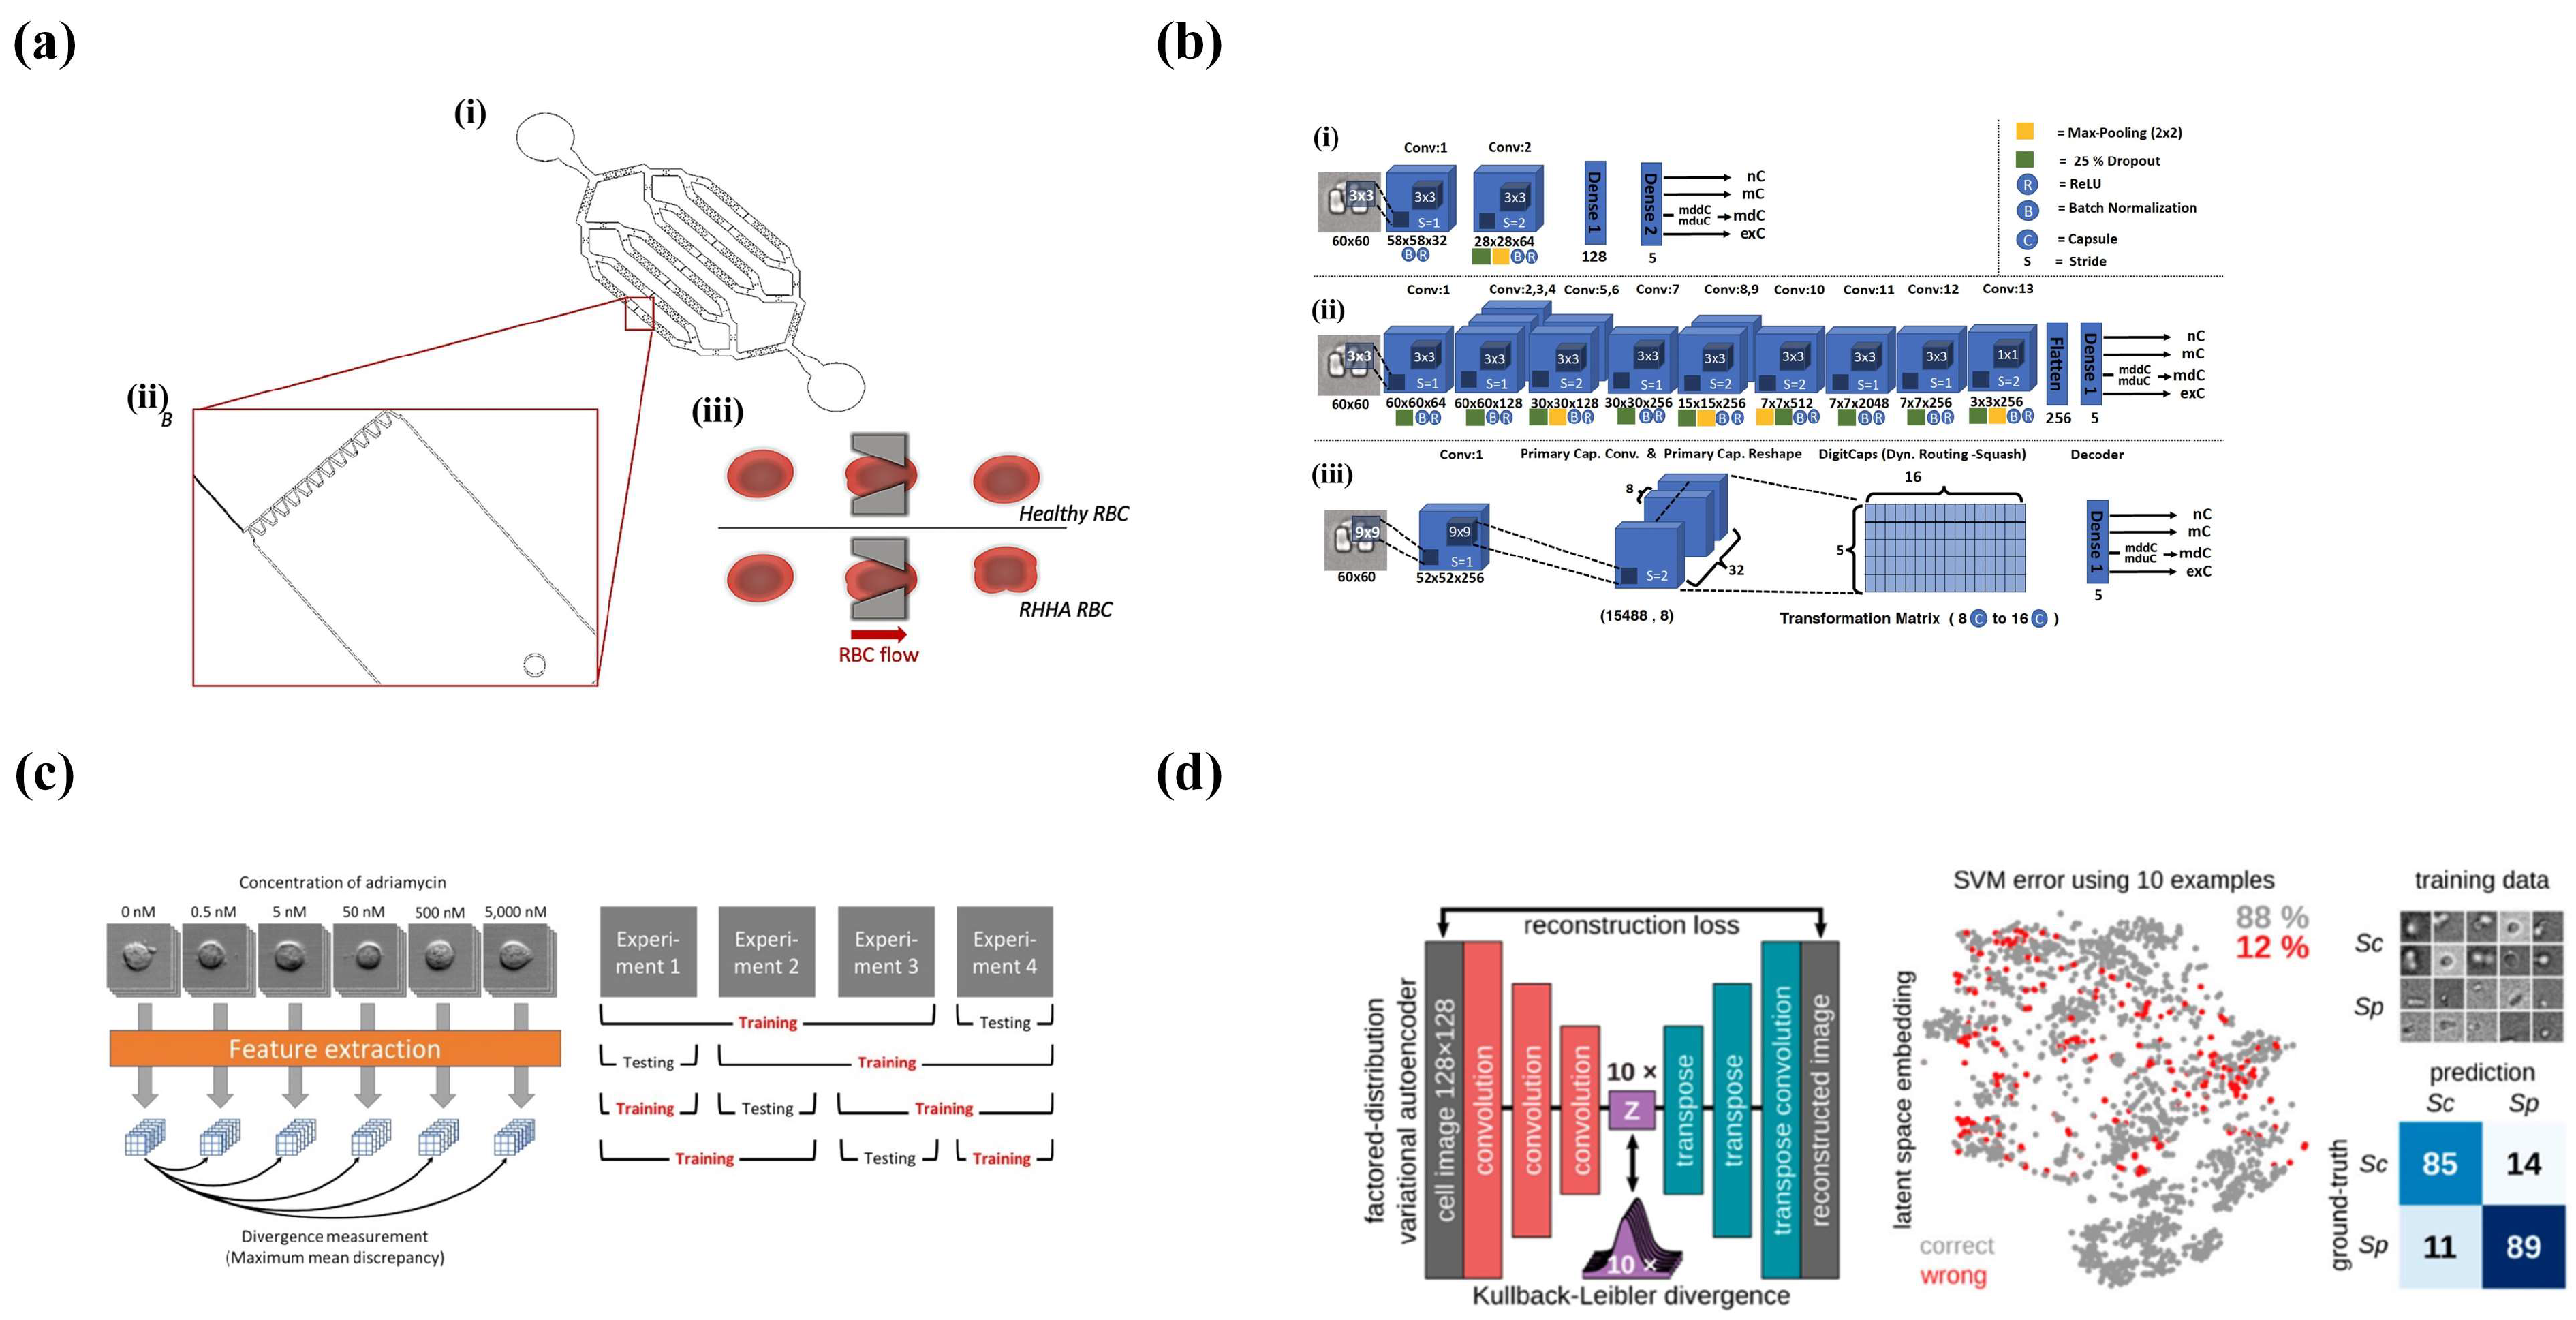
Unsupervised Learning
4.3. Conclusions
5. Conclusions
Author Contributions
Funding
Data Availability Statement
Conflicts of Interest
References
- Whitesides, G.M. The origins and the future of microfluidics. Nature 2006, 442, 368–373. [Google Scholar] [CrossRef] [PubMed]
- Mark, D.; Haeberle, S.; Roth, G.; Von Stetten, F.; Zengerle, R. Microfluidic lab-on-a-chip platforms: Requirements, characteristics and applications. In Microfluidics Based Microsystems: Fundamentals and Applications; Springer: Berlin/Heidelberg, Germany, 2010; pp. 305–376. [Google Scholar]
- Alistar, M.; Pop, P. Synthesis of biochemical applications on digital microfluidic biochips with operation execution time variability. Integr. VLSI J. 2015, 51, 158–168. [Google Scholar] [CrossRef] [Green Version]
- Kulinsky, L.; Noroozi, Z.; Madou, M. Present technology and future trends in point-of-care microfluidic diagnostics. In Microfluidic Diagnostics: Methods and Protocols; Springer: Berlin/Heidelberg, Germany, 2013; pp. 3–23. [Google Scholar]
- Tseng, T.-M.; Li, M.; Li, B.; Ho, T.-Y.; Schlichtmann, U. Columba: Co-layout synthesis for continuous-flow microfluidic biochips. In Proceedings of the 53rd Annual Design Automation Conference, Austin, TX, USA, 2016; pp. 1–6. [Google Scholar]
- i Solvas, X.C.; DeMello, A. Droplet microfluidics: Recent developments and future applications. Chem. Commun. 2011, 47, 1936–1942. [Google Scholar] [CrossRef]
- Teh, S.-Y.; Lin, R.; Hung, L.-H.; Lee, A.P. Droplet microfluidics. Lab Chip 2008, 8, 198–220. [Google Scholar] [CrossRef]
- Zhu, P.; Wang, L. Passive and active droplet generation with microfluidics: A review. Lab Chip 2017, 17, 34–75. [Google Scholar] [CrossRef]
- Matuła, K.; Rivello, F.; Huck, W.T. Single-cell analysis using droplet microfluidics. Adv. Biosyst. 2020, 4, 1900188. [Google Scholar] [CrossRef] [Green Version]
- Shang, L.; Cheng, Y.; Zhao, Y. Emerging droplet microfluidics. Chem. Rev. 2017, 117, 7964–8040. [Google Scholar] [CrossRef] [PubMed]
- Joensson, H.N.; Andersson Svahn, H. Droplet microfluidics—A tool for single-cell analysis. Angew. Chem. Int. Ed. 2012, 51, 12176–12192. [Google Scholar] [CrossRef]
- Liu, D.; Sun, M.; Zhang, J.; Hu, R.; Fu, W.; Xuanyuan, T.; Liu, W. Single-cell droplet microfluidics for biomedical applications. Analyst 2022, 147, 2294–2316. [Google Scholar] [CrossRef]
- Lagus, T.P.; Edd, J.F. A review of the theory, methods and recent applications of high-throughput single-cell droplet microfluidics. J. Phys. D Appl. Phys. 2013, 46, 114005. [Google Scholar] [CrossRef]
- Chen, Z.; Kheiri, S.; Young, E.W.; Kumacheva, E. Trends in droplet microfluidics: From droplet generation to biomedical applications. Langmuir 2022, 38, 6233–6248. [Google Scholar] [CrossRef]
- Weng, L.; Spoonamore, J.E. Droplet microfluidics-enabled high-throughput screening for protein engineering. Micromachines 2019, 10, 734. [Google Scholar] [CrossRef] [PubMed] [Green Version]
- Zhuang, J.; Yin, J.; Lv, S.; Wang, B.; Mu, Y. Advanced “lab-on-a-chip” to detect viruses–Current challenges and future perspectives. Biosens. Bioelectron. 2020, 163, 112291. [Google Scholar] [CrossRef]
- Gervais, L.; De Rooij, N.; Delamarche, E. Microfluidic chips for point-of-care immunodiagnostics. Adv. Mater. 2011, 23, H151–H176. [Google Scholar] [CrossRef]
- van Berkel, C.; Gwyer, J.D.; Deane, S.; Green, N.; Holloway, J.; Hollis, V.; Morgan, H. Integrated systems for rapid point of care (PoC) blood cell analysis. Lab Chip 2011, 11, 1249–1255. [Google Scholar] [CrossRef] [Green Version]
- Oblath, E.A.; Henley, W.H.; Alarie, J.P.; Ramsey, J.M. A microfluidic chip integrating DNA extraction and real-time PCR for the detection of bacteria in saliva. Lab Chip 2013, 13, 1325–1332. [Google Scholar] [CrossRef] [PubMed] [Green Version]
- Luppa, P.B.; Müller, C.; Schlichtiger, A.; Schlebusch, H. Point-of-care testing (POCT): Current techniques and future perspectives. TrAC Trends Anal. Chem. 2011, 30, 887–898. [Google Scholar] [CrossRef]
- Di Carlo, D. Inertial microfluidics. Lab Chip 2009, 9, 3038–3046. [Google Scholar] [CrossRef] [PubMed]
- Aladese, A.D.; Jeong, H.-H. Recent developments in 3D printing of droplet-based microfluidics. BioChip J. 2021, 15, 313–333. [Google Scholar] [CrossRef]
- Li Jeon, N.; Baskaran, H.; Dertinger, S.K.; Whitesides, G.M.; Van De Water, L.; Toner, M. Neutrophil chemotaxis in linear and complex gradients of interleukin-8 formed in a microfabricated device. Nat. Biotechnol. 2002, 20, 826–830. [Google Scholar] [CrossRef]
- Bui, M.-P.N.; Li, C.A.; Han, K.N.; Choo, J.; Lee, E.K.; Seong, G.H. Enzyme kinetic measurements using a droplet-based microfluidic system with a concentration gradient. Anal. Chem. 2011, 83, 1603–1608. [Google Scholar] [CrossRef] [PubMed]
- Damean, N.; Olguin, L.F.; Hollfelder, F.; Abell, C.; Huck, W.T. Simultaneous measurement of reactions in microdroplets filled by concentration gradients. Lab Chip 2009, 9, 1707–1713. [Google Scholar] [CrossRef]
- Nisisako, T.; Torii, T.; Takahashi, T.; Takizawa, Y. Synthesis of monodisperse bicolored janus particles with electrical anisotropy using a microfluidic Co-Flow system. Adv. Mater. 2006, 18, 1152–1156. [Google Scholar] [CrossRef]
- Alargova, R.G.; Bhatt, K.H.; Paunov, V.N.; Velev, O.D. Scalable synthesis of a new class of polymer microrods by a liquid–liquid dispersion technique. Adv. Mater. 2004, 16, 1653–1657. [Google Scholar] [CrossRef]
- Tofteberg, T.; Skolimowski, M.; Andreassen, E.; Geschke, O. A novel passive micromixer: Lamination in a planar channel system. Microfluid. Nanofluidics 2010, 8, 209–215. [Google Scholar] [CrossRef] [Green Version]
- Capretto, L.; Cheng, W.; Hill, M.; Zhang, X. Micromixing within microfluidic devices. In Microfluidics: Technologies and Applications; Springer: Berlin/Heidelberg, Germany, 2011; pp. 27–68. [Google Scholar]
- Bringer, M.R.; Gerdts, C.J.; Song, H.; Tice, J.D.; Ismagilov, R.F. Microfluidic systems for chemical kinetics that rely on chaotic mixing in droplets. Philos. Trans. R. Soc. Lond. Ser. A Math. Phys. Eng. Sci. 2004, 362, 1087–1104. [Google Scholar] [CrossRef] [Green Version]
- Verpoorte, E.; De Rooij, N.F. Microfluidics meets MEMS. Proc. IEEE 2003, 91, 930–953. [Google Scholar] [CrossRef] [Green Version]
- Lei, K.-M.; Mak, P.-I.; Law, M.-K.; Martins, R.P. A palm-size μNMR relaxometer using a digital microfluidic device and a semiconductor transceiver for chemical/biological diagnosis. Analyst 2015, 140, 5129–5137. [Google Scholar] [CrossRef] [Green Version]
- Khorasani, M.; Behnam, M.; van den Berg, L.; Backhouse, C.J.; Elliott, D.G. High-voltage CMOS controller for microfluidics. IEEE Trans. Biomed. Circuits Syst. 2009, 3, 89–96. [Google Scholar] [CrossRef]
- Zhao, S.; Yu, D.; Zou, Y.; Yang, C.; Yang, X.; Xiao, Z.; Chen, P.; Qin, F. Integration of CMOS image sensor and microwell array using 3-D WLCSP technology for biodetector application. IEEE Trans. Compon. Packag. Manuf. Technol. 2019, 9, 624–632. [Google Scholar] [CrossRef]
- Matbaechi Ettehad, H.; Soltani Zarrin, P.; Hölzel, R.; Wenger, C. Dielectrophoretic immobilization of yeast cells using CMOS integrated microfluidics. Micromachines 2020, 11, 501. [Google Scholar] [CrossRef]
- Garimella, S.V.; Fleischer, A.S.; Murthy, J.Y.; Keshavarzi, A.; Prasher, R.; Patel, C.; Bhavnani, S.H.; Venkatasubramanian, R.; Mahajan, R.; Joshi, Y. Thermal challenges in next-generation electronic systems. IEEE Trans. Compon. Packag. Technol. 2008, 31, 801–815. [Google Scholar] [CrossRef]
- Van Erp, R.; Soleimanzadeh, R.; Nela, L.; Kampitsis, G.; Matioli, E. Co-designing electronics with microfluidics for more sustainable cooling. Nature 2020, 585, 211–216. [Google Scholar] [CrossRef] [PubMed]
- Riordon, J.; Sovilj, D.; Sanner, S.; Sinton, D.; Young, E.W. Deep learning with microfluidics for biotechnology. Trends Biotechnol. 2019, 37, 310–324. [Google Scholar] [CrossRef] [PubMed]
- Srikanth, S.; Dubey, S.K.; Javed, A.; Goel, S. Droplet based microfluidics integrated with machine learning. Sens. Actuators A Phys. 2021, 332, 113096. [Google Scholar] [CrossRef]
- Galan, E.A.; Zhao, H.; Wang, X.; Dai, Q.; Huck, W.T.; Ma, S. Intelligent microfluidics: The convergence of machine learning and microfluidics in materials science and biomedicine. Matter 2020, 3, 1893–1922. [Google Scholar] [CrossRef]
- Liu, P.; Mathies, R.A. Integrated microfluidic systems for high-performance genetic analysis. Trends Biotechnol. 2009, 27, 572–581. [Google Scholar] [CrossRef]
- Kovarik, M.L.; Ornoff, D.M.; Melvin, A.T.; Dobes, N.C.; Wang, Y.; Dickinson, A.J.; Gach, P.C.; Shah, P.K.; Allbritton, N.L. Micro total analysis systems: Fundamental advances and applications in the laboratory, clinic, and field. Anal. Chem. 2013, 85, 451–472. [Google Scholar] [CrossRef] [PubMed] [Green Version]
- Pamme, N. Magnetism and microfluidics. Lab Chip 2006, 6, 24–38. [Google Scholar] [CrossRef] [PubMed]
- Plouffe, B.D.; Murthy, S.K.; Lewis, L.H. Fundamentals and application of magnetic particles in cell isolation and enrichment: A review. Rep. Prog. Phys. 2014, 78, 016601. [Google Scholar] [CrossRef] [PubMed] [Green Version]
- Mizuno, M.; Yamada, M.; Mitamura, R.; Ike, K.; Toyama, K.; Seki, M. Magnetophoresis-integrated hydrodynamic filtration system for size-and surface marker-based two-dimensional cell sorting. Anal. Chem. 2013, 85, 7666–7673. [Google Scholar] [CrossRef]
- Karabacak, N.M.; Spuhler, P.S.; Fachin, F.; Lim, E.J.; Pai, V.; Ozkumur, E.; Martel, J.M.; Kojic, N.; Smith, K.; Chen, P.-i. Microfluidic, marker-free isolation of circulating tumor cells from blood samples. Nat. Protoc. 2014, 9, 694–710. [Google Scholar] [CrossRef] [Green Version]
- Zhang, P.; Bachman, H.; Ozcelik, A.; Huang, T.J. Acoustic microfluidics. Annu. Rev. Anal. Chem. 2020, 13, 17–43. [Google Scholar] [CrossRef]
- Gao, Y.; Wu, M.; Lin, Y.; Xu, J. Acoustic microfluidic separation techniques and bioapplications: A review. Micromachines 2020, 11, 921. [Google Scholar] [CrossRef] [PubMed]
- Yeo, L.Y.; Friend, J.R. Surface acoustic wave microfluidics. Annu. Rev. Fluid Mech. 2014, 46, 379–406. [Google Scholar] [CrossRef] [Green Version]
- Wu, Y.; Chattaraj, R.; Ren, Y.; Jiang, H.; Lee, D. Label-free multitarget separation of particles and cells under flow using acoustic, electrophoretic, and hydrodynamic forces. Anal. Chem. 2021, 93, 7635–7646. [Google Scholar] [CrossRef]
- Leibacher, I.; Reichert, P.; Dual, J. Microfluidic droplet handling by bulk acoustic wave (BAW) acoustophoresis. Lab Chip 2015, 15, 2896–2905. [Google Scholar] [CrossRef] [PubMed] [Green Version]
- Viefhues, M. Microfluidics in Biotechnology; Springer: Berlin/Heidelberg, Germany, 2020; pp. 191–209. [Google Scholar]
- Hossan, M.R.; Dutta, D.; Islam, N.; Dutta, P. Electric field driven pumping in microfluidic device. Electrophoresis 2018, 39, 702–731. [Google Scholar] [CrossRef]
- Čemažar, J.; Miklavčič, D.; Kotnik, T. Microfluidic devices for manipulation, modification and characterization of biological cells in electric fields—A review. J. Microelectron. Electron. Compon. Mater 2013, 43, 143–161. [Google Scholar]
- Li, M.; Li, D.; Song, Y.; Li, D. Tunable particle/cell separation across aqueous two-phase system interface by electric pulse in microfluidics. J. Colloid Interface Sci. 2022, 612, 23–34. [Google Scholar] [CrossRef]
- Garcia, P.A.; Ge, Z.; Moran, J.L.; Buie, C.R. Microfluidic screening of electric fields for electroporation. Sci. Rep. 2016, 6, 1–11. [Google Scholar] [CrossRef] [PubMed] [Green Version]
- Kuswandi, B.; Huskens, J.; Verboom, W. Optical sensing systems for microfluidic devices: A review. Anal. Chim. Acta 2007, 601, 141–155. [Google Scholar] [CrossRef]
- Johnson, M.E.; Landers, J.P. Fundamentals and practice for ultrasensitive laser-induced fluorescence detection in microanalytical systems. Electrophoresis 2004, 25, 3513–3527. [Google Scholar] [CrossRef] [PubMed]
- Applegate, R.W., Jr.; Squier, J.; Vestad, T.; Oakey, J.; Marr, D.W.; Bado, P.; Dugan, M.A.; Said, A.A. Microfluidic sorting system based on optical waveguide integration and diode laser bar trapping. Lab Chip 2006, 6, 422–426. [Google Scholar] [CrossRef] [PubMed]
- Gai, H.; Li, Y.; Yeung, E.S. Optical detection systems on microfluidic chips. In Microfluidics: Technologies and Applications; Springer: Berlin/Heidelberg, Germany, 2011; pp. 171–201. [Google Scholar]
- Deal, K.S.; Easley, C.J. Self-regulated, droplet-based sample chopper for microfluidic absorbance detection. Anal. Chem. 2012, 84, 1510–1516. [Google Scholar] [CrossRef]
- Ronkainen, N.J.; Halsall, H.B.; Heineman, W.R. Electrochemical biosensors. Chem. Soc. Rev. 2010, 39, 1747–1763. [Google Scholar] [CrossRef]
- da Silva, E.T.; Souto, D.E.; Barragan, J.T.; de F. Giarola, J.; de Moraes, A.C.; Kubota, L.T. Electrochemical biosensors in point-of-care devices: Recent advances and future trends. ChemElectroChem 2017, 4, 778–794. [Google Scholar] [CrossRef]
- Li, T.; Díaz-Real, J.A.; Holm, T. Design of electrochemical microfluidic detectors: A review. Adv. Mater. Technol. 2021, 6, 2100569. [Google Scholar] [CrossRef]
- Mohan, J.M.; Amreen, K.; Javed, A.; Dubey, S.K.; Goel, S. Emerging trends in miniaturized and microfluidic electrochemical sensing platforms. Curr. Opin. Electrochem. 2022, 33, 100930. [Google Scholar] [CrossRef]
- Hwang, S.; LaFratta, C.N.; Agarwal, V.; Yu, X.; Walt, D.R.; Sonkusale, S. CMOS microelectrode array for electrochemical lab-on-a-chip applications. IEEE Sens. J. 2009, 9, 609–615. [Google Scholar] [CrossRef]
- Khoshmanesh, K.; Tang, S.-Y.; Zhu, J.Y.; Schaefer, S.; Mitchell, A.; Kalantar-Zadeh, K.; Dickey, M.D. Liquid metal enabled microfluidics. Lab Chip 2017, 17, 974–993. [Google Scholar] [CrossRef]
- Kong, T.F.; Peng, W.K.; Luong, T.D.; Nguyen, N.-T.; Han, J. Adhesive-based liquid metal radio-frequency microcoil for magnetic resonance relaxometry measurement. Lab Chip 2012, 12, 287–294. [Google Scholar] [CrossRef] [PubMed] [Green Version]
- Pumera, M.; Merkoçi, A.; Alegret, S. New materials for electrochemical sensing VII. Microfluidic chip platforms. TrAC Trends Anal. Chem. 2006, 25, 219–235. [Google Scholar] [CrossRef]
- Huang, Y.; Mason, A.J. Lab-on-CMOS integration of microfluidics and electrochemical sensors. Lab Chip 2013, 13, 3929–3934. [Google Scholar] [CrossRef] [Green Version]
- Rackus, D.G.; Shamsi, M.H.; Wheeler, A.R. Electrochemistry, biosensors and microfluidics: A convergence of fields. Chem. Soc. Rev. 2015, 44, 5320–5340. [Google Scholar] [CrossRef]
- Woolley, A.T.; Lao, K.; Glazer, A.N.; Mathies, R.A. Capillary electrophoresis chips with integrated electrochemical detection. Anal. Chem. 1998, 70, 684–688. [Google Scholar] [CrossRef]
- Kaur, G.; Tomar, M.; Gupta, V. Development of a microfluidic electrochemical biosensor: Prospect for point-of-care cholesterol monitoring. Sens. Actuators B Chem. 2018, 261, 460–466. [Google Scholar] [CrossRef]
- Senel, M.; Dervisevic, E.; Alhassen, S.; Dervisevic, M.; Alachkar, A.; Cadarso, V.J.; Voelcker, N.H. Microfluidic electrochemical sensor for cerebrospinal fluid and blood dopamine detection in a mouse model of Parkinson’s disease. Anal. Chem. 2020, 92, 12347–12355. [Google Scholar] [CrossRef] [PubMed]
- Xu, T.; Chakrabarty, K. Integrated droplet routing in the synthesis of microfluidic biochips. In Proceedings of the 44th annual Design Automation Conference, San Diego, CA, USA, June 2007; pp. 948–953. [Google Scholar]
- Shamsi, M.H.; Choi, K.; Ng, A.H.; Wheeler, A.R. A digital microfluidic electrochemical immunoassay. Lab Chip 2014, 14, 547–554. [Google Scholar] [CrossRef] [PubMed]
- Rackus, D.G.; Dryden, M.D.; Lamanna, J.; Zaragoza, A.; Lam, B.; Kelley, S.O.; Wheeler, A.R. A digital microfluidic device with integrated nanostructured microelectrodes for electrochemical immunoassays. Lab Chip 2015, 15, 3776–3784. [Google Scholar] [CrossRef]
- Dhiman, T.K.; Lakshmi, G.; Roychoudhury, A.; Jha, S.K.; Solanki, P.R. Ceria-nanoparticles-based microfluidic nanobiochip electrochemical sensor for the detection of ochratoxin-A. ChemistrySelect 2019, 4, 4867–4873. [Google Scholar] [CrossRef]
- Dryden, M.D.; Rackus, D.D.; Shamsi, M.H.; Wheeler, A.R. Integrated digital microfluidic platform for voltammetric analysis. Anal. Chem. 2013, 85, 8809–8816. [Google Scholar] [CrossRef] [PubMed]
- Toh, R.J.; Peng, W.K.; Han, J.; Pumera, M. Haemoglobin electrochemical detection on various reduced graphene surfaces: Well-defined glassy carbon electrode outperforms the graphenoids. RSC Adv. 2014, 4, 8050–8054. [Google Scholar] [CrossRef]
- Kissinger, P.T.; Heineman, W.R. Cyclic voltammetry. J. Chem. Educ. 1983, 60, 702. [Google Scholar] [CrossRef]
- Li, S.; Zhang, C.; Wang, S.; Liu, Q.; Feng, H.; Ma, X.; Guo, J. Electrochemical microfluidics techniques for heavy metal ion detection. Analyst 2018, 143, 4230–4246. [Google Scholar] [CrossRef]
- Gencoglu, A.; Minerick, A.R. Electrochemical detection techniques in micro-and nanofluidic devices. Microfluid. Nanofluidics 2014, 17, 781–807. [Google Scholar] [CrossRef]
- Srikanth, S.; Jayapiriya, U.; Dubey, S.K.; Javed, A.; Goel, S. A lab-on-chip platform for simultaneous culture and electrochemical detection of bacteria. Iscience 2022, 25, 105388. [Google Scholar] [CrossRef]
- Karuwan, C.; Sukthang, K.; Wisitsoraat, A.; Phokharatkul, D.; Patthanasettakul, V.; Wechsatol, W.; Tuantranont, A. Electrochemical detection on electrowetting-on-dielectric digital microfluidic chip. Talanta 2011, 84, 1384–1389. [Google Scholar] [CrossRef]
- Yu, Y.; Chen, J.; Zhou, J. Parallel-plate lab-on-a-chip based on digital microfluidics for on-chip electrochemical analysis. J. Micromech. Microeng. 2013, 24, 015020. [Google Scholar] [CrossRef]
- Grieshaber, D.; MacKenzie, R.; Vörös, J.; Reimhult, E. Electrochemical biosensors-sensor principles and architectures. Sensors 2008, 8, 1400–1458. [Google Scholar] [CrossRef]
- Wang, R.; Wang, X. Sensing of inorganic ions in microfluidic devices. Sens. Actuators B Chem. 2021, 329, 129171. [Google Scholar] [CrossRef]
- Liao, W.-Y.; Weng, C.-H.; Lee, G.-B.; Chou, T.-C. Development and characterization of an all-solid-state potentiometric biosensor array microfluidic device for multiple ion analysis. Lab Chip 2006, 6, 1362–1368. [Google Scholar] [CrossRef]
- Gallardo-Gonzalez, J.; Baraket, A.; Boudjaoui, S.; Metzner, T.; Hauser, F.; Rößler, T.; Krause, S.; Zine, N.; Streklas, A.; Alcácer, A. A fully integrated passive microfluidic Lab-on-a-Chip for real-time electrochemical detection of ammonium: Sewage applications. Sci. Total Environ. 2019, 653, 1223–1230. [Google Scholar] [CrossRef]
- Farzbod, A.; Moon, H. Integration of reconfigurable potentiometric electrochemical sensors into a digital microfluidic platform. Biosens. Bioelectron. 2018, 106, 37–42. [Google Scholar] [CrossRef]
- Sempionatto, J.R.; Martin, A.; García-Carmona, L.; Barfidokht, A.; Kurniawan, J.F.; Moreto, J.R.; Tang, G.; Shin, A.; Liu, X.; Escarpa, A. Skin-worn soft microfluidic potentiometric detection system. Electroanalysis 2019, 31, 239–245. [Google Scholar] [CrossRef]
- Alizadeh, A.; Burns, A.; Lenigk, R.; Gettings, R.; Ashe, J.; Porter, A.; McCaul, M.; Barrett, R.; Diamond, D.; White, P. A wearable patch for continuous monitoring of sweat electrolytes during exertion. Lab Chip 2018, 18, 2632–2641. [Google Scholar] [CrossRef]
- Song, Y.; Cheng, D.; Zhao, L. Microfluidics: Fundamentals, Devices, and Applications; John Wiley & Sons: Weinheim, Germany, 2018. [Google Scholar]
- Lee, I.; Luo, X.; Huang, J.; Cui, X.T.; Yun, M. Detection of cardiac biomarkers using single polyaniline nanowire-based conductometric biosensors. Biosensors 2012, 2, 205–220. [Google Scholar] [CrossRef] [Green Version]
- Venzac, B.; Diakité, M.; Herthnek, D.; Cissé, I.; Bockelmann, U.; Descroix, S.; Malaquin, L.; Viovy, J.-L. On-chip conductometric detection of short DNA sequences via electro-hydrodynamic aggregation. Analyst 2018, 143, 190–199. [Google Scholar] [CrossRef] [Green Version]
- Wu, W.J.; Liu, S.L.; Yung, P.T. Realization of conductometry on a digital microfluidic platform for real-time monitoring of Bacillus atrophaeus endospore germination. IEEE Sens. J. 2016, 16, 2244–2250. [Google Scholar] [CrossRef]
- Lorenz, W.; Schulze, K. Application of transform-impedance spectrometry. J. Electroanal. Chem. 1975, 65, 141–153. [Google Scholar] [CrossRef]
- Magar, H.S.; Hassan, R.Y.; Mulchandani, A. Electrochemical impedance spectroscopy (EIS): Principles, construction, and biosensing applications. Sensors 2021, 21, 6578. [Google Scholar] [CrossRef]
- Millner, P.; Caygill, R.; Conroy, D.; Shahidan, M. Impedance interrogated affinity biosensors for medical applications: Novel targets and mechanistic studies. In Biosensors for Medical Applications; Elsevier: Amsterdam, The Netherlands, 2012; pp. 103–134. [Google Scholar]
- Ben-Yoav, H.; Dykstra, P.H.; Bentley, W.E.; Ghodssi, R. A controlled microfluidic electrochemical lab-on-a-chip for label-free diffusion-restricted DNA hybridization analysis. Biosens. Bioelectron. 2015, 64, 579–585. [Google Scholar] [CrossRef] [PubMed]
- Feng, Y.; Huang, L.; Zhao, P.; Liang, F.; Wang, W. A microfluidic device integrating impedance flow cytometry and electric impedance spectroscopy for high-efficiency single-cell electrical property measurement. Anal. Chem. 2019, 91, 15204–15212. [Google Scholar] [CrossRef]
- Jin, K.; Huang, Q.; Hu, C.; Hu, S.; Li, J. A digital microfluidic system with integrated electrochemical impedance detection arrays. In Proceedings of the Journal of Physics: Conference Series, Harbin, China, 2022; IOP Publishing: Harbin, China, 2022; Volume 2196, p. 012005. [Google Scholar]
- Zhang, Y.; Liu, Y. A digital microfluidic device integrated with electrochemical impedance spectroscopy for cell-based immunoassay. Biosensors 2022, 12, 330. [Google Scholar] [CrossRef] [PubMed]
- Schmidt-Speicher, L.M.; Länge, K. Microfluidic integration for electrochemical biosensor applications. Curr. Opin. Electrochem. 2021, 29, 100755. [Google Scholar] [CrossRef]
- Mohd Asri, M.A.; Nordin, A.N.; Ramli, N. Low-cost and cleanroom-free prototyping of microfluidic and electrochemical biosensors: Techniques in fabrication and bioconjugation. Biomicrofluidics 2021, 15, 061502. [Google Scholar] [CrossRef]
- Mir, M.; Homs, A.; Samitier, J. Integrated electrochemical DNA biosensors for lab-on-a-chip devices. Electrophoresis 2009, 30, 3386–3397. [Google Scholar] [CrossRef]
- Zimmerman, W.B. Electrochemical microfluidics. Chem. Eng. Sci. 2011, 66, 1412–1425. [Google Scholar] [CrossRef]
- Ates, H.C.; Nguyen, P.Q.; Gonzalez-Macia, L.; Morales-Narváez, E.; Güder, F.; Collins, J.J.; Dincer, C. End-to-end design of wearable sensors. Nat. Rev. Mater. 2022, 7, 887–907. [Google Scholar] [CrossRef]
- Bariya, M.; Nyein, H.Y.Y.; Javey, A. Wearable sweat sensors. Nat. Electron. 2018, 1, 160–171. [Google Scholar] [CrossRef]
- Chen, G.; Zheng, J.; Liu, L.; Xu, L. Application of microfluidics in wearable devices. Small Methods 2019, 3, 1900688. [Google Scholar] [CrossRef]
- Yeo, J.C.; Lim, C.T. Emergence of microfluidic wearable technologies. Lab Chip 2016, 16, 4082–4090. [Google Scholar] [CrossRef] [PubMed]
- Jo, S.; Sung, D.; Kim, S.; Koo, J. A review of wearable biosensors for sweat analysis. Biomed. Eng. Lett. 2021, 11, 117–129. [Google Scholar] [CrossRef]
- Ma, B.; Chi, J.; Xu, C.; Ni, Y.; Zhao, C.; Liu, H. Wearable capillary microfluidics for continuous perspiration sensing. Talanta 2020, 212, 120786. [Google Scholar] [CrossRef]
- Koh, A.; Kang, D.; Xue, Y.; Lee, S.; Pielak, R.M.; Kim, J.; Hwang, T.; Min, S.; Banks, A.; Bastien, P. A soft, wearable microfluidic device for the capture, storage, and colorimetric sensing of sweat. Sci. Transl. Med. 2016, 8, 366ra165. [Google Scholar] [CrossRef] [Green Version]
- Ozer, T.; McMahon, C.; Henry, C.S. Advances in paper-based analytical devices. Annu. Rev. Anal. Chem. 2020, 13, 85–109. [Google Scholar] [CrossRef] [PubMed] [Green Version]
- Economou, A.; Kokkinos, C.; Prodromidis, M. Flexible plastic, paper and textile lab-on-a chip platforms for electrochemical biosensing. Lab Chip 2018, 18, 1812–1830. [Google Scholar] [CrossRef] [PubMed]
- Nie, C.; Frijns, A.; Zevenbergen, M.; den Toonder, J. An integrated flex-microfluidic-Si chip device towards sweat sensing applications. Sens. Actuators B Chem. 2016, 227, 427–437. [Google Scholar] [CrossRef]
- Yang, X.; Yao, H.; Zhao, G.; Ameer, G.A.; Sun, W.; Yang, J.; Mi, S. Flexible, wearable microfluidic contact lens with capillary networks for tear diagnostics. J. Mater. Sci. 2020, 55, 9551–9561. [Google Scholar] [CrossRef]
- Shay, T.; Dickey, M.D.; Velev, O.D. Hydrogel-enabled osmotic pumping for microfluidics: Towards wearable human-device interfaces. Lab Chip 2017, 17, 710–716. [Google Scholar] [CrossRef]
- Saha, T.; Fang, J.; Mukherjee, S.; Dickey, M.D.; Velev, O.D. Wearable osmotic-capillary patch for prolonged sweat harvesting and sensing. ACS Appl. Mater. Interfaces 2021, 13, 8071–8081. [Google Scholar] [CrossRef] [PubMed]
- Kim, S.B.; Zhang, Y.; Won, S.M.; Bandodkar, A.J.; Sekine, Y.; Xue, Y.; Koo, J.; Harshman, S.W.; Martin, J.A.; Park, J.M. Super-absorbent polymer valves and colorimetric chemistries for time-sequenced discrete sampling and chloride analysis of sweat via skin-mounted soft microfluidics. Small 2018, 14, 1703334. [Google Scholar] [CrossRef] [PubMed]
- Choi, J.; Bandodkar, A.J.; Reeder, J.T.; Ray, T.R.; Turnquist, A.; Kim, S.B.; Nyberg, N.; Hourlier-Fargette, A.; Model, J.B.; Aranyosi, A.J. Soft, skin-integrated multifunctional microfluidic systems for accurate colorimetric analysis of sweat biomarkers and temperature. ACS Sens. 2019, 4, 379–388. [Google Scholar] [CrossRef] [PubMed]
- Kim, S.B.; Koo, J.; Yoon, J.; Hourlier-Fargette, A.; Lee, B.; Chen, S.; Jo, S.; Choi, J.; Oh, Y.S.; Lee, G. Soft, skin-interfaced microfluidic systems with integrated enzymatic assays for measuring the concentration of ammonia and ethanol in sweat. Lab Chip 2020, 20, 84–92. [Google Scholar] [CrossRef] [PubMed]
- Ye, S.; Feng, S.; Huang, L.; Bian, S. Recent progress in wearable biosensors: From healthcare monitoring to sports analytics. Biosensors 2020, 10, 205. [Google Scholar] [CrossRef]
- Tabasum, H.; Gill, N.; Mishra, R.; Lone, S. Wearable microfluidic-based e-skin sweat sensors. RSC Adv. 2022, 12, 8691–8707. [Google Scholar] [CrossRef]
- Jia, W.; Bandodkar, A.J.; Valdés-Ramírez, G.; Windmiller, J.R.; Yang, Z.; Ramírez, J.; Chan, G.; Wang, J. Electrochemical tattoo biosensors for real-time noninvasive lactate monitoring in human perspiration. Anal. Chem. 2013, 85, 6553–6560. [Google Scholar] [CrossRef]
- Gao, W.; Emaminejad, S.; Nyein, H.Y.Y.; Challa, S.; Chen, K.; Peck, A.; Fahad, H.M.; Ota, H.; Shiraki, H.; Kiriya, D. Fully integrated wearable sensor arrays for multiplexed in situ perspiration analysis. Nature 2016, 529, 509–514. [Google Scholar]
- Bandodkar, A.J.; Molinnus, D.; Mirza, O.; Guinovart, T.; Windmiller, J.R.; Valdés-Ramírez, G.; Andrade, F.J.; Schöning, M.J.; Wang, J. Epidermal tattoo potentiometric sodium sensors with wireless signal transduction for continuous non-invasive sweat monitoring. Biosens. Bioelectron. 2014, 54, 603–609. [Google Scholar] [CrossRef]
- Zhang, S.; Zahed, M.A.; Sharifuzzaman, M.; Yoon, S.; Hui, X.; Barman, S.C.; Sharma, S.; Yoon, H.S.; Park, C.; Park, J.Y. A wearable battery-free wireless and skin-interfaced microfluidics integrated electrochemical sensing patch for on-site biomarkers monitoring in human perspiration. Biosens. Bioelectron. 2021, 175, 112844. [Google Scholar] [CrossRef]
- Kim, S.B.; Lee, K.; Raj, M.S.; Lee, B.; Reeder, J.T.; Koo, J.; Hourlier-Fargette, A.; Bandodkar, A.J.; Won, S.M.; Sekine, Y. Soft, skin-interfaced microfluidic systems with wireless, battery-free electronics for digital, real-time tracking of sweat loss and electrolyte composition. Small 2018, 14, 1802876. [Google Scholar] [CrossRef] [PubMed]
- Padash, M.; Enz, C.; Carrara, S. Microfluidics by additive manufacturing for wearable biosensors: A review. Sensors 2020, 20, 4236. [Google Scholar] [CrossRef] [PubMed]
- Sonner, Z.; Wilder, E.; Heikenfeld, J.; Kasting, G.; Beyette, F.; Swaile, D.; Sherman, F.; Joyce, J.; Hagen, J.; Kelley-Loughnane, N. The microfluidics of the eccrine sweat gland, including biomarker partitioning, transport, and biosensing implications. Biomicrofluidics 2015, 9, 031301. [Google Scholar] [CrossRef] [PubMed] [Green Version]
- Ghaffari, R.; Rogers, J.A.; Ray, T.R. Recent progress, challenges, and opportunities for wearable biochemical sensors for sweat analysis. Sens. Actuators B Chem. 2021, 332, 129447. [Google Scholar]
- Kim, J.; Campbell, A.S.; Wang, J. Wearable non-invasive epidermal glucose sensors: A review. Talanta 2018, 177, 163–170. [Google Scholar] [CrossRef] [PubMed]
- Bandodkar, A.J.; Gutruf, P.; Choi, J.; Lee, K.; Sekine, Y.; Reeder, J.T.; Jeang, W.J.; Aranyosi, A.J.; Lee, S.P.; Model, J.B. Battery-free, skin-interfaced microfluidic/electronic systems for simultaneous electrochemical, colorimetric, and volumetric analysis of sweat. Sci. Adv. 2019, 5, eaav3294. [Google Scholar] [CrossRef] [PubMed] [Green Version]
- San Nah, J.; Barman, S.C.; Zahed, M.A.; Sharifuzzaman, M.; Yoon, H.; Park, C.; Yoon, S.; Zhang, S.; Park, J.Y. A wearable microfluidics-integrated impedimetric immunosensor based on Ti3C2Tx MXene incorporated laser-burned graphene for noninvasive sweat cortisol detection. Sens. Actuators B Chem. 2021, 329, 129206. [Google Scholar]
- Zhang, Y.; Guo, H.; Kim, S.B.; Wu, Y.; Ostojich, D.; Park, S.H.; Wang, X.; Weng, Z.; Li, R.; Bandodkar, A.J. Passive sweat collection and colorimetric analysis of biomarkers relevant to kidney disorders using a soft microfluidic system. Lab Chip 2019, 19, 1545–1555. [Google Scholar] [CrossRef]
- Tiwari, N.; Chatterjee, S.; Kaswan, K.; Chung, J.-H.; Fan, K.-P.; Lin, Z.-H. Recent advancements in sampling, power management strategies and development in applications for non-invasive wearable electrochemical sensors. J. Electroanal. Chem. 2022, 907, 116064. [Google Scholar] [CrossRef]
- Kim, J.; Campbell, A.S.; de Ávila, B.E.-F.; Wang, J. Wearable biosensors for healthcare monitoring. Nat. Biotechnol. 2019, 37, 389–406. [Google Scholar] [CrossRef]
- Kim, J.; Kim, M.; Lee, M.-S.; Kim, K.; Ji, S.; Kim, Y.-T.; Park, J.; Na, K.; Bae, K.-H.; Kyun Kim, H. Wearable smart sensor systems integrated on soft contact lenses for wireless ocular diagnostics. Nat. Commun. 2017, 8, 14997. [Google Scholar] [CrossRef] [Green Version]
- Sempionatto, J.R.; Brazaca, L.C.; García-Carmona, L.; Bolat, G.; Campbell, A.S.; Martin, A.; Tang, G.; Shah, R.; Mishra, R.K.; Kim, J. Eyeglasses-based tear biosensing system: Non-invasive detection of alcohol, vitamins and glucose. Biosens. Bioelectron. 2019, 137, 161–170. [Google Scholar] [CrossRef] [PubMed]
- de Castro, L.F.; de Freitas, S.V.; Duarte, L.C.; de Souza, J.A.C.; Paixão, T.R.; Coltro, W.K. Salivary diagnostics on paper microfluidic devices and their use as wearable sensors for glucose monitoring. Anal. Bioanal. Chem. 2019, 411, 4919–4928. [Google Scholar] [PubMed]
- Bian, S.; Ye, S.; Yang, S. Application prospects for wearable body surface microfluidic system in sports. Wearable Technol. 2022, 3, 72–84. [Google Scholar] [CrossRef]
- Lee, H.; Choi, T.K.; Lee, Y.B.; Cho, H.R.; Ghaffari, R.; Wang, L.; Choi, H.J.; Chung, T.D.; Lu, N.; Hyeon, T. A graphene-based electrochemical device with thermoresponsive microneedles for diabetes monitoring and therapy. Nat. Nanotechnol. 2016, 11, 566–572. [Google Scholar] [CrossRef] [PubMed]
- Di, J.; Yao, S.; Ye, Y.; Cui, Z.; Yu, J.; Ghosh, T.K.; Zhu, Y.; Gu, Z. Stretch-triggered drug delivery from wearable elastomer films containing therapeutic depots. ACS Nano 2015, 9, 9407–9415. [Google Scholar] [CrossRef]
- Yi-Qiang, F.; Feng, G.; Mei, W.; Zhuang, J.; Gang, T.; ZHANG, Y.-J. Recent development of wearable microfluidics applied in body fluid testing and drug delivery. Chin. J. Anal. Chem. 2017, 45, 455–463. [Google Scholar]
- Mahato, K.; Wang, J. Electrochemical sensors: From the bench to the skin. Sens. Actuators B Chem. 2021, 344, 130178. [Google Scholar] [CrossRef]
- Choi, R.Y.; Coyner, A.S.; Kalpathy-Cramer, J.; Chiang, M.F.; Campbell, J.P. Introduction to machine learning, neural networks, and deep learning. Transl. Vis. Sci. Technol. 2020, 9, 14. [Google Scholar]
- Janiesch, C.; Zschech, P.; Heinrich, K. Machine learning and deep learning. Electron. Mark. 2021, 31, 685–695. [Google Scholar] [CrossRef]
- Haenlein, M.; Kaplan, A. A brief history of artificial intelligence: On the past, present, and future of artificial intelligence. Calif. Manag. Rev. 2019, 61, 5–14. [Google Scholar] [CrossRef]
- Bini, S.A. Artificial intelligence, machine learning, deep learning, and cognitive computing: What do these terms mean and how will they impact health care? J. Arthroplast. 2018, 33, 2358–2361. [Google Scholar] [CrossRef]
- Hinton, G.E.; Osindero, S.; Teh, Y.-W. A fast learning algorithm for deep belief nets. Neural Comput. 2006, 18, 1527–1554. [Google Scholar] [CrossRef] [PubMed]
- Sarker, I.H. Deep learning: A comprehensive overview on techniques, taxonomy, applications and research directions. SN Comput. Sci. 2021, 2, 420. [Google Scholar] [PubMed]
- Deng, L.; Yu, D. Deep learning: Methods and applications. In Foundations and Trends® in Signal Processing; Now Foundations and Trends, nowpublishers.com: Boston, MA, USA, 2014; Volume 7, pp. 197–387. [Google Scholar]
- Dabbagh, S.R.; Rabbi, F.; Doğan, Z.; Yetisen, A.K.; Tasoglu, S. Machine learning-enabled multiplexed microfluidic sensors. Biomicrofluidics 2020, 14, 061506. [Google Scholar] [CrossRef] [PubMed]
- LeCun, Y.; Bengio, Y.; Hinton, G. Deep learning. Nature 2015, 521, 436–444. [Google Scholar] [CrossRef]
- Guo, B.; Lei, C.; Kobayashi, H.; Ito, T.; Yalikun, Y.; Jiang, Y.; Tanaka, Y.; Ozeki, Y.; Goda, K. High-throughput, label-free, single-cell, microalgal lipid screening by machine-learning-equipped optofluidic time-stretch quantitative phase microscopy. Cytom. Part A 2017, 91, 494–502. [Google Scholar] [CrossRef] [Green Version]
- Jiang, Y.; Lei, C.; Yasumoto, A.; Kobayashi, H.; Aisaka, Y.; Ito, T.; Guo, B.; Nitta, N.; Kutsuna, N.; Ozeki, Y. Label-free detection of aggregated platelets in blood by machine-learning-aided optofluidic time-stretch microscopy. Lab Chip 2017, 17, 2426–2434. [Google Scholar] [CrossRef]
- Singh, D.K.; Ahrens, C.C.; Li, W.; Vanapalli, S.A. Label-free, high-throughput holographic screening and enumeration of tumor cells in blood. Lab Chip 2017, 17, 2920–2932. [Google Scholar] [CrossRef]
- Xu, X.; Zhao, L.; Xue, Q.; Fan, J.; Hu, Q.; Tang, C.; Shi, H.; Hu, B.; Tian, J. Dynamic liquid surface enhanced Raman scattering platform based on soft tubular microfluidics for label-free cell detection. Anal. Chem. 2019, 91, 7973–7979. [Google Scholar] [CrossRef] [Green Version]
- Manak, M.S.; Varsanik, J.S.; Hogan, B.J.; Whitfield, M.J.; Su, W.R.; Joshi, N.; Steinke, N.; Min, A.; Berger, D.; Saphirstein, R.J. Live-cell phenotypic-biomarker microfluidic assay for the risk stratification of cancer patients via machine learning. Nat. Biomed. Eng. 2018, 2, 761–772. [Google Scholar] [CrossRef]
- Wang, C.; Wang, C.; Wu, Y.; Gao, J.; Han, Y.; Chu, Y.; Qiang, L.; Qiu, J.; Gao, Y.; Wang, Y. High-Throughput, Living Single-Cell, Multiple Secreted Biomarker Profiling Using Microfluidic Chip and Machine Learning for Tumor Cell Classification. Adv. Healthc. Mater. 2022, 11, 2102800. [Google Scholar] [CrossRef] [PubMed]
- Alvarez, M.; Rahmani, E.; Jew, B.; Garske, K.M.; Miao, Z.; Benhammou, J.N.; Ye, C.J.; Pisegna, J.R.; Pietiläinen, K.H.; Halperin, E. Enhancing droplet-based single-nucleus RNA-seq resolution using the semi-supervised machine learning classifier DIEM. Sci. Rep. 2020, 10, 11019. [Google Scholar] [CrossRef]
- Desir, P.; Chen, T.-Y.; Bracconi, M.; Saha, B.; Maestri, M.; Vlachos, D.G. Experiments and computations of microfluidic liquid–liquid flow patterns. React. Chem. Eng. 2020, 5, 39–50. [Google Scholar] [CrossRef]
- Peng, W.K.; Ng, T.-T.; Loh, T.P. Machine learning assistive rapid, label-free molecular phenotyping of blood with two-dimensional NMR correlational spectroscopy. Commun. Biol. 2020, 3, 535. [Google Scholar] [CrossRef]
- Abe, T.; Oh-Hara, S.; Ukita, Y. Adoption of reinforcement learning for the intelligent control of a microfluidic peristaltic pump. Biomicrofluidics 2021, 15, 034101. [Google Scholar] [CrossRef]
- Liang, T.-C.; Zhong, Z. Adaptive droplet routing in digital microfluidic biochips using deep reinforcement learning. In Proceedings of the 37th International Conference on Machine Learning, Conference, Virtual Format, 2020; pp. 6050–6060. [Google Scholar]
- Dressler, O.J.; Howes, P.D.; Choo, J.; deMello, A.J. Reinforcement learning for dynamic microfluidic control. ACS Omega 2018, 3, 10084–10091. [Google Scholar] [CrossRef]
- Albawi, S.; Mohammed, T.A.; Al-Zawi, S. Understanding of a convolutional neural network. In Proceedings of the 2017 International Conference on Engineering and Technology (ICET), Antalya, Turkey, 21–23 August 2017; IEEE: Piscataway, NJ, USA, 2017; pp. 1–6. [Google Scholar]
- LeCun, Y.; Bottou, L.; Bengio, Y.; Haffner, P. Gradient-based learning applied to document recognition. Proc. IEEE 1998, 86, 2278–2324. [Google Scholar] [CrossRef] [Green Version]
- Hashemzadeh, H.; Shojaeilangari, S.; Allahverdi, A.; Rothbauer, M.; Ertl, P.; Naderi-Manesh, H. A combined microfluidic deep learning approach for lung cancer cell high throughput screening toward automatic cancer screening applications. Sci. Rep. 2021, 11, 1–10. [Google Scholar] [CrossRef] [PubMed]
- Rizzuto, V.; Mencattini, A.; Álvarez-González, B.; Di Giuseppe, D.; Martinelli, E.; Beneitez-Pastor, D.; Mañú-Pereira, M.d.M.; Lopez-Martinez, M.J.; Samitier, J. Combining microfluidics with machine learning algorithms for RBC classification in rare hereditary hemolytic anemia. Sci. Rep. 2021, 11, 13553. [Google Scholar] [CrossRef] [PubMed]
- Ghafari, M.; Clark, J.; Guo, H.-B.; Yu, R.; Sun, Y.; Dang, W.; Qin, H. Complementary performances of convolutional and capsule neural networks on classifying microfluidic images of dividing yeast cells. PLoS ONE 2021, 16, e0246988. [Google Scholar] [CrossRef] [PubMed]
- Lee, K.; Kim, S.-E.; Doh, J.; Kim, K.; Chung, W.K. User-friendly image-activated microfluidic cell sorting technique using an optimized, fast deep learning algorithm. Lab Chip 2021, 21, 1798–1810. [Google Scholar] [CrossRef] [PubMed]
- Honrado, C.; McGrath, J.S.; Reale, R.; Bisegna, P.; Swami, N.S.; Caselli, F. A neural network approach for real-time particle/cell characterization in microfluidic impedance cytometry. Anal. Bioanal. Chem. 2020, 412, 3835–3845. [Google Scholar] [CrossRef] [PubMed]
- Kobayashi, H.; Lei, C.; Wu, Y.; Huang, C.-J.; Yasumoto, A.; Jona, M.; Li, W.; Wu, Y.; Yalikun, Y.; Jiang, Y. Intelligent whole-blood imaging flow cytometry for simple, rapid, and cost-effective drug-susceptibility testing of leukemia. Lab Chip 2019, 19, 2688–2698. [Google Scholar] [CrossRef] [PubMed]
- Constantinou, I.; Jendrusch, M.; Aspert, T.; Görlitz, F.; Schulze, A.; Charvin, G.; Knop, M. Self-learning microfluidic platform for single-cell imaging and classification in flow. Micromachines 2019, 10, 311. [Google Scholar] [CrossRef] [Green Version]
- Gopakumar, G.; Babu, K.H.; Mishra, D.; Gorthi, S.S.; Subrahmanyam, G.R.S. Cytopathological image analysis using deep-learning networks in microfluidic microscopy. JOSA. A Optical. Soc. Am. 2017, 34, 111–121. [Google Scholar] [CrossRef]
- Sarker, I.H. Data science and analytics: An overview from data-driven smart computing, decision-making and applications perspective. SN Comput. Sci. 2021, 2, 377. [Google Scholar] [CrossRef]
- Zheng, J.; Cole, T.; Zhang, Y.; Kim, J.; Tang, S.-Y. Exploiting machine learning for bestowing intelligence to microfluidics. Biosens. Bioelectron. 2021, 194, 113666. [Google Scholar] [CrossRef]
- Sackmann, E.K.; Fulton, A.L.; Beebe, D.J. The present and future role of microfluidics in biomedical research. Nature 2014, 507, 181–189. [Google Scholar] [CrossRef]
- Nahavandi, D.; Alizadehsani, R.; Khosravi, A.; Acharya, U.R. Application of artificial intelligence in wearable devices: Opportunities and challenges. Comput. Methods Programs Biomed. 2022, 213, 106541. [Google Scholar] [CrossRef]

Disclaimer/Publisher’s Note: The statements, opinions and data contained in all publications are solely those of the individual author(s) and contributor(s) and not of MDPI and/or the editor(s). MDPI and/or the editor(s) disclaim responsibility for any injury to people or property resulting from any ideas, methods, instructions or products referred to in the content. |
© 2023 by the authors. Licensee MDPI, Basel, Switzerland. This article is an open access article distributed under the terms and conditions of the Creative Commons Attribution (CC BY) license (https://creativecommons.org/licenses/by/4.0/).
Share and Cite
Ma, X.; Guo, G.; Wu, X.; Wu, Q.; Liu, F.; Zhang, H.; Shi, N.; Guan, Y. Advances in Integration, Wearable Applications, and Artificial Intelligence of Biomedical Microfluidics Systems. Micromachines 2023, 14, 972. https://doi.org/10.3390/mi14050972
Ma X, Guo G, Wu X, Wu Q, Liu F, Zhang H, Shi N, Guan Y. Advances in Integration, Wearable Applications, and Artificial Intelligence of Biomedical Microfluidics Systems. Micromachines. 2023; 14(5):972. https://doi.org/10.3390/mi14050972
Chicago/Turabian StyleMa, Xingfeng, Gang Guo, Xuanye Wu, Qiang Wu, Fangfang Liu, Hua Zhang, Nan Shi, and Yimin Guan. 2023. "Advances in Integration, Wearable Applications, and Artificial Intelligence of Biomedical Microfluidics Systems" Micromachines 14, no. 5: 972. https://doi.org/10.3390/mi14050972