
A Review of Machine Learning Methods Recently Applied to FTIR Spectroscopy Data for the Analysis of Human Blood Cells


Abstract
:1. Introduction
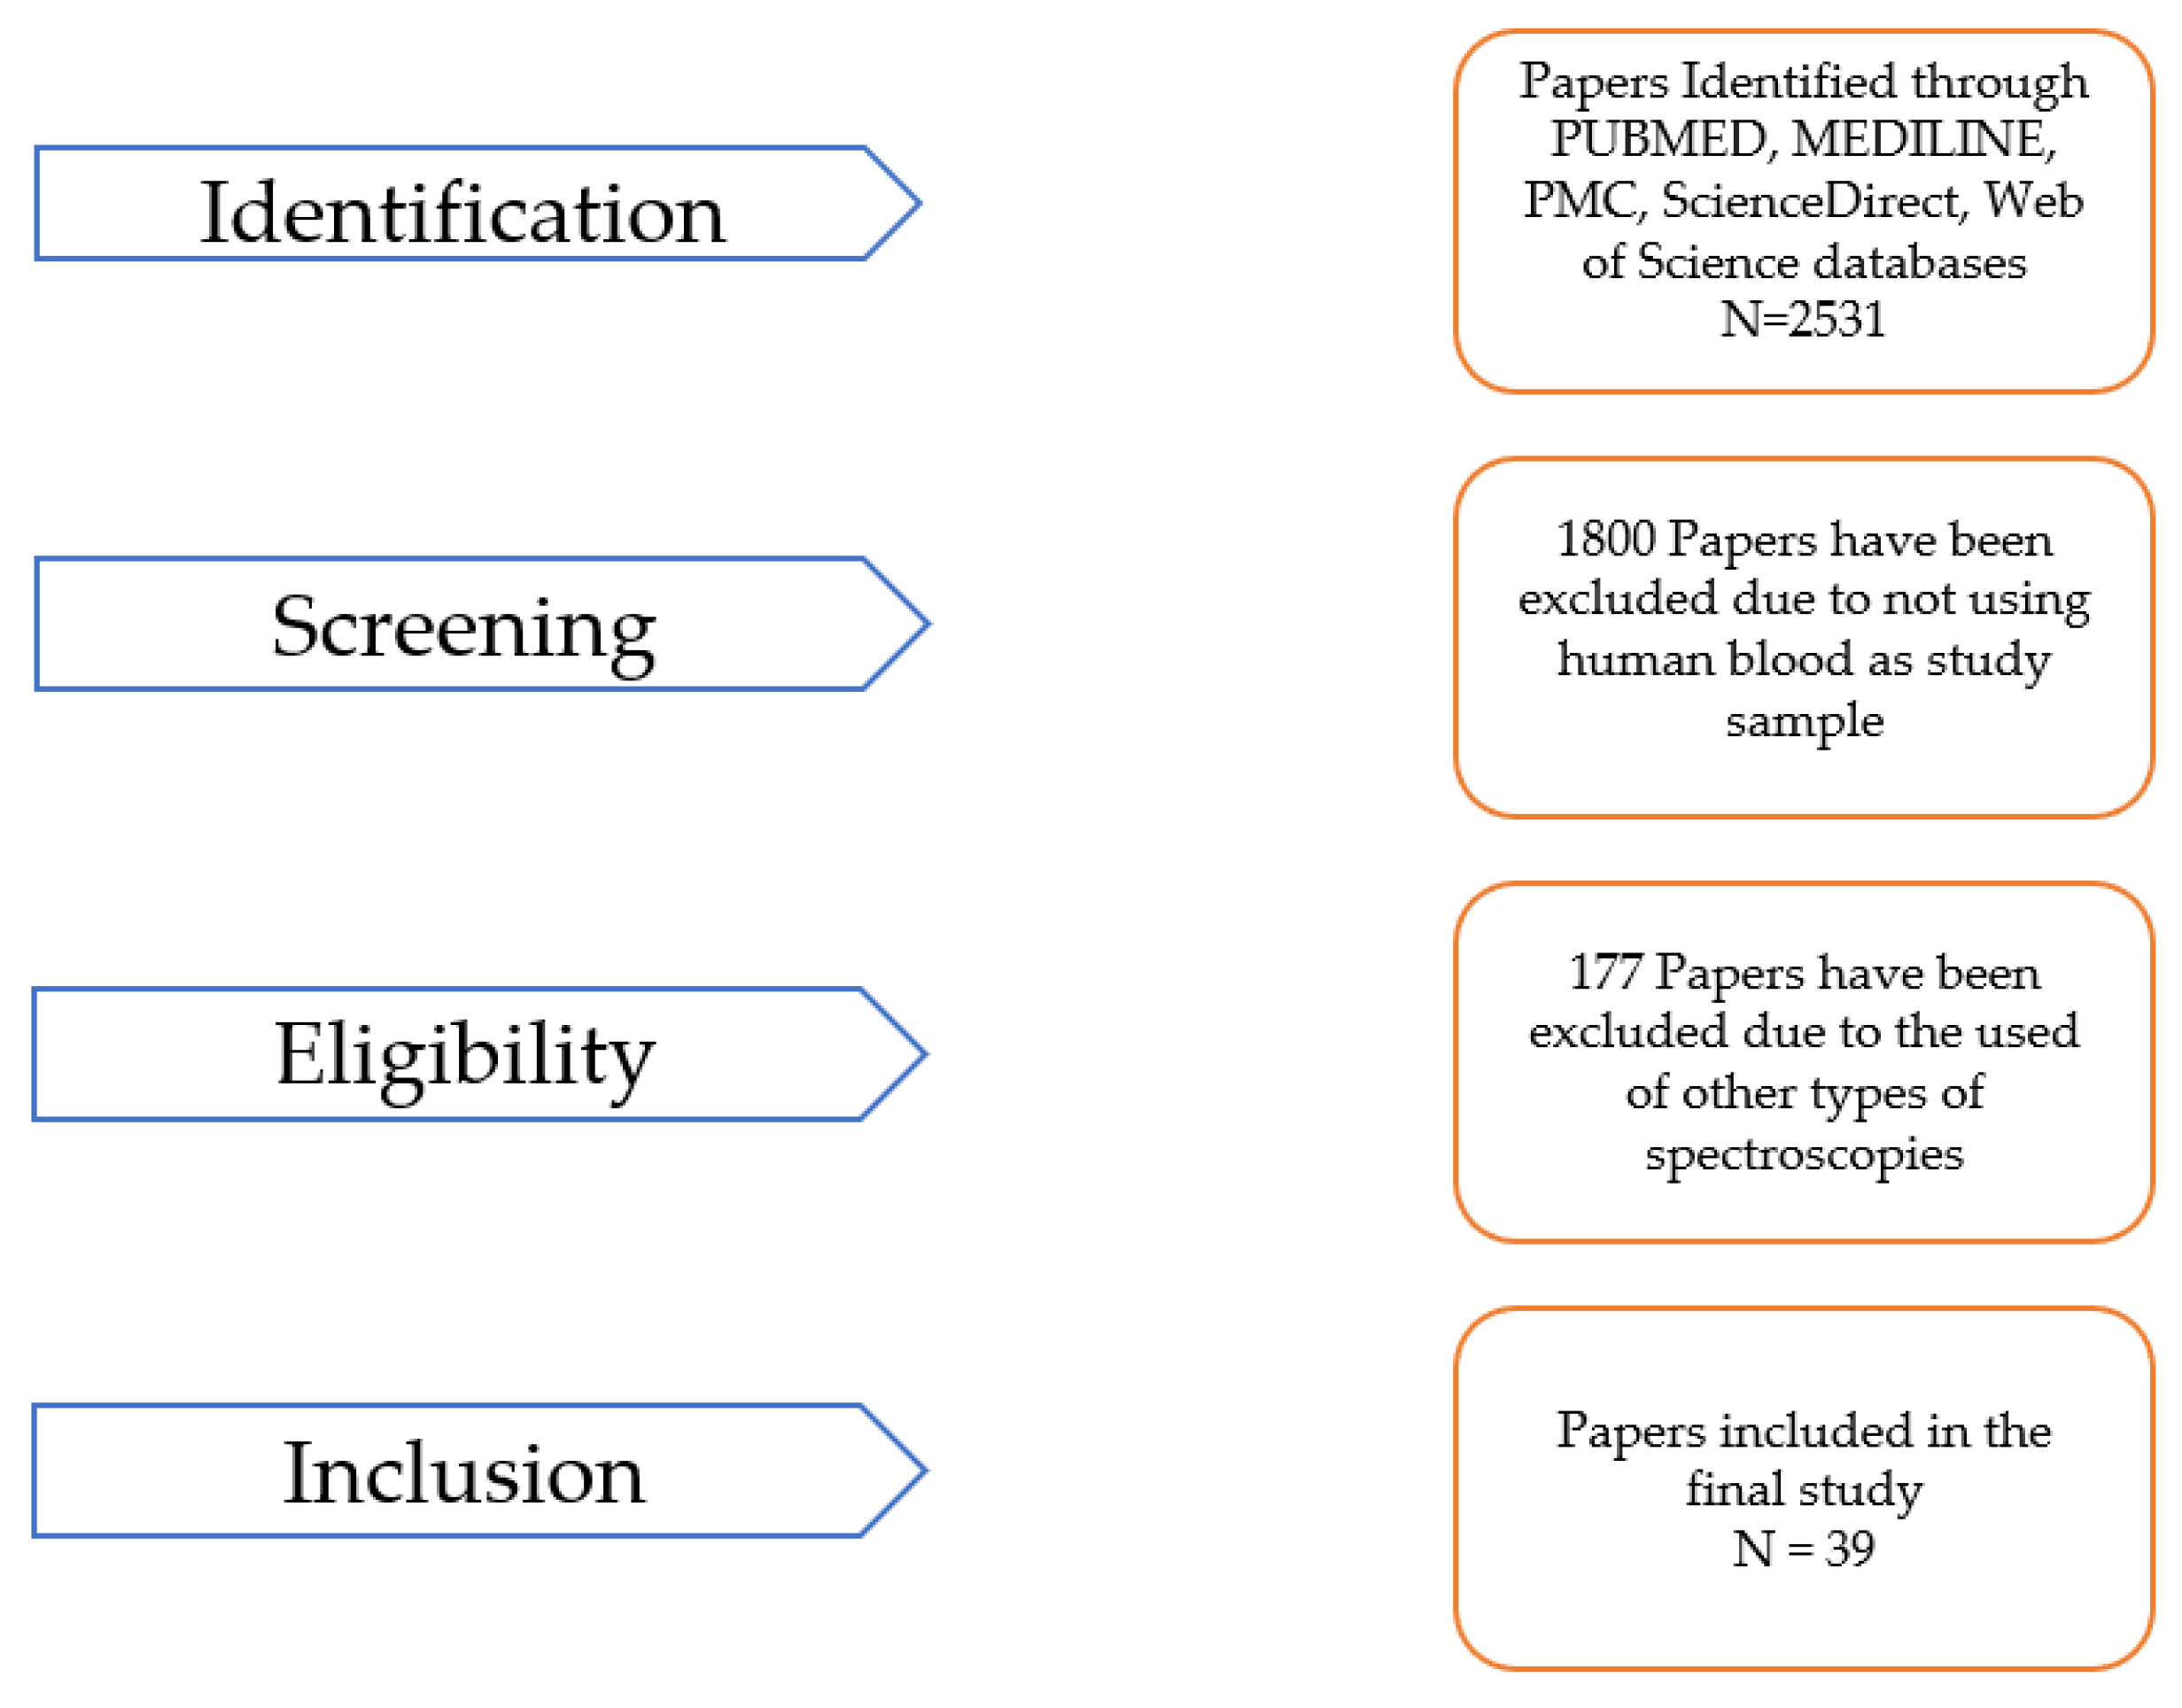
2. Method
3. Results
3.1. Summary of the Eligible Publications
3.2. ML Methods, Metrics, and Internal Validation in the Selected Papers
3.3. Internal and External Validation
3.4. Strengths and Weaknesses
4. Discussion
5. Conclusions
Author Contributions
Funding
Data Availability Statement
Conflicts of Interest
References
- Talukdar, K.; Bora, K.; Mahanta, L.B.; Das, A.K. A comparative assessment of deep object detection models for blood smear analysis. Tissue Cell 2022, 76, 101761. [Google Scholar] [CrossRef]
- Pfeil, J.; Nechyporenko, A.; Frohme, M.; Hufert, F.T.; Schulze, K. Examination of blood samples using deep learning and mobile microscopy. BMC Bioinform. 2022, 23, 65. [Google Scholar] [CrossRef] [PubMed]
- Lee, S.J.; Chen, P.Y.; Lin, J.W. Complete Blood Cell Detection and Counting Based on Deep Neural Networks. Appl. Sci. 2022, 12, 8140. [Google Scholar] [CrossRef]
- Alazzam, M.B.; Tayyib, N.; Alshawwa, S.Z.; Ahmed, M.K. Nursing Care Systematization with Case-Based Reasoning and Artificial Intelligence. J. Healthc. Eng. 2022, 2022, 1959371. [Google Scholar] [CrossRef]
- Alhazmi, L. Detection of WBC, RBC, and Platelets in Blood Samples Using Deep Learning. Biomed Res. Int. 2022, 2022, 1499546. [Google Scholar] [CrossRef]
- Qin, Y.; Wang, Y.; Meng, F.; Feng, M.; Zhao, X.; Gao, C.; Luo, J. Identification of biomarkers by machine learning classifiers to assist diagnose rheumatoid arthritis-associated interstitial lung disease. Arthritis Res. Ther. 2022, 24, 115. [Google Scholar] [CrossRef] [PubMed]
- Yue, F.; Chen, C.; Yan, Z.; Guo, Z.; Zhang, Z.; Chen, Z.; Zhang, F.; Lv, X. Fourier transform infrared spectroscopy combined with deep learning and data enhancement for quick diagnosis of abnormal thyroid function. Photodiagnosis Photodyn. Ther. 2020, 32, 101923. [Google Scholar] [CrossRef]
- Wong, L.-W.; Mak, S.-H.; Goh, B.-H.; Lee, W.-L. The Convergence of FTIR and EVs: Emergence Strategy for Non-Invasive Cancer Markers Discovery. Diagnostics 2023, 13, 22. [Google Scholar] [CrossRef]
- Gajjar, K.; Trevisan, J.; Owens, G.; Keating, P.J.; Wood, N.J.; Stringfellow, H.F.; Martin-Hirsch, P.L.; Martin, F.L. Fourier-transform infrared spectroscopy coupled with a classification machine for the analysis of blood plasma or serum: A novel diagnostic approach for ovarian cancer. Analyst 2013, 138, 3917–3926. [Google Scholar] [CrossRef]
- Ellis, D.I.; Broadhurst, D.; Goodacre, R. Rapid and quantitative detection of the microbial spoilage of beef by Fourier transform infrared spectroscopy and machine learning. Anal. Chim. Acta 2004, 514, 193–201. [Google Scholar] [CrossRef]
- Sitole, L.; Steffens, F.; Krüger TP, J.; Meyer, D. Mid-ATR-FTIR spectroscopic profiling of HIV/AIDS sera for novel systems diagnostics in global health. OMICS 2014, 18, 513–523. [Google Scholar] [CrossRef] [PubMed]
- Ellis, L.D.; Buteau, S.; Hames, S.G.; Thompson, L.M.; Hall, D.S.; Dahn, J.R. A New Method for Determining the Concentration of Electrolyte Components in Lithium-Ion Cells, Using Fourier Transform Infrared Spectroscopy and Machine Learning. J. Electrochem. Soc. 2018, 165, A256–A262. [Google Scholar] [CrossRef]
- Mwanga, E.P.; Minja, E.G.; Mrimi, E.; Jiménez, M.G.; Swai, J.K.; Abbasi, S.; Ngowo, H.S.; Siria, D.J.; Mapua, S.; Stica, C.; et al. Detection of malaria parasites in dried human blood spots using mid-infrared spectroscopy and logistic regression analysis. Malar. J. 2019, 18, 341. [Google Scholar] [CrossRef] [PubMed]
- Heraud, P.; Chatchawal, P.; Wongwattanakul, M.; Tippayawat, P.; Doerig, C.; Jearanaikoon, P.; Perez-Guaita, D.; Wood, B.R. Infrared spectroscopy coupled to cloud-based data management as a tool to diagnose malaria: A pilot study in a malaria-endemic country. Malar. J. 2019, 18, 348–411. [Google Scholar] [CrossRef]
- Toraman, S.; Girgin, M.; Üstündağ, B.; Türkoğlu, İ. Classification of the likelihood of colon cancer with machine learning techniques using FTIR signals obtained from plasma. Turk. J. Electr. Eng. Comput. Sci. 2019, 27, 1765–1779. [Google Scholar] [CrossRef]
- Agbaria, A.H.; Rosen, G.B.; Lapidot, I.; Rich, D.H.; Mordechai, S.; Kapelushnik, J.; Huleihel, M.; Salman, A. Rapid diagnosis of infection etiology in febrile pediatric oncology patients using infrared spectroscopy of leukocytes. J. Biophotonics 2020, 13, e201900215. [Google Scholar] [CrossRef]
- Salman, A.; Lapidot, I.; Shufan, E.; Agbaria, A.H.; Katz, B.-S.P.; Mordechai, S. Potential of infrared microscopy to differentiate between dementia with Lewy bodies and Alzheimer’s diseases using peripheral blood samples and machine learning algorithms. J. Biomed Opt. 2020, 25, 046501. [Google Scholar] [CrossRef]
- Guleken, Z.; Kuruca, S.E.; Ünübol, B.; Toraman, S.; Bilici, R.; Sarıbal, D.; Gunduz, O.; Depciuch, J. Biochemical assay and spectroscopic analysis of oxidative/antioxidative parameters in the blood and serum of substance use disorders patients. A methodological comparison study. Spectrochim. Acta A Mol. Biomol. Spectrosc. 2020, 240, 118625. [Google Scholar] [CrossRef]
- Korb, E.; Bağcıoğlu, M.; Garner-Spitzer, E.; Wiedermann, U.; Ehling-Schulz, M.; Schabussova, I. Machine learning-empowered ftir spectroscopy serum analysis stratifies healthy, allergic, and sit-treated mice and humans. Biomolecules 2020, 10, 1058. [Google Scholar] [CrossRef]
- Agbaria, A.H.; Beck, G.; Lapidot, I.; Rich, D.H.; Kapelushnik, J.; Mordechai, S.; Salman, A.; Huleihel, M. Diagnosis of inaccessible infections using infrared microscopy of white blood cells and machine learning algorithms. Analyst 2020, 145, 6955–6967. [Google Scholar] [CrossRef]
- Shin, H.; Oh, S.; Hong, S.; Kang, M.; Kang, D.; Ji, Y.-J.; Choi, B.H.; Kang, K.-W.; Jeong, H.; Park, Y.; et al. Early-Stage Lung Cancer Diagnosis by Deep Learning-Based Spectroscopic Analysis of Circulating Exosomes. ACS Nano 2020, 14, 5435–5444. [Google Scholar] [CrossRef] [PubMed]
- Guleken, Z.; Ünübol, B.; Bilici, R.; Sarıbal, D.; Toraman, S.; Gündüz, O.; Kuruca, S.E. Investigation of the discrimination and characterization of blood serum structure in patients with opioid use disorder using IR spectroscopy and PCA-LDA analysis. J. Pharm. Biomed Anal. 2020, 190, 113553. [Google Scholar] [CrossRef] [PubMed]
- Byrne, H.J.; Bonnier, F.; McIntyre, J.; Parachalil, D.R. Quantitative analysis of human blood serum using vibrational spectroscopy. Clin. Spectrosc. 2020, 2, 100004. [Google Scholar] [CrossRef]
- Theakstone, A.G.; Rinaldi, C.; Butler, H.J.; Cameron, J.M.; Confield, L.R.; Rutherford, S.H.; Sala, A.; Sangamnerkar, S.; Baker, M.J. Fourier-transform infrared spectroscopy of biofluids: A practical approach. Transl. Biophotonics 2021, 3, e202000025. [Google Scholar] [CrossRef]
- Chen, F.; Meng, C.; Qu, H.; Cheng, C.; Yang, B.; Gao, R.; Lv, X. Human serum mid-infrared spectroscopy combined with machine learning algorithms for rapid detection of gliomas. Photodiagnosis Photodyn. Ther. 2021, 35, 102308. [Google Scholar] [CrossRef] [PubMed]
- Elkadi, O.A.; Hassan, R.; Elanany, M.; Byrne, H.J.; Ramadan, M.A. Identification of Aspergillus species in human blood plasma by infrared spectroscopy and machine learning. Spectrochim. Acta A Mol. Biomol. Spectrosc. 2021, 248, 119259. [Google Scholar] [CrossRef]
- Tomas, R.C.; Sayat, A.J.; Atienza, A.N.; Danganan, J.L.; Ramos, M.R.; Fellizar, A.; Notarte, K.I.; Angeles, L.M.; Bangaoil, R.; Santillan, A.; et al. Detection of breast cancer by ATR-FTIR spectroscopy using artificial neural networks. PLoS ONE 2022, 17, e0262489. [Google Scholar] [CrossRef] [PubMed]
- Uthamacumaran, A.; Elouatik, S.; Abdouh, M.; Berteau-Rainville, M.; Gao, Z.-H.; Arena, G. Machine learning characterization of cancer patients-derived extracellular vesicles using vibrational spectroscopies: Results from a pilot study. Appl. Intell. 2022, 52, 12737–12753. [Google Scholar] [CrossRef]
- Guleken, Z.; Tok, Y.T.; Jakubczyk, P.; Paja, W.; Pancerz, K.; Shpotyuk, Y.; Cebulski, J.; Depciuch, J. Development of novel spectroscopic and machine learning methods for the measurement of periodic changes in COVID-19 antibody level. Measurement 2022, 196, 111258. [Google Scholar] [CrossRef]
- Gasymov, O.K.; Aydemirova, A.H.; Melikova, L.A.; Aliyev, J.A. Artificial intelligence to classify human lung carcinoma using blood plasma FTIR spectra. Appl. Comput. Math. 2022, 20, 277–289. [Google Scholar]
- Du, Y.; Xie, F.; Yin, L.; Yang, Y.; Yang, H.; Wu, G.; Wang, S. Breast cancer early detection by using Fourier-transform infrared spectroscopy combined with different classification algorithms. Spectrochim. Acta A Mol. Biomol. Spectrosc. 2022, 283, 121715. [Google Scholar] [CrossRef]
- Praja, R.K.; Wongwattanakul, M.; Tippayawat, P.; Phoksawat, W.; Jumnainsong, A.; Sornkayasit, K.; Leelayuwat, C. Attenuated Total Reflectance-Fourier Transform Infrared (ATR-FTIR) Spectroscopy Discriminates the Elderly with a Low and High Percentage of Pathogenic CD4+ T Cells. Cells 2022, 11, 458. [Google Scholar] [CrossRef]
- Guleken, Z.; Jakubczyk, P.; Wiesław, P.; Krzysztof, P.; Bulut, H.; Öten, E.; Depciuch, J.; Tarhan, N. Characterization of Covid-19 infected pregnant women sera using laboratory indexes, vibrational spectroscopy, and machine learning classifications. Talanta 2022, 237, 122916. [Google Scholar] [CrossRef] [PubMed]
- El Khoury, Y.; Gebelin, M.; de Sèze, J.; Patte-Mensah, C.; Marcou, G.; Varnek, A.; Mensah-Nyagan, A.-G.; Hellwig, P.; Collongues, N. Rapid Discrimination of Neuromyelitis Optica Spectrum Disorder and Multiple Sclerosis Using Machine Learning on Infrared Spectra of Sera. Int. J. Mol. Sci. 2022, 23, 2791. [Google Scholar] [CrossRef] [PubMed]
- Guo, S.; Wei, G.; Chen, W.; Lei, C.; Xu, C.; Guan, Y.; Ji, T.; Wang, F.; Liu, H. Fast and Deep Diagnosis Using Blood-Based ATR-FTIR Spectroscopy for Digestive Tract Cancers. Biomolecules 2022, 12, 1815. [Google Scholar] [CrossRef] [PubMed]
- di Santo, R.; Vaccaro, M.; Romanò, S.; Di Giacinto, F.; Papi, M.; Rapaccini, G.L.; De Spirito, M.; Miele, L.; Basile, U.; Ciasca, G. Machine Learning-Assisted FTIR Analysis of Circulating Extracellular Vesicles for Cancer Liquid Biopsy. J. Pers. Med. 2022, 12, 949. [Google Scholar] [CrossRef] [PubMed]
- Guleken, Z.; Bahat, P.Y.; Toto, F.; Bulut, H.; Jakubczyk, P.; Cebulski, J.; Paja, W.; Pancerz, K.; Wosiak, A.; Depciuch, J. Blood serum lipid profiling may improve the management of recurrent miscarriage: A combination of machine learning of mid-infrared spectra and biochemical assays. Anal. Bioanal. Chem. 2022, 414, 8341–8352. [Google Scholar] [CrossRef] [PubMed]
- Chen, H.; Li, X.; Zhang, S.; Yang, H.; Gao, Q.; Zhou, F. Rapid and sensitive detection of esophageal cancer by FTIR spectroscopy of serum and plasma. Photodiagnosis Photodyn. Ther. 2022, 40, 103177. [Google Scholar] [CrossRef]
- Chen, F.; Sun, C.; Yue, Z.; Zhang, Y.; Xu, W.; Shabbir, S.; Zou, L.; Lu, W.; Wang, W.; Xie, Z.; et al. Screening ovarian cancers with Raman spectroscopy of blood plasma coupled with machine learning data processing. Spectrochim. Acta A Mol. Biomol. Spectrosc. 2022, 265, 120355. [Google Scholar] [CrossRef]
- Koehler, A.; Scroferneker, M.L.; Pereira, B.A.S.; de Souza, N.M.P.; Cavalcante, R.D.S.; Mendes, R.P.; Corbellini, V.A. Using infrared spectroscopy of serum and chemometrics for diagnosis of paracoccidioidomycosis. J. Pharm. Biomed Anal. 2022, 221, 115021. [Google Scholar] [CrossRef]
- Yonar, D.; Severcan, M.; Gurbanov, R.; Sandal, A.; Yilmaz, U.; Emri, S.; Severcan, F. Rapid diagnosis of malignant pleural mesothelioma and its discrimination from lung cancer and benign exudative effusions using blood serum. Biochim. Biophys. Acta Mol. Basis Dis. 2022, 1868, 166473. [Google Scholar] [CrossRef]
- Zheng, X.; Wu, G.; Lv, G.; Yin, L.; Lv, X. Rapid discrimination of hepatic echinococcosis patients’ serum using vibrational spectroscopy combined with support vector machines. Photodiagnosis Photodyn. Ther. 2022, 40, 103027. [Google Scholar] [CrossRef] [PubMed]
- De Souza, N.M.P.; Machado, B.H.; Koche, A.; da Silva Furtado, L.B.F.; Becker, D.; Corbellini, V.A.; Rieger, A. Discrimination of dyslipidemia types with ATR-FTIR spectroscopy and chemometrics associated with multivariate analysis of the lipid profile, anthropometric, and pro-inflammatory biomarkers. Clin. Chim. Acta 2023, 540, 117231. [Google Scholar] [CrossRef] [PubMed]
- De Souza, N.M.P.; Machado, B.H.; Padoin, L.V.; Prá, D.; Fay, A.P.; Corbellini, V.A.; Rieger, A. Rapid and low-cost liquid biopsy with ATR-FTIR spectroscopy to discriminate the molecular subtypes of breast cancer. Talanta 2023, 254, 123858. [Google Scholar] [CrossRef]
- Dou, J.; Dawuti, W.; Li, J.; Zhao, H.; Zhou, R.; Zhou, J.; Lin, R.; Lü, G. Rapid Detection of Serological Biomarkers in Gallbladder Carcinoma Using Fourier Transform Infrared Spectroscopy Combined with Machine Learning. Talanta 2023, 259, 124457. [Google Scholar] [CrossRef]
- Leng, H.; Chen, C.; Chen, F.; Du, Z.; Chen, J.; Yang, B.; Zuo, E.; Xiao, M.; Lv, X.; Liu, P. Raman spectroscopy and FTIR spectroscopy fusion technology combined with deep learning: A novel cancer prediction method. Spectrochim. Acta A Mol. Biomol. Spectrosc. 2023, 285, 121839. [Google Scholar] [CrossRef]
- Ramalhete, L.; Araújo, R.; Ferreira, A.; Calado, C.R. Label-free discrimination of T and B lymphocyte activation based on vibrational spectroscopy—A machine learning approach. Vib. Spectrosc. 2023, 126, 103529. [Google Scholar] [CrossRef]
- de Souza, N.M.P.; Machado, B.H.; Koche, A.; da Silva Furtado, L.B.F.; Becker, D.; Corbellini, V.A.; Rieger, A. Detection of metabolic syndrome with ATR-FTIR spectroscopy and chemometrics in blood plasma. Spectrochim. Acta A Mol. Biomol. Spectrosc. 2023, 288, 122135. [Google Scholar] [CrossRef]
- Ali, S.; Naveed, A.; Hussain, I.; Qazi, J. Use of ATR-FTIR spectroscopy to differentiate between cirrhotic/non-cirrhotic HCV patients. Photodiagnosis Photodyn. Ther. 2023, 42, 103529. [Google Scholar] [CrossRef]
- Chen, T.; Guestrin, C. XGBoost: A scalable tree boosting system. In Proceedings of the ACM SIGKDD International Conference on Knowledge Discovery and Data Mining, Long Beach, CA, USA, 6–10 August 2016; Association for Computing Machinery: New York, NY, USA, 2018; Volume 13–17, pp. 785–794. [Google Scholar]
- Ren, S.; He, K.; Girshick, R.; Sun, J. Faster R-CNN: Towards Real-Time Object Detection with Region Proposal Networks. IEEE Trans. Pattern Anal. Mach. Intell. 2019, 39, 1137–1149. [Google Scholar] [CrossRef]
- Girshick, R.; Donahue, J.; Darrell, T.; Malik, J. Rich feature hierarchies for accurate object detection and semantic segmentation. In Proceedings of the IEEE Computer Society Conference on Computer Vision and Pattern Recognition, Columbus, OH, USA, 23–28 June 2014; pp. 580–587. [Google Scholar]
- Lee, L.C.; Liong, C.Y.; Jemain, A.A. Partial least squares-discriminant analysis (PLS-DA) for classification of high-dimensional (HD) data: A review of contemporary practice strategies and knowledge gaps. Analyst 2018, 143, 3526–3539. [Google Scholar] [CrossRef]
- Mendez, K.M.; Reinke, S.N.; Broadhurst, D.I. A comparative evaluation of the generalised predictive ability of eight machine learning algorithms across ten clinical metabolomics data sets for binary classification. Metabolomics 2019, 15, 150. [Google Scholar] [CrossRef] [PubMed]
- Wu, Y. Statistical Learning Theory. Technometrics 2020, 41, 377–378. [Google Scholar] [CrossRef]
- Balan, V.; Mihai, C.T.; Cojocaru, F.D.; Uritu, C.M.; Dodi, G.; Botezat, D.; Gardikiotis, I. Vibrational Spectroscopy Fingerprinting in Medicine: From Molecular to Clinical Practice. Materials 2019, 12, 2884. [Google Scholar] [CrossRef]
- Talari, A.C.S.; Martinez, M.A.G.; Movasaghi, Z.; Rehman, S.; Rehman, I.U. Advances in Fourier transform infrared (FTIR) spectroscopy of biological tissues. Appl. Spectrosc. Rev. 2017, 52, 456–506. [Google Scholar] [CrossRef]
- Movasaghi, Z.; Rehman, S.; Rehman, I.U. Fourier Transform Infrared (FTIR) Spectroscopy of Biological Tissues. Appl. Spectrosc. Rev. 2008, 43, 134–179. [Google Scholar] [CrossRef]
- Chaber, R.; Kowal, A.; Jakubczyk, P.; Arthur, C.; Łach, K.; Wojnarowska-Nowak, R.; Kusz, K.; Zawlik, I.; Paszek, S.; Cebulski, J. A Preliminary Study of FTIR Spectroscopy as a Potential Non-Invasive Screening Tool for Pediatric Precursor B Lymphoblastic Leukemia. Molecules 2021, 26, 1174. [Google Scholar] [CrossRef]
- Fadlelmoula, A.; Pinho, D.; Carvalho, V.H.; Catarino, S.O.; Minas, G. Fourier Transform Infrared (FTIR) Spectroscopy to Analyse Human Blood over the Last 20 Years: A Review towards Lab-on-a-Chip Devices. Micromachines 2022, 13, 187. [Google Scholar] [CrossRef]
- Mitri, E.; Birarda, G.; Vaccari, L.; Kenig, S.; Tormen, M.; Grenci, G. SU-8 bonding protocol for the fabrication of microfluidic devices dedicated to FTIR microspectroscopy of live cells. Lab Chip 2014, 14, 210–218. [Google Scholar] [CrossRef]
- Landari, H.; Roudjane, M.; Messaddeq, Y.; Miled, A. Pseudo-Continuous Flow FTIR System for Glucose, Fructose and Sucrose Identification in Mid-IR Range. Micromachines 2018, 9, 517. [Google Scholar] [CrossRef] [PubMed]
- Birarda, G.; Ravasio, A.; Suryana, M.; Maniam, S.; Holman, H.-Y.N.; Grenci, G. IR-Live: Fabrication of a low-cost plastic microfluidic device for infrared spectromicroscopy of living cells. Lab Chip 2016, 16, 1644–1651. [Google Scholar] [CrossRef] [PubMed]
- Greener, J.; Abbasi, B.; Kumacheva, E. Attenuated total reflection Fourier transform infrared spectroscopy for on-chip monitoring of solute concentrations. Lab Chip 2010, 10, 1561–1566. [Google Scholar] [CrossRef] [PubMed]
- Chai, J.; Zhang, K.; Xue, Y.; Liu, W.; Chen, T.; Lu, Y.; Zhao, G. Review of MEMS Based Fourier Transform Spectrometers. Micromachines 2020, 11, 214. [Google Scholar] [CrossRef] [PubMed]


| Reference | Targeting Disease | Study Type | Sample Source Methodology | Software | FTIR Analysis | Pros | Cons |
|---|---|---|---|---|---|---|---|
| Emmanuel P. Mwanga, 2019 [13] | Malaria | Cross-sectional study | 1486 households and 3292 individuals | OPUS 8.7 SP2 software | Scanning range from 4000 to 500 cm−1 with the spectral resolution set at 5 cm−1 and the preprocessed spectrum region (main peaks identified in the 1730 to 883 cm−1 region). Analysis parameter: full spectra absorbance amplitude | Demonstrated that mid-infrared spectroscopy coupled with supervised ML could be used to screen for malaria parasites in human dried blood spots | Reduced the number of dataset samples for training which limits the prediction quality |
| Philip Heraud, 2019 [14] | Malaria | Pilot study | 318 patients | MATLAB-based graphical user interface (GUI) (Release 2018b) | Scanning range from 4000 to 650 cm−1 at a spectral resolution of 4 cm−1 (main analysis in the 1800 to 800 cm−1 and 3200 to 2800 cm−1 regions). Analysis parameter: 255 combinations of the spectral peaks combined with 12 pre-processing methods (including first- and second-order derivatives and mean-centered, among others) | Showed potential as an efficient and reliable malaria diagnostic tool at point-of-care (POC) under tropical field conditions | Required more experimental work |
| Suat Toraman, 2019 [15] | Colon cancer | Clinical study | 70 patients | MATLAB (Release 2018b) | Scanning range from 4000 to 450 cm−1 with 32 scans and 4 cm−1 resolution. Analysis parameters: area, height ratios, and six statistical features of the FTIR peaks | Achieved promising results for the classification process in distinguishing patients with colon cancer from healthy subjects | Weak understanding of the effect on the obtained signal of the water in the plasma |
| Adam H. Agbaria, 2020 [16] | Infection etiology in febrile pediatric oncology | Clinical study | 116 patients | OPUS 7.0 software | Scanning range from 4000 to 600 cm−1 with 128 scans and 4 cm−1 spectral resolution (main peaks identified in the 1800 to 900 cm−1 and 3020 to 2880 cm−1 regions). Analysis parameters: normalized average spectra and second derivative of the spectra (using the Savitsky–Golay filter) | Infrared spectroscopy combined with ML algorithms was demonstrated as a powerful clinical tool for the diagnosis of the etiology of infection | Required more experimental work |
| Ahmad Salman, 2020 [17] | Lewy bodies and Alzheimer’s diseases | Clinical study | 56 individuals | OPUS 7.0 software | Scanning range from 4000 to 600 cm−1 with a spectral resolution of 4 cm−1 (main peaks identified in the 1760 to 950 cm−1 region). Analysis parameters: normalized and baseline corrected average spectra and second derivative of the spectra | The combination of IR spectroscopy and ML allowed for differentiation between DLB and AD with a high rate of success | The classification results were based only on WBC samples |
| Zozan Guleken, 2020 [18] | Analysis of oxidative/antioxidative | Comparison study | 30 individuals | Python Keras library version 2.3 | Scanning range from 4000 to 600 cm−1 with an average of 32 scans and at a spectral resolution of 4 cm−1. Analysis parameter: ratios between the baseline-corrected and normalized spectra (using the Savitzky–Golay algorithm) | The spectroscopic method proved to be an effective tool to identify toxicological changes in the blood and serum of individuals with substance use disorder | Required the participation of a large number of patients from different clinical centers |
| Elke Korb, 2020 [19] | Allergy | Proof-of-concept study | 10 individuals | GraphPad Prism 6, MATLAB (Release 2018b), and OPUS 7.8.5 software. Unscrambler X 10.5 software and Python programming language with Scikit-learn library | Scanning range from 4000 to 500 cm−1 using a 6 cm−1 spectral resolution (main peaks identified in the 1800 to 900 cm−1 region). Analysis parameters: absorbance amplitude values and second derivative spectra, calculated by the Savitzky–Golay algorithm | Allowed not only to differentiate between allergic and healthy patients but also stratified specific immunotherapy (SIT)-treated patients | Limited to adults |
| Adam H. Agbaria, 2020 [20] | White blood cells | Clinical study | 343 individuals | OPUS 7.0 software | Scanning range in the mid-IR, from 4000 to 600 cm−1, with 128 scans at a 4 cm−1 spectral resolution. From each sample, 16 spectra from different sites were measured (main peaks identified in the 1800 to 900 cm−1 region). Analysis parameter: spectra derivative based on the Savitzky–Golay filter, applied on the normalized average spectrum | A significant and objective diagnostic tool that assisted physicians in increasing their diagnostic accuracy regarding the etiology of infections, especially for inaccessible infections | Needed more data to increase the diagnosis success rates |
| Feilong Yue, 2020 [7] | Thyroid function | Comparative study | 199 patients | Not specified | Scanning range in the mid-IR, from 3000 to 700 cm−1, at a 4 cm−1 spectral resolution. Analysis parameter: amplitude of the infrared absorbance peaks | The deep learning model proved that it had the possibility for practical application | Required more experimental work |
| Hyunku Shin, 2020 [21] | Lung cancer | Clinical study | 47 patients | Python version 2.3 | Scanning range from 2000 to 475 cm−1. Analysis parameter: amplitude of the normalized Raman signals | Proved useful in identifying early-stage lung cancer patients | Used as a routine pre-screening tool for lung cancer |
| Zozan Guleken, 2020 [22] | Opioid use disorder | Clinical study | 34 patients | Graph Pad Prism 6.01, Python software | Scanning range from 4000 to 450 cm−1 with 32 scans and at a 4 cm−1 spectral resolution (main peaks identified in the 1800 to 900 cm−1 region). Analysis parameter: spectra derivative based on the Savitzky–Golay filter, applied on the normalized average spectrum | FTIR for a simple and readily available diagnostic test that can successfully differentiate the serum samples of opioid use disorder patients from healthy subjects | The necessity of further studies on the effects of opioid use on the human body |
| Hugh J. Byrne, 2020 [23] | Bodily fluids | Multiple proof-of-concept studies | 25 patients | MATLAB (Release 2017a) | Scanning region from 1800 to 400 cm−1 at a 4 cm−1 spectral resolution. Analysis parameter: amplitudes of the spectra derivative based on the Savitzky–Golay filter, applied on the normalized average spectrum | Demonstrated the potential for the clinical translation of quantitative serum analysis using vibrational spectroscopy | Increased clinical-scale trials for the in-depth assessment of the associated clinical workflow and health economics |
| Ashton G. Theakstone, 2021 [24] | Biofluids | Clinical study | Not reported | Python version 2.3 | Scanning range from 3500 to 900 cm−1 | FTIR spectroscopy techniques detected the early stages of disease, including before clinical symptoms arise, by analyzing samples at the molecular level | Required greater sample populations to validate the clinical potential of the proposed technologies. |
| Fangfang Chen, 2021 [25] | Gliomas | Clinical study | 30 patients | MATLAB (Release 2016a) | Scanning range from 4000 to 500 cm−1 with 6 scans and at a 8 cm−1 spectral resolution (main peaks identified in the 3500 to 500 cm−1 region). Analysis parameter: average amplitudes of the normalized spectra | Mid-infrared spectroscopy with ML proved to be suitable for detecting cancer | Required more experimental work |
| Omar Anwar Elkadi, 2021 [26] | Aspergillus | Clinical study | 45 samples | Unscrambler X 10.4 | Scanning range from 4000 to 449 cm−1 at a 4 cm−1 spectral resolution. Analysis parameter: absorbance at each wave number | FTIR spectroscopy and ML identified with high sensitivity and specificity blood plasma with Aspergillus | Required more experimental work |
| Rock Christian Tomas, 2022 [27] | Breast cancer | Clinical study | 200 samples | MATLAB (Release 2020b) | Scanning range of 4000 to 600 cm−1 with an average of 48 scans and at a 4 cm−1 spatial resolution (main peaks identified in the 1800 to 850 cm−1 region). Analysis parameter: absorbance amplitude of the normalized spectra | Neural network (NN) models can effectively discriminate malignant from benign breast tissues | Financial constraints |
| Abicumaran Uthamacumaran, 2022 [28] | Carcinogenic cells | Pilot study | 9 patients | OriginPro 2021 and Scikit-learn Python library | Scanning range from 3040 to 1440 cm−1 at a 4 cm−1 spectral resolution. Analysis parameter: peak amplitude identification in the baseline corrected spectra (using the asymmetric least-squares smoothing method) | Accurately distinguished cancer EVs from those of healthy patients | Only investigated cancer EVs obtained from cancer cell lines |
| Zozan Guleken, 2022 [29] | COVID-19 antibody level | Clinical study | 47 patients | OPUS 7.0 software | Scanning region from 4000 to 400 cm−1 with 32 scans and at a 4 cm−1 spectral resolution. Raman recorded in the 3700 to 150 cm−1 range with 64 scans and at an 8 cm−1 spectral resolution. Analysis parameter: absorbance amplitude (partial least-squares analysis), after normalization and smoothing with the Savitsky–Golay filter | Proved the possibility of using FTIR and Raman spectroscopy to identify differences in COVID-19 patients | Required more experimental work |
| O.K. Gasymov, 2022 [30] | Lung carcinoma | Comparison study | 81 samples | Metabo Analyst 4.0 software | Scanning range from 4000 to 400 cm−1 with 512 scans and at a 4 cm−1 spectral resolution (main groups identified around 800 cm−1, 1100 cm−1, 1400 cm−1, and 3050 cm−1). Analysis parameter: area of the normalized spectra (bio-fingerprint and lipid) regions | Multivariate statistics with feature extraction and ML were successfully applied to cancer classification based on the FTIR spectra of blood plasma samples | Required a widespread screening method for the identification of individuals at high risk |
| Yu Du, 2022 [31] | Breast cancer | Clinical study | 526 samples | KS algorithm OLS3 | Scanning range from 4000 to 400 cm−1 with 32 scans and at an 8 cm−1 spectral resolution (main bands identified in the 1425 to 900 cm−1 and 1710 to 1475 cm−1 regions). Analysis parameter: peak intensity of the normalized spectra | FTIR and ML can not only accurately detect invasive breast cancer but also accurately distinguish ductal carcinoma in situ from invasive breast cancer and healthy controls | The authors need to evaluate this approach with more serum samples and analyze biochemical changes with more studies during the cancer process |
| Rian Ka Praja, 2022 [32] | Discriminates the elderly with a low and high percentage of pathogenic CD4+ T Cells | Exploratory study | 22 samples | Unscrambler software version 10.4 and SPSS Statistics for Windows version 17.0 | Scanning range from 4000 to 650 cm−1 with 64 scans and at a 4 cm−1 spectral resolution. Analysis parameters: spectral band area ratios and second derivative spectra, calculated by the Savitzky–Golay algorithm | ML-assisted ATR-FTIR spectroscopy can be effectively applied for investigating an immunological alteration in immunosenescence | Required improving the ML methods to assess the real diagnostic performance |
| Zozan Guleken, 2022 [33] | Characterization of COVID-19-infected pregnant women | Clinical study | 37 pregnant women | JASCO Spectra Manager version 2 and OPUS software | Scanning range from 4000 to 400 cm−1 with 128 scans (evaluation of the serum spectral bands). Analysis parameter: partial least-squares analysis of the FTIR data, identifying the peak regions and wavenumbers | The obtained FTIR spectra showed significant differences between COVID-19 women with severe and light symptoms | Small sample size |
| Youssef El Khoury, 2022 [34] | Neuromyelitis optica spectrum | Clinical study | 60 samples | OPUS 7.2 software | Scanning range in the mid-IR region, from 3000 to 700 cm−1 (higher intensity bands in the 1185 to 950 cm−1 region). Analysis parameter: amplitudes of the average spectra and second derivative spectra | The random forest classification ML algorithm distinguished the FTIR second derivatives of serum samples from relapsing–remitting multiple sclerosis (RRMS), NMOSD, and peripheral neuropathy (NEUR) patients | The small number of instances for each serostatus was insufficient to identify specific patterns in the infrared spectra of the sera |
| Shanshan Guo, 2022 [35] | Tract cancers | Proof-of-concept | 210 patients | OPUS 7.2 software | Scanning range in the mid-IR region, from 4000 to 400 cm−1, with 32 scans (main bands identified in the 1700 to 1400 cm−1 region). Analysis parameters: normalized absorbance amplitude and second derivative spectrum, calculated using the Savitzky–Golay algorithm | There is potential to apply FTIR-based ML diagnosis to aid clinical decision-making as a triage method for digestive tract cancers (DTCs) and for early cancer screening | Reduced number of blood samples and patients from different classes |
| Riccardo Di Santo, 2022 [36] | Circulating extracellular vesicles | Pilot study | 20 patients | OPUS 8.5 SP1 software | Scanning range from 4000 to 650 cm−1 with 54 scans and at a 2 cm−1 spectral resolution (main spectral peak at 1740 cm−1). Analysis parameter: normalized absorbance amplitude | FTIR spectroscopy appears to be extremely promising as it can provide a label-free comprehensive molecular fingerprint of EVs through the analysis of specific mid-IR absorption bands | Small sample size |
| Zozan Guleken, 2022 [37] | Miscarriage | Clinical study | 60 patients | MATLAB Simulink environment (MathWorks, Natick, MA, USA) | Scanning range in the mid-IR region, from 4000 to 600 cm−1, at a 4 cm−1 spectral resolution. Analysis parameter: average value of absorbance at the 1762, 2874, and 2930 cm−1 peaks, after normalization and the average was smoothed by the Savitzky–Golay method | The prediction of lipid profile abnormalities in maternal serum can significantly improve the patient pathway | Required more experimental work |
| Hongjun Chen, 2022 [38] | Esophageal cancer | Pilot exploratory study | 136 patients | MATLAB (Release 2016a) | Scanning range in the mid-IR region, from 4000 to 400 cm−1, at a 4 cm−1 spectral resolution and 1 s integration time (main intensity peak at 1656 cm−1). Analysis parameter: mean and second derivative of the spectra | Principal component-linear discriminant analysis (PC-LDA) with FTIR differentiated esophageal squamous cell carcinoma (ESCC) from normal groups | Required the participation of a large number of patients from different clinical centers |
| Fengye Chen, 2022 [39] | Ovarian cancer | Clinical study | 174 patients | Python 3.7 version | Scanning range from 3200 to 400 cm−1 with 2976 spectral channels (main peaks identified in the 1700 cm−1 to 800 cm−1 region). Analysis parameters: peak positions, peak width, and total spectral intensity (of the normalized spectra) | Raman spectroscopy revealed the importance of certain biomolecules in the identification of the targeted health status of patients | Required more experimental work |
| Alessandra Koehler, 2022 [40] | Paracoccidioidomycosis | Clinical study | 224 patients | Pirouette 4.5 and OriginPro70 | Scanning range from4000 to 650 cm−1 with 8 scans and at a 4 cm−1 spectral resolution (main bands at 1652 cm−1 and 1543 cm−1). Analysis parameter: second derivative, based on the Savitzky–Golay filter, applied on the average spectrum (normalized) | Able to correctly diagnose paracoccidioidomycosis sera with different clinical forms and degrees of severity | Required more experimental work |
| Dilek Yonar, 2022 [41] | Malignant pleural mesothelioma | Experimental study | 112 patients | Unscrambler X 10.3 | Scanning range from 4000 to 650 cm−1 with 100 scans and at a 4 cm−1 spectral resolution. Analysis parameters: band positions and integrated area ratios between the bands of the average spectra (normalized with respect to the amide I band) | The potential value of the FTIR spectroscopy technique to serve as a screening tool targeting those with a history of asbestos exposure | Required more experimental work |
| Xiangxiang Zheng, 2022 [42] | Echinococcosis | Clinical study | 86 patients | OPUS 7.2 software | Scanning range from 4000 to 600 cm−1 with 32 scans and at a 4 cm−1 spectral resolution. Raman spectral range from 3100 to 600 cm−1. Analysis parameters: intensity differences at some spectral peaks of the normalized spectra using the Savitzky–Golay filter | Explored the use of serum vibrational ATR-FTIR spectroscopy technology combined with an ML algorithm to distinguish echinococcosis patients from healthy individuals | Needed larger clinical cohorts to verify the standardization of serum spectral collection |
| Nikolas Mateus Pereira de Souza, 2023 [43] | Dyslipidemia types | Clinical study | 74 patients | Not reported | Scanning range from 4000 to 650 cm−1 with 4 scan pulses and at a 4 cm−1 spectral resolution. Analysis parameters: average spectra (normalized between 0 and 1) and the first Savitzky–Golay derivative | ATR-FTIR spectroscopy was associated with chemometric modeling as a plausible applicant for screening different types of dyslipidemia | Extensive studies should be conducted to verify the real applicability in clinical analysis laboratories or medical clinics |
| Nikolas Mateus Pereira de Souza, 2023 [44] | Breast cancer | Exploratory study | 74 patients | ChemoStat V.2 | Scanning range from 4000 to 650 cm−1 with 4 scan pulses and at a 4 cm−1 spectral resolution (main peaks identified in the 1118 to 1052 cm−1 region). Analysis parameter: absorbance amplitude in each wavenumber | This methodology plausibly allowed for the screening of the molecular subtypes of breast cancer and consequently improved the prognosis | The centrifugation step to obtain blood plasma and the sample drying step eliminated interference from the water bands |
| Jingrui Dou, 2023 [45] | Gallbladder cancer | Clinical study | 256 patients | OPUS 7.2 software | Scanning range from 4000 to 650 cm−1 with 32 scans and at a 4 cm−1 spectral resolution (main peaks identified in the 1710 to 1475 cm−1 and 1354 to 980 cm−1 regions). Analysis parameter: second derivative spectra based on the Savitzky–Golay algorithm | FTIR methods with RBF-SVM methods have the potential to become a serological analysis technique for the early screening of gallbladder cancer | Required more experimental work |
| Hongyong Leng, 2023 [46] | Cancer prediction | Experimental study | 164 blood samples | MATLAB (Release 2016a) | Scanning range from4000 to 600 cm−1 with 6 scans and at an 8 cm−1 spectral resolution. Raman spectral range from 2000 to 500 cm−1. Analysis parameter: amplitude of the average spectrum (normalized between the minimum and maximum values of the data) | The spectral fusion technology effectively improved the accuracy of diagnosis in the complex clinical diagnosis environment | The diagnosis of complex diseases required further experiments to promote practical clinical applications in the future |
| Luis Ramalhete, 2023 [47] | Discrimination of T and B lymphocytes | Clinical study | 18 patients | OPUS 7.2 software | Scanning range from 4000 to 400 cm−1 with a 2 cm−1 spectral resolution. Analysis parameter: second derivative spectra based on the Savitzky–Golay filter | The ability to economically identify lymphocyte activation in a simple procedure | Future work on the classification models and understanding of the detected spectral difference |
| Nikolas Mateus Pereira de Souza, 2023 [48] | Metabolic syndrome | Translational clinical study | 74 patients | Jasp 0.14.1 | Scanning range from 4000 to 650 cm−1 with 4 scans and at a 4 cm−1 spectral resolution (main peaks identified in the 1800 to 900 cm−1 region). Analysis parameter: mean (with standard deviation) of the total spectrum, normalized between 0 and 1 | ATR-FTIR spectroscopy with OPLS-DA modeling was powerful enough to discriminate with 100% accuracy individuals with metabolic syndrome from control subjects | Required more experimental work |
| Salmann Ali, 2023 [49] | Hepatitis C virus | Clinical study | 105 patients | Unscrambler X 10.5 | Scanning range from 4000 to 400 cm−1 with a 4 cm−1 spectral resolution (main peaks identified in the 4000 to 502 cm−1 region). Analysis parameter: spectra absorbance amplitude | ATR-FTIR spectroscopy in conjugation with multivariate data classification tools holds the potential not only to effectively diagnose hepatitis C virus infections but also the non-cirrhotic/cirrhotic status of patients | Needed for multiple screening tests, used conventionally in order to determine the cirrhotic or non-cirrhotic status of infected individuals |
| Reference | Machine Learning Method * | Metrics to Evaluate ML (Accuracy, Sensitivity, and Specificity, Respectively) (%) | Internal Validation |
|---|---|---|---|
| Emmanuel P. Mwanga, 2019 [13] | NB, XGB, MLP, LR, KNN, RF, and SVM | 92; 92.8; 91.7 | Cross-validation and external validation |
| Philip Heraud, 2019 [14] | PLS-DA and SVM | n.a.; 92; 97 | Cross-validation |
| Suat Toraman, 2019 [15] | MLPNN and SVM | 95; 93.33; 97.50 | Cross-validation (four, five, and ten folds) |
| Adam H. Agbaria, 2020 [16] | SD, XGB, Gaussian Naïve Bayes, SFSD, Random Forest, and SVM | n.a.; 92; 86 | Five-fold validation |
| Ahmad Salman, 2020 [17] | RF and SVM | 88; n.a.; n.a. | Cross-validation |
| Zozan Guleken, 2020 [18] | PCA, LDA, SVM, and AYC | 100; 100; 100 | Not conducted |
| Elke Korb, 2020 [19] | PCA, PDS, TPR, PPV, and CNN | 93.9; n.a; 96.5 | Ten-fold cross-validation |
| Adam H. Agbaria, 2020 [20] | SFSD, PCC, and SVM | 95; 94; 90 | Cross-validation |
| Feilong Yue, 2020 [7] | MLP, LSTM, and CNN | 90; 90; 90 | Ten-fold cross-validation |
| Hyunku Shin, 2020 [21] | PCA, PCA-LDA, CNN, and SVM | 88; 84; 85 | Five-fold cross-validation |
| Zozan Guleken, 2020 [22] | PCA, PLS, XGB, HCA, C5.0 decision tree algorithm, KNN, DNN, RF, and SVM | 90; n.a.; n.a. | Not conducted |
| Hugh J. Byrne, 2020 [23] | PLSR | 96.67; 90; 100 | Root mean square error of cross-validation and cross-validation |
| Ashton G. Theakstone, 2021 [24] | PCA, HCA, SIMCA, PLS-DA, LDA, and RF | n.a.; n.a.; n.a. | Cross-validation |
| Fangfang Chen, 2021 [25] | PSO-SVM, PCA, and BP | 87.07; n.a.; 90.96 | Not conducted |
| Omar Anwar Elkadi, 2021 [26] | PLS-DA | 84.4; n.a.; n.a. | Cross-validation |
| Rock Christian Tomas, 2022 [27] | PPV, NPV, NB, SVM, LDA, DT, LR, CNN, FNN, and RF | 96; n.a; n.a. | Ten-fold cross-validation |
| Abicumaran Uthamacumaran, 2022 [28] | AdaBoost, decision trees, random forest classifier, and SVM | 90; 90; 90 | Five-fold cross-validation |
| Zozan Guleken, 2022 [29] | PLS, SD, DNN, and RF | 81.07; n.a.; n.a. | Leave-one-out cross-validation |
| O.K. Gasymov, 2022 [30] | PCA, sPLS-DA, RF, and SVM | 80; n.a.; 90 | Cross-validation |
| Yu Du, 2022 [31] | BPNN and SVM | n.a.; 100; 100 | Ten-fold cross-validation |
| Rian Ka Praja, 2022 [32] | PCA, PLS-DA, NN, RF, and SVM | 93.9; n.a.; n.a. | Not conducted |
| Zozan Guleken, 2022 [33] | PCA, MCC, XGB, DL, kNN + L25, and SVM | 100; n.a.; n.a. | Leave-one-out cross-validation |
| Youssef ElKhoury, 2022 [34] | RF | 100; 100; 100 | Two-fold cross-validation |
| Shanshan Guo, 2022 [35] | 2D-SD-IR, PLS-DA, MVLR, PCA, RF, KNN, DT, and SVM | 95.3; n.a; n.a | Ten-fold cross-validation |
| Riccardo Di Santo, 2022 [36] | PCA-LDA | n.a.; 95; 95 | Leave-one-out cross-validation |
| Zozan Guleken, 2022 [37] | PCA, PCA-LDA, LDA, and SVM | 97.06; 100; 92.85 | K-fold cross-validation |
| Hongjun Chen, 2022 [38] | EA, PC-LDA, PLS-DA, DT, KNN, and SVM | 99.26; 98.53; 100 | Ten-fold cross-validation |
| Fengye Chen, 2022 [39] | BPNN | n.a.; 81.0; 97.3 | Five-fold cross- validation |
| Alessandra Koehler, 2022 [40] | PCA and OPLS-DA | 100; 100; 100 | Leave-one-out cross-validation and error of cross-validation |
| Dilek Yonar, 2022 [41] | PCA, SVM, and LDA | 88.9; n.a.; n.a. | Full cross-validation |
| Xiangxiang Zheng, 2022 [42] | SVM | 97.4; 100; 94.5 | Leave-one-out cross-validation, hold-out validation, and five-fold cross-validation |
| Nikolas Mateus Pereira de Souza, 2023 [43] | PCA and OPLS-DA | 100; n.a.; n.a. | Leave-one-out cross-validation |
| Nikolas Mateus Pereira de Souza, 2023 [44] | PCA and OPLS-DA | 100; n.a.; n.a. | Leave-one-out cross-validation and cross-validation |
| Jingrui Dou, 2023 [45] | PCA, LDA, PCA-LDA, SVM, and RBF-SVM | 91.62; 95.83; 86.41 | Leave-one-out cross-validation |
| Hongyong Leng, 2023 [46] | CNN-LSTM, MFCNN, and SVM | 97; n.a.; n.a. | Five-fold cross-validation |
| Luis Ramalhete, 2023 [47] | t-SNE, k-NN, and SVM | 99; n.a.; n.a. | Cross-validation |
| Nikolas Mateus Pereira de Souza, 2023 [48] | OPLS-DA and PLS-DA | n.a.; 100; 100 | Leave-one-out cross-validation, root mean square error of cross-validation, and cross-validation |
| Salmann Ali, 2023 [49] | PCA-LDA, PCA-QDA, and SVM | 100; 100; 100 | Leave one out cross-validation, cross-validation, and external validation |
Disclaimer/Publisher’s Note: The statements, opinions and data contained in all publications are solely those of the individual author(s) and contributor(s) and not of MDPI and/or the editor(s). MDPI and/or the editor(s) disclaim responsibility for any injury to people or property resulting from any ideas, methods, instructions or products referred to in the content. |
© 2023 by the authors. Licensee MDPI, Basel, Switzerland. This article is an open access article distributed under the terms and conditions of the Creative Commons Attribution (CC BY) license (https://creativecommons.org/licenses/by/4.0/).
Share and Cite
Fadlelmoula, A.; Catarino, S.O.; Minas, G.; Carvalho, V. A Review of Machine Learning Methods Recently Applied to FTIR Spectroscopy Data for the Analysis of Human Blood Cells. Micromachines 2023, 14, 1145. https://doi.org/10.3390/mi14061145
Fadlelmoula A, Catarino SO, Minas G, Carvalho V. A Review of Machine Learning Methods Recently Applied to FTIR Spectroscopy Data for the Analysis of Human Blood Cells. Micromachines. 2023; 14(6):1145. https://doi.org/10.3390/mi14061145
Chicago/Turabian StyleFadlelmoula, Ahmed, Susana O. Catarino, Graça Minas, and Vítor Carvalho. 2023. "A Review of Machine Learning Methods Recently Applied to FTIR Spectroscopy Data for the Analysis of Human Blood Cells" Micromachines 14, no. 6: 1145. https://doi.org/10.3390/mi14061145