
A Real-Time Defect Detection Strategy for Additive Manufacturing Processes Based on Deep Learning and Machine Vision Technologies
 ,
,  and
and
Abstract
:1. Introduction
2. Methods
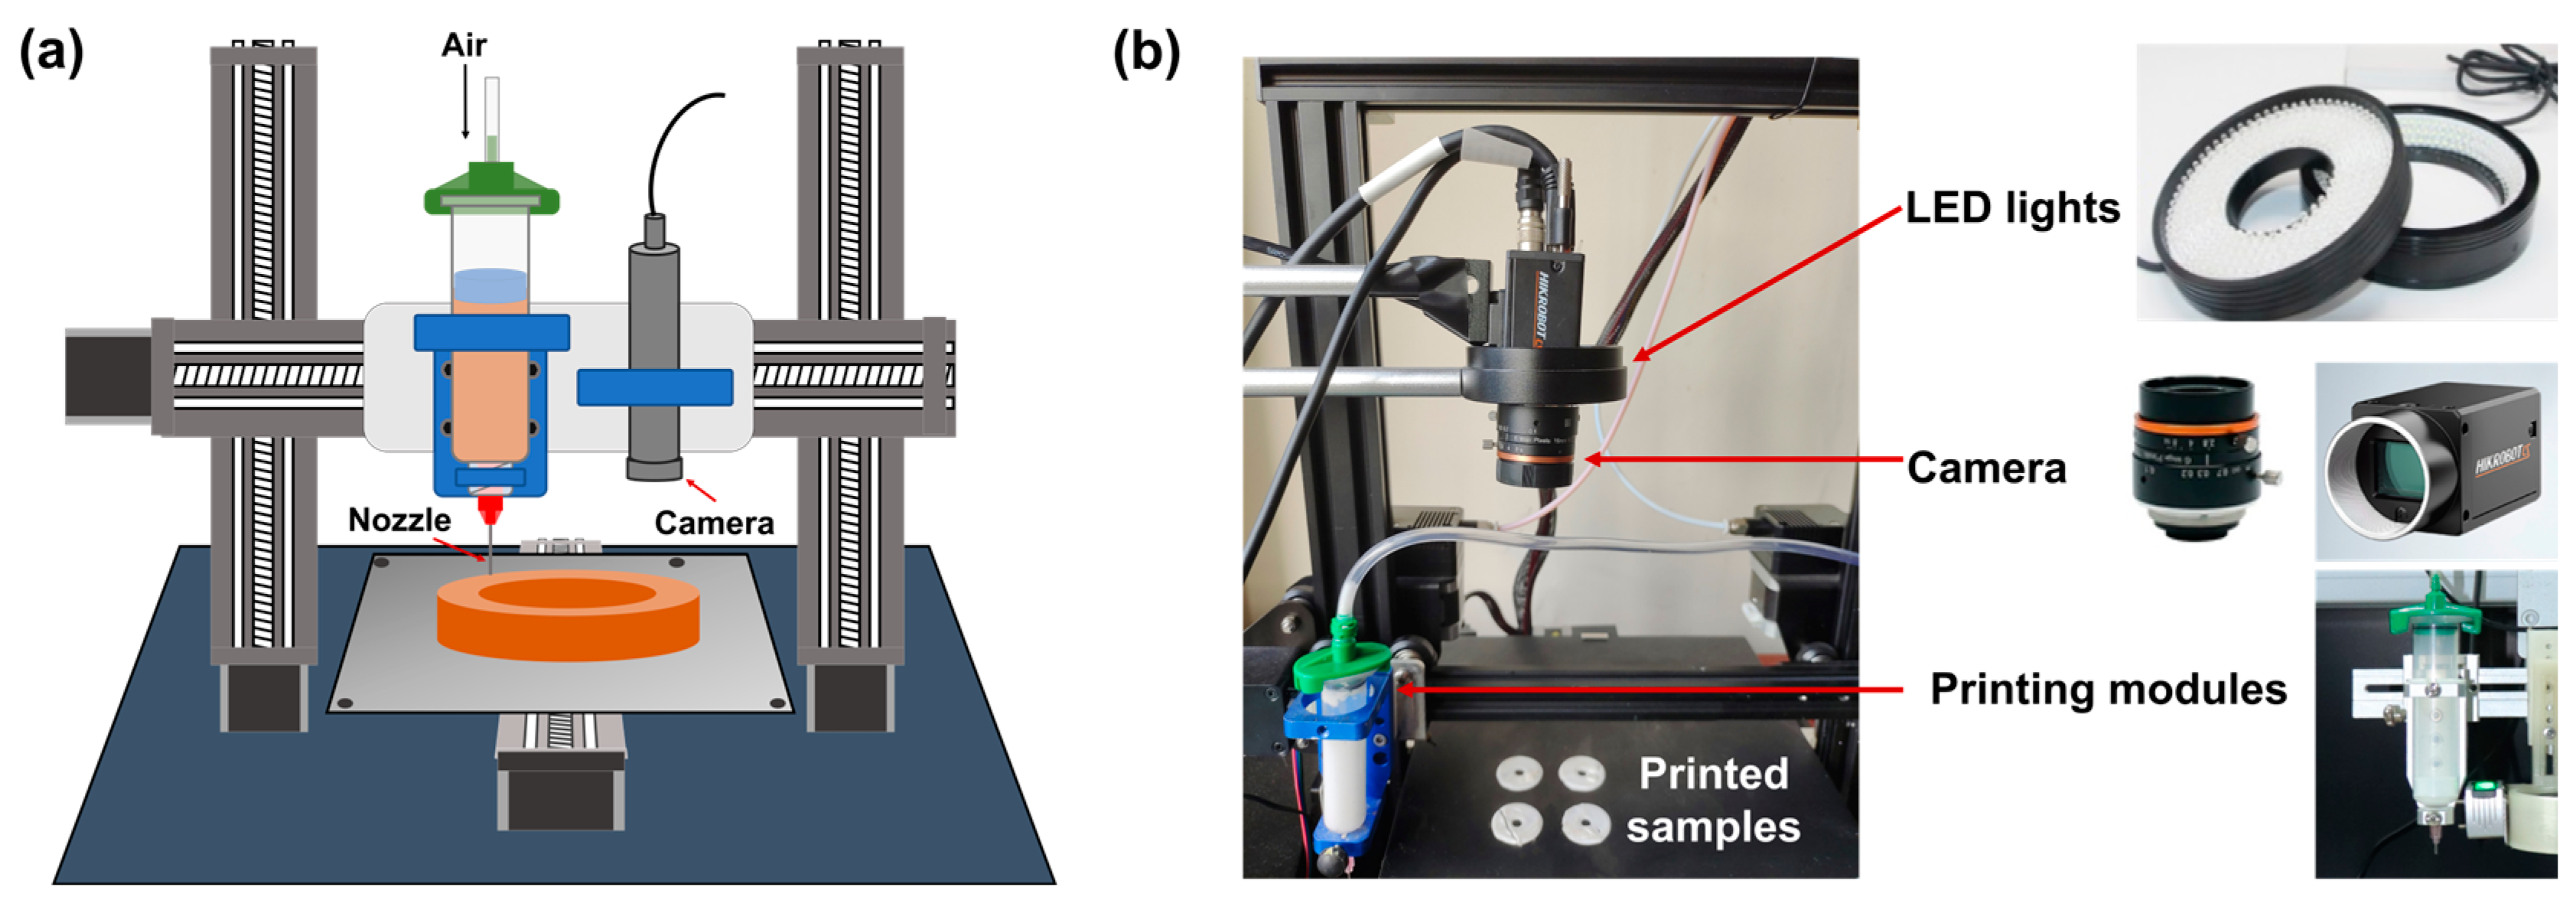
2.1. 3D Printing
2.2. Dataset Collection
2.2.1. Defect Image Collection
2.2.2. Image Check and Process
2.3. YOLOv8 Algorithm
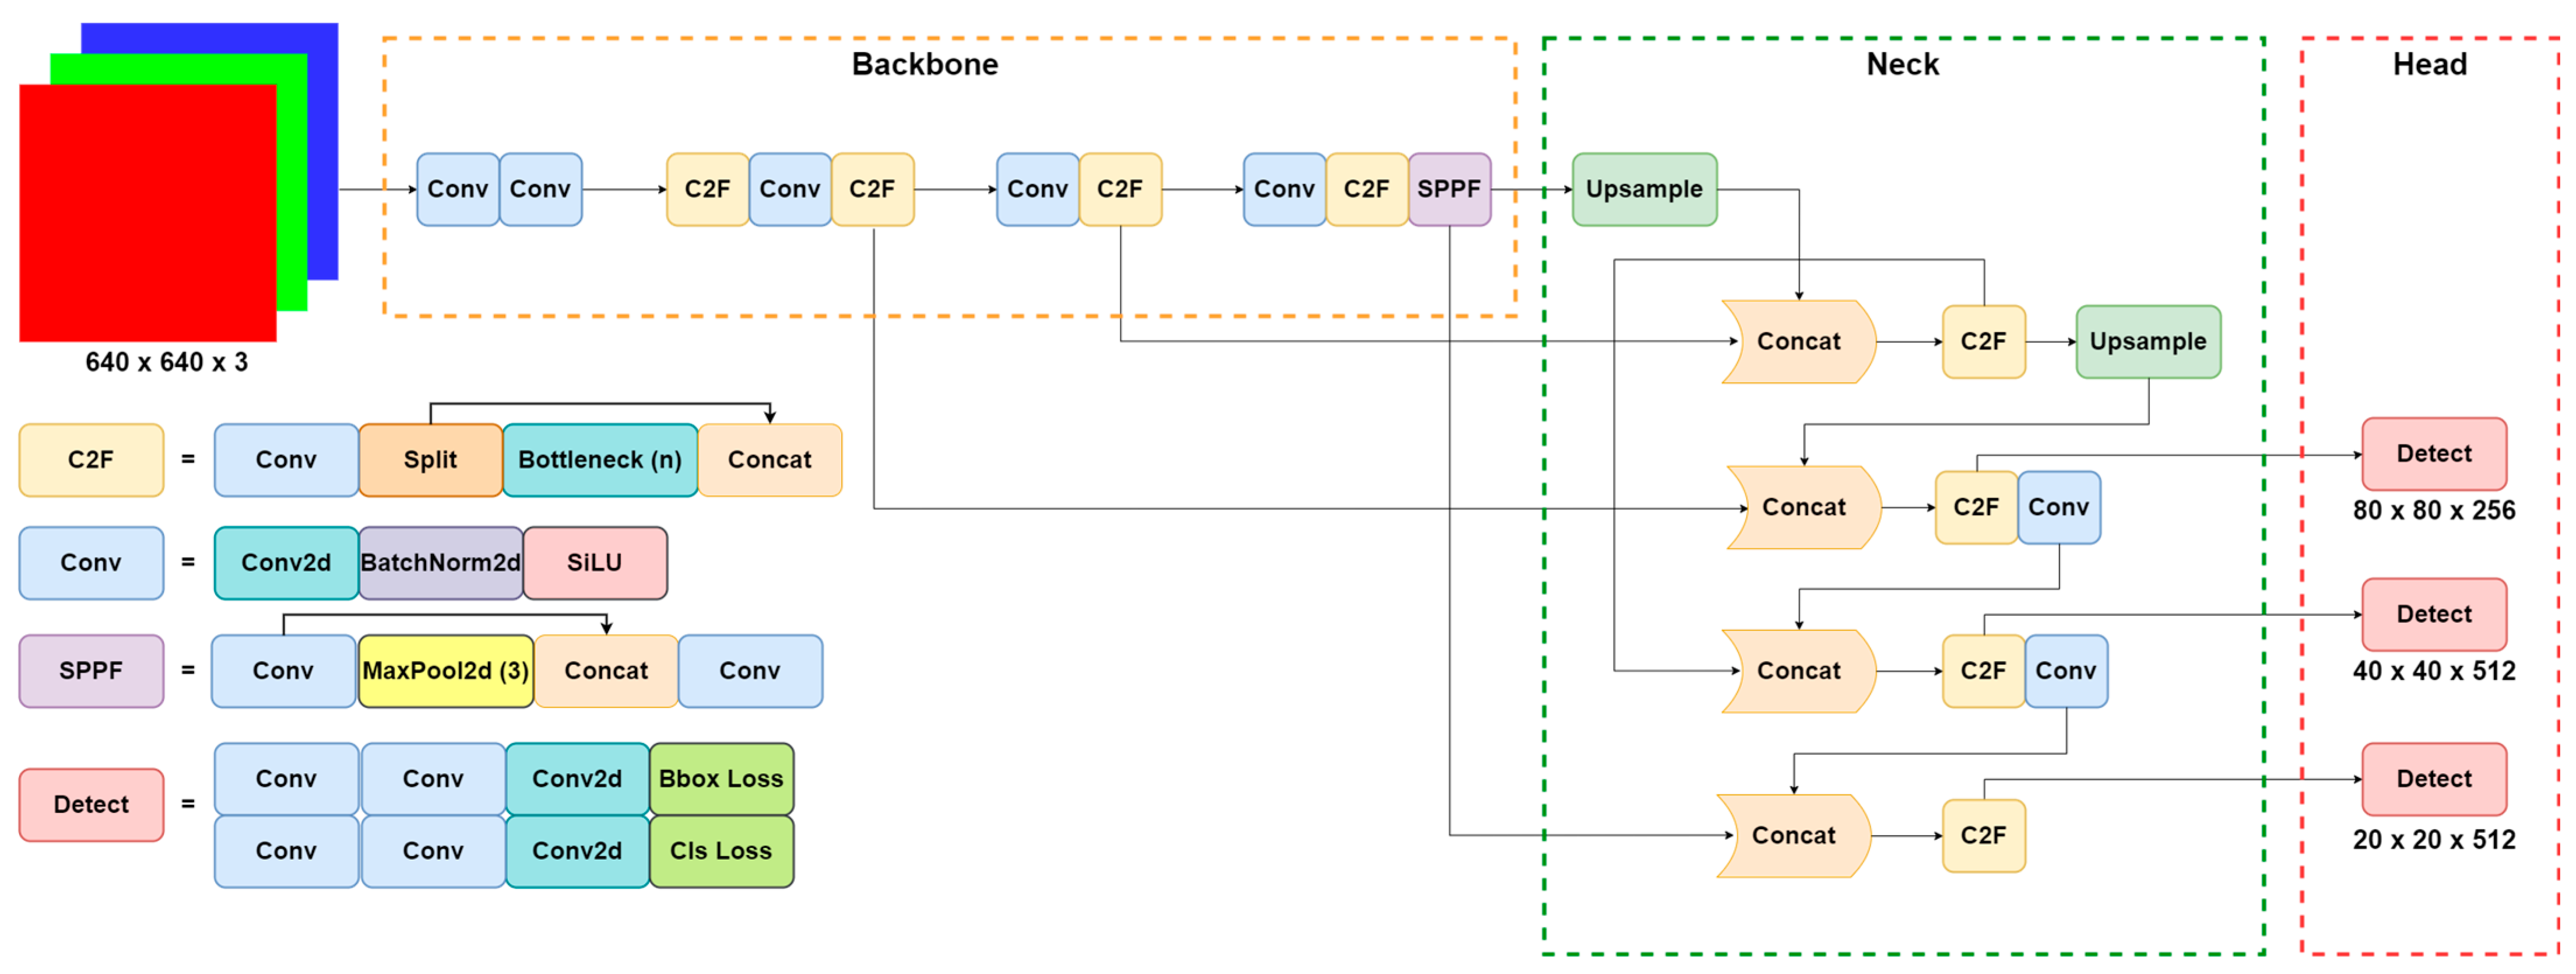
2.3.1. Network Architecture
2.3.2. Attention Mechanism
2.3.3. EIOU Loss Function
2.3.4. Defect Information Evaluation
3. Results
3.1. Evaluation Indicators
3.2. Performance Comparison Experiment
3.3. Ablation Experiment
3.4. System Integration
4. Conclusions
Author Contributions
Funding
Data Availability Statement
Conflicts of Interest
References
- Eckel, Z.C.; Zhou, C.; Martin, J.H.; Jacobsen, A.J.; Carter, W.B.; Schaedler, T.A. Additive Manufacturing of Polymer-Derived Ceramics. Science 2016, 351, 58–62. [Google Scholar] [CrossRef] [PubMed]
- Cui, H.; Yao, D.; Hensleigh, R.; Lu, H.; Calderon, A.; Xu, Z.; Davaria, S.; Wang, Z.; Mercier, P.; Tarazaga, P.; et al. Design and Printing of Proprioceptive Three-Dimensional Architected Robotic Metamaterials. Science 2022, 376, 1287–1293. [Google Scholar] [CrossRef] [PubMed]
- Wang, P.; Li, J.; Wang, G.; He, L.; Yang, J.; Zhang, C.; Han, Z.; Yan, Y. Hybrid Additive Manufacturing Based on Vat Photopolymerization and Laser-Activated Selective Metallization for Three-Dimensional Conformal Electronics. Addit. Manuf. 2023, 63, 103388. [Google Scholar] [CrossRef]
- Wang, P.; Li, J.; Deng, L.; Liu, S.; Wang, G.; Huang, J.; Tang, X.; Han, L. Laser-Activated Selective Electroless Plating on 3D Structures via Additive Manufacturing for Customized Electronics. Adv. Mater. Technol. 2023, 8, 2300516. [Google Scholar] [CrossRef]
- 3D Printing of Multilayered and Multimaterial Electronics: A Review—Goh—2021—Advanced Electronic Materials—Wiley Online Library. Available online: https://onlinelibrary.wiley.com/doi/abs/10.1002/aelm.202100445 (accessed on 28 September 2023).
- Schwartz, J.J.; Boydston, A.J. Multimaterial Actinic Spatial Control 3D and 4D Printing. Nat. Commun. 2019, 10, 791. [Google Scholar] [CrossRef]
- Wang, P.; Li, J.; Wang, G.; He, L.; Yu, Y.; Xu, B. Multimaterial Additive Manufacturing of LTCC Matrix and Silver Conductors for 3D Ceramic Electronics. Adv. Mater. Technol. 2022, 7, 2101462. [Google Scholar] [CrossRef]
- Sampson, K.L.; Deore, B.; Go, A.; Nayak, M.A.; Orth, A.; Gallerneault, M.; Malenfant, P.R.L.; Paquet, C. Multimaterial Vat Polymerization Additive Manufacturing. ACS Appl. Polym. Mater. 2021, 3, 4304–4324. [Google Scholar] [CrossRef]
- Meng, L.; McWilliams, B.; Jarosinski, W.; Park, H.-Y.; Jung, Y.-G.; Lee, J.; Zhang, J. Machine Learning in Additive Manufacturing: A Review. JOM 2020, 72, 2363–2377. [Google Scholar] [CrossRef]
- Mital, A.; Govindaraju, M.; Subramani, B. A Comparison between Manual and Hybrid Methods in Parts Inspection. Integr. Manuf. Syst. 1998, 9, 344–349. [Google Scholar] [CrossRef]
- Malamas, E.N.; Petrakis, E.G.M.; Zervakis, M.; Petit, L.; Legat, J.-D. A Survey on Industrial Vision Systems, Applications and Tools. Image Vis. Comput. 2003, 21, 171–188. [Google Scholar] [CrossRef]
- ISO 9712; 2012 Non-Destructive Testing—Qualification and Certification of NDT Personnel. ISO: Geneva, Switzerland, 2012.
- Shaloo, M.; Schnall, M.; Klein, T.; Huber, N.; Reitinger, B. A Review of Non-Destructive Testing (NDT) Techniques for Defect Detection: Application to Fusion Welding and Future Wire Arc Additive Manufacturing Processes. Materials 2022, 15, 3697. [Google Scholar] [CrossRef] [PubMed]
- Ramírez, I.S.; Márquez, F.P.G.; Papaelias, M. Review on Additive Manufacturing and Non-Destructive Testing. J. Manuf. Syst. 2023, 66, 260–286. [Google Scholar] [CrossRef]
- Machado, M.A.; Rosado, L.S.; Santos, T.G. Shaping Eddy Currents for Non-Destructive Testing Using Additive Manufactured Magnetic Substrates. J. Nondestruct. Eval. 2022, 41, 50. [Google Scholar] [CrossRef]
- Ren, Z.; Fang, F.; Yan, N.; Wu, Y. State of the Art in Defect Detection Based on Machine Vision. Int. J. Precis. Eng. Manuf.-Green Technol. 2022, 9, 661–691. [Google Scholar] [CrossRef]
- Fu, Y.; Downey, A.R.J.; Yuan, L.; Zhang, T.; Pratt, A.; Balogun, Y. Machine Learning Algorithms for Defect Detection in Metal Laser-Based Additive Manufacturing: A Review. J. Manuf. Process. 2022, 75, 693–710. [Google Scholar] [CrossRef]
- Jiang, P.; Ergu, D.; Liu, F.; Cai, Y.; Ma, B. A Review of Yolo Algorithm Developments. Procedia Comput. Sci. 2022, 199, 1066–1073. [Google Scholar] [CrossRef]
- Zdravković, M.; Korunović, N. Novel Methodology for Real-Time Structural Analysis Assistance in Custom Product Design. FU Mech Eng. 2023, 21, 293. [Google Scholar] [CrossRef]
- Bakas, G.; Bei, K.; Skaltsas, I.; Gkartzou, E.; Tsiokou, V.; Papatheodorou, A.; Karatza, A.; Koumoulos, E.P. Object Detection: Custom Trained Models for Quality Monitoring of Fused Filament Fabrication Process. Processes 2022, 10, 2147. [Google Scholar] [CrossRef]
- Xu, L.; Zhang, X.; Ma, F.; Chang, G.; Zhang, C.; Li, J.; Wang, S.; Huang, Y. Detecting Defects in Fused Deposition Modeling Based on Improved YOLO V4. Mater. Res. Express 2023, 10, 095304. [Google Scholar] [CrossRef]
- Wang, P.; Li, J.; Wang, G.; Hai, Y.; He, L.; Yu, Y.; Wang, X.; Chen, M.; Xu, B. Selectively Metalizable Low-Temperature Cofired Ceramic for Three-Dimensional Electronics via Hybrid Additive Manufacturing. ACS Appl. Mater. Interfaces 2022, 14, 28060–28073. [Google Scholar] [CrossRef]
- Liu, J.; Zhu, X.; Zhou, X.; Qian, S.; Yu, J. Defect Detection for Metal Base of TO-Can Packaged Laser Diode Based on Improved YOLO Algorithm. Electronics 2022, 11, 1561. [Google Scholar] [CrossRef]
- Zhang, Y.; Ni, Q. A Novel Weld-Seam Defect Detection Algorithm Based on the S-YOLO Model. Axioms 2023, 12, 697. [Google Scholar] [CrossRef]
- Jiang, L.; Yuan, B.; Wang, Y.; Ma, Y.; Du, J.; Wang, F.; Guo, J. MA-YOLO: A Method for Detecting Surface Defects of Aluminum Profiles With Attention Guidance. IEEE Access 2023, 11, 71269–71286. [Google Scholar] [CrossRef]
- Du, B.; Wan, F.; Lei, G.; Xu, L.; Xu, C.; Xiong, Y. YOLO-MBBi: PCB Surface Defect Detection Method Based on Enhanced YOLOv5. Electronics 2023, 12, 2821. [Google Scholar] [CrossRef]
- Hou, Q.; Zhou, D.; Feng, J. Coordinate Attention for Efficient Mobile Network Design. In Proceedings of the 2021 IEEE/CVF Conference on Computer Vision and Pattern Recognition (CVPR), Nashville, TN, USA, 20–25 June 2021; pp. 13708–13717. [Google Scholar]
- Hu, J.; Shen, L.; Albanie, S.; Sun, G.; Wu, E. Squeeze-and-Excitation Networks. IEEE Trans. Pattern Anal. Mach. Intell. 2020, 42, 2011–2023. [Google Scholar] [CrossRef] [PubMed]
- Woo, S.; Park, J.; Lee, J.-Y.; Kweon, I.S. CBAM: Convolutional Block Attention Module. In Computer Vision—ECCV 2018; Ferrari, V., Hebert, M., Sminchisescu, C., Weiss, Y., Eds.; Lecture Notes in Computer Science; Springer International Publishing: Cham, Switzerland, 2018; Volume 11211, pp. 3–19. ISBN 978-3-030-01233-5. [Google Scholar]
- Zheng, Z.; Wang, P.; Ren, D.; Liu, W.; Ye, R.; Hu, Q.; Zuo, W. Enhancing Geometric Factors in Model Learning and Inference for Object Detection and Instance Segmentation. IEEE Trans. Cybern. 2022, 52, 8574–8586. [Google Scholar] [CrossRef]
- Zhang, Y.-F.; Ren, W.; Zhang, Z.; Jia, Z.; Wang, L.; Tan, T. Focal and Efficient IOU Loss for Accurate Bounding Box Regression. Neurocomputing 2022, 506, 146–157. [Google Scholar] [CrossRef]
- Paszke, A.; Gross, S.; Massa, F.; Lerer, A.; Bradbury, J.; Chanan, G.; Killeen, T.; Lin, Z.; Gimelshein, N.; Antiga, L.; et al. PyTorch: An Imperative Style, High-Performance Deep Learning Library. arXiv 2019, arXiv:1912.01703. [Google Scholar]
- A Review of Research on Object Detection Based on Deep Learning—IOP Science. Available online: https://iopscience.iop.org/article/10.1088/1742-6596/1684/1/012028/meta (accessed on 28 September 2023).


| Scheme | Precision | Recall | mAP50 | FPS |
|---|---|---|---|---|
| Faster R-CNN | 76.6% | 68.8% | 74.5% | 5 |
| Cascade R-CNN | 75.1% | 75.2% | 78.4% | 4 |
| YOLOv5s | 77.8% | 68.0% | 74.2% | 100 |
| YOLOv6n | 80.8% | 73.1% | 79.1% | 45 |
| YOLOv7 | 80.1% | 68.5% | 76.7% | 83 |
| PP-YOLOEs | 80.2% | 74.3% | 78.8% | 66 |
| YOLOv8n | 85.1% | 75.8% | 82.7% | 90 |
Disclaimer/Publisher’s Note: The statements, opinions and data contained in all publications are solely those of the individual author(s) and contributor(s) and not of MDPI and/or the editor(s). MDPI and/or the editor(s) disclaim responsibility for any injury to people or property resulting from any ideas, methods, instructions or products referred to in the content. |
© 2023 by the authors. Licensee MDPI, Basel, Switzerland. This article is an open access article distributed under the terms and conditions of the Creative Commons Attribution (CC BY) license (https://creativecommons.org/licenses/by/4.0/).
Share and Cite
Wang, W.; Wang, P.; Zhang, H.; Chen, X.; Wang, G.; Lu, Y.; Chen, M.; Liu, H.; Li, J. A Real-Time Defect Detection Strategy for Additive Manufacturing Processes Based on Deep Learning and Machine Vision Technologies. Micromachines 2024, 15, 28. https://doi.org/10.3390/mi15010028
Wang W, Wang P, Zhang H, Chen X, Wang G, Lu Y, Chen M, Liu H, Li J. A Real-Time Defect Detection Strategy for Additive Manufacturing Processes Based on Deep Learning and Machine Vision Technologies. Micromachines. 2024; 15(1):28. https://doi.org/10.3390/mi15010028
Chicago/Turabian StyleWang, Wei, Peiren Wang, Hanzhong Zhang, Xiaoyi Chen, Guoqi Wang, Yang Lu, Min Chen, Haiyun Liu, and Ji Li. 2024. "A Real-Time Defect Detection Strategy for Additive Manufacturing Processes Based on Deep Learning and Machine Vision Technologies" Micromachines 15, no. 1: 28. https://doi.org/10.3390/mi15010028
APA StyleWang, W., Wang, P., Zhang, H., Chen, X., Wang, G., Lu, Y., Chen, M., Liu, H., & Li, J. (2024). A Real-Time Defect Detection Strategy for Additive Manufacturing Processes Based on Deep Learning and Machine Vision Technologies. Micromachines, 15(1), 28. https://doi.org/10.3390/mi15010028