
Generation Mechanism of Anisotropy in Mechanical Properties of WE43 Fabricated by Laser Powder Bed Fusion

 , ,
, ,  and
and
Abstract
:1. Introduction
2. Materials and Methods
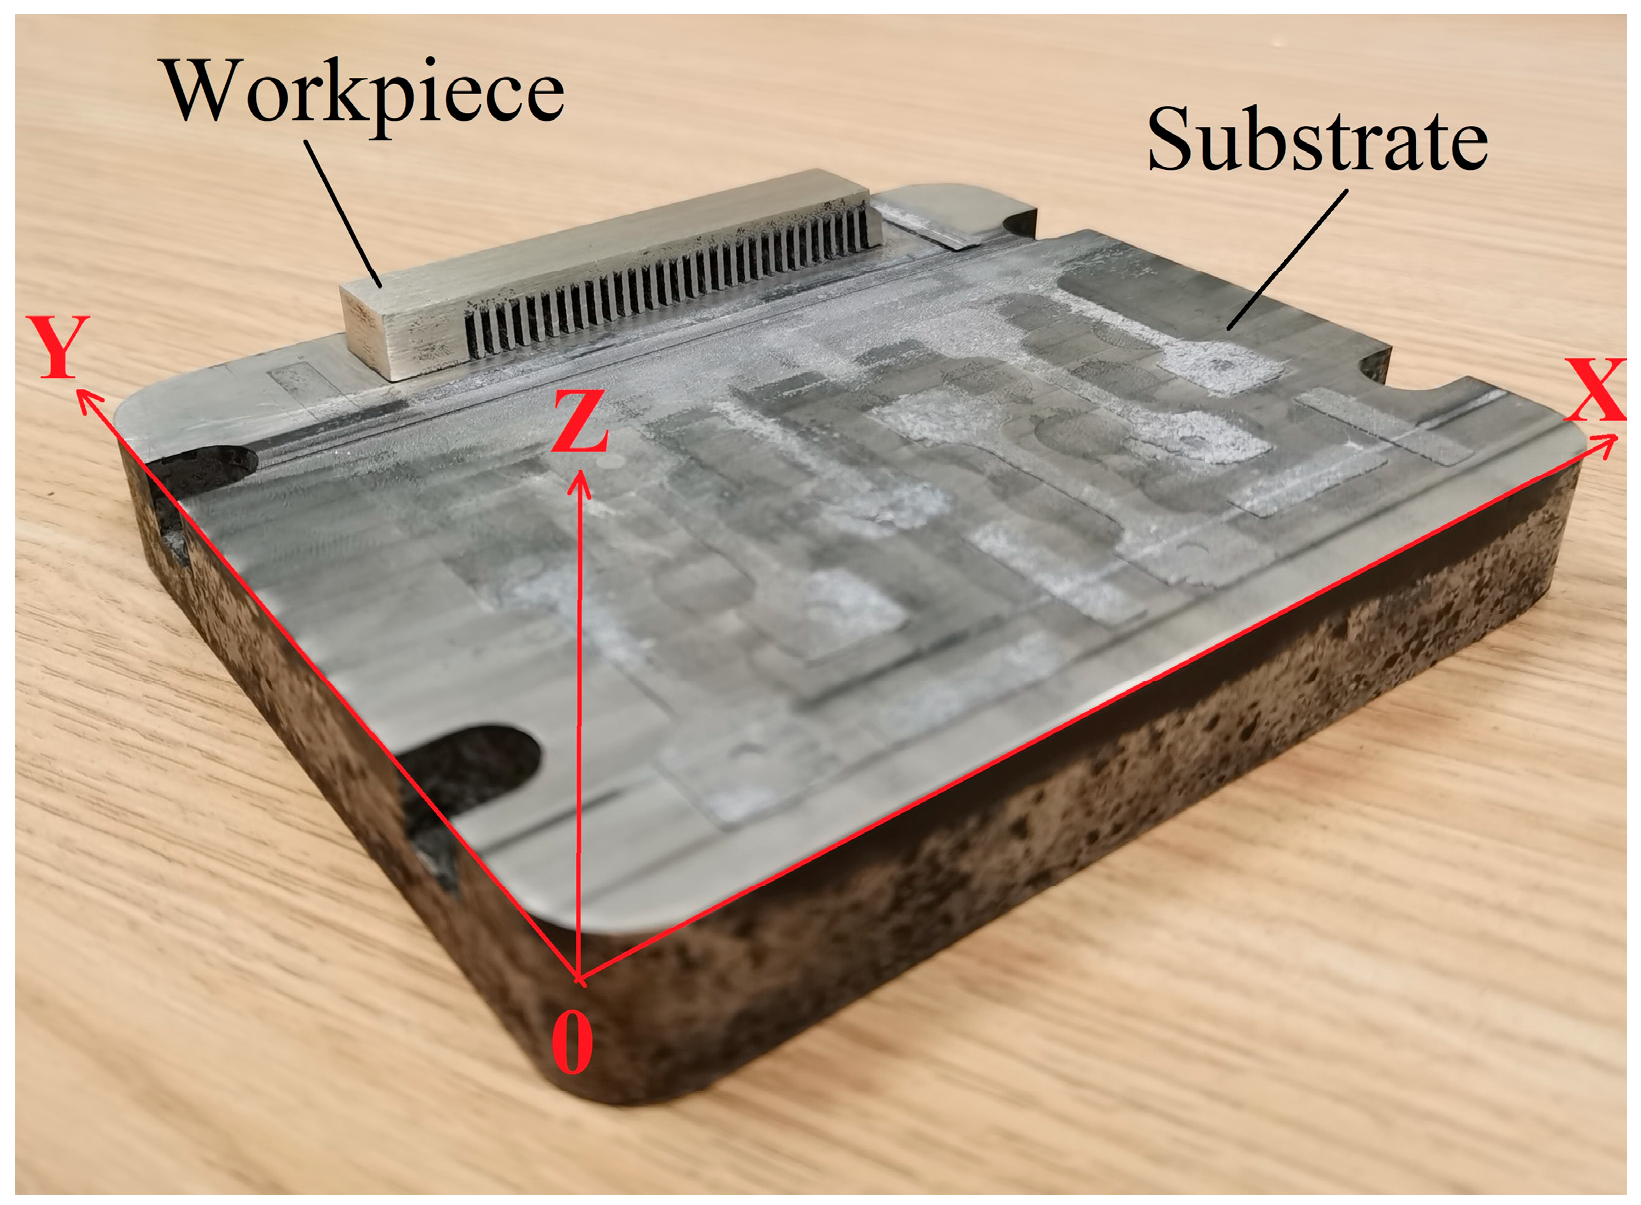
2.1. Materials
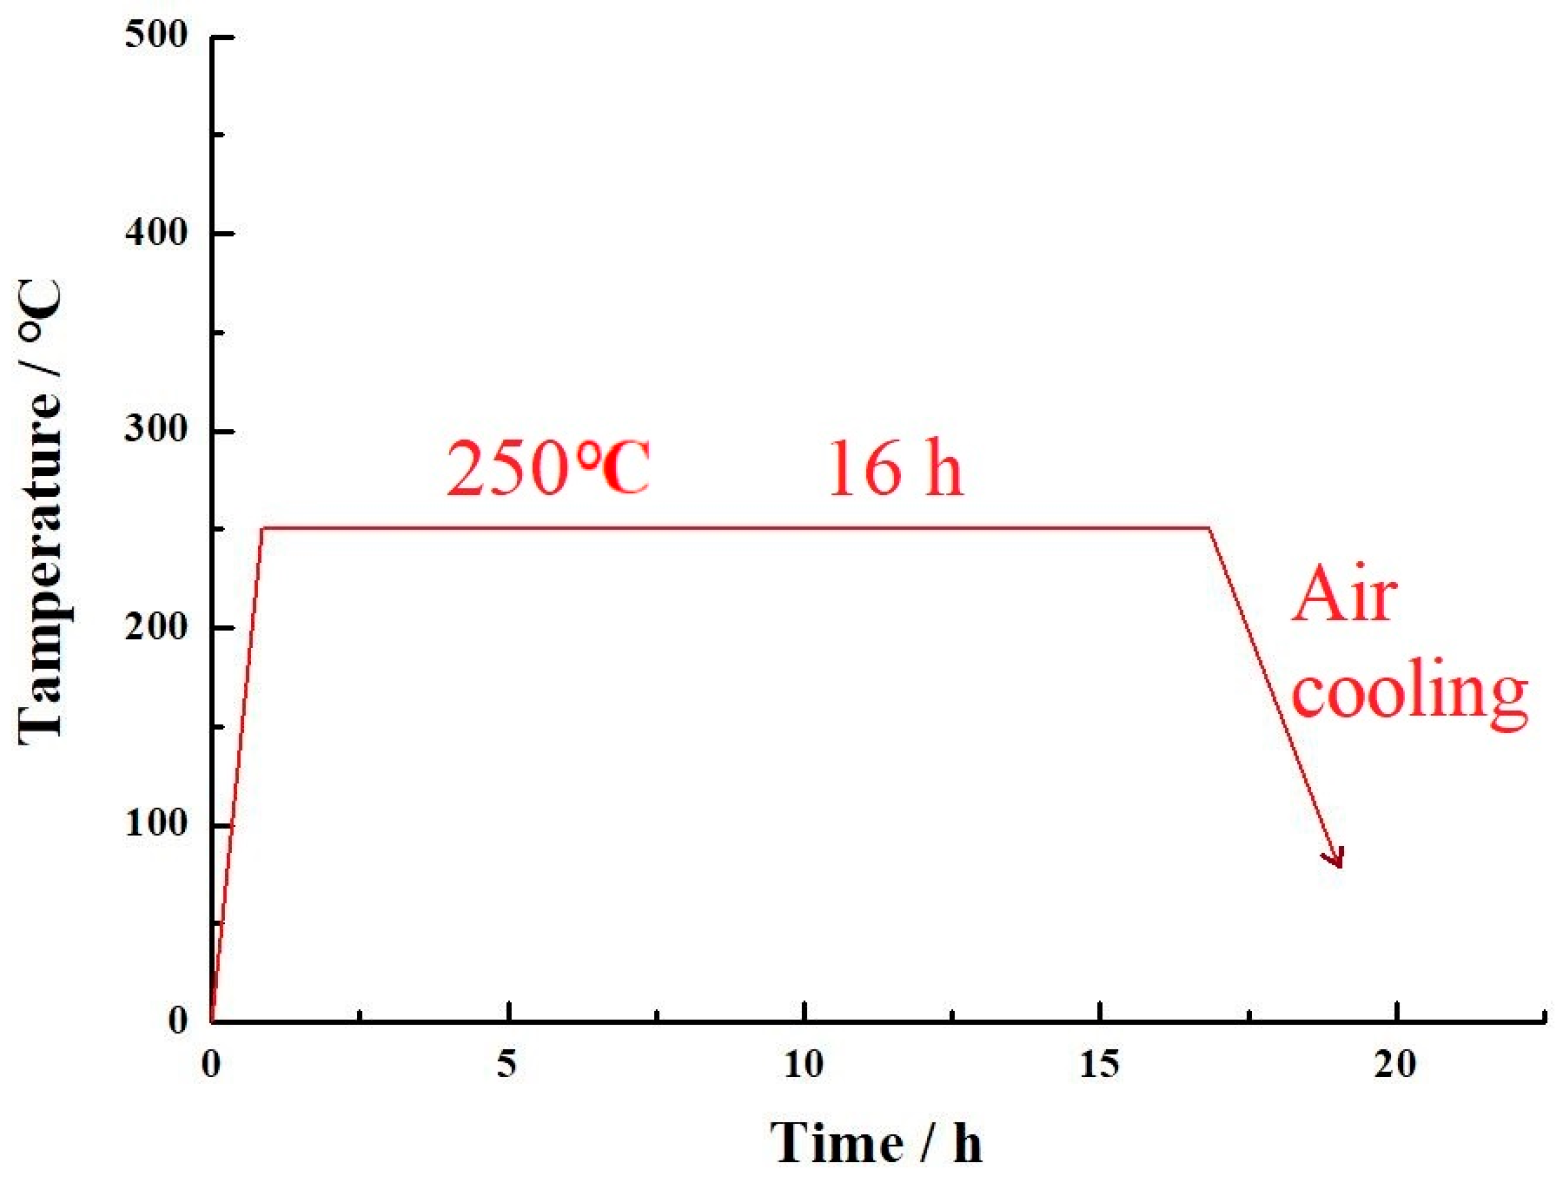
2.2. Methods
2.3. Sample Testing
3. Results and Discussion
3.1. Microhardness
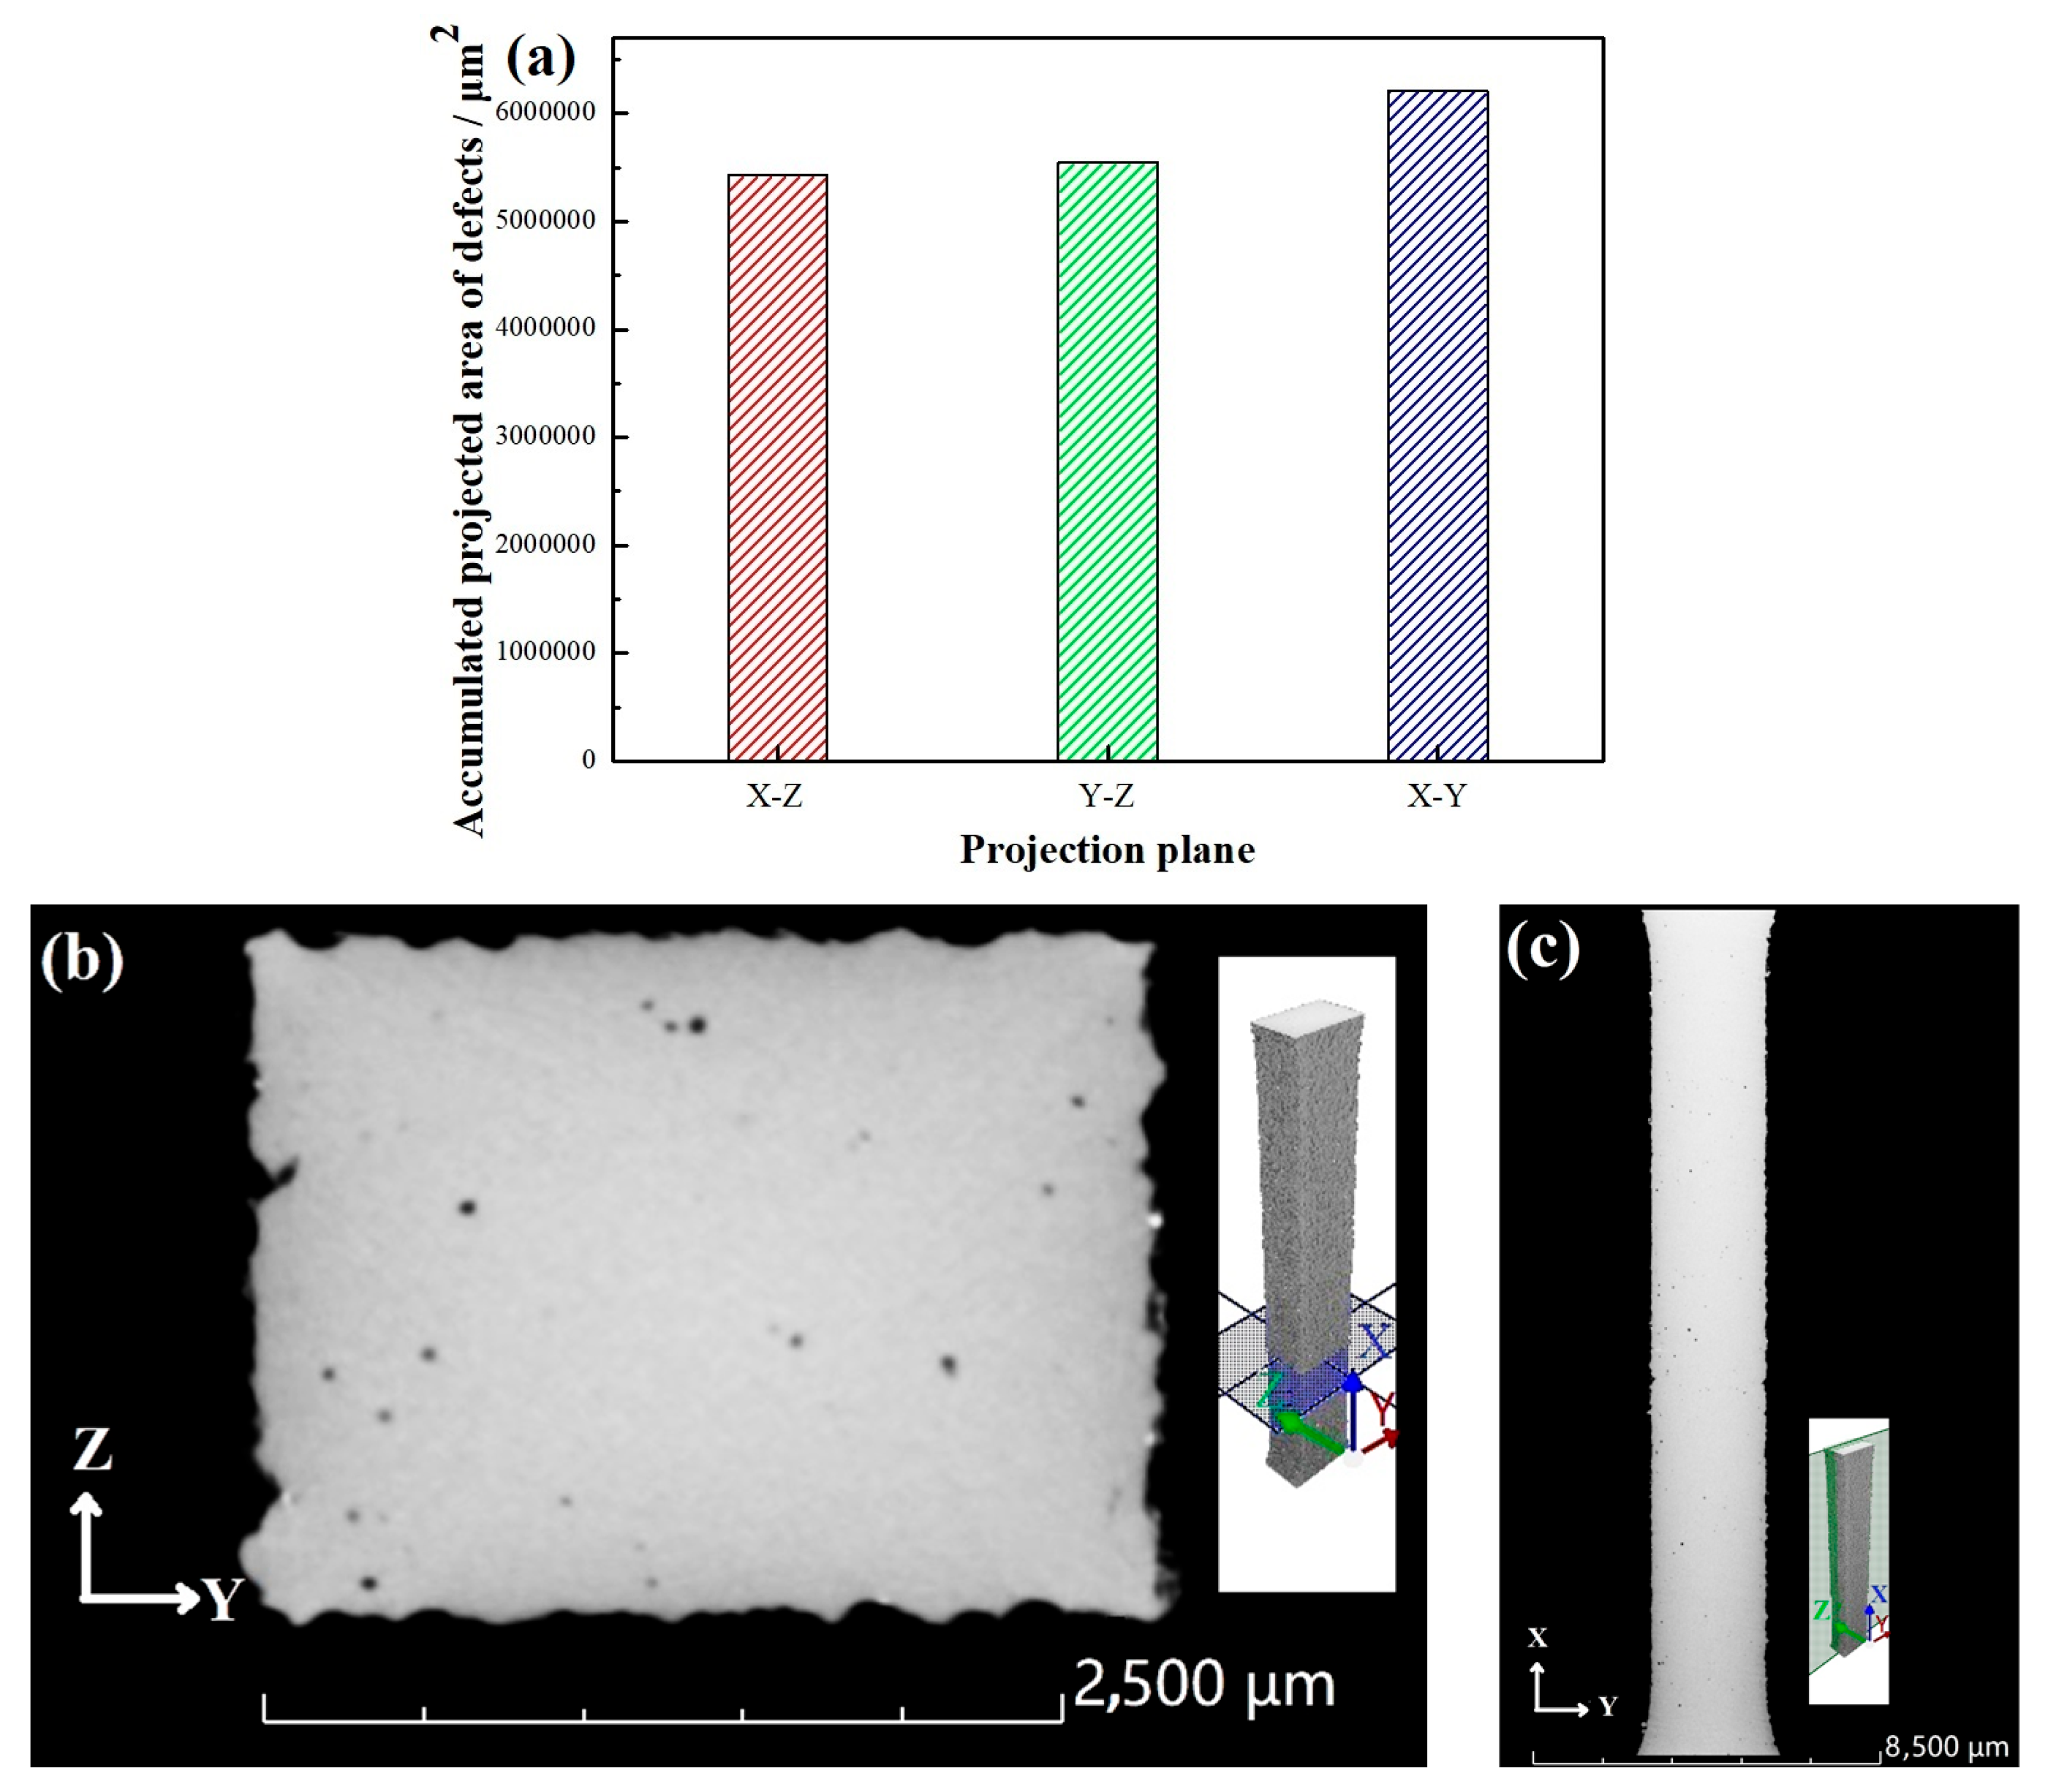
3.2. Defects
3.3. Residual Internal Stress
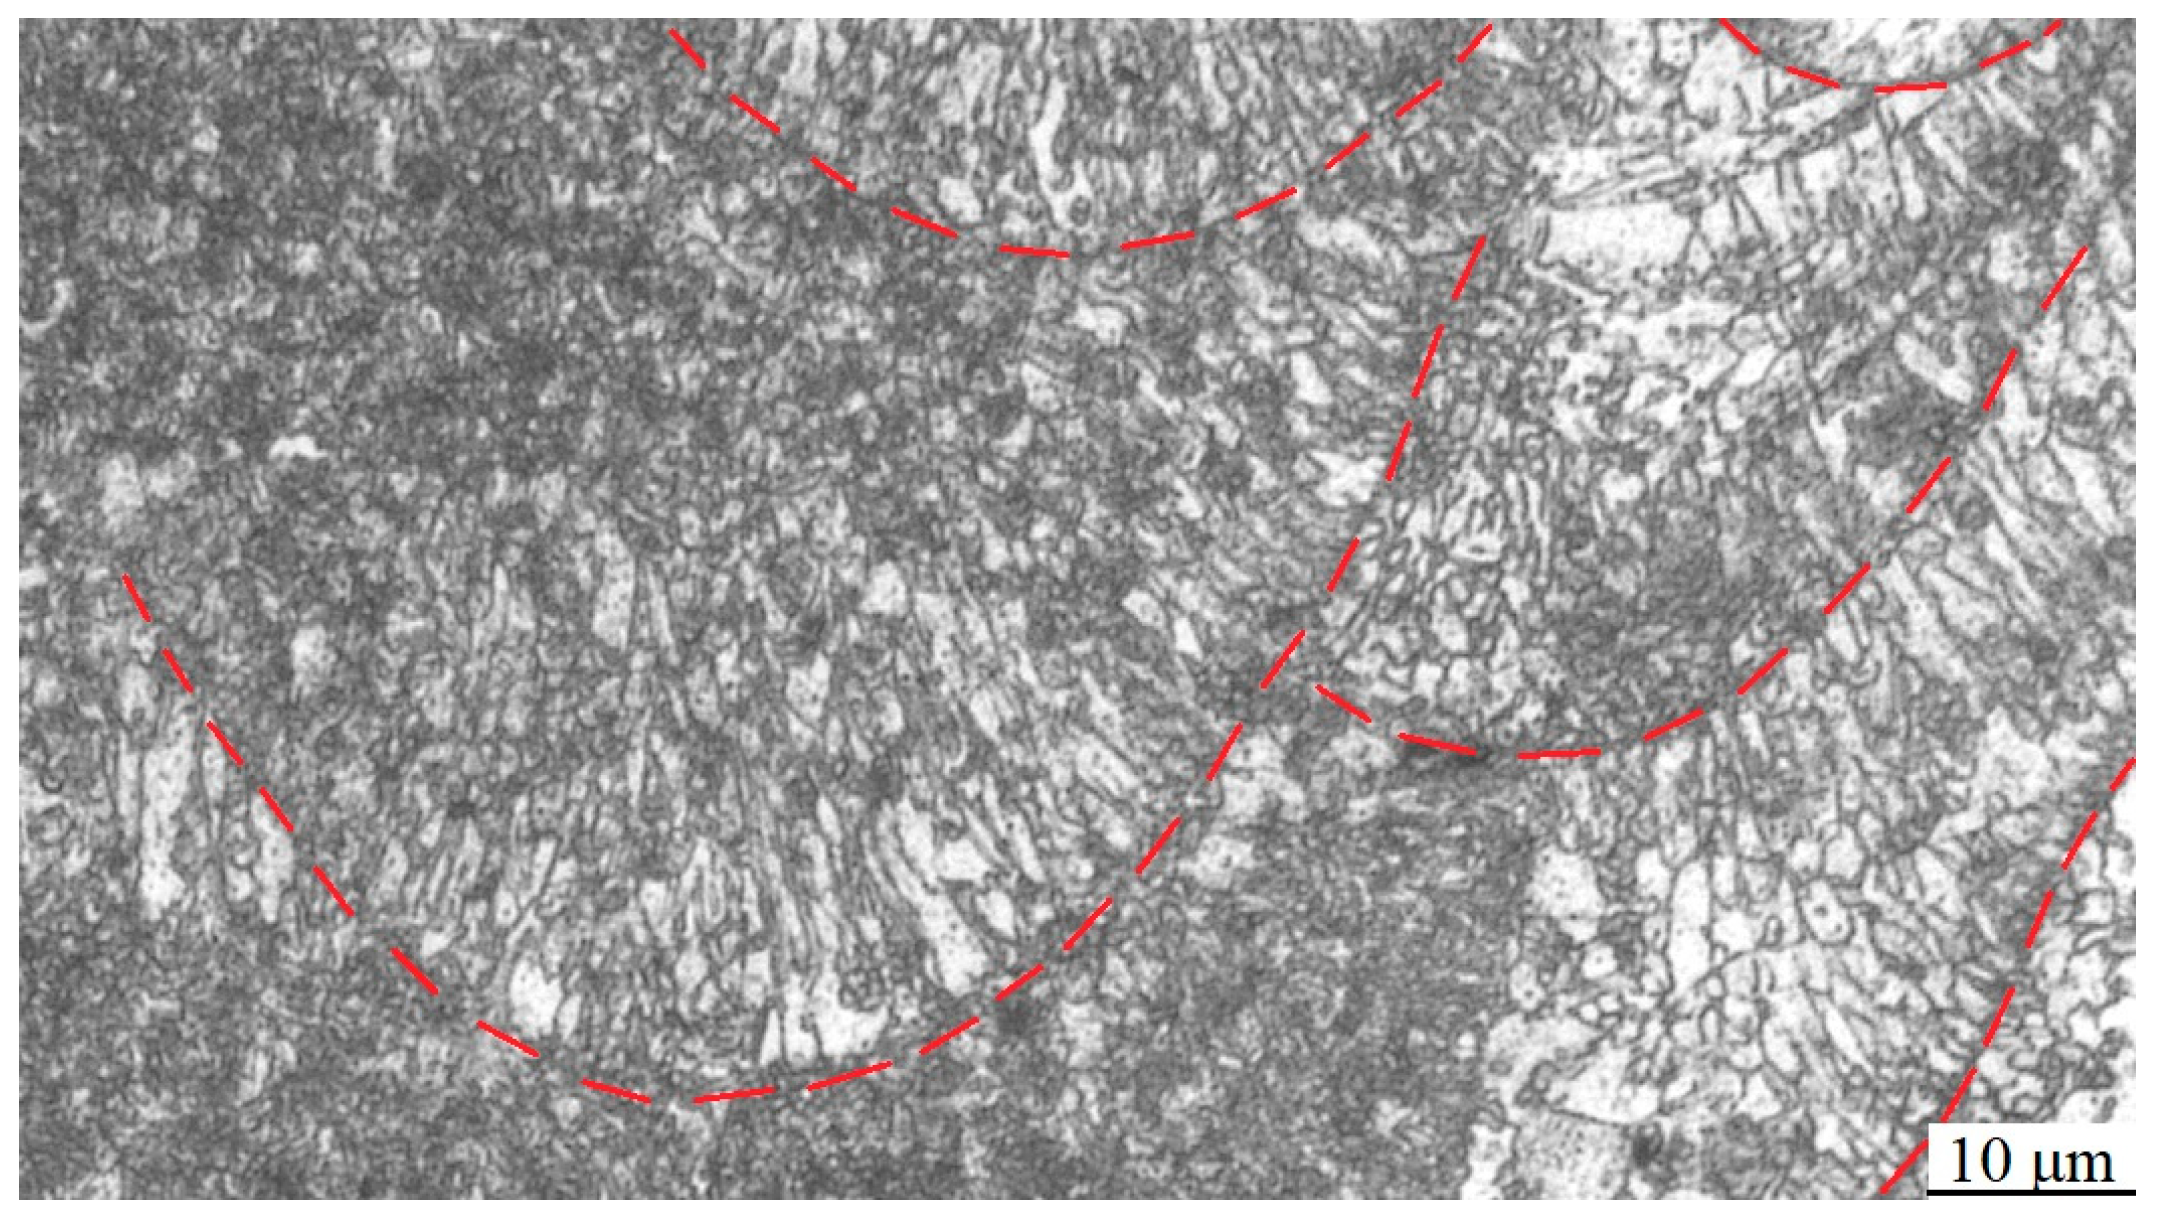
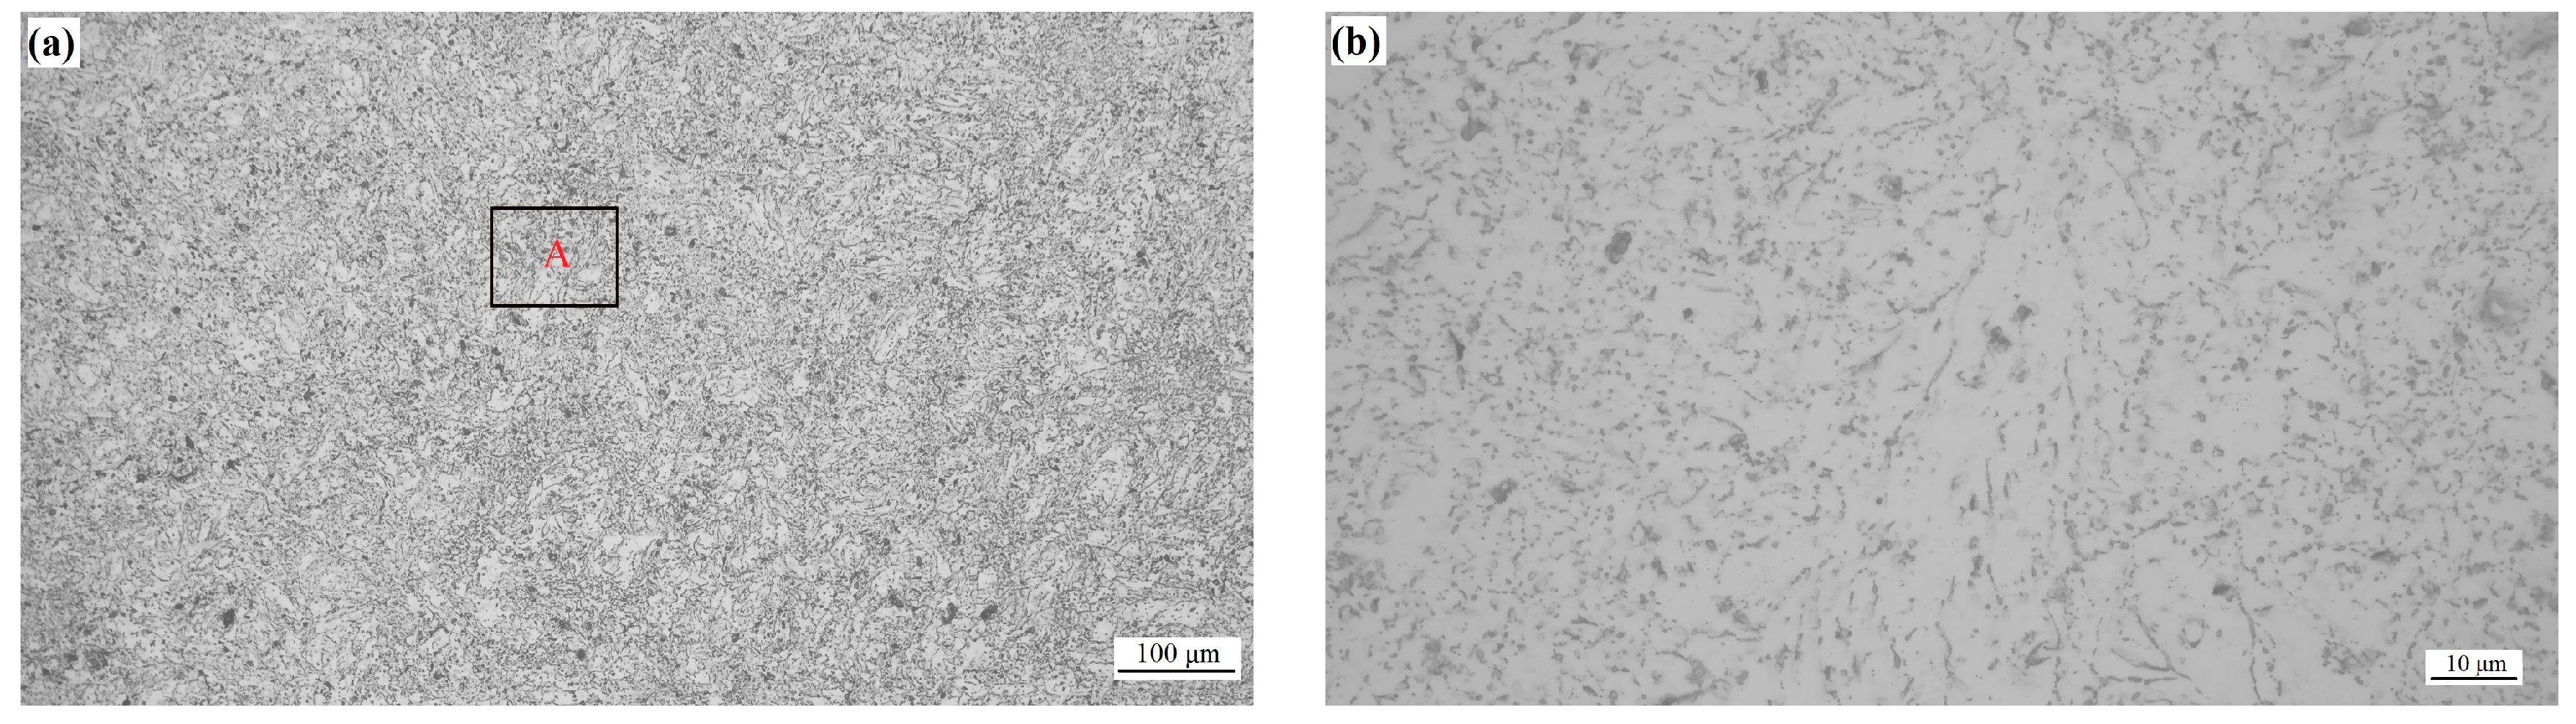
3.4. Microstructure
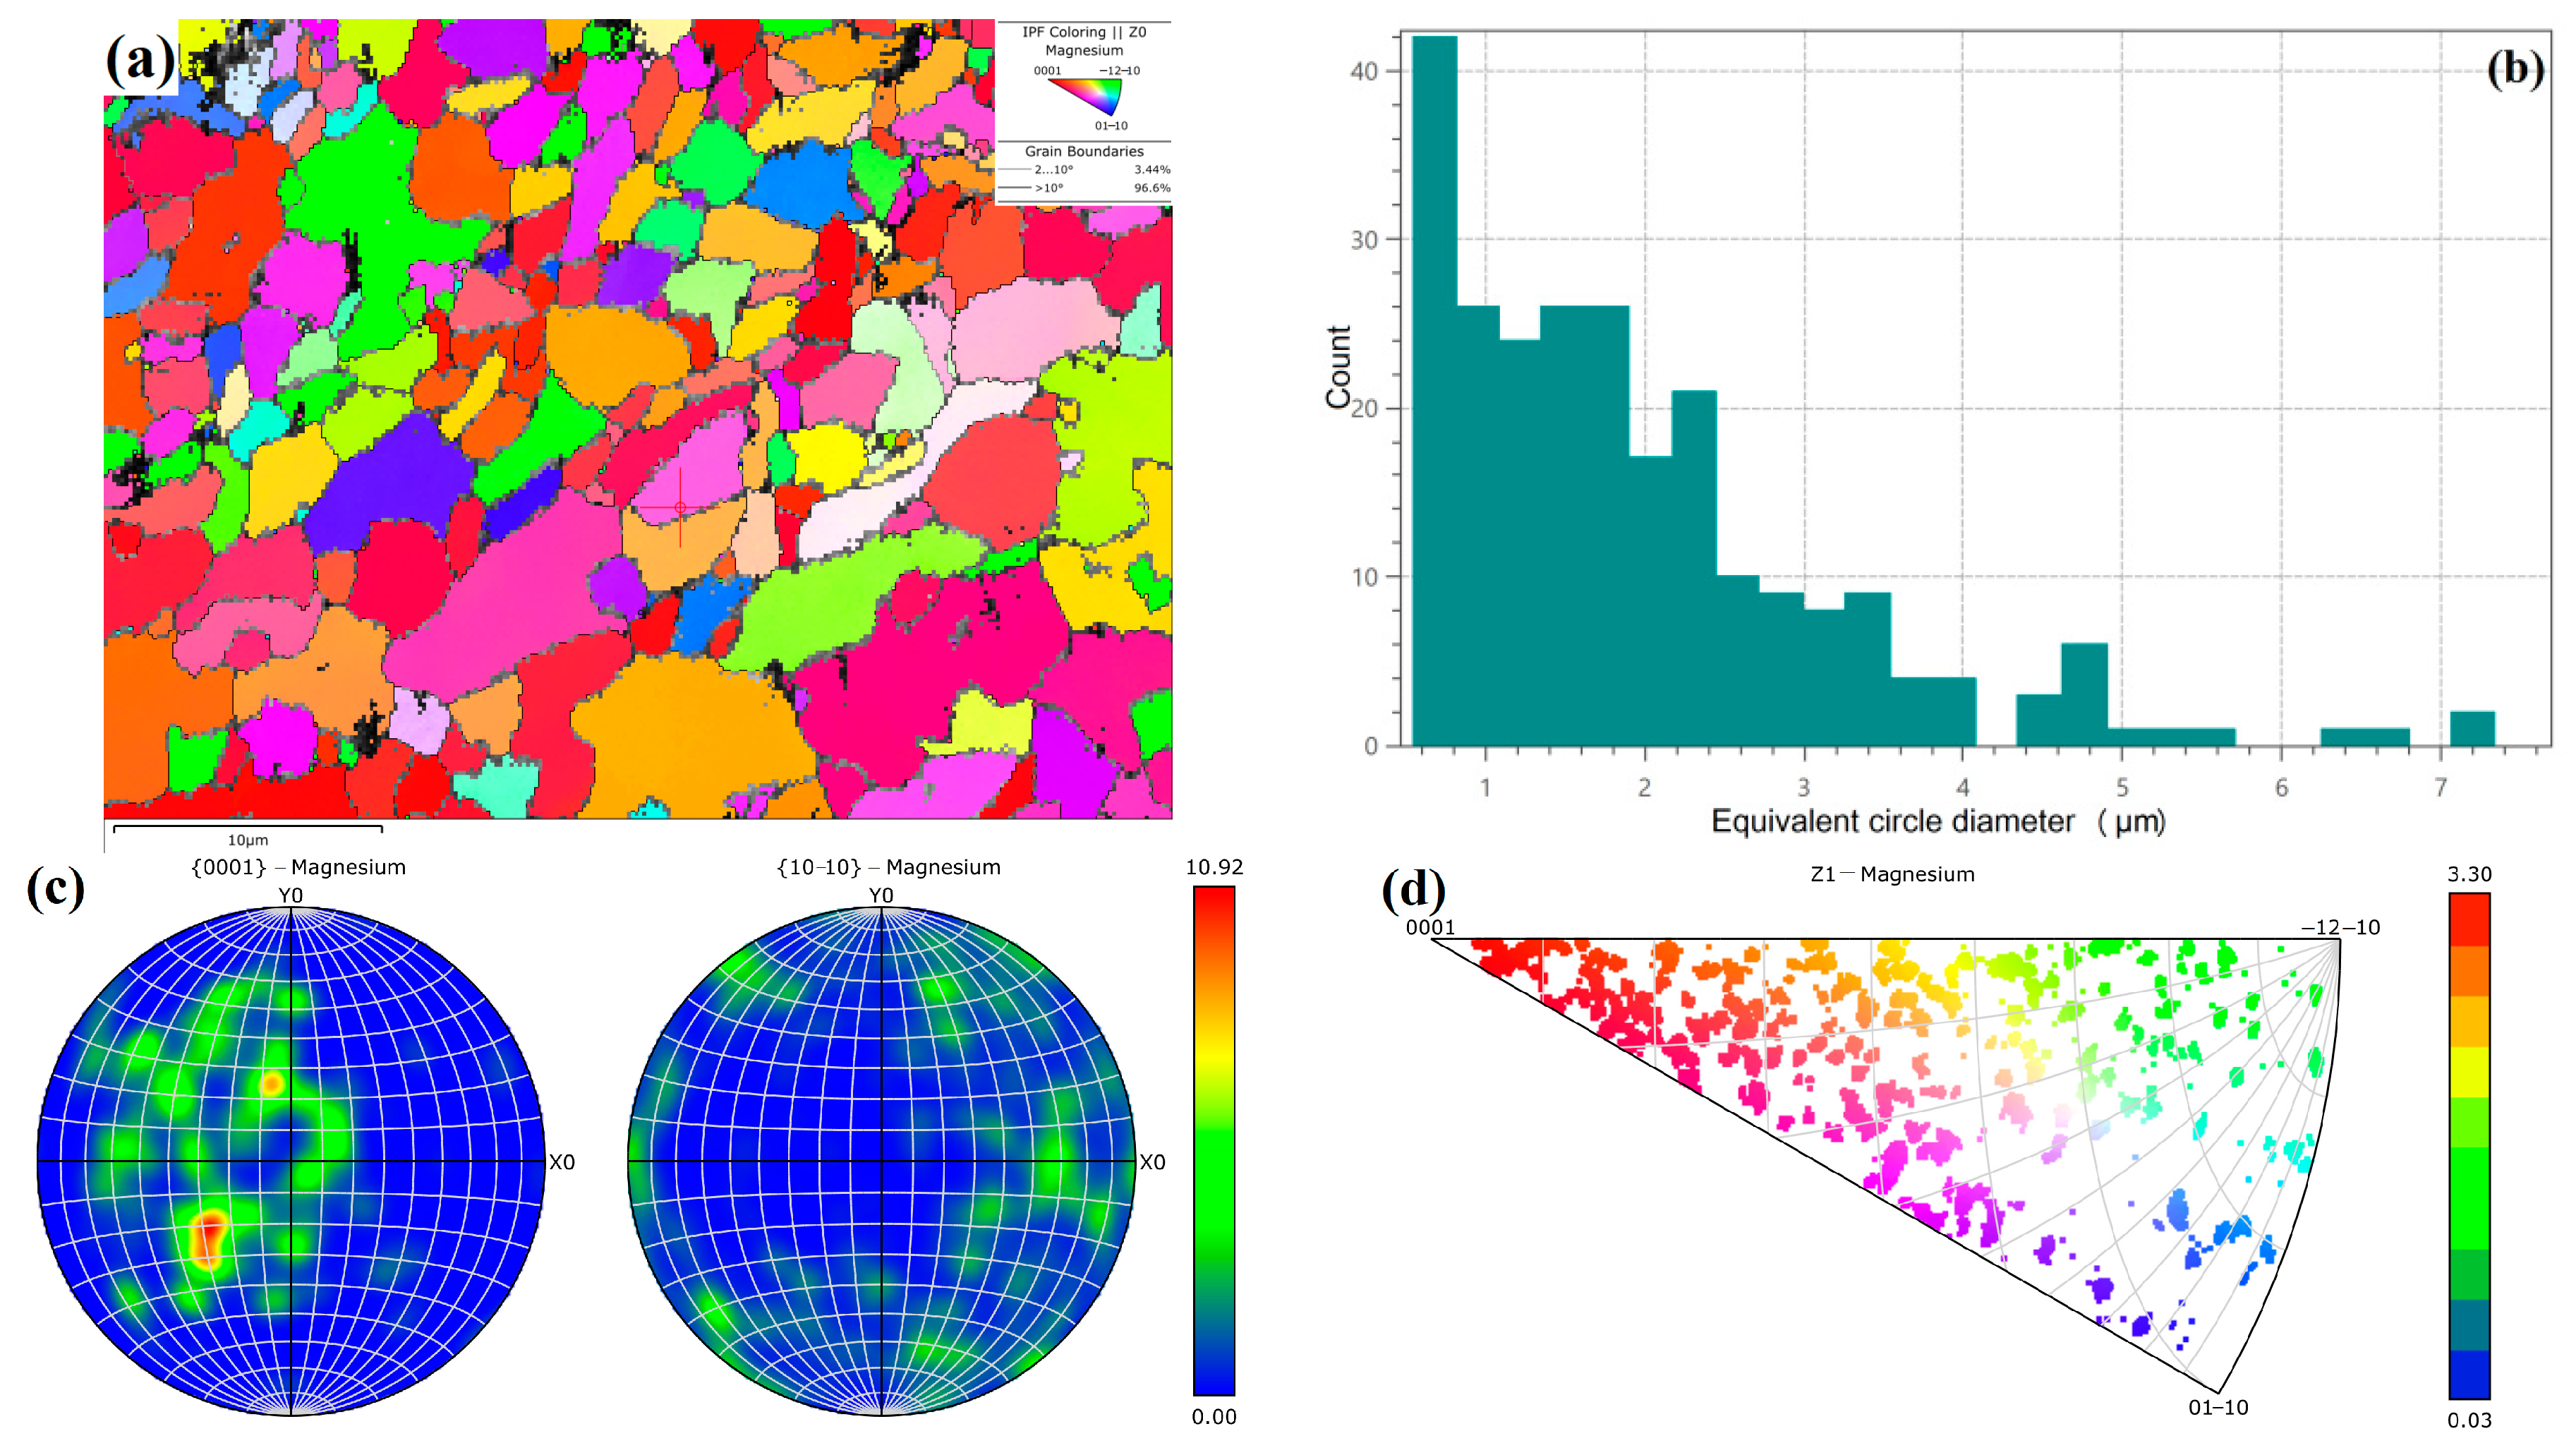
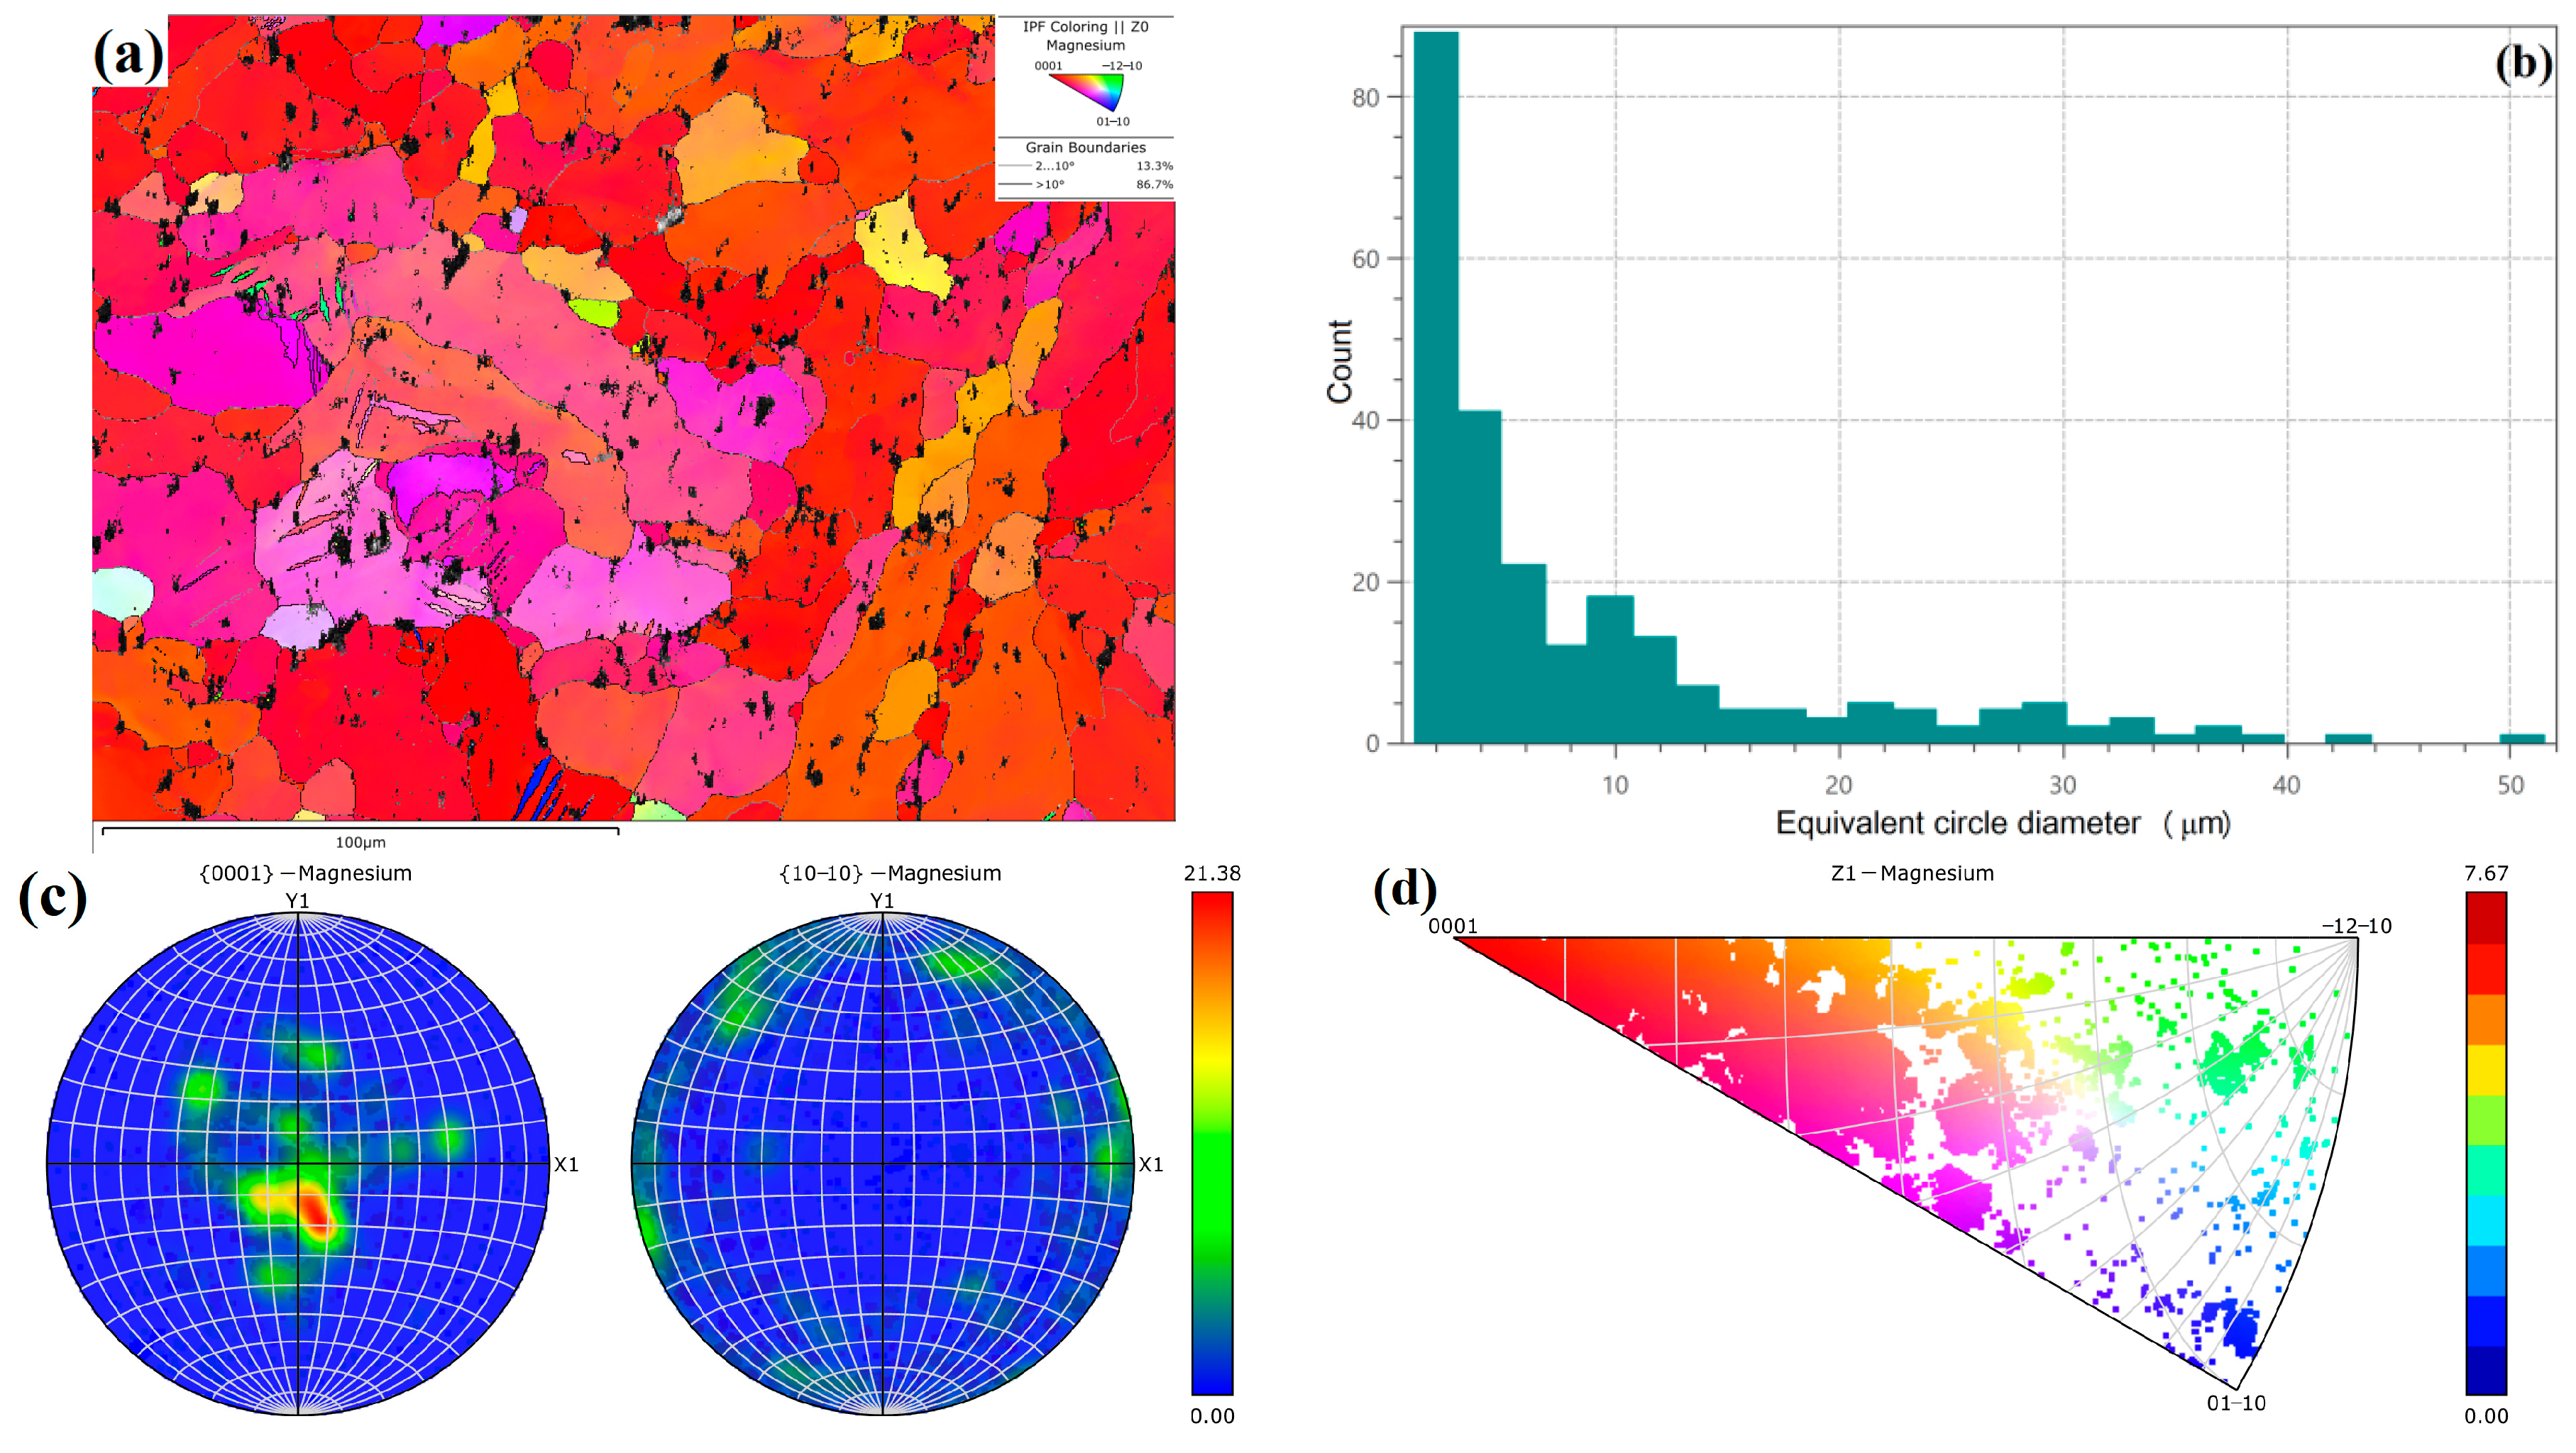
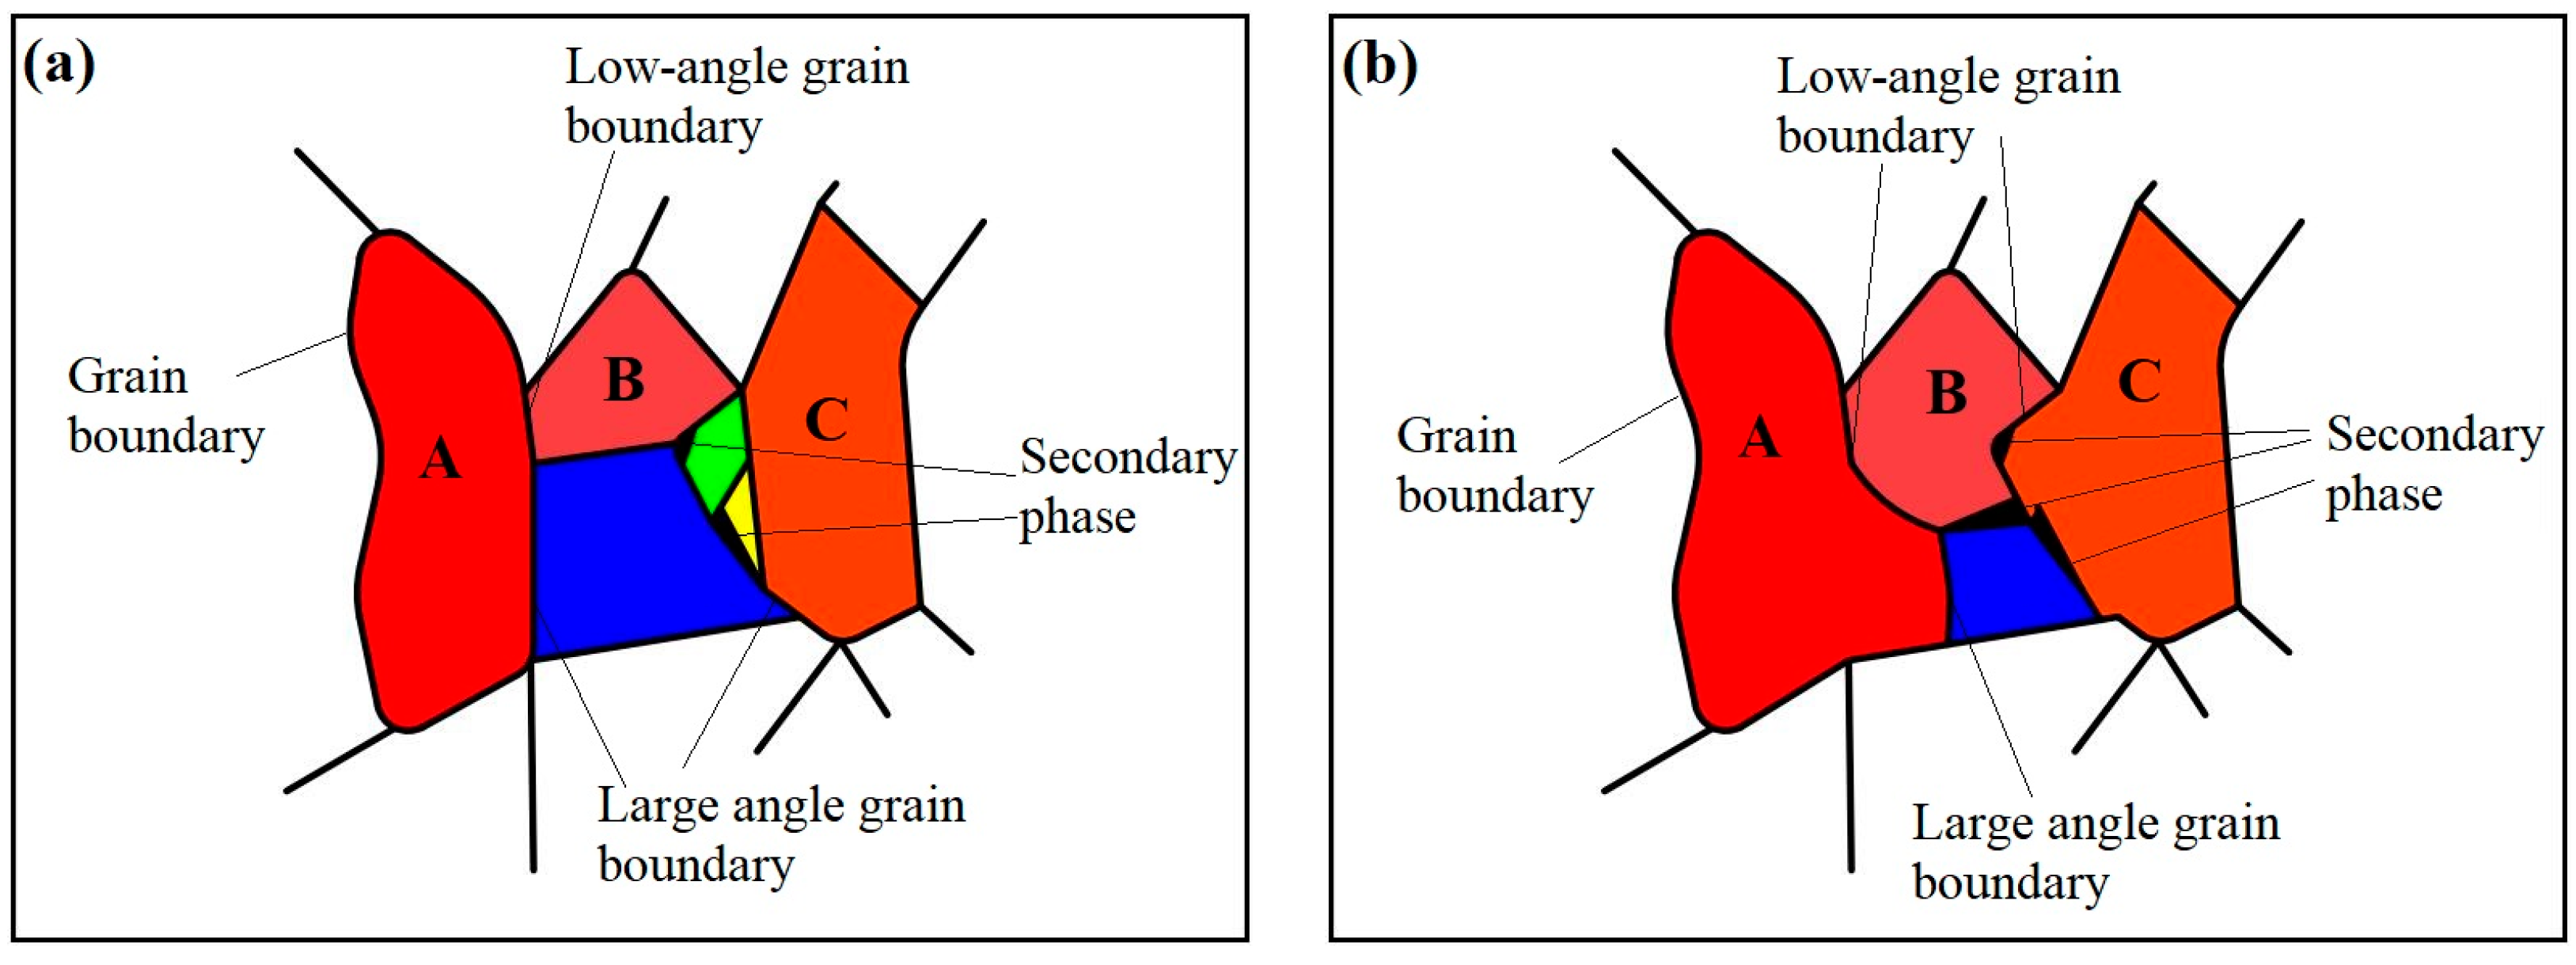
3.5. Grain Orientation
4. Conclusions
Author Contributions
Funding
Data Availability Statement
Conflicts of Interest
References
- Pang, S.S.; Zhao, W.X.; Qiu, T.Y.; Liu, W.L.; Jiao, L.; Wang, X.B. Study on Surface Quality and Mechanical Properties of Micro-Milling We43 Magnesium Alloy Cardiovascular Stent. J. Manuf. Process. 2023, 101, 108090. [Google Scholar] [CrossRef]
- Zhang, Y.; Tan, L.L.; Wang, Q.C.; Gao, M.; Iniobong, P.E.; Yang, K. Effects of Microstructure on the Torsional Properties of Biodegradable We43 Mg Alloy. J. Mater. Sci. Technol. 2020, 51, 10210. [Google Scholar] [CrossRef]
- Xu, C.; Nakata, T.; Oh-Ishi, K.; Homma, T.; Ozaki, T.; Kamado, S. Improving creep property of Mg-Gd-Zn alloy via trace Ca addition. Scr. Mater. 2017, 139, 34–38. [Google Scholar] [CrossRef]
- Kang, Y.H.; Yan, H.; Chen, R.S. Creep behavior and microstructure evolution of Sand-Cast Mg-4Y-2.3 Nd-1Gd-0.6 Zr alloy crept at 523–573 K. J. Mater. Sci. Technol. 2017, 33, 79–89. [Google Scholar] [CrossRef]
- Lei, B.; Jiang, B.; Yang, H.; Dong, Z.H.; Wang, Q.H.; Yuan, M.; Huang, G.S.; Song, J.F.; Zhang, D.F.; Pan, F.S. Effect of Nd addition on the microstructure and mechanical properties of extruded Mg-Gd-Zr alloy. Mater. Sci. Eng. A 2021, 816, 141320. [Google Scholar] [CrossRef]
- Michi, R.A.; Plotkowski, A.; Shyam, A.; Ryan, R.D.; Sudarsanam, S.B. Towards high-temperature applications of aluminium alloys enabled by additive manufacturing. Int. Mater. Rev. 2021, 67, 298–345. [Google Scholar] [CrossRef]
- Hyer, H.; Le, Z.; George, B.; Brandon, M.W.; Kyu, C.; Yongho, S. Additive Manufacturing of Dense WE43 Mg Alloy by Laser Powder Bed Fusion. Addit. Manuf. 2020, 33, 101123. [Google Scholar] [CrossRef]
- Li, K.; Chen, W.; Yin, B.Z.; Ji, C.; Bai, S.W.; Liao, R.B.; Yang, T.B.; Wen, P.; Jiang, B.; Pan, F.S. A Comparative Study on We43 Magnesium Alloy Fabricated by Laser Powder Bed Fusion Coupled with Deep Cryogenic Treatment: Evolution in Microstructure and Mechanical Properties. Addit. Manuf. 2023, 77, 103814. [Google Scholar] [CrossRef]
- Li, W.; Li, S.; Liu, J.; Zhang, A.; Zhou, Y.; Wei, Q.S.; Yan, C.Z.; Shi, Y.S. Effect of heat treatment on AlSi10Mg alloy fabricated by selective laser melting: Microstructure evolution, mechanical properties and fracture mechanism. Mater. Sci. Eng. A 2016, 663, 116–125. [Google Scholar] [CrossRef]
- Kim, Y.K.; Yang, S.; Lee, K.A. Superior temperature-dependent mechanical properties and deformation behavior of equiatomic CoCrFeMnNi high-entropy alloy additively manufactured by selective laser melting. Sci. Rep. 2020, 10, 18006. [Google Scholar] [CrossRef]
- Wei, K.W.; Gao, M.; Wang, Z.M.; Zeng, X.Y. Effect of energy input on formability, microstructure and mechanical properties of selective laser melted AZ91D magnesium alloy. Mater. Sci. Eng. A 2014, 611, 212–222. [Google Scholar] [CrossRef]
- Dvorský, D.; Jiří, K.; Michaela, R.; Průša, F.; Nečas, D.; Minárik, P.; Stráská, J.; Vojtěch, D. The Effect of Powder Size on the Mechanical and Corrosion Properties and the Ignition Temperature of We43 Alloy Prepared by Spark Plasma Sintering. J. Magnes. Alloys 2021, 9, 134962. [Google Scholar] [CrossRef]
- Seede, R.; Whitt, A.; Ye, J.; Gibbons, S.; Flater, P.; Gaskey, B.; Elwany, A.; Arroyave, R.; Karaman, I. A lightweight Fe–Mn–Al–C austenitic steel with ultra-high strength and ductility fabricated via laser powder bed fusion. Mater. Sci. Eng. A 2023, 874, 145007. [Google Scholar] [CrossRef]
- Milaege, D.; Eschemann, N.; Hoyer, P.K.; Mirko, S. Anisotropic Mechanical and Microstructural Properties of a Ti-6Al-7Nb Alloy for Biomedical Applications Manufactured via Laser Powder Bed Fusion. Crystals 2024, 14, 117. [Google Scholar] [CrossRef]
- DIN ISO 5832-11:2015-12; Chirurgische Implantate—Metallische Werkstoffe—Teil_11: Titan Aluminium-6 Niob-7 Knetlegierung (ISO_5832-11:2014). Beuth Verlag GmbH: Berlin, Germany, 2015.
- Jiang, W.; Deng, Y.L.; Guo, X.B. Effect of heat treatment on microstructure and mechanical anisotropy of selective laser melted Al-Mn-Sc alloy. Mater. Sci. Eng. A 2023, 887, 145743. [Google Scholar] [CrossRef]
- Jiang, W.; Deng, Y.L.; Dai, Q.S.; Guo, X.B. In-situ EBSD investigation of orientation induced mechanical anisotropy in selective laser melted Al-Mn-Sc alloy. Mater. Res. Lett. 2023, 11, 896–905. [Google Scholar] [CrossRef]
- Liu, Y.; Feng, Y.; Wang, Y.G. Mechanical Anisotropy of Selective Laser Melted Ti-6Al-4V Using a Reduced-order Crystal Plasticity Finite Element Model. Chin. J. Mech. Eng. Addit. Manuf. Front. 2023, 2, 100062. [Google Scholar] [CrossRef]
- Yang, X.Y.; Wei, H.W.; Zhang, J.; Wang, J.H.; Jiang, M.C.; Liu, Y.; Ren, D.C.; Cai, Y.S.; Ji, H.B. Anisotropy analysis of laser selective melting forming TA7 titanium alloy. Chin. J. Rocket. Propuls. 2023, 49, 99–105. [Google Scholar]
- Zhao, Y.Y.; Gong, B.M.; Wang, Y.; Gu, Y.L. Effects of microstructure anisotropy on dynamic fracture behaviors of a selective laser melting nickel-based superalloy. Mater. Sci. Eng. A 2022, 858, 14133. [Google Scholar] [CrossRef]
- Yang, H.O.; Liu, B.; Niu, P.D.; Fan, Z.Q.; Yuan, T.C.; Wang, Y.; Liu, Y.; Li, R.D. Effect of laser scanning angle on shear slip behavior along melt track of selective laser melted 316L stainless steel during tensile failure. Mater. Charact. 2022, 193, 112297. [Google Scholar] [CrossRef]
- Wang, X.D.; Chen, C.Y.; Zhao, R.X.; Liu, L.T.; Shuai, S.S.; Hu, T.; Wang, J.; Ren, Z.M. Selective Laser Melting of Carbon-Free Mar-M509 Co-Based Superalloy: Microstructure, Micro-Cracks, and Mechanical Anisotropy. Acta Metall. Sin. (Engl. Lett.) 2021, 35, 501–516. [Google Scholar] [CrossRef]
- Chen, S.Q.; Tan, Q.Y.; Gao, W.Q.; Wu, G.L.; Fan, J.M.; Feng, Z.Q.; Huang, T.L.; Andrew, W.G.; Zhang, M.X.; Huang, X.X. Effect of heat treatment on the anisotropy in mechanical properties of selective laser melted AlSi10Mg. Mater. Sci. Eng. A 2022, 858, 144130. [Google Scholar] [CrossRef]
- Deng, Q.C.; Wu, Y.J.; Luo, Y.H.; Su, N.; Xue, X.Y.; Chang, Z.Y.; Wu, Q.Y.; Xue, Y.T.; Peng, L.M. Fabrication of high-strength Mg-Gd-Zn-Zr alloy via selective laser melting. Mater. Charact. 2020, 165, 110377. [Google Scholar] [CrossRef]
- Villa, R.; Liu, Y.; Siddique, Z. Review of defects and their sources in as-built Ti6Al4V manufactured via powder bed fusion. Int. J. Adv. Manuf. Technol. 2024, 132, 4105–4134. [Google Scholar] [CrossRef]
- Peng, L.M.; Deng, Q.; Wu, Y.; Volker, W.; Heinz, H. Additive Manufacturing of Magnesium Alloys by Selective Laser Melting Technology: A Review. Acta Metall. Sin. 2023, 59, 31–52. [Google Scholar]
- Knudsen, F.P. Dependence of Mechanical Strength of Brittle Polycrystalline Specimens on Porosity and Grain Size. J. Am. Ceram. Soc. 1959, 42, 376–387. [Google Scholar] [CrossRef]
- Wang, D.; Huang, J.H.; Tan, C.L.; Yang, Y.Q. Review on Effects of Cyclic Thermal Input on Microstructure and Property of Materials in Laser Additive Manufacturing. Acta Metall. Sin. 2022, 58, 1221–1235. [Google Scholar]
- Kumar, B.; Dandekar, R.T.; Birosca, S. Probing the temperature field and residual stress transformation in multi-track, multi-layered system. Mater. Today Commun. 2024, 38, 108056. [Google Scholar] [CrossRef]
- Xu, J.Y.; Ding, Y.T.; Gao, Y.B.; Wang, H.; Hu, Y.; Zhang, D. Grain refinement and crack inhibition of hard-to-weld Inconel 738 alloy by altering the scanning strategy during selective laser melting. Mater. Des. 2021, 209, 109940. [Google Scholar] [CrossRef]
- Nezhadfar, P.D.; Gradl, P.R.; Shao, S.; Shamsaei, N. Microstructure and Deformation Behavior of Additively Manufactured 17–4 Stainless Steel: Laser Powder Bed Fusion vs. Laser Powder Directed Energy Deposition. JOM 2021, 74, 1136–1148. [Google Scholar] [CrossRef]
- Qu, M.L.; Yuan, J.D.; Nabaa, A.; Huang, J.Y.; Chihpin, A.C.; Chen, L.Y. Melting and solidification dynamics during laser melting of reaction-based metal matrix composites uncovered by in-situ synchrotron X-ray diffraction. Acta Mater. 2024, 271, 119875. [Google Scholar] [CrossRef]
- Liu, W.P.; Chen, L.P.; Zhou, Q.; Yuan, Y.P.; Liu, Y.X. Effects of Zn and Sr compound treatment on microstructure and properties of WE43 magnesium alloy. Chin. J. Spec. Cast. Nonferrous Alloys 2023, 43, 1555–1560. [Google Scholar]
- Wang, Q.L.; Li, M.F.; Men, Z.X.; Li, Y.; Zhang, H. Fabrication of Finned Heat Pipe Shell by Laser Melting Deposition. Chin. J. Hot Work. Technol. 2023, 52, 127–130+135. [Google Scholar]
- Bhattacharyya, J.J.; Wang, F.J.; McQuade, P.; Agnew, S.R. Deformation and fracture behavior of Mg alloy, WE43, after various aging heat treatments. Mater. Sci. Eng. A 2017, 705, 79–88. [Google Scholar] [CrossRef]
- Wang, F.; Lu, X.G. Fundamentals of Materials Science; Xi’an Jiaotong University Press: Xi’an, China, 2023; p. 201. [Google Scholar]
- Liu, W.; Liu, C.S.; Wang, Y.; Zhang, H.; Li, J.; Lu, Y.Y.; Xiong, L.; Ni, H.W. Tailoring the microstructural and mechanical properties of 316L stainless steel manufactured by laser powder bed fusion. J. Mater. Res. Technol. 2023, 25, 7389. [Google Scholar] [CrossRef]
- Maria, N.V.D.; Peter, S.; Amit, S.; Jain, M.; Edwards, T.E.J.; Schwiedrzik, J.J.; Peruzzi, C.; Logé, R.E.; Michler, J.; Maeder, X. Micromechanical response of pure magnesium at different strain rate and temperature conditions: Twin to slip and slip to twin transitions. Acta Mater. 2023, 243, 118528. [Google Scholar]
- Karol, F.; Tomasz, L.; Zbigniew, K.; Maj, M.; Katarzyna, K.G. On the role of slip, twinning and detwinning in magnesium alloy AZ31B sheet. Mater. Sci. Eng. A 2021, 813, 141152. [Google Scholar]
- Robin, K.I.; Sprouster, J.D.; Sridharan, N.; Snead, L.L.; Steven, J.Z. Synchrotron based investigation of anisotropy and microstructure of wire arc additive manufactured Grade 91 steel. J. Mater. Res. Technol. 2024, 29, 5010–5021. [Google Scholar] [CrossRef]
- Jino, J.; Basil, K. Influence of post-processing and build orientation on the micro-machinability and chip formation during micro-drilling of L-PBF AlSi10Mg CIRP. J. Manuf. Sci. Technol. 2023, 45, 35–48. [Google Scholar]
- Bae, K.; Shin, D.; Kim, J.-H.; Lee, W.; Jo, I.; Lee, J. Influence of Post Heat Treatment Condition on Corrosion Behavior of 18Ni300 Maraging Steel Manufactured by Laser Powder Bed Fusion. Micromachines 2022, 13, 1977. [Google Scholar] [CrossRef]
- Zanni, M.; Berto, F.; Vullum, E.P.; Tonelli, L.; Morri, A.; Ceschini, L. Effect of heat treatment and defects on the tensile behavior of a hot work tool steel manufactured by laser powder bed fusion. Fatigue Fract. Eng. Mater. Struct. 2023, 46, 2681–2696. [Google Scholar] [CrossRef]


| Element | Zn | Zr | Gd | Nd | Y | Mg |
|---|---|---|---|---|---|---|
| Content | 0.21 | 0.4 | 1.23 | 2.46 | 3.77 | Bal. |
| Sample | Test Surface | Residual Stress (MPa) | Residual Stress (MPa) |
|---|---|---|---|
| LPBF WE43 | X–Y | +147 (X direction) | −332 (Y direction) |
| Y–Z | −165 (Y direction) | −493 (Z direction) | |
| LPBF WE43 T5 | X–Y | −150 (X direction) | −146 (Y direction) |
| Y–Z | −139 (Y direction) | −145 (Z direction) |
Disclaimer/Publisher’s Note: The statements, opinions and data contained in all publications are solely those of the individual author(s) and contributor(s) and not of MDPI and/or the editor(s). MDPI and/or the editor(s) disclaim responsibility for any injury to people or property resulting from any ideas, methods, instructions or products referred to in the content. |
© 2024 by the authors. Licensee MDPI, Basel, Switzerland. This article is an open access article distributed under the terms and conditions of the Creative Commons Attribution (CC BY) license (https://creativecommons.org/licenses/by/4.0/).
Share and Cite
Bai, J.; Wang, Q.; Men, Z.; Chen, W.; Huang, H.; Ji, C.; Li, Y.; Wang, L.; Zhu, L.; Li, K.; et al. Generation Mechanism of Anisotropy in Mechanical Properties of WE43 Fabricated by Laser Powder Bed Fusion. Micromachines 2024, 15, 976. https://doi.org/10.3390/mi15080976
Bai J, Wang Q, Men Z, Chen W, Huang H, Ji C, Li Y, Wang L, Zhu L, Li K, et al. Generation Mechanism of Anisotropy in Mechanical Properties of WE43 Fabricated by Laser Powder Bed Fusion. Micromachines. 2024; 15(8):976. https://doi.org/10.3390/mi15080976
Chicago/Turabian StyleBai, Jingfei, Qiulin Wang, Zhengxing Men, Wen Chen, Huanjie Huang, Chen Ji, Yong Li, Liang Wang, Liang Zhu, Kun Li, and et al. 2024. "Generation Mechanism of Anisotropy in Mechanical Properties of WE43 Fabricated by Laser Powder Bed Fusion" Micromachines 15, no. 8: 976. https://doi.org/10.3390/mi15080976