
Investigation of the Surface Characteristics of GCr15 in Electrochemical Machining
Abstract
:1. Introduction
2. Materials and Methods
2.1. Materials
2.2. Methods
2.2.1. Procedure for Testing Polarization Curve
2.2.2. Experiment
3. Results and Discussion
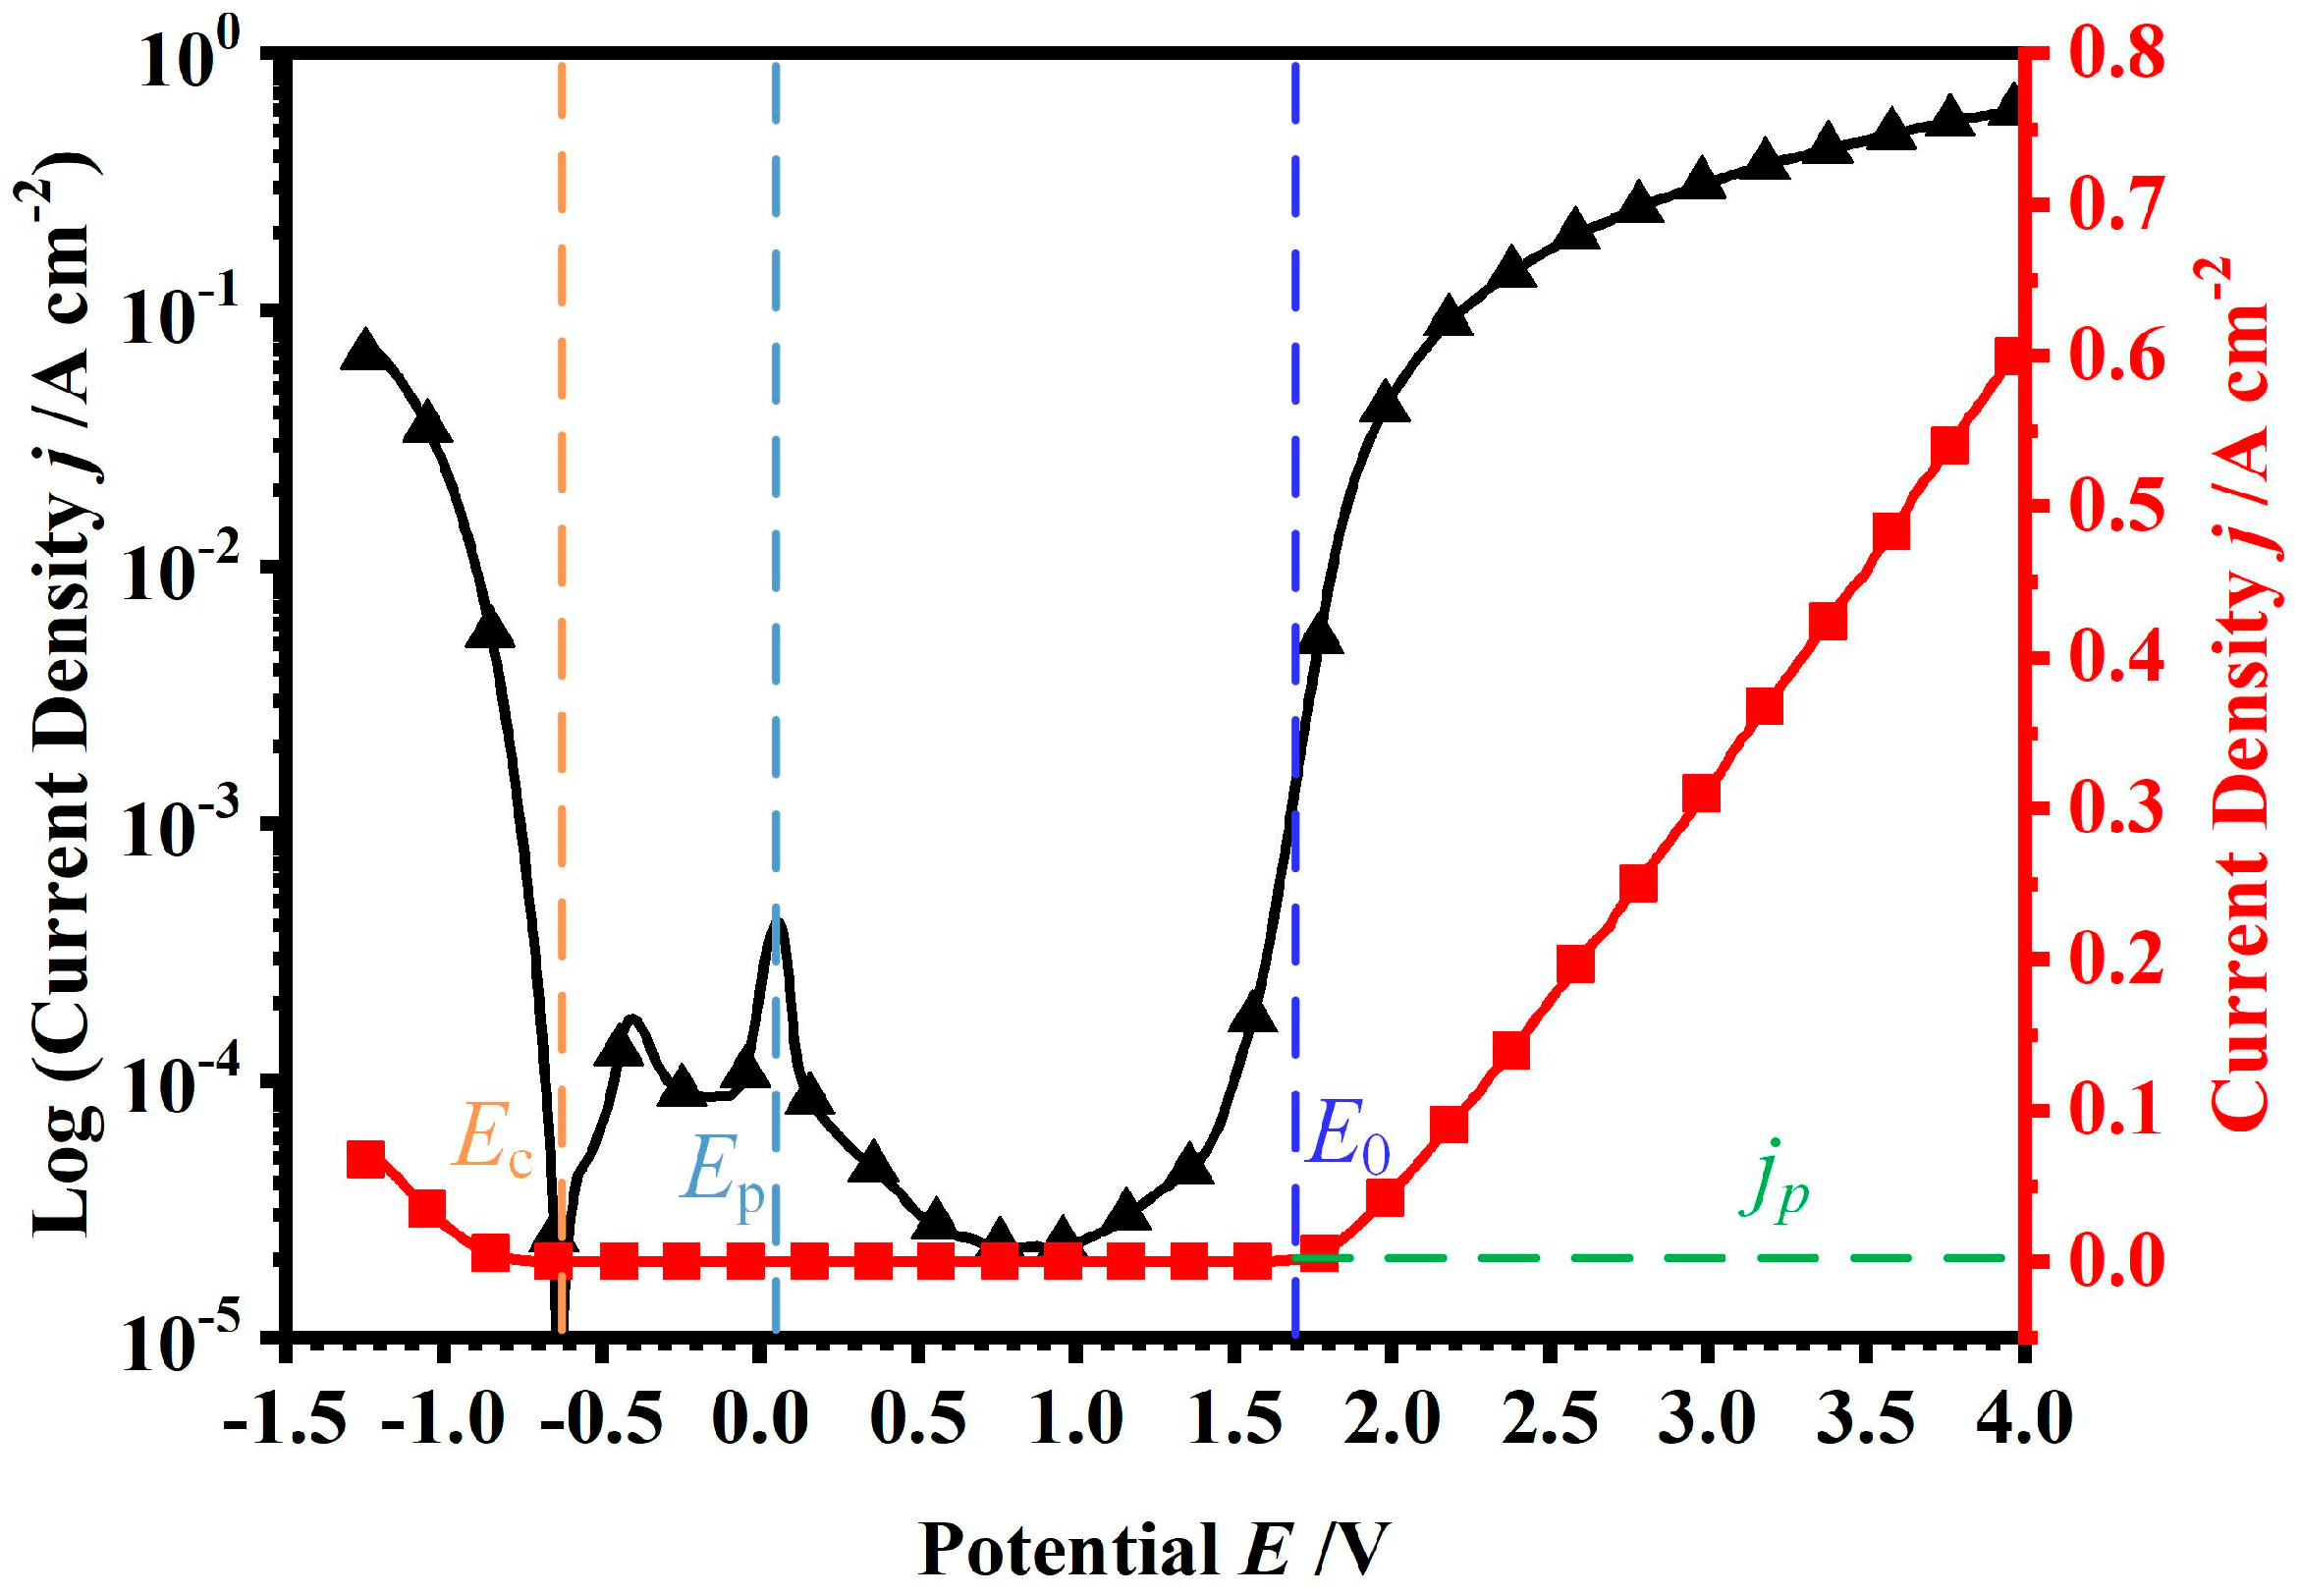
3.1. Polarisation Curve
3.2. Black Layer on the Machined Surface
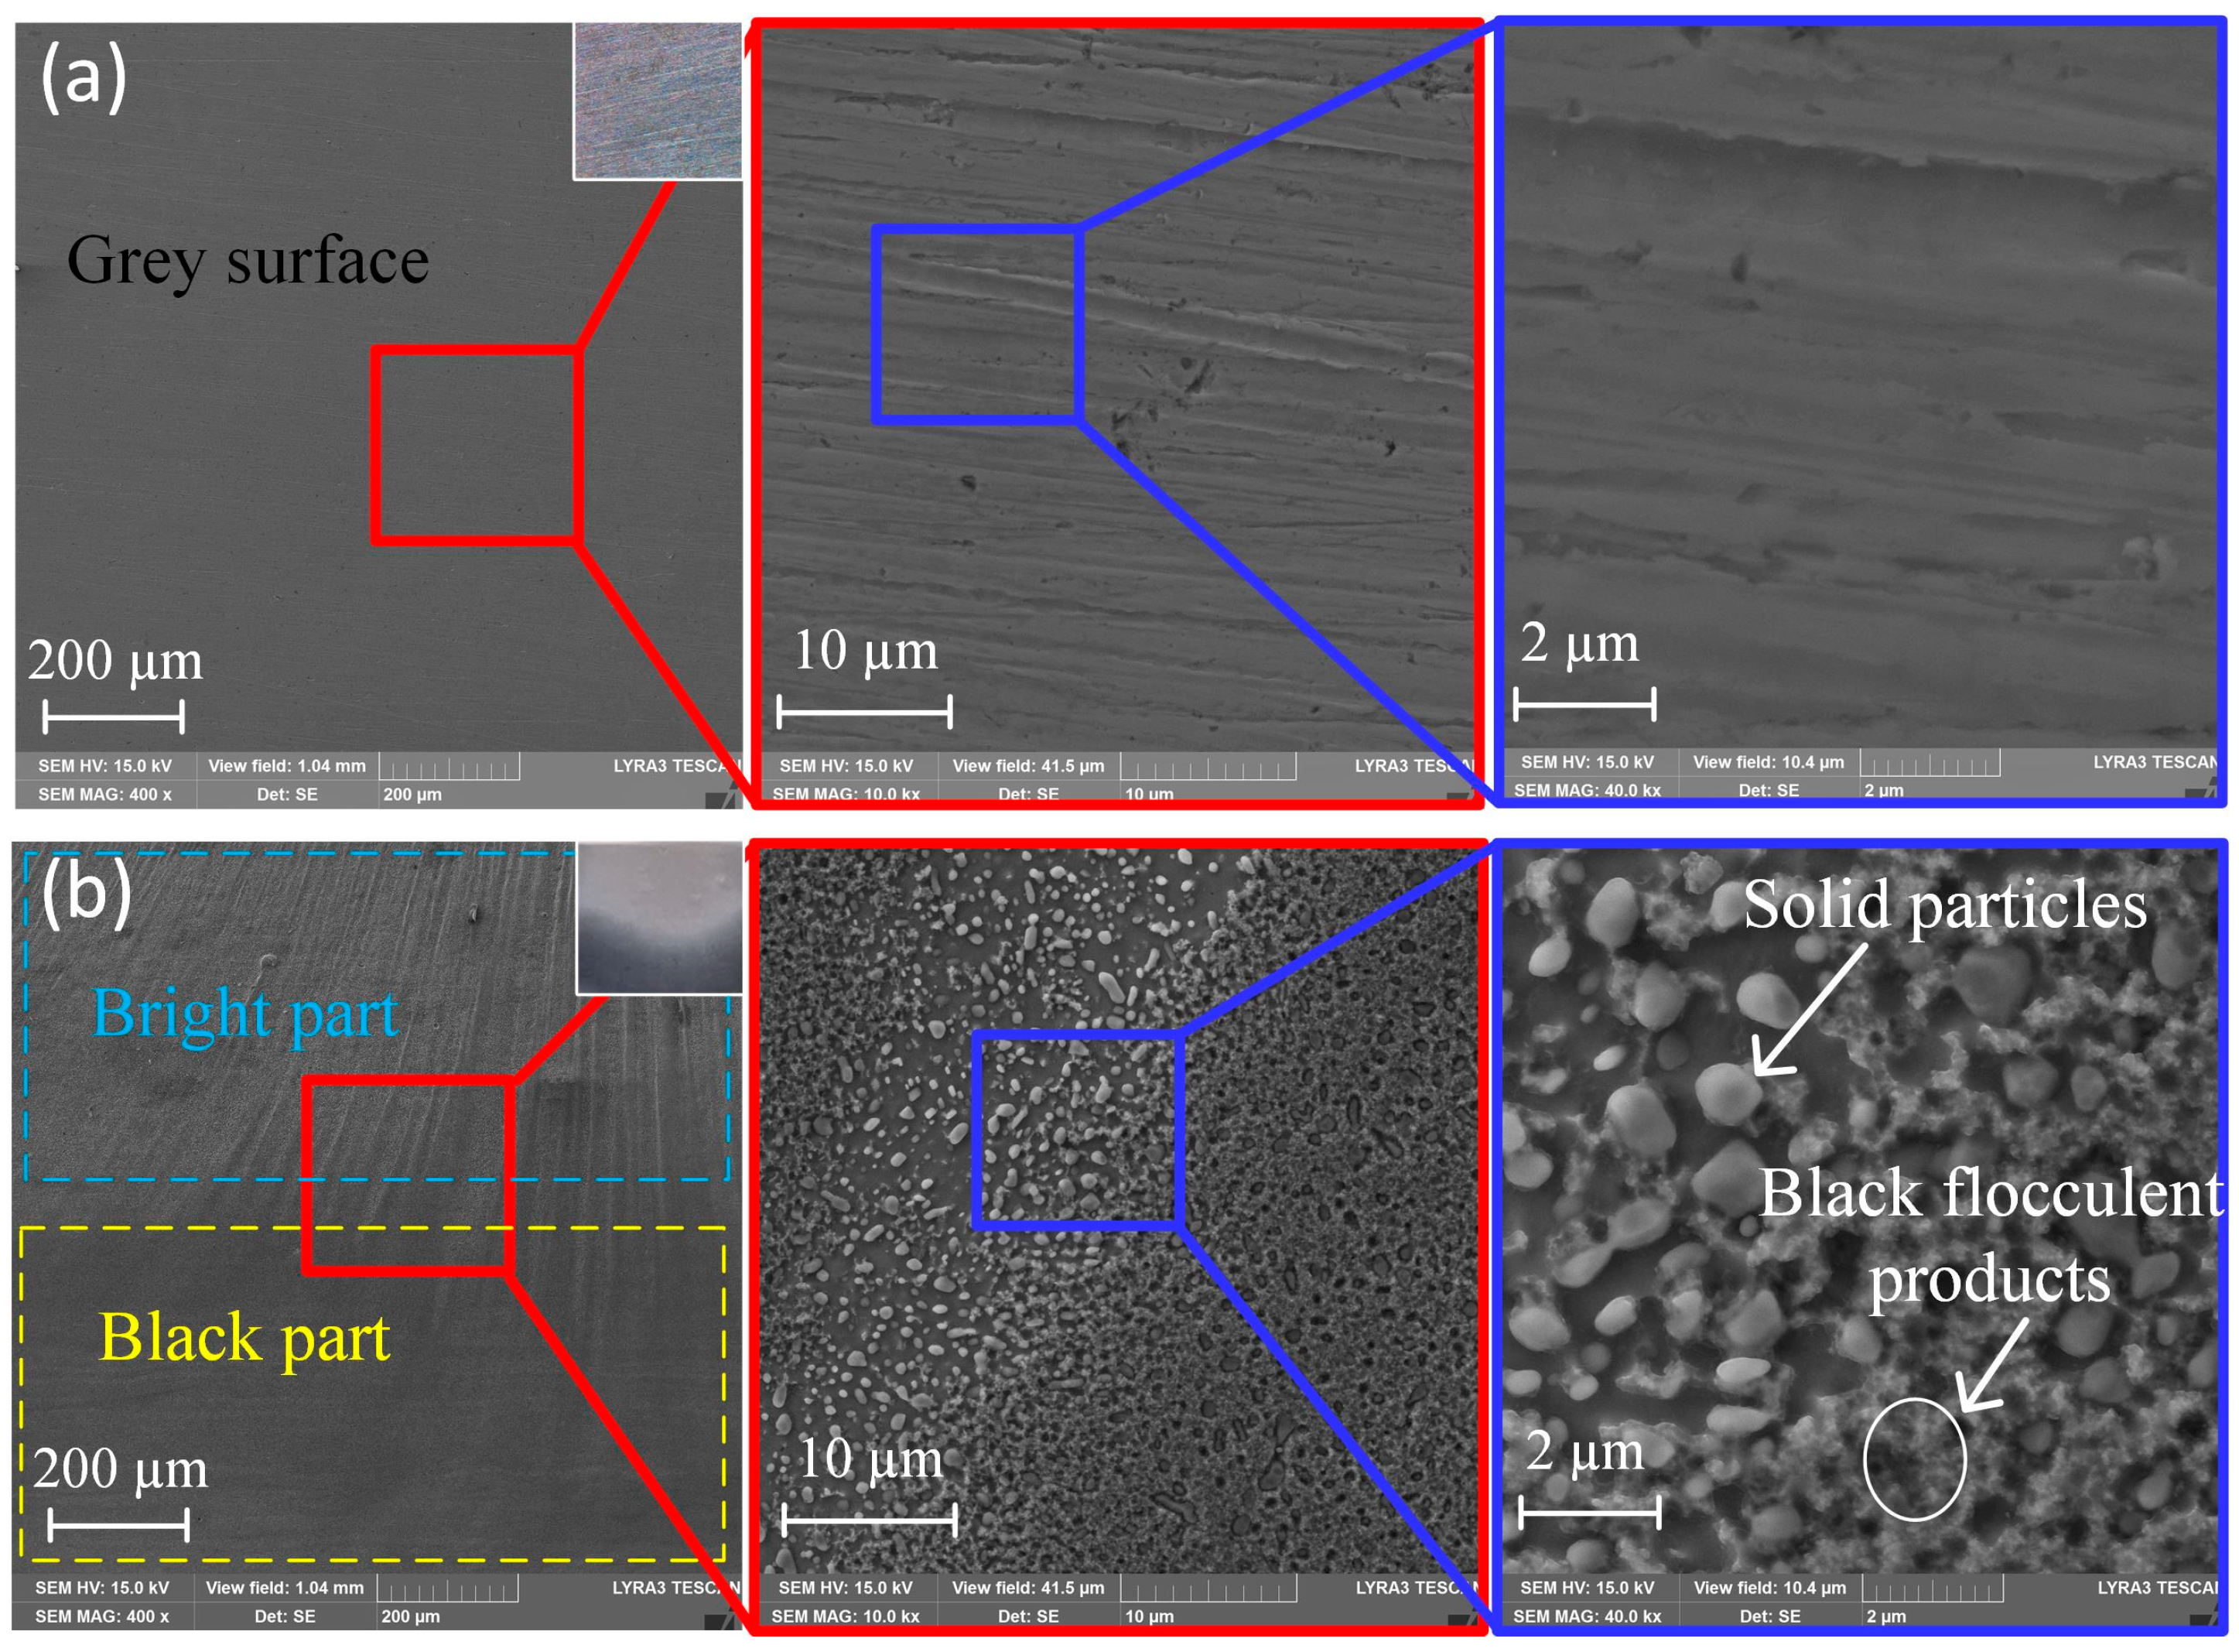
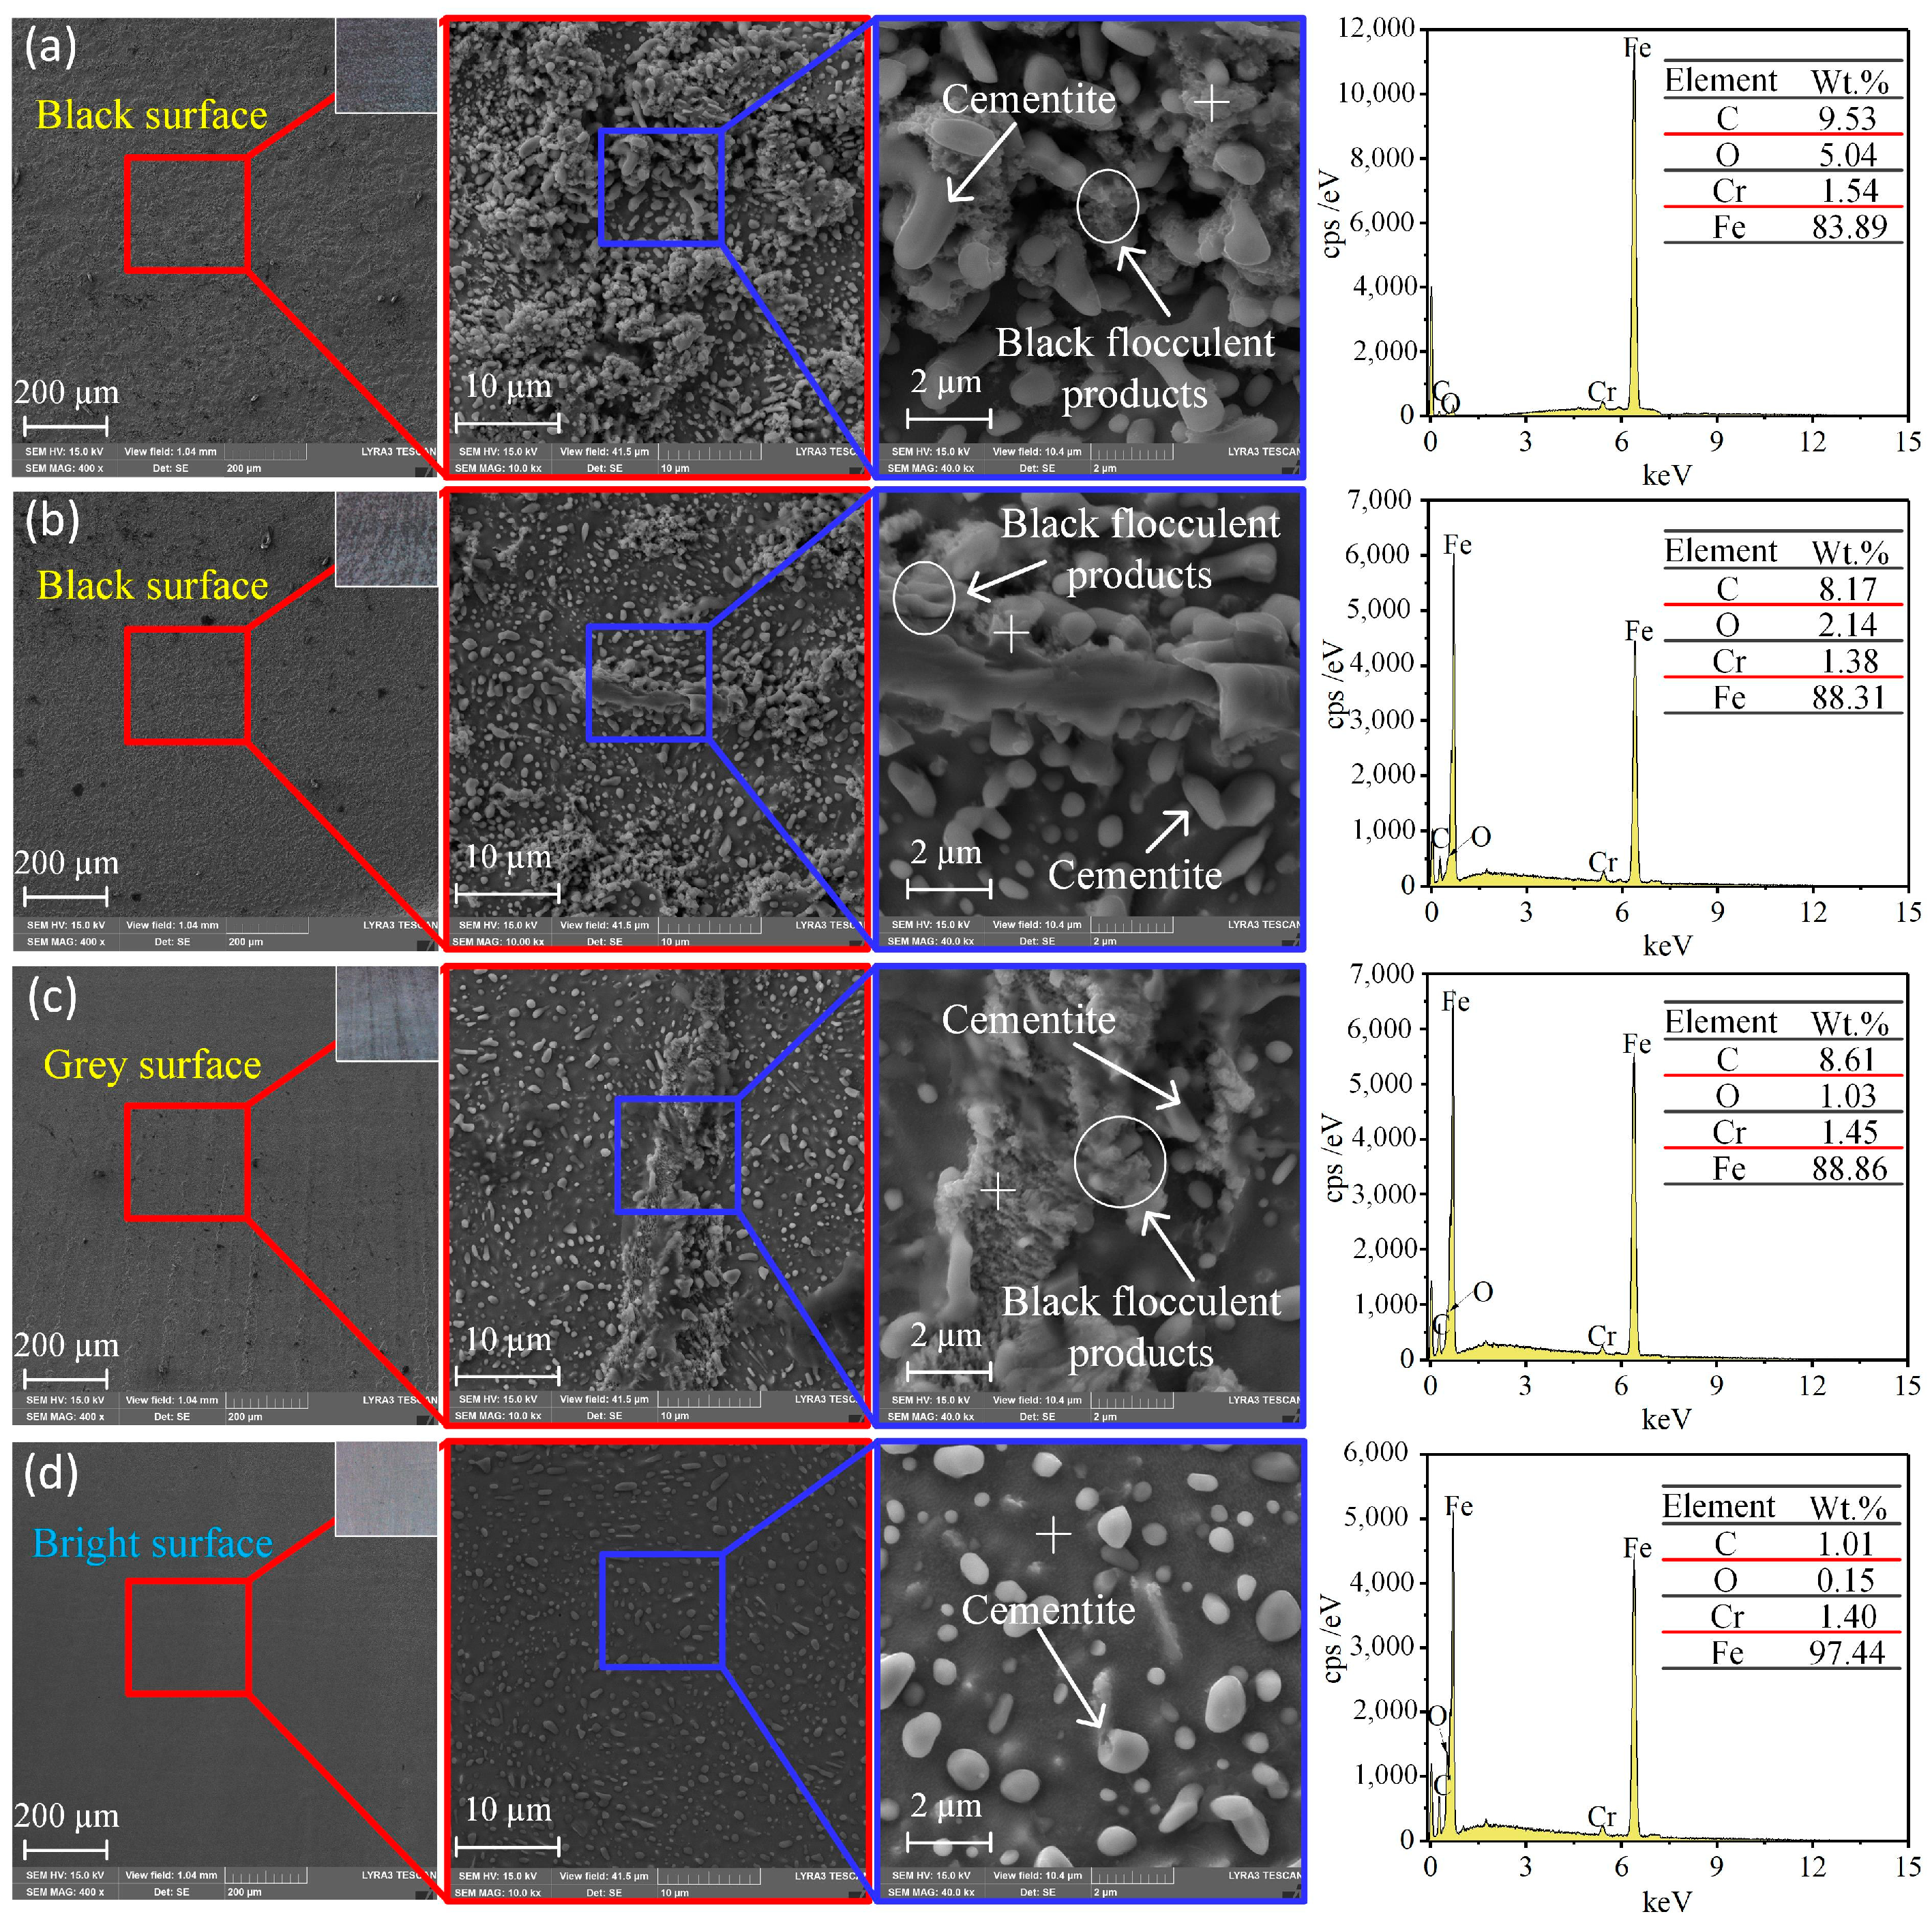
3.2.1. SEM
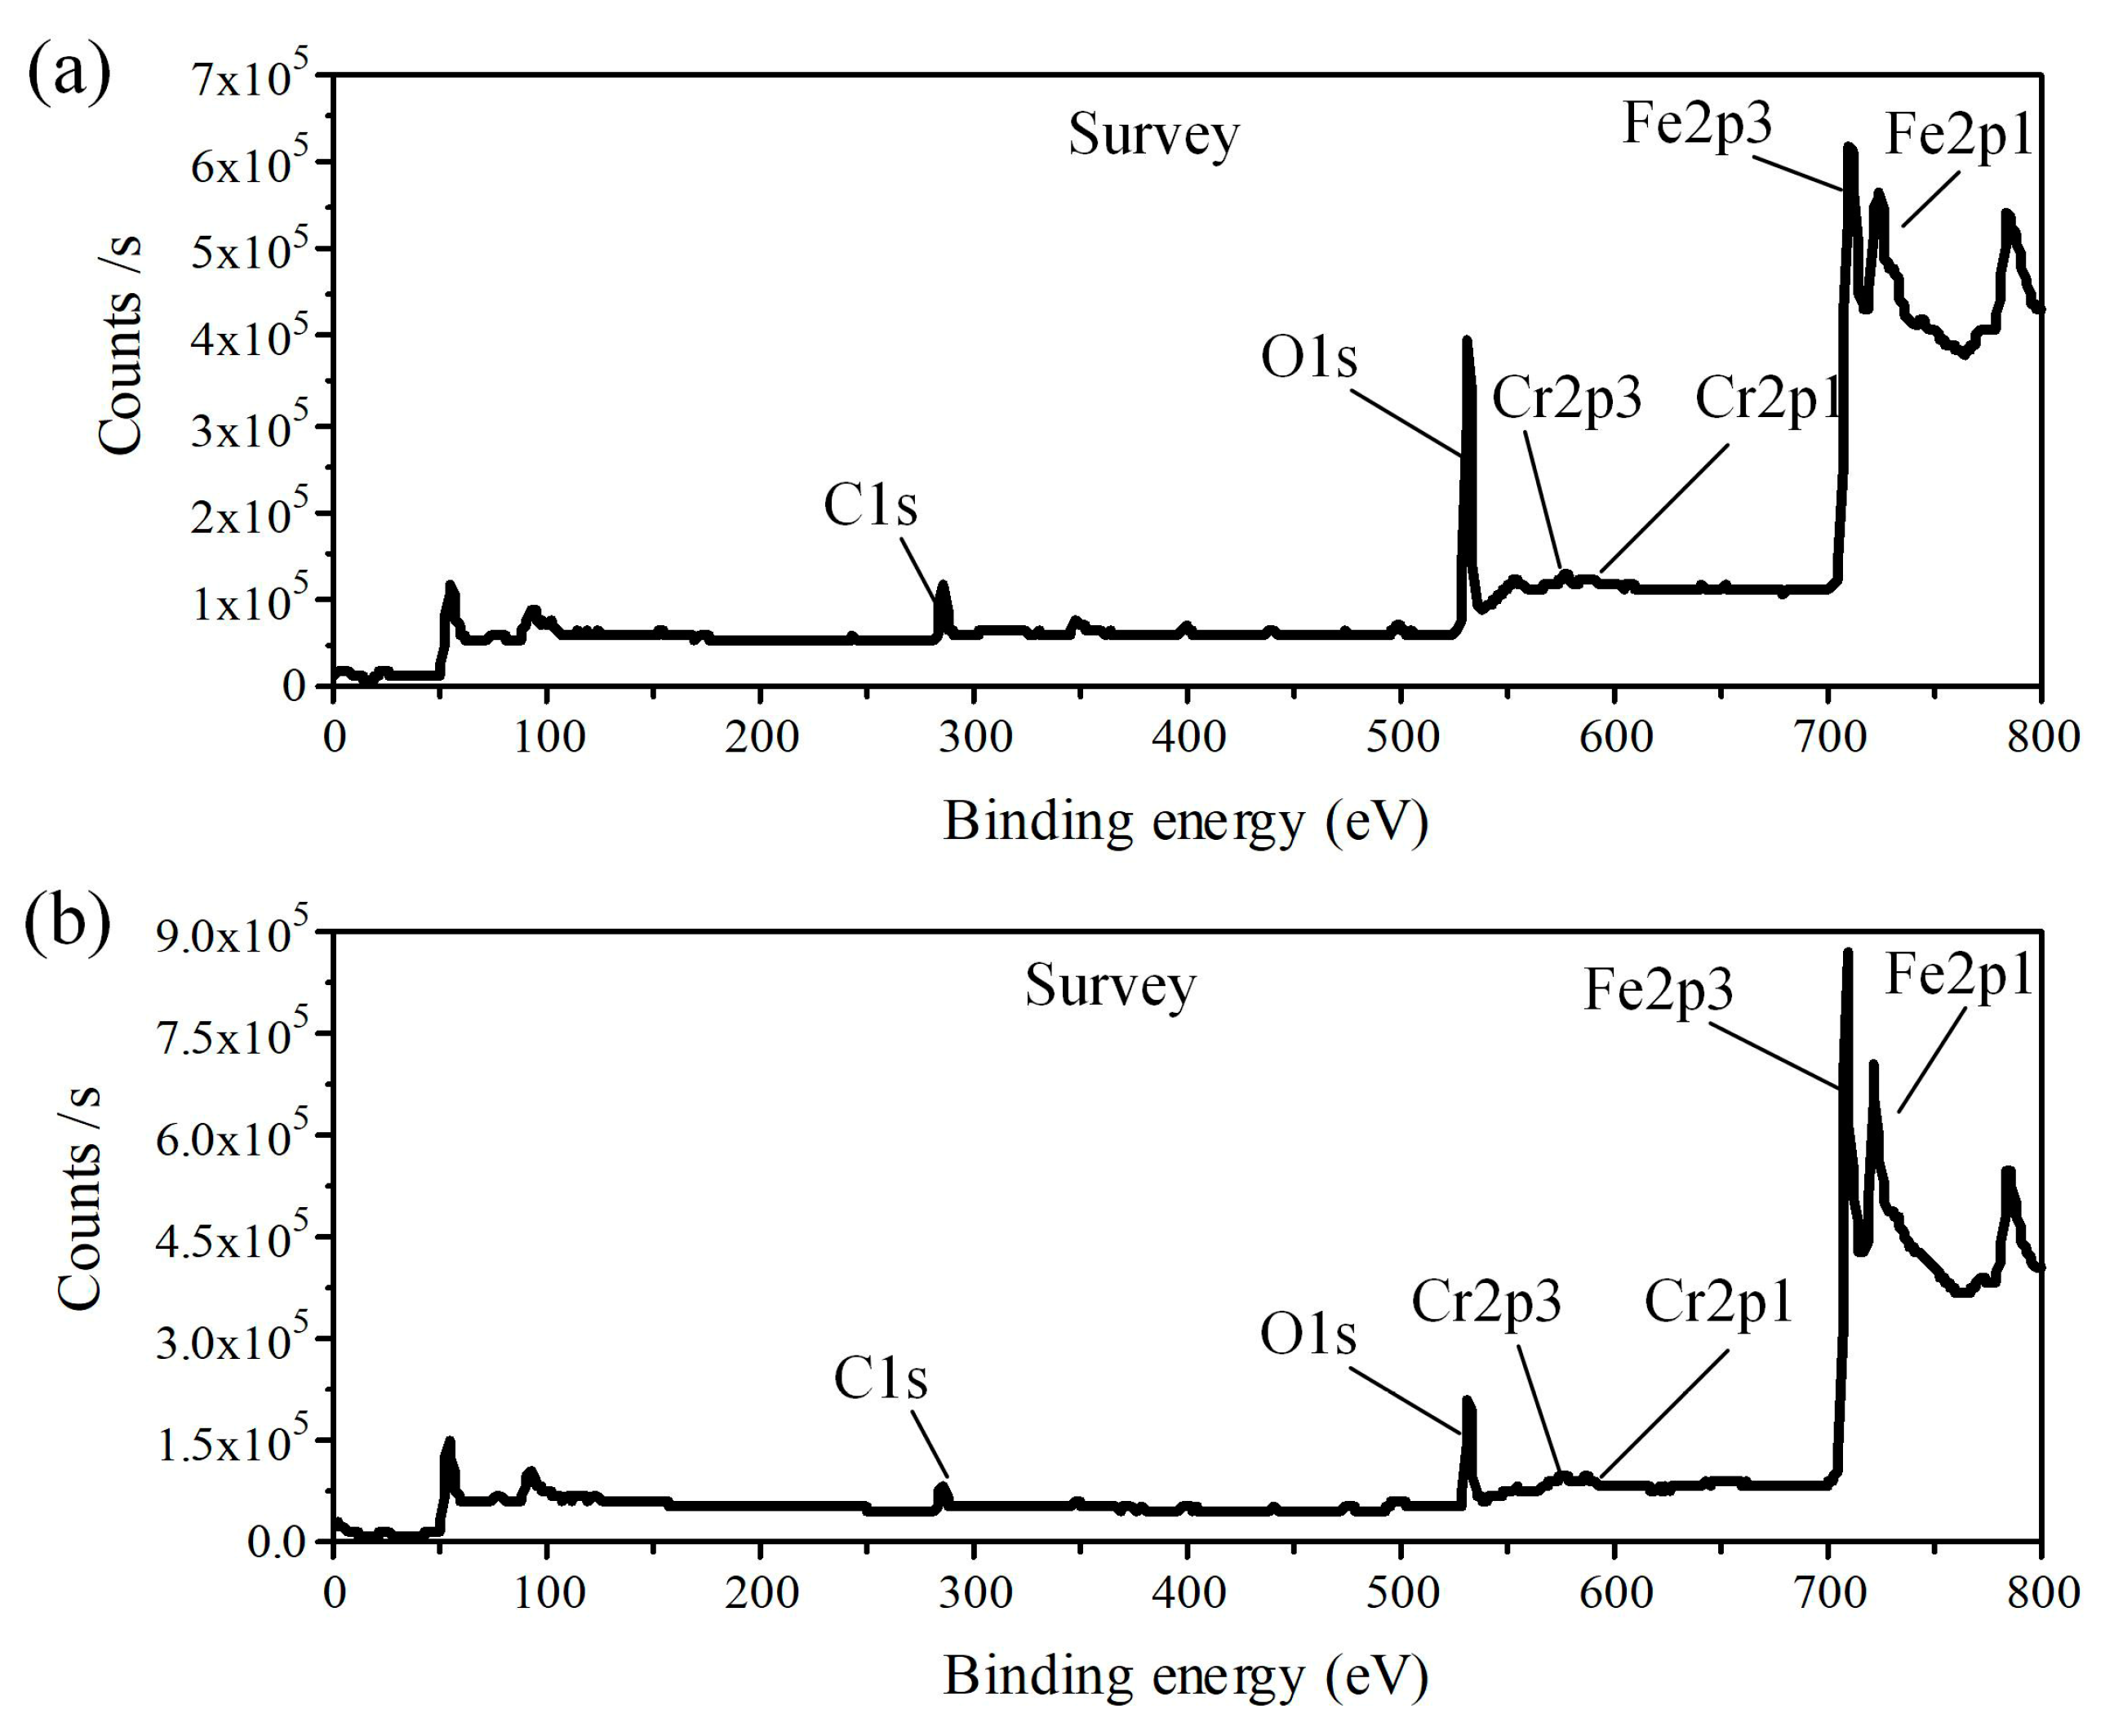
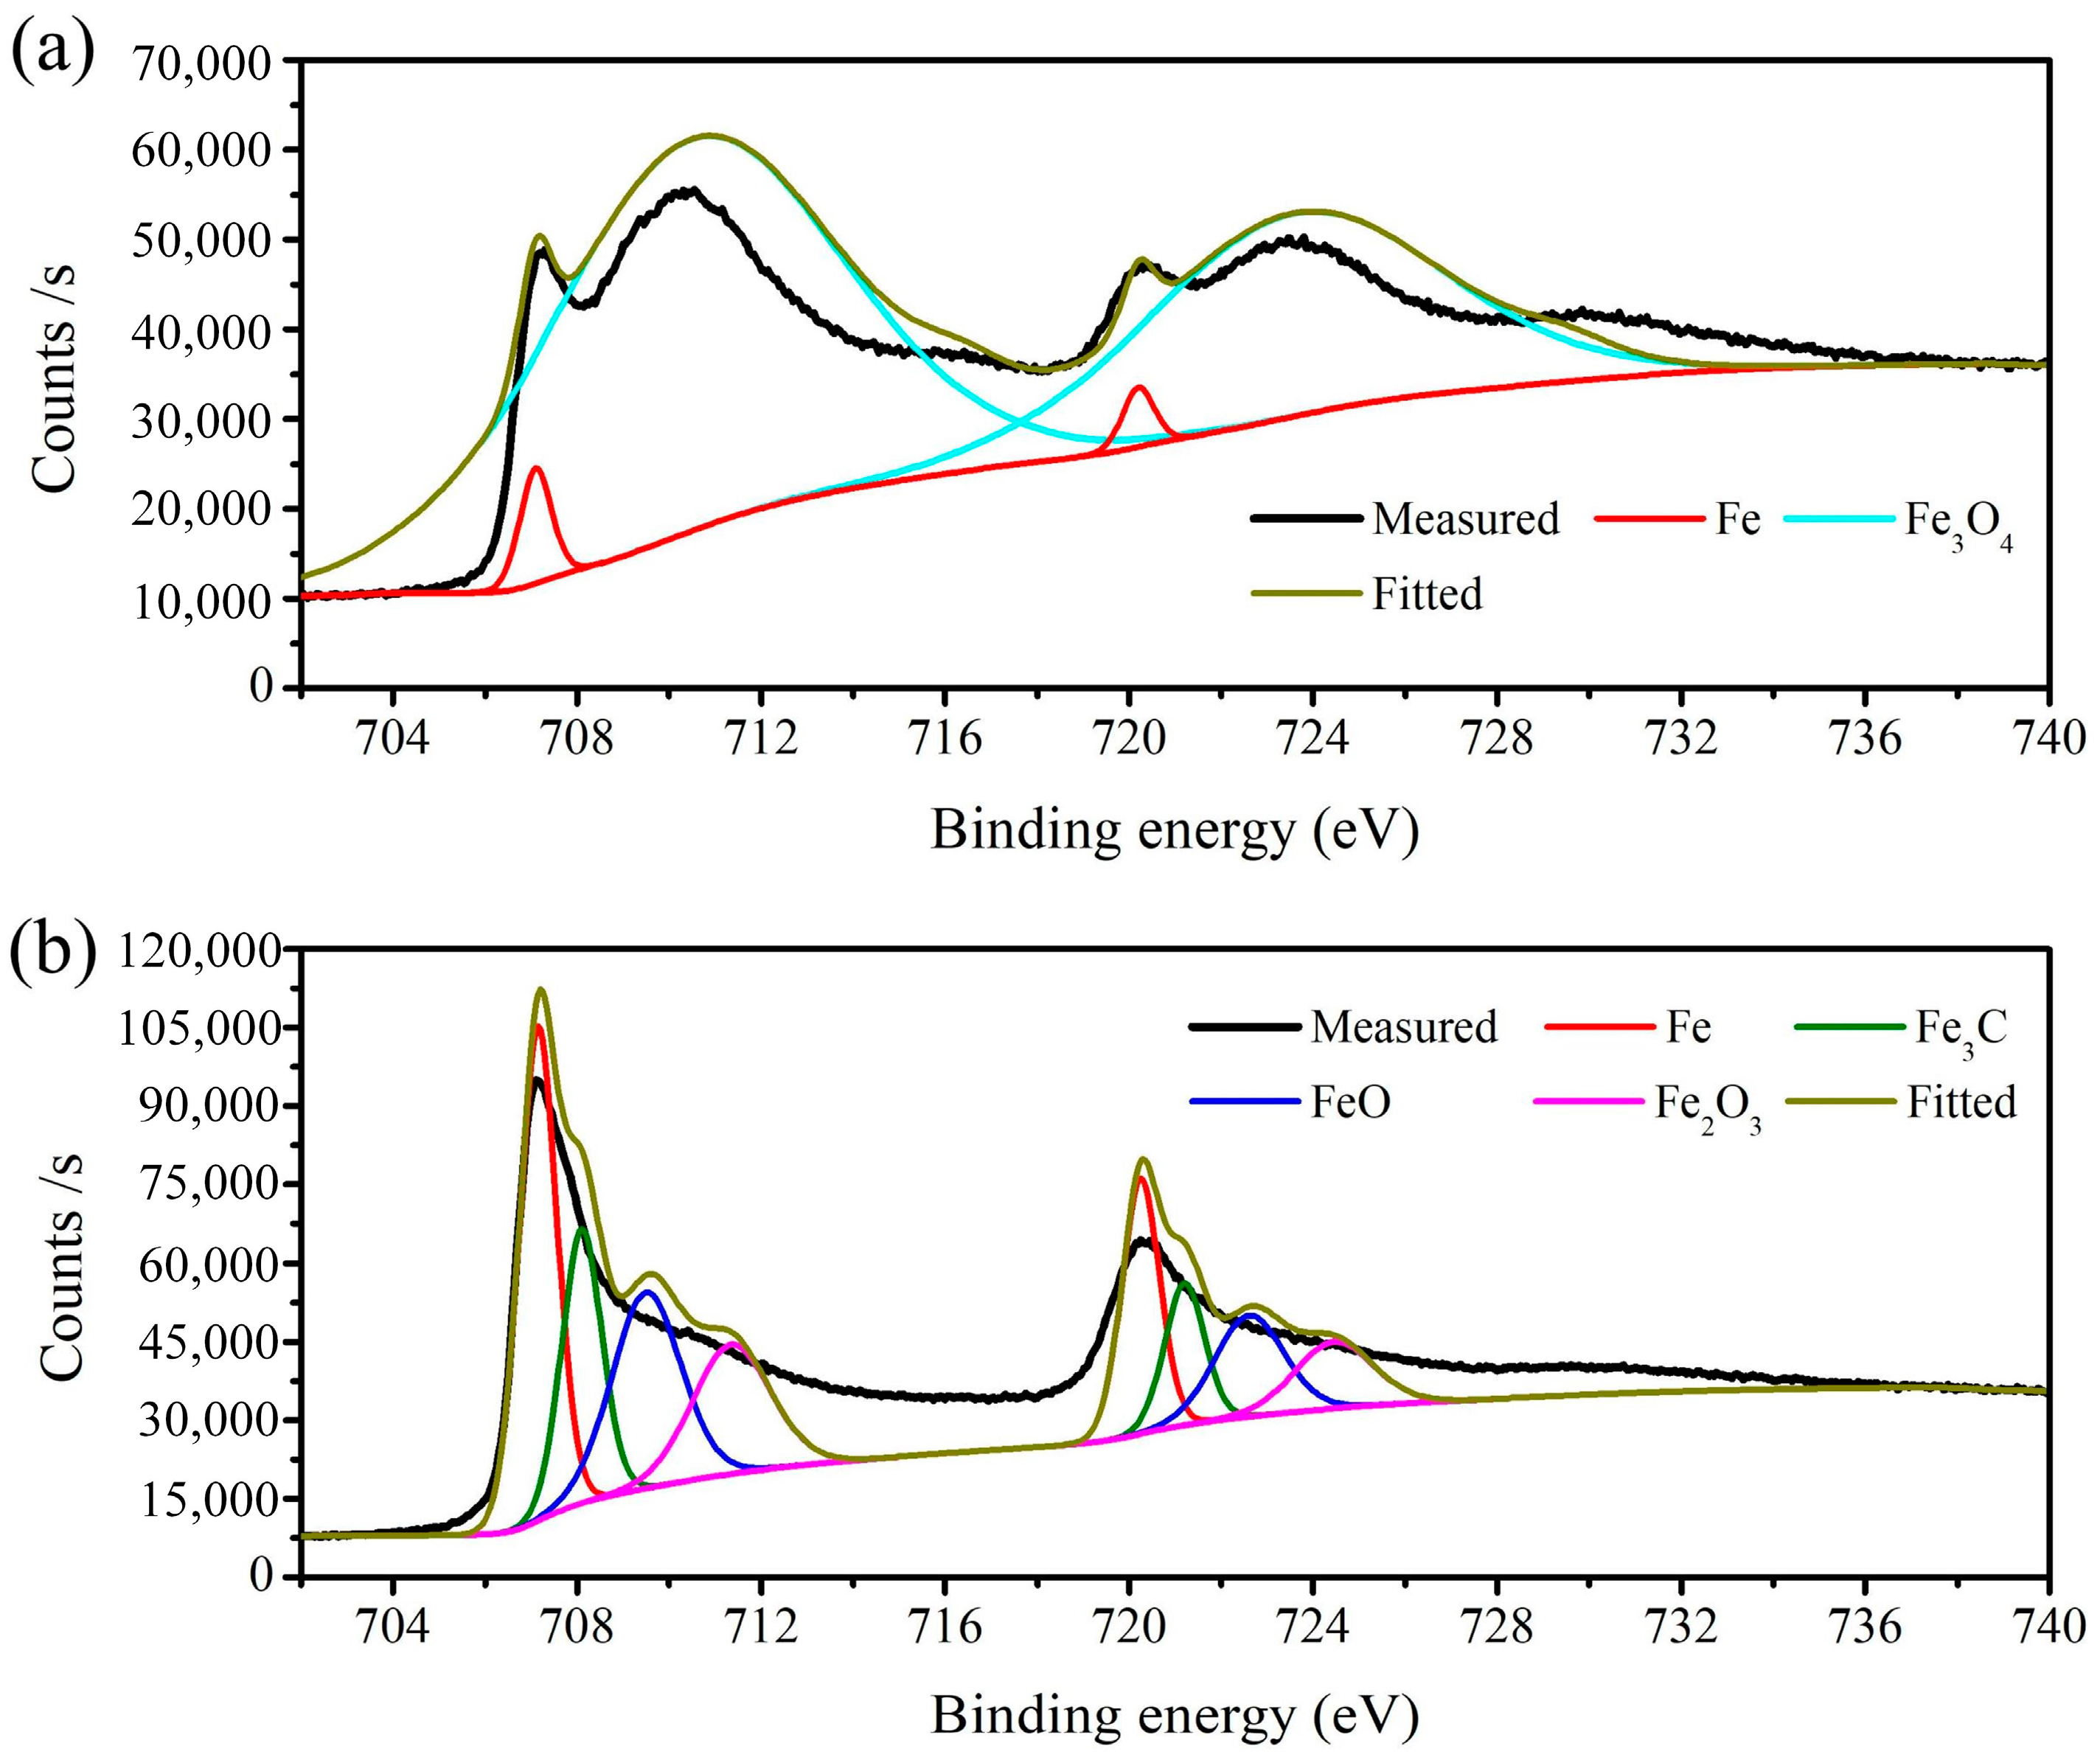
3.2.2. XRD and XPS
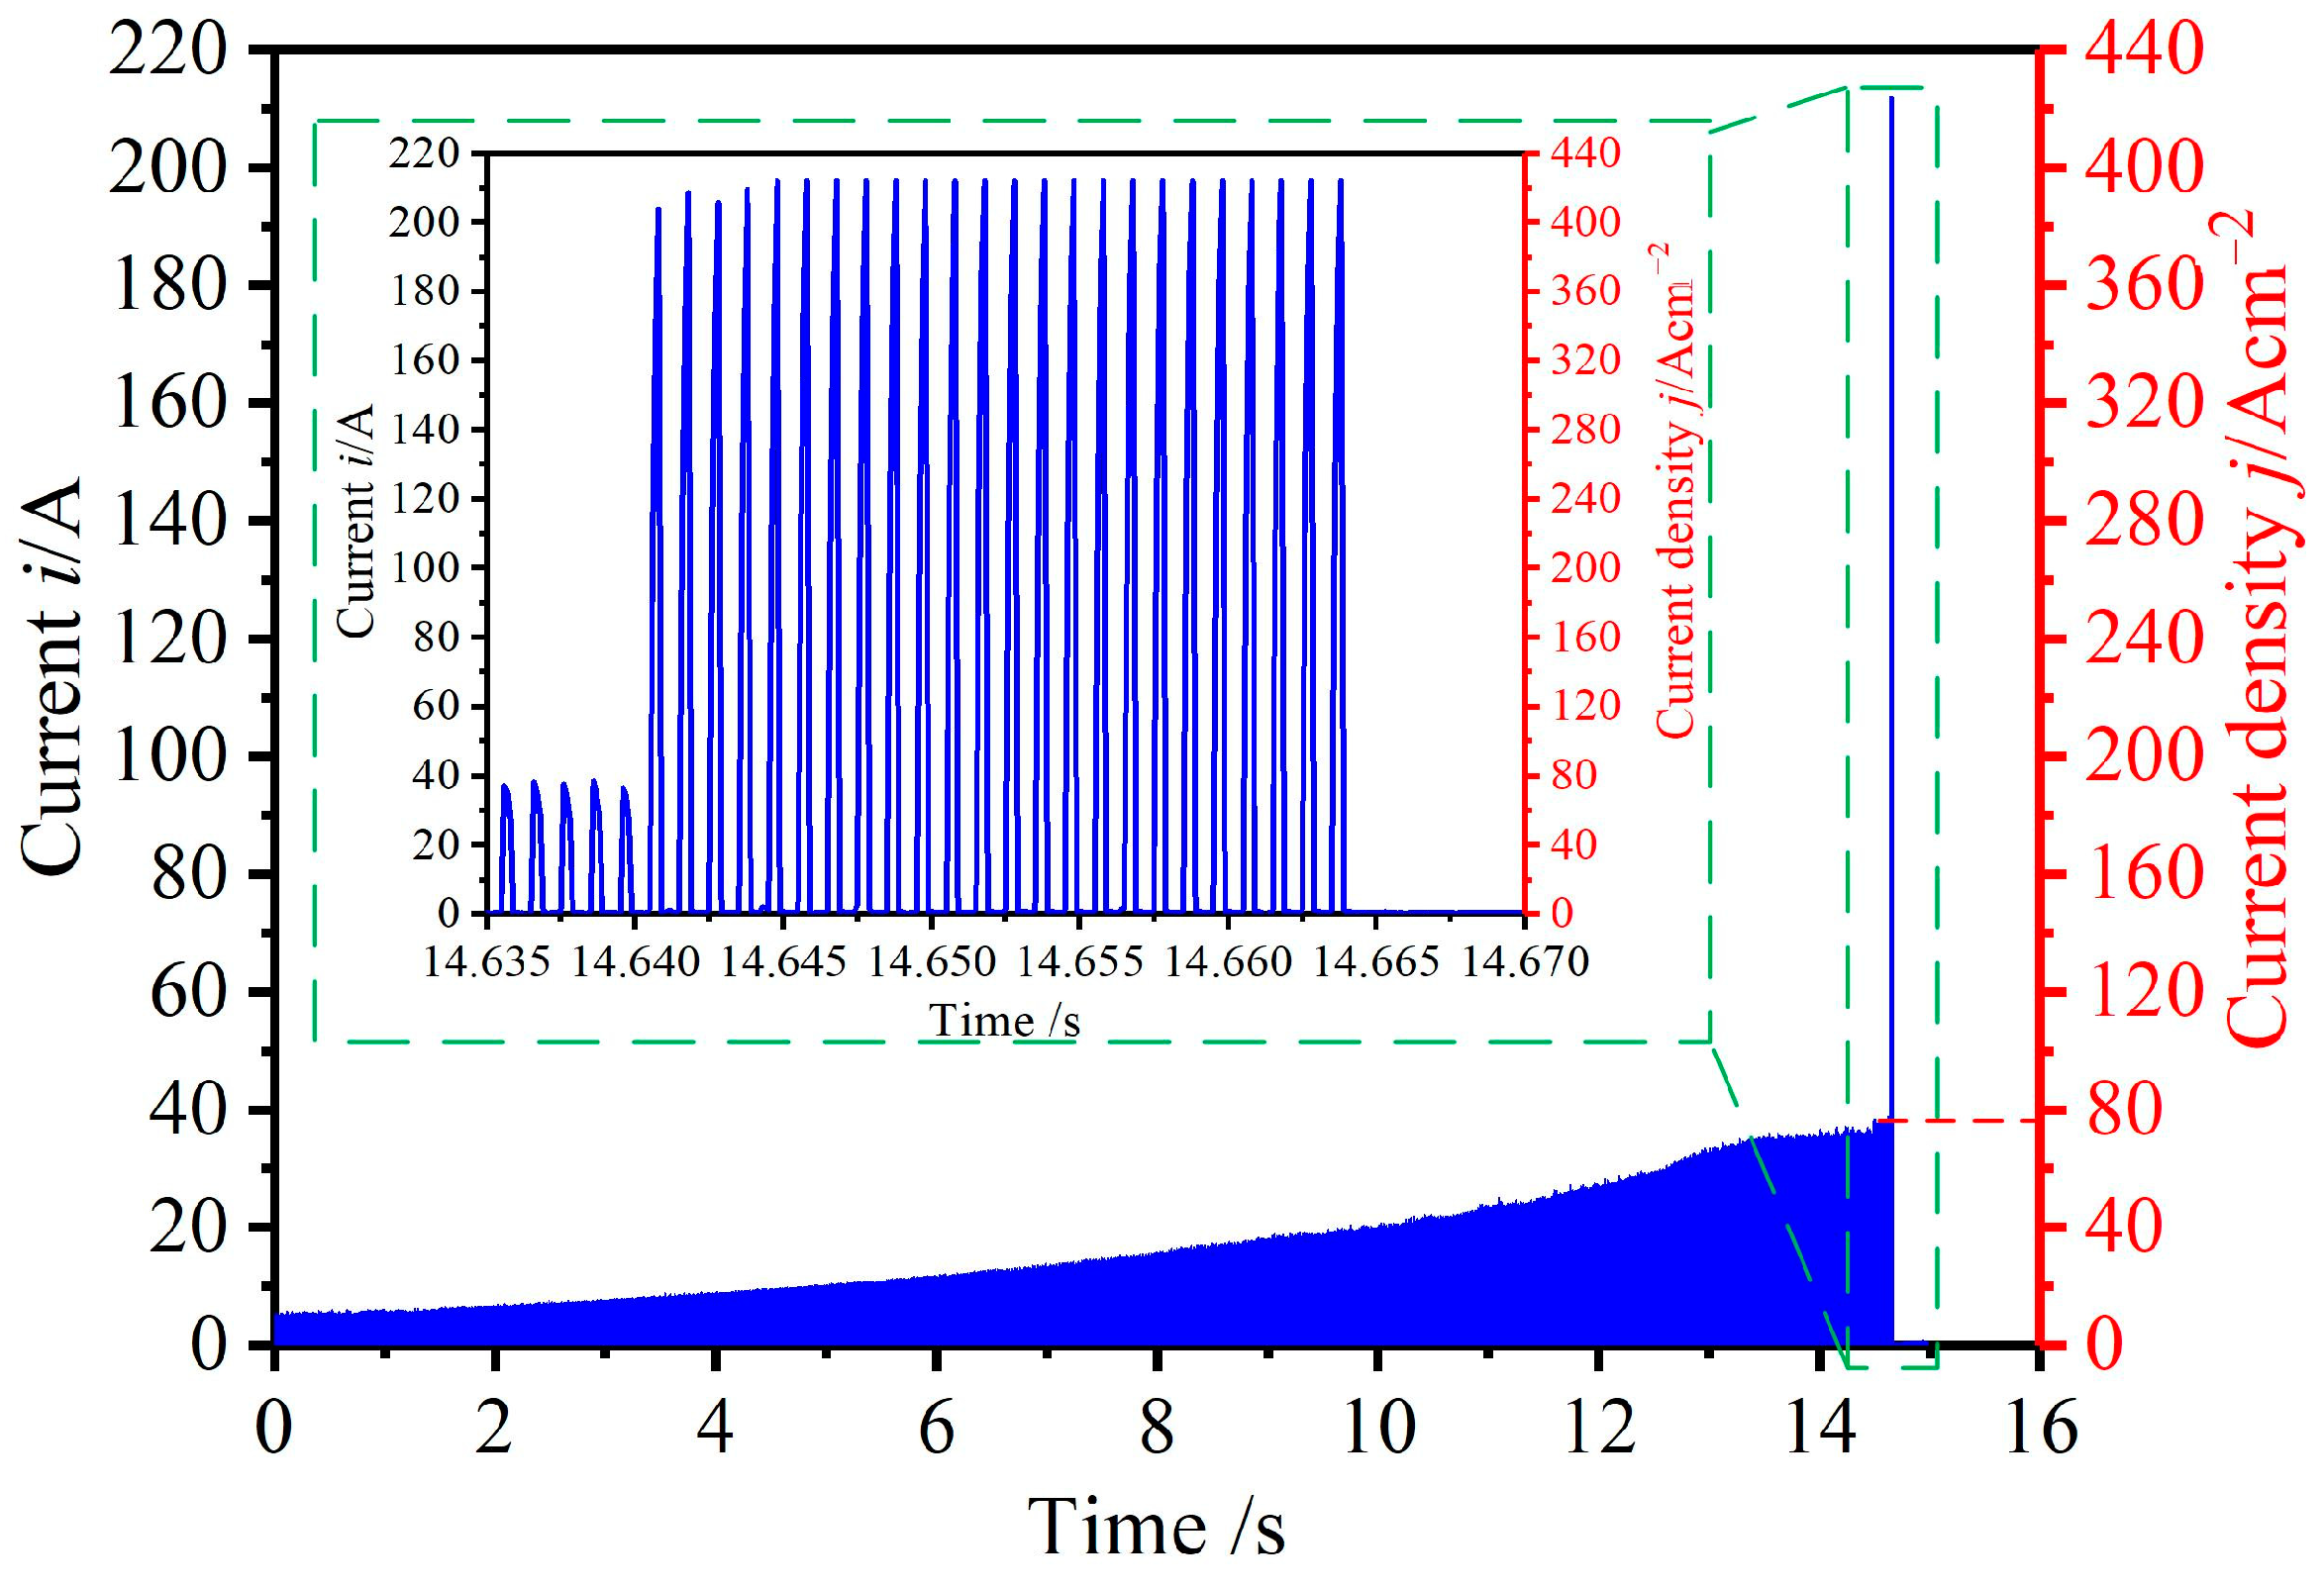
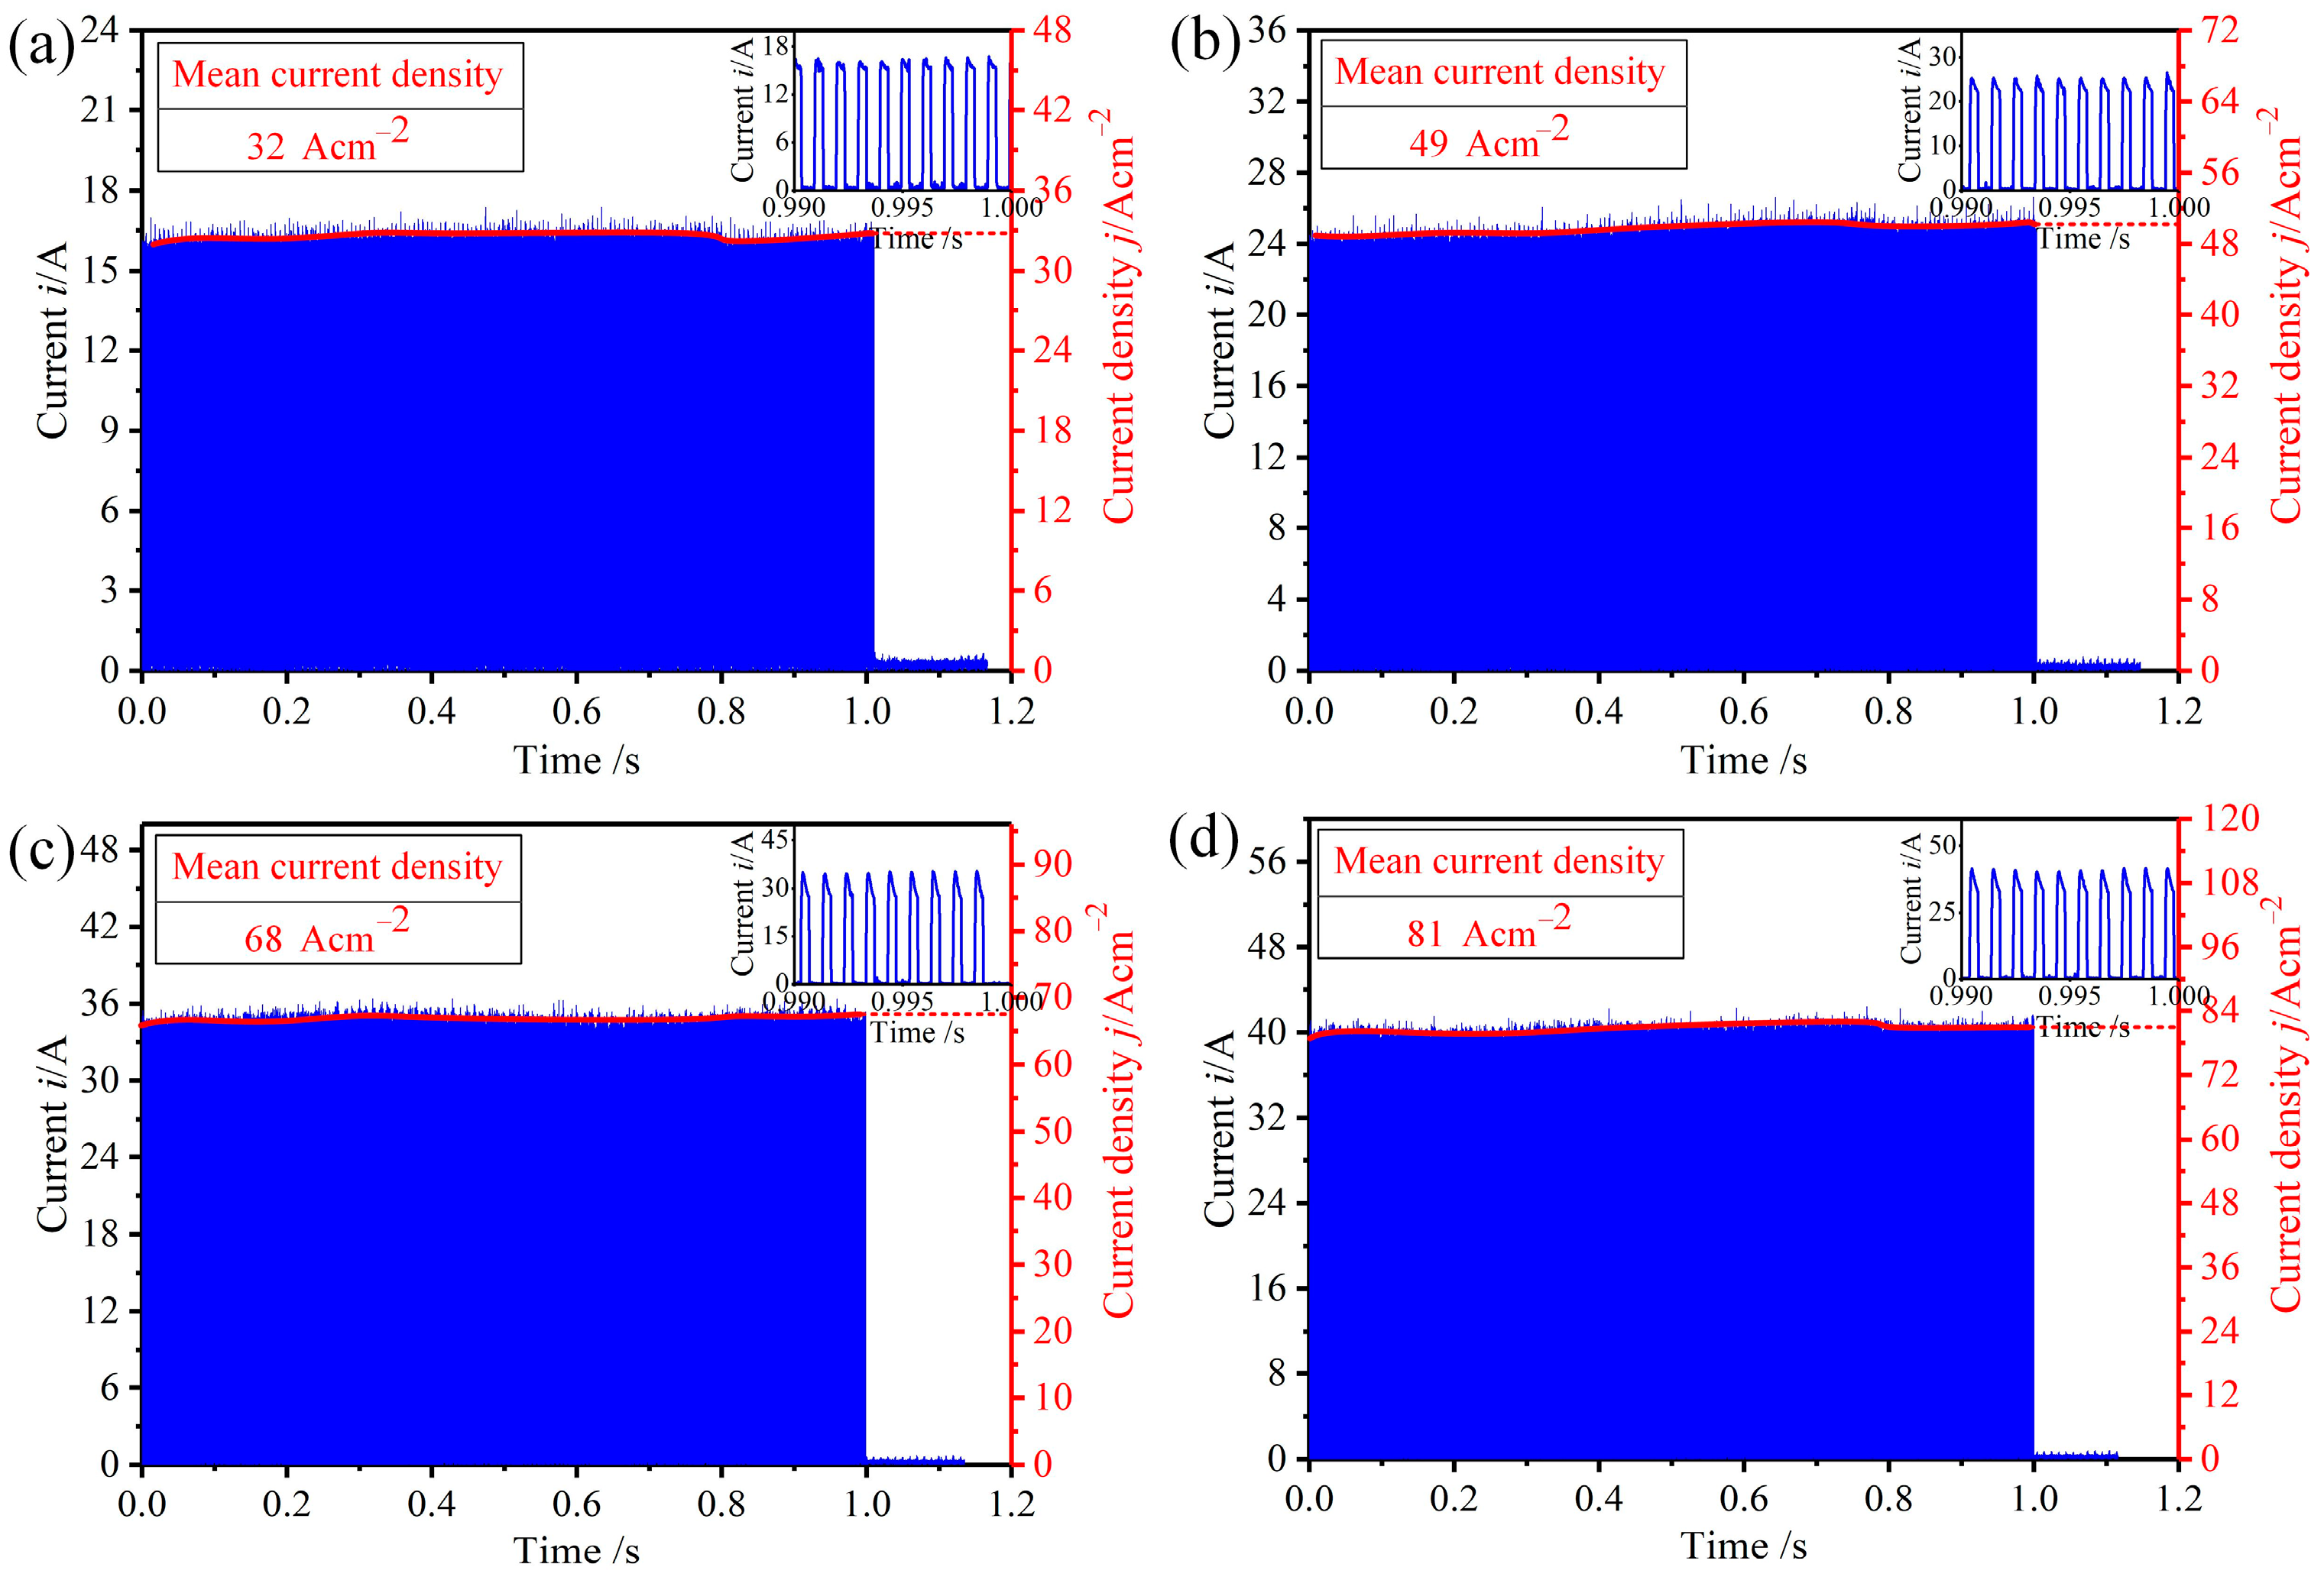
3.3. Influence of Current Density on the Black Layer
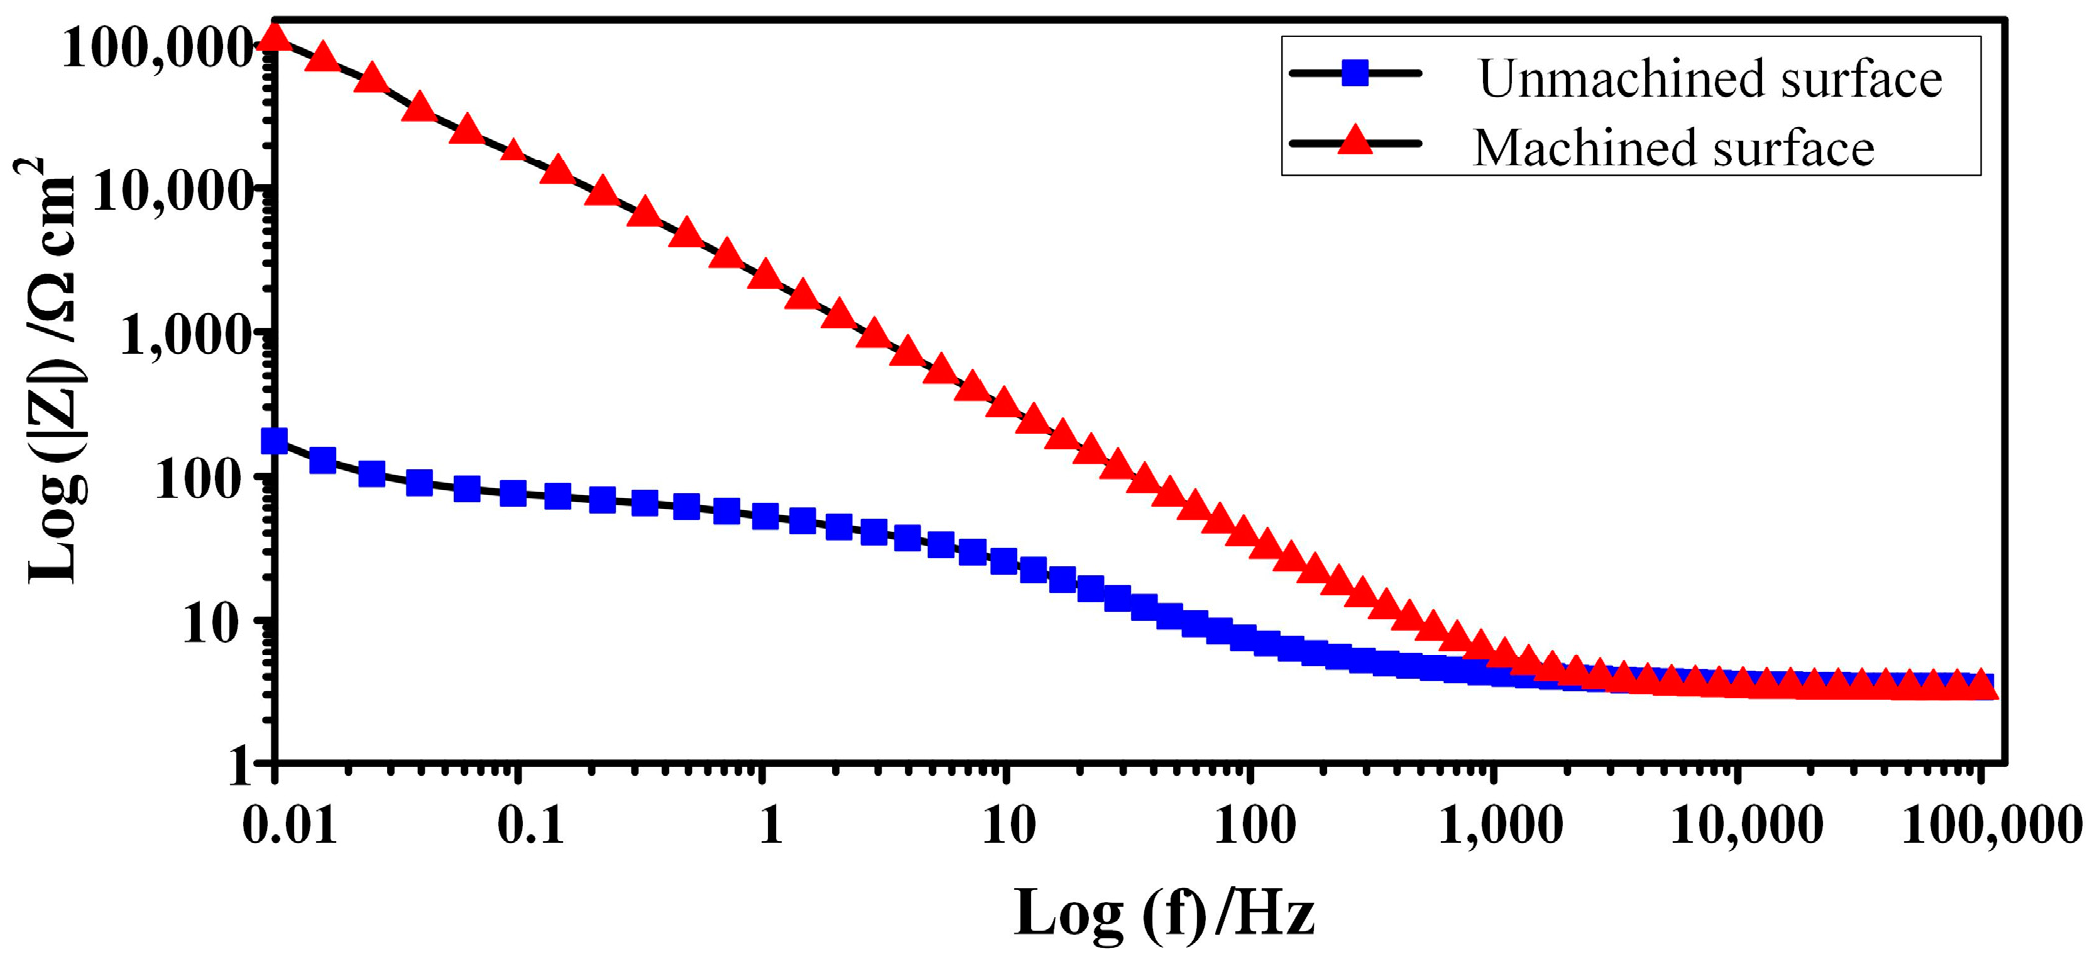
3.4. Electrochemical Impedance Spectroscopy
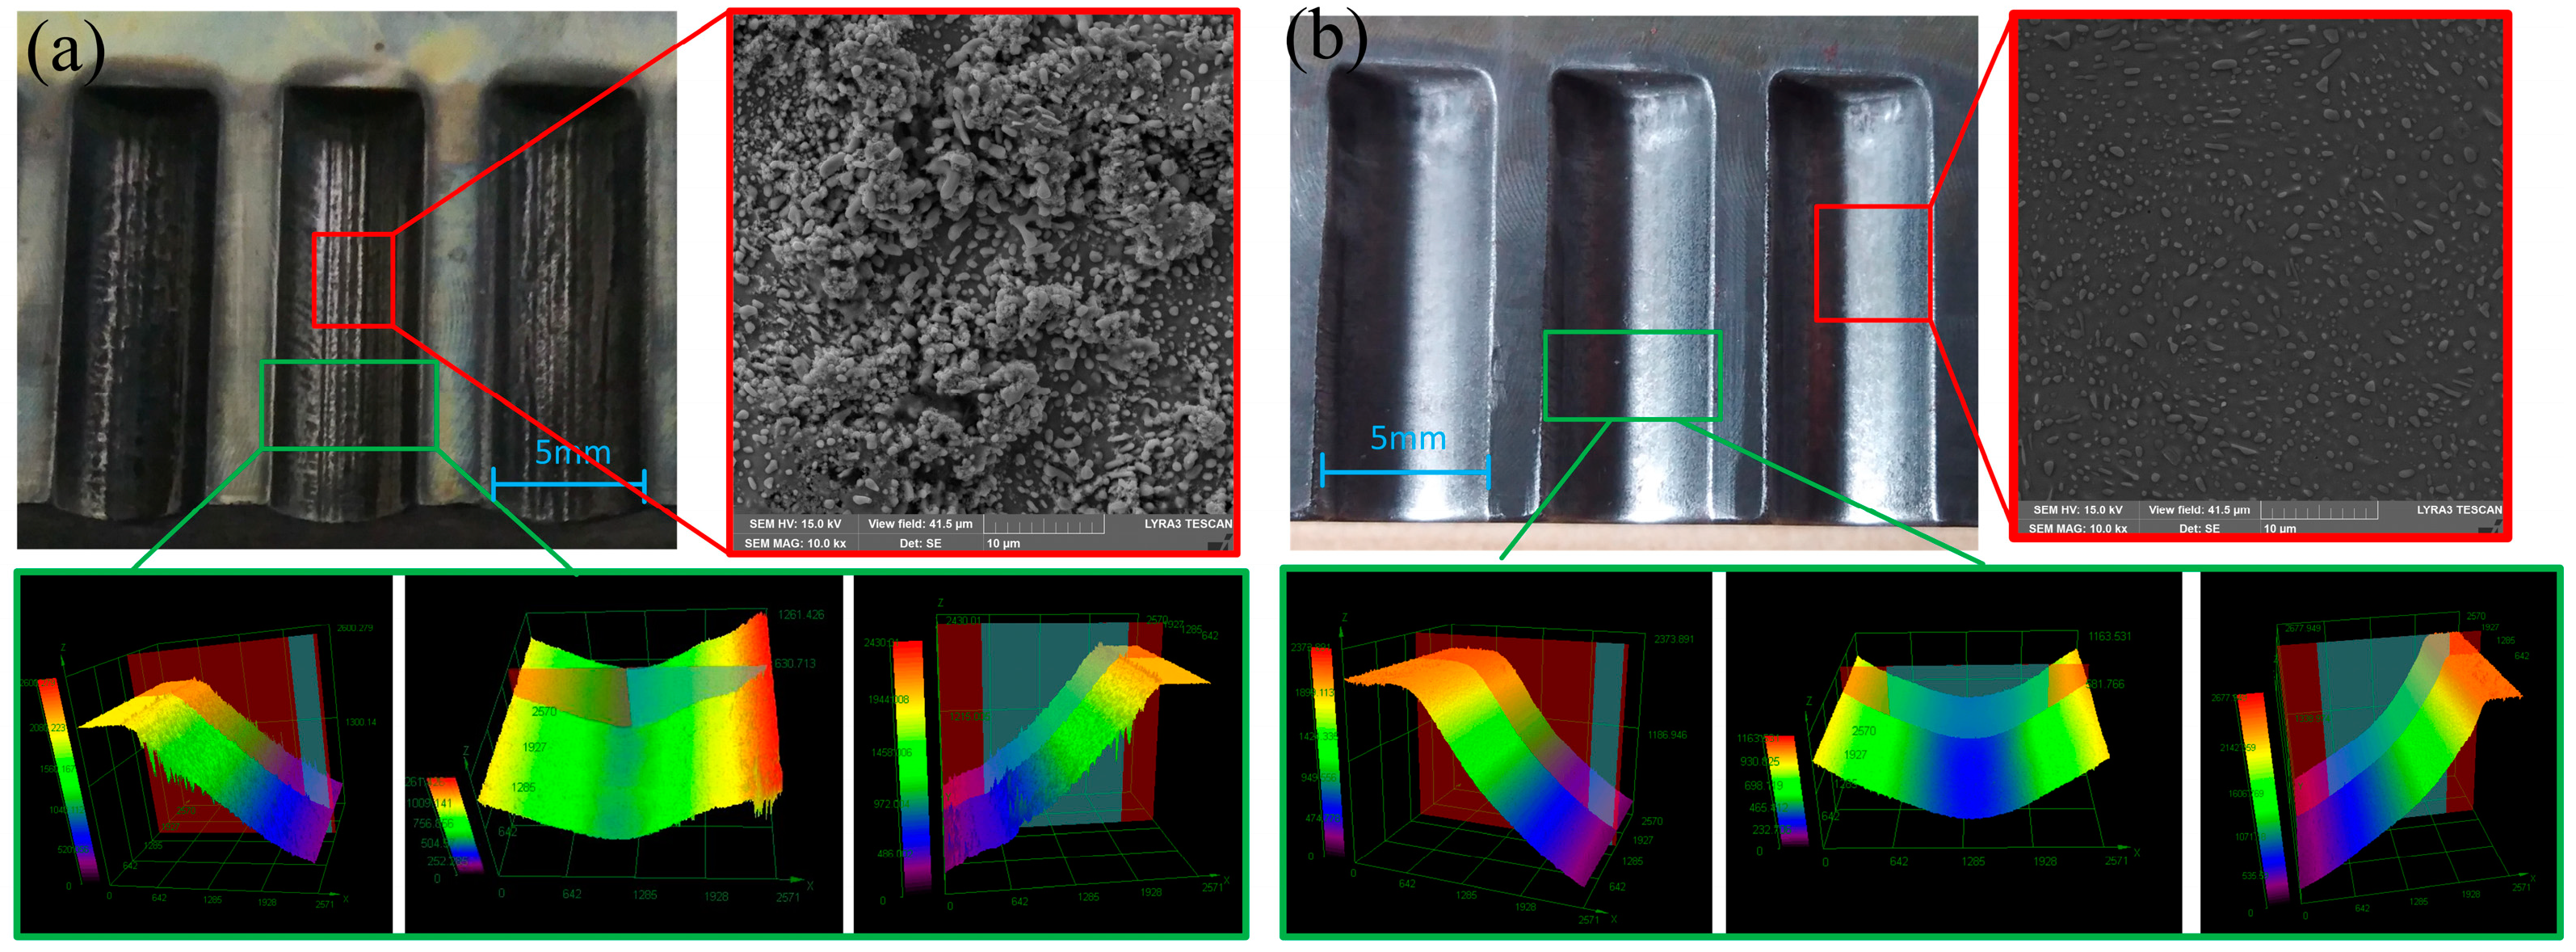
3.5. Fabrication of Double Circular Arc Groove
4. Conclusions
- The electrochemical dissolution characteristics of GCr15 show obvious passive and transpassive zones in NaNO3 solution, indicating that an oxide layer can be formed and removed during ECM.
- In the case of a short circuit during ECM, black and bright parts on the machined surface were left. XRD and XPS results indicate that the black part was mainly covered by a dense black flocculent Fe3O4 layer. In contrast, many solid Fe3C particles were found in the bright part, though it also contained small amounts of FeO and Fe2O3.
- In a current density of 32 A/cm2, a Fe3O4 layer was formed on the machined surface. With increasing current density, the thickness of the layer decreased. When the current density reached 82 A/cm2, the entire flocculent oxide layer was removed and only some spherical solid particles (Fe3C) were inserted, showing a bright surface with low roughness.
- EIS results indicate that, due to the cementite exposed on the machined surface, its corrosion resistance was significantly improved over that of an unmachined surface.
Author Contributions
Funding
Data Availability Statement
Conflicts of Interest
References
- Jeckins, L.; Forrest, R. Properties and Selection: Irons, Steels, and High-Performance Alloys, 10th ed.; ASM International: Materials Park, OH, USA, 1993. [Google Scholar]
- Bhadeshia, H. Steels for bearings. Prog. Mater. Sci. 2012, 57, 268–435. [Google Scholar] [CrossRef]
- Wu, M.; Liu, J.; He, J.; Chen, X.; Guo, Z. Fabrication of surface microstructures by mask electrolyte jet machining. Int. J. Mach. Tools Manuf. 2020, 148, 103471. [Google Scholar] [CrossRef]
- Wu, M.; Arshad, M.; Saxena, K.; Qian, J.; Reynaerts, D. Profile prediction in ECM using machine learning. Procedia CIRP 2022, 113, 410–416. [Google Scholar] [CrossRef]
- Steuer, P.; Weber, O.; Bähre, D. Structuring of wear-affected copper electrodes for electrical discharge machining using Pulse Electrochemical Machining. Int. J. Refract. Met. Hard Mater. 2015, 52, 85–89. [Google Scholar] [CrossRef]
- Schubert, N.; Schneider, M.; Michaelis, A. Electrochemical Machining of cemented carbides. Int. J. Refract. Met. Hard Mater. 2014, 47, 54–60. [Google Scholar] [CrossRef]
- Anasane, S.; Bhattacharyya, B. Experimental investigation into fabrication of microfeatures on titanium by electrochemical micromachining. Adv. Manuf. 2016, 4, 167–177. [Google Scholar] [CrossRef]
- Wang, D.; Zhu, Z.; Wang, N.; Zhu, D.; Wang, H. Investigation of the electrochemical dissolution behavior of Inconel 718 and 304 stainless steel at low current density in NaNO3 solution. Electrochim. Acta 2015, 156, 301–307. [Google Scholar] [CrossRef]
- Song, J.; Huang, W.; Liu, J.; Huang, L.; Lu, Y. Electrochemical machining of superhydrophobic surfaces on mold steel substrates. Surf. Coat. Technol. 2018, 344, 499–506. [Google Scholar] [CrossRef]
- Fan, K.; Jin, Z.; Guo, J.; Wang, Z.; Jiang, G. Investigation on the surface layer formed during electrochemical modification of pure iron. Appl. Surf. Sci. 2019, 466, 466–471. [Google Scholar] [CrossRef]
- Lohrengel, M.; Rosenkranz, C. Microelectrochemical surface and product investigations during electrochemical machining (ECM) in NaNO3. Corros. Sci. 2005, 47, 785–794. [Google Scholar] [CrossRef]
- Lohrengel, M.; Rataj, K.; Münninghoff, T. Electrochemical Machining—Mechanisms of anodic dissolution. Electrochim. Acta 2016, 201, 348–353. [Google Scholar] [CrossRef]
- Demirtas, H.; Yilmaz, O.; Kanber, B. Controlling short circuiting, oxide layer and cavitation problems in electrochemical machining of freeform surfaces. J. Mater. Process. Technol. 2018, 262, 585–596. [Google Scholar] [CrossRef]
- Gao, C.; Qu, N.; Ding, B.; Shen, Y. An insight into cathodic reactions during wire electrochemical micromachining in aqueous hydrochloric acid solution. Electrochim. Acta 2019, 295, 67–74. [Google Scholar] [CrossRef]
- Che, T.; Long, L.; Chun, Y. The technical development of titanium alloy surface process using electrochemical abrasive jet machining. Ind. Lubr. Tribol. 2018, 70, 1545–1551. [Google Scholar]
- Zhang, S.; Zhou, J.; Fu, F.; Hu, G.; Zhao, Y.; Wang, L.; Xu, Y. Electric arc electrochemical machining of Ti6Al4V titanium alloy based on high-pressure internal flushing fluid. J. Manuf. Process. 2024, 112, 60–81. [Google Scholar] [CrossRef]
- Zhang, C.; Zhang, Y.; Chen, X.; Li, W.; Liu, G. Investigation of the electrochemical dissolution behavior of tungsten during electrochemical machining. Int. J. Adv. Manuf. Technol. 2018, 97, 3575–3582. [Google Scholar] [CrossRef]
- Liu, W.; Ao, S.; Li, Y.; Liu, Z.; Zhang, H.; Manladan, S.; Luo, Z.; Wang, Z. Effect of Anodic Behavior on Electrochemical Machining of TB6 Titanium Alloy. Electrochim. Acta 2017, 233, 190–200. [Google Scholar] [CrossRef]
- He, B.; Wang, D.; Zhang, J.; Lei, W. Investigation of Electrochemical Dissolution Behavior of Near-α TA15 Titanium Alloy in NaCl Solution with Low-Frequency Pulse Current. J. Electrochem. Soc. 2022, 169, 043515. [Google Scholar] [CrossRef]
- Liu, Y.; Ouyang, P.; Zhang, Z.; Wang, Y.; Zhu, H.; Xu, K. Electrochemical dissolution behavior and electrochemical jet machining characteristics of titanium alloy in high concentration salt solution. Int. J. Adv. Manuf. Technol. 2023, 129, 3595–3607. [Google Scholar]
- Lohrengel, M. Pulsed Electrochemical Machining of Iron in NaNO3: Fundamentals and New Aspects. Mater. Manuf. Process 2005, 20, 1–8. [Google Scholar] [CrossRef]
- Oku, M.; Hirokawa, K. X-ray photoelectron spectroscopy of Co3O4, Fe3O4, Mn3O4, and related compounds. J. Electron. Spectrosc. 1976, 8, 475–481. [Google Scholar] [CrossRef]
- Joyner, D.; Johnson, O.; Hercules, D. A study of the iron borides. 1. Electron spectroscopy. J. Am. Chem. Soc. 1980, 102, 1910–1917. [Google Scholar] [CrossRef]
- Zhang, X.; Niu, Y.; Meng, X.; Li, Y.; Zhao, J. Structural evolution and characteristics of the phase transformations between α-Fe2O3, Fe3O4 and γ-Fe2O3 nanoparticles under reducing and oxidizing atmospheres. Crystengcomm 2013, 15, 8166–8173. [Google Scholar] [CrossRef]
- Shabanova, I.; Trapeznikov, V. A study of the electronic structure of Fe3C, Fe3Al and Fe3Si by x-ray photoelectron spectroscopy. J. Electron. Spectrosc. 1975, 6, 297–307. [Google Scholar] [CrossRef]
- Mcintyre, N.; Zetaruk, D. X-ray photoelectron spectroscopic studies of iron oxides. Anal. Chem. 1977, 49, 1521–1529. [Google Scholar] [CrossRef]
- Allen, G.; Curtis, M.; Hooper, A.; Tucker, P. X-Ray Photoelectron Spectroscopy of Iron-Oxygen Systems. J. Chem. Soc. Dalton Trans. 1974, 14, 1525–1530. [Google Scholar] [CrossRef]
- Lu, B.; Wei, W.; Mao, H.; Lu, X. Effect of Cold Ring Rolling on the Wear Resistance of GCr15 Bearing Steel after Quenching and Tempering. Metals 2019, 9, 647. [Google Scholar] [CrossRef]
- Badawy, W.; Nady, H.; Negem, M. Cathodic hydrogen evolution in acidic solutions using electrodeposited nano-crystalline NieCo cathodes. Int. J. Hydrogen Energy 2014, 39, 10824–10832. [Google Scholar] [CrossRef]
- García-Rubio, M.; Ocon, P.; Curioni, M.; Thompson, G.; Skeldon, P.; Lavía, A.; García, I. Degradation of the corrosion resistance of anodic oxide films through immersion in the anodising electrolyte. Corros. Sci. 2010, 52, 2219–2227. [Google Scholar] [CrossRef]
- Högström, J.; Andersson, M.; Jansson, U.; Björefors, F.; Nyholm, L. On the Evaluation of Corrosion Resistances of Amorphous Chromium-Carbon Thin-Films. Electrochim. Acta 2014, 122, 224–233. [Google Scholar] [CrossRef]


| Fe | C | Cr | Mn | Si | Others |
|---|---|---|---|---|---|
| Balance | 1.01 | 1.46 | 0.36 | 0.25 | <0.05 |
| Parameter | Value |
|---|---|
| Electrolyte (wt.%) | 1.5 mol/L, NaNO3 |
| Measuring potential (V) | −1.25~4 |
| Scan rate (mV/s) | 1 |
| Temperature (°C) | 25 |
| Parameter | Value |
|---|---|
| Electrolyte, NaNO3 (mol/L) | 1.5 |
| Applied voltage (V) | 10, 14, 18, 22 |
| Pulse duty cycle (%) | 40 |
| Pulse frequency (kHz) | 1 |
| Feed rate (mm/min) | 1.5, 1.8 |
| Initial gap (mm) | 0.2 |
| Electrolyte pressure (MPa) | 0.5 |
| Electrolyte temperature (°C) | 25 |
Disclaimer/Publisher’s Note: The statements, opinions and data contained in all publications are solely those of the individual author(s) and contributor(s) and not of MDPI and/or the editor(s). MDPI and/or the editor(s) disclaim responsibility for any injury to people or property resulting from any ideas, methods, instructions or products referred to in the content. |
© 2024 by the authors. Licensee MDPI, Basel, Switzerland. This article is an open access article distributed under the terms and conditions of the Creative Commons Attribution (CC BY) license (https://creativecommons.org/licenses/by/4.0/).
Share and Cite
Liu, X.; Su, G.; Fan, Q.; Zhang, Y.; Chen, H.; Zhang, C. Investigation of the Surface Characteristics of GCr15 in Electrochemical Machining. Micromachines 2024, 15, 1062. https://doi.org/10.3390/mi15091062
Liu X, Su G, Fan Q, Zhang Y, Chen H, Zhang C. Investigation of the Surface Characteristics of GCr15 in Electrochemical Machining. Micromachines. 2024; 15(9):1062. https://doi.org/10.3390/mi15091062
Chicago/Turabian StyleLiu, Xuesong, Guokang Su, Qingming Fan, Yongjun Zhang, Hua Chen, and Chuanyun Zhang. 2024. "Investigation of the Surface Characteristics of GCr15 in Electrochemical Machining" Micromachines 15, no. 9: 1062. https://doi.org/10.3390/mi15091062