1. Introduction
The emerging interest for single-cell analytical data calls for novel data acquiring methods. Microfluidics can effectively be used in studies of signal transduction pathways by the fast and reproducible introduction of different perturbations on the studied system. Single-cell analysis of yeast was first reported in the early 50’s [
1], and includes several different single-cell assays [
2]. The spatial and temporal resolutions of such analyses are widely exceeding that of traditional cell culture methodologies [
3]. In addition, single-cell analysis provides information on cell-to-cell variability that will be obscured in averaged results from population analyses [
4]. This heterogeneity in cell response can be attributed to intrinsic and extrinsic noise [
5], e.g., in which phase the individual cells are in their cell cycle. Single-cell analyses have been improved further by the use of microfluidics. The microfluidic chambers are cheap to produce, customizable and compatible with different spectrometric methods and, in addition, they also enable the possibility of accomplishing fast and accurate concentration changes of, e.g., nutrients and different substances that affect the biological event studied. In order to control not only the microenvironment around the cells in the microfluidic chamber, but also the cell positions, optical tweezers (OT) are used [
6]. This enables selective cell manipulation in a non-intrusive way [
7].
The study of biological signaling pathways is complicated, and
Saccharomyces cerevisiae (
S. cerevisiae), also known as budding yeast due to its reproduction mechanism, is a frequently used eukaryote model organism [
8,
9,
10] for studying biological mechanisms that could have future impact on human disease prevention [
11]. The High Osmolarity Glycerol (HOG) Mitogen Activated Protein Kinase (MAPK) pathway of
S. cerevisiae, a functional homolog of the stress activated MAPK signaling pathway Jun
N-terminal kinase (JNK) and the MAPK p38 pathways of mammals [
12], is involved in the cellular adaptation to hyperosmotic stress. Because of the high degree of conservation of the MAPK kinase cascades, the yeast HOG pathway is a good model for studying osmotic adaptation processes. The HOG pathway responds to changes in external osmolarity by activating the MAPK Hog1, triggering the cellular response that includes both transcriptional upregulation of approximately six hundred osmoresponsive genes [
13,
14,
15], and events extending beyond gene transcription. The closure of the glycerol export channels in the plasma membrane [
16] and rerouting of the metabolite utilization in glycolysis [
17] will contribute to an increased cellular glycerol content and cell adaptation to the new environment. Three transmembrane proteins, Sln1, Msb2 and Hkr1 sense the increased external osmolarity [
18,
19]. The activation signal is transduced via two branches (the Sln1 and Sho1 branch respectively) that merge by the phosphorylation of the MAPK kinase (MAPKK) Pbs2. Pbs2 subsequently phosphorylates and activates the MAPK Hog1, which rapidly translocates from the cytoplasm into the nucleus [
20] via the nuclear envelope transport protein, Nmd5p [
21]. A simplified schematic of the HOG signaling pathway can be seen in
Figure 1. The phosphorylation of Hog1 is required for its nuclear envelope translocation [
21]. The influence of the used Hog1 inhibitor on the translocation of Hog1 has been described by Dinér
et al. [
22]. Migration studies upon Hog1 pathway activation, where the intensity ratio of nucleic to cytosolic Hog1-GFP is plotted, would reveal if the effects of Hog1 inhibition (
i.e., a prolonged phosphorylation and hence nuclear localization of Hog1) were mirrored in the protein’s location.
Figure 1.
A simplified scheme of the HOG signaling pathway. The HOG pathway responds to changes in external osmolarity. The activation signal is transduced via the Sln1 and Sho1 branch respectively, that merge by the phosphorylation of the MAPKK Pbs2. Pbs2 subsequently phosphorylates and activates the MAPK Hog1, which rapidly translocates from the cytoplasm into the nucleus. The inhibitor acts on Hog1 and will inhibit its downstream kinase activity.
In this article, we report on a single-cell evaluation of the highly effective Hog1 inhibitor 4-(1-benzyl-4-phenyl-1H-1,2,3-triazol-5-yl)-
N-isopropylpyridin-2-amine [
22] for the HOG pathway. A four-inlet microfluidic chamber, enabling rapid switching between different treatments, was utilized for analyzing the stress-induced translocation process of Hog1 as a function of time. Cell responses due to osmotic stress after and during exposure with a Hog1-specific inhibitor was studied using two distinguishable cell strains within the same chamber. Sequential Hog1 inhibitor and osmotic stress treatment of an
S. cerevisiae cell array were performed, with temporal resolution and an experimental precision down to a few seconds. This temporal precision was essential in order to determine the most efficient incubation time for Hog1 inhibition and to have comparable measurements with a minimized temporal variation of incubation times between the different single-cell experiments.
Our setup enables actively choosing single cells from two different cell strains and following the responses of individual cells over time. This possibility makes the setup advantageous for unraveling the mechanisms of the HOG and similar dynamic signal transduction pathways. Any heterogeneous response of the single cells is revealed by using the intensity ratio of fluorescently tagged proteins within the cell as a tool for tracing protein movement. For the possible event of complete inhibition, a method to ensure that cells were responding to the inflowing chemical as intended had to be established. The solution was to introduce a second cell strain using the additional inlet of the four-inlet chamber. These control cells were imaged alongside the cells of interest when the Hog1 inhibitor was used. This increase in versatility and the use of in situ control cells ensures our chamber a valuable tool for providing insight into biological problems, e.g., the complexity of the signaling pathways of S. cerevisiae.
A key improvement over our previously described three-inlet chamber [
7], is that the four-inlet microfluidic chamber allows for rapid switching between two treatments, which leads to a great gain in temporal resolution.
2. Experimental Section
The cells were captured and positioned using OT (400 mW Ytterbium fibre laser LP, 1070 nm, IPG Laser) and were sequentially treated with a selective Hog1 kinase inhibitor [
22] and sorbitol. These single-cell experiments are the first using this particular Hog1 inhibitor. Responses were monitored on a single-cell level by time-lapse fluorescence microscopy, monitoring the nuclear migration of the reporter protein Hog1-GFP, initiated by osmotic stress. The flow of Hog1 inhibitor was introduced to the cells via one of the four inlets. Two other inlets carried the two cell strains respectively, and the final one introduced the flow of sorbitol (for increased osmotic pressure upon the cells). The microscope was a Leica DMI6000B with control box CTR 6500 (Leica Microsystems, Wetzlar, Germany). The GFP filter cube was a 472/30 nm exciter, 520/35 nm emitter and 495LP dichroic mirror (Semrock IDEX Corporation, Rochester, NY, USA). The mCherry filter cube was a 560/40 nm exciter, 630/75 nm emitter and 585LP dichroic mirror (Chroma, Bellows Falls, VT, USA). A 100× HCX plan fluotar oil immersion objective (Leica Microsystems, Wetzlar, Germany) with a numerical aperture of 1.30 was used.
2.1. Strains and Cell Culture
Two different yeast strains in BY4741 background were used; the HOG1-GFP-HIS3 NRD1-mCherry-hphNT1 strain, for monitoring Hog1 migration, and the MSN2-GFP-HIS3 NRD1-mCherry-hphNT1 strain as control cells. Both strains were grown in Yeast Nitrogen Base (YNB, 6.7 g/L) with Complete Supplement Mixture (CSM, 1.54 g/L) and 2% Glucose (pH = 6), at 30 °C on a shaker (220 rpm). The two cell strains were collected at OD600 = 0.5–1.0. The Hog1-GFP cells were then concentrated to twice the initial concentration by centrifugation at a relative centrifugal force of 2400× g for 30 s, followed by removal of the supernatant and addition of fresh growth medium. The cell density of the Hog1-GFP cells were 3 to 4 times the cell density of the Msn2-GFP cells.
2.2. Inhibitor
The selective Hog1 inhibitor 4-(1-benzyl-4-phenyl-1H-1,2,3-triazol-5-yl)-
N-isopropylpyridin-2-amine [
22] (M = 478.67 g/mol) (see Figure S1 for chemical structure) was dissolved in dimethyl sulfoxide (DMSO) to a suitable stock solution. Final concentrations range between 10 nM and 25 μM and control experiments contained the corresponding maximum volume of DMSO. The approximated diffusion coefficient was determined to 260 µm
2/s (measured at 22 °C).
2.3. Microfluidic Fabrication and Setup
The manufacturing protocol for the microfluidic chamber and the experimental procedure has previously been reported [
7,
23,
24]. The disposable microfluidic chambers were made from polydimethylsiloxane (PDMS) using soft lithography and sealed off with a cover glass. A reusable master relief pattern of 27 μm height was formed on a silicon wafer and PDMS was poured onto it using a formwork holding pins to form the four inlet holes and the outlet of the microfluidic chamber. After polymerization, the PDMS structure and a glass slide were treated with air plasma and thereafter immediately placed in physical contact with each other, spontaneously forming a strong irreversible seal [
25].
Figure 2 shows a schematic image of the four-inlet microfluidic chamber and workflow setup, and a colored overlay where both the cells of interest and the control cells are shown.
Figure 2.
Schematic image of the setup in relation to the workflow. (A) The syringes filled with cells and substances are placed in a syringe pump. Cells are trapped by OT and positioned in an array within the microfluidic chamber. The cells and their reporter proteins are imaged in transmission light and fluorescent light while the pump flow rates are automatically controlled and altered; (B) a colored overlay of the bright field, GFP and mCherry images. Cells were actively placed in an array using the OT. In the four first columns, cells are expressing Hog1-GFP and in the rightmost column, control cells are instead expressing Msn2-GFP. The two cell types are visually distinguishable by the different GFP expression. Both cell types express the nucleic protein Nrd1-mCherry. The scale bar is 10 µm.
The inner lining of the chamber was initially saturated with the lectin concanavalin A, which promotes cell adhesion between the cell wall sugar residues and the surfaces [
26]. Then, four 250 μL Hamilton glass syringes (Hamilton Company, Reno, NV, USA) containing the specific cells and different media respectively, were attached to the microfluidic chamber via polytetrafluoroethylene tubing [
24].
2.5. The Use of Control Cells within the Cell Array
An issue that had to be resolved when investigating inhibitory events was the fact that a complete inhibition followed by stress treatment will cause the exact same response as a situation where the cells are not exposed to any stress. In order to identify that the array is indeed treated with sorbitol, a column of control cells expressing Msn2-GFP can in our setup be added to the cell array when a complete Hog1 nuclear localization is anticipated. Msn2 is a transcription factor that regulates the yeast general stress responses and is regulated by several pathways [
27,
28,
29]. Msn2 activation is thus induced by several different stresses of which one is high osmolarity. Msn2 translocates from the cytosol to the nucleus upon activation, just like Hog1, where it together with its related transcription factor, Msn4, regulates the expression of ~200 genes [
27,
30]. Hence, if Hog1 in inhibitor treated cells do not migrate following stress treatment; an Msn2 migration in the control cells ensures that the cells are de facto exposed to the stress agent. Hence, the usage of control cells for signal detection is a unique and useful approach. In this set of experiments their response is only analyzed qualitatively, due to the high complexity of the Msn2 signaling pathway [
31].
2.6. Flow Simulations, Flow Setup and Array Location
Changing the flow velocities in the inlet channels creates the change in the media flow around the immobilized cells, which is necessary to trigger intracellular protein migration. In this way, the microenvironment could rapidly be changed from neutral media to a media containing Hog1 inhibitor (for inhibition of Hog1), or sorbitol (for inducing osmotic stress) or a mixture thereof. A sorbitol concentration of 500 mM was used for exposing the cells to osmotic shock. This, quite low, sorbitol concentration was chosen since a higher sorbitol concentration could complicate image analysis due to large changes in cell volume. The automation software OpenLab (PerkinElmer, Waltham, MA, USA) enabled a completely automated setup and maximized the control of the experimental process. OpenLab was used for controlling the mechanical syringe pumps (CMA Microdialysis, Kista, Sweden), the microscope and the EM-CCD camera (C9100-12, Hamamatsu Photonics, Shizuoka, Japan).
The position of the cell array was chosen after performing flow simulations using COMSOL Multiphysics; Chemical Engineering module with application modes “Incompressible Navier-Stokes” and “Convection-Diffusion”. The simulations were also used for determining the concentration distributions of the sorbitol and the inhibitor respectively, as well as the velocity field within the device. Computer simulations of the flow profiles and concentration gradients were essential for deciding the location of the cell array. The concentration gradients depend on the flow rates as well as on the diffusion coefficients of sorbitol and the inhibitor respectively. The main advantages with using sorbitol over the commonly used stress agent NaCl (mean diffusion coefficient 1600 µm
2/s [
32]) is that sorbitol will provide narrower concentration gradients due to the lower diffusion coefficient and hence lower flow speeds can be used. This is beneficial, since higher flow speeds are more likely to flush the adhered cells away. Another advantage with using sorbitol over NaCl is that it is not taken up by the cells [
33], and does therefore not contribute to the quenching of the GFP signal.
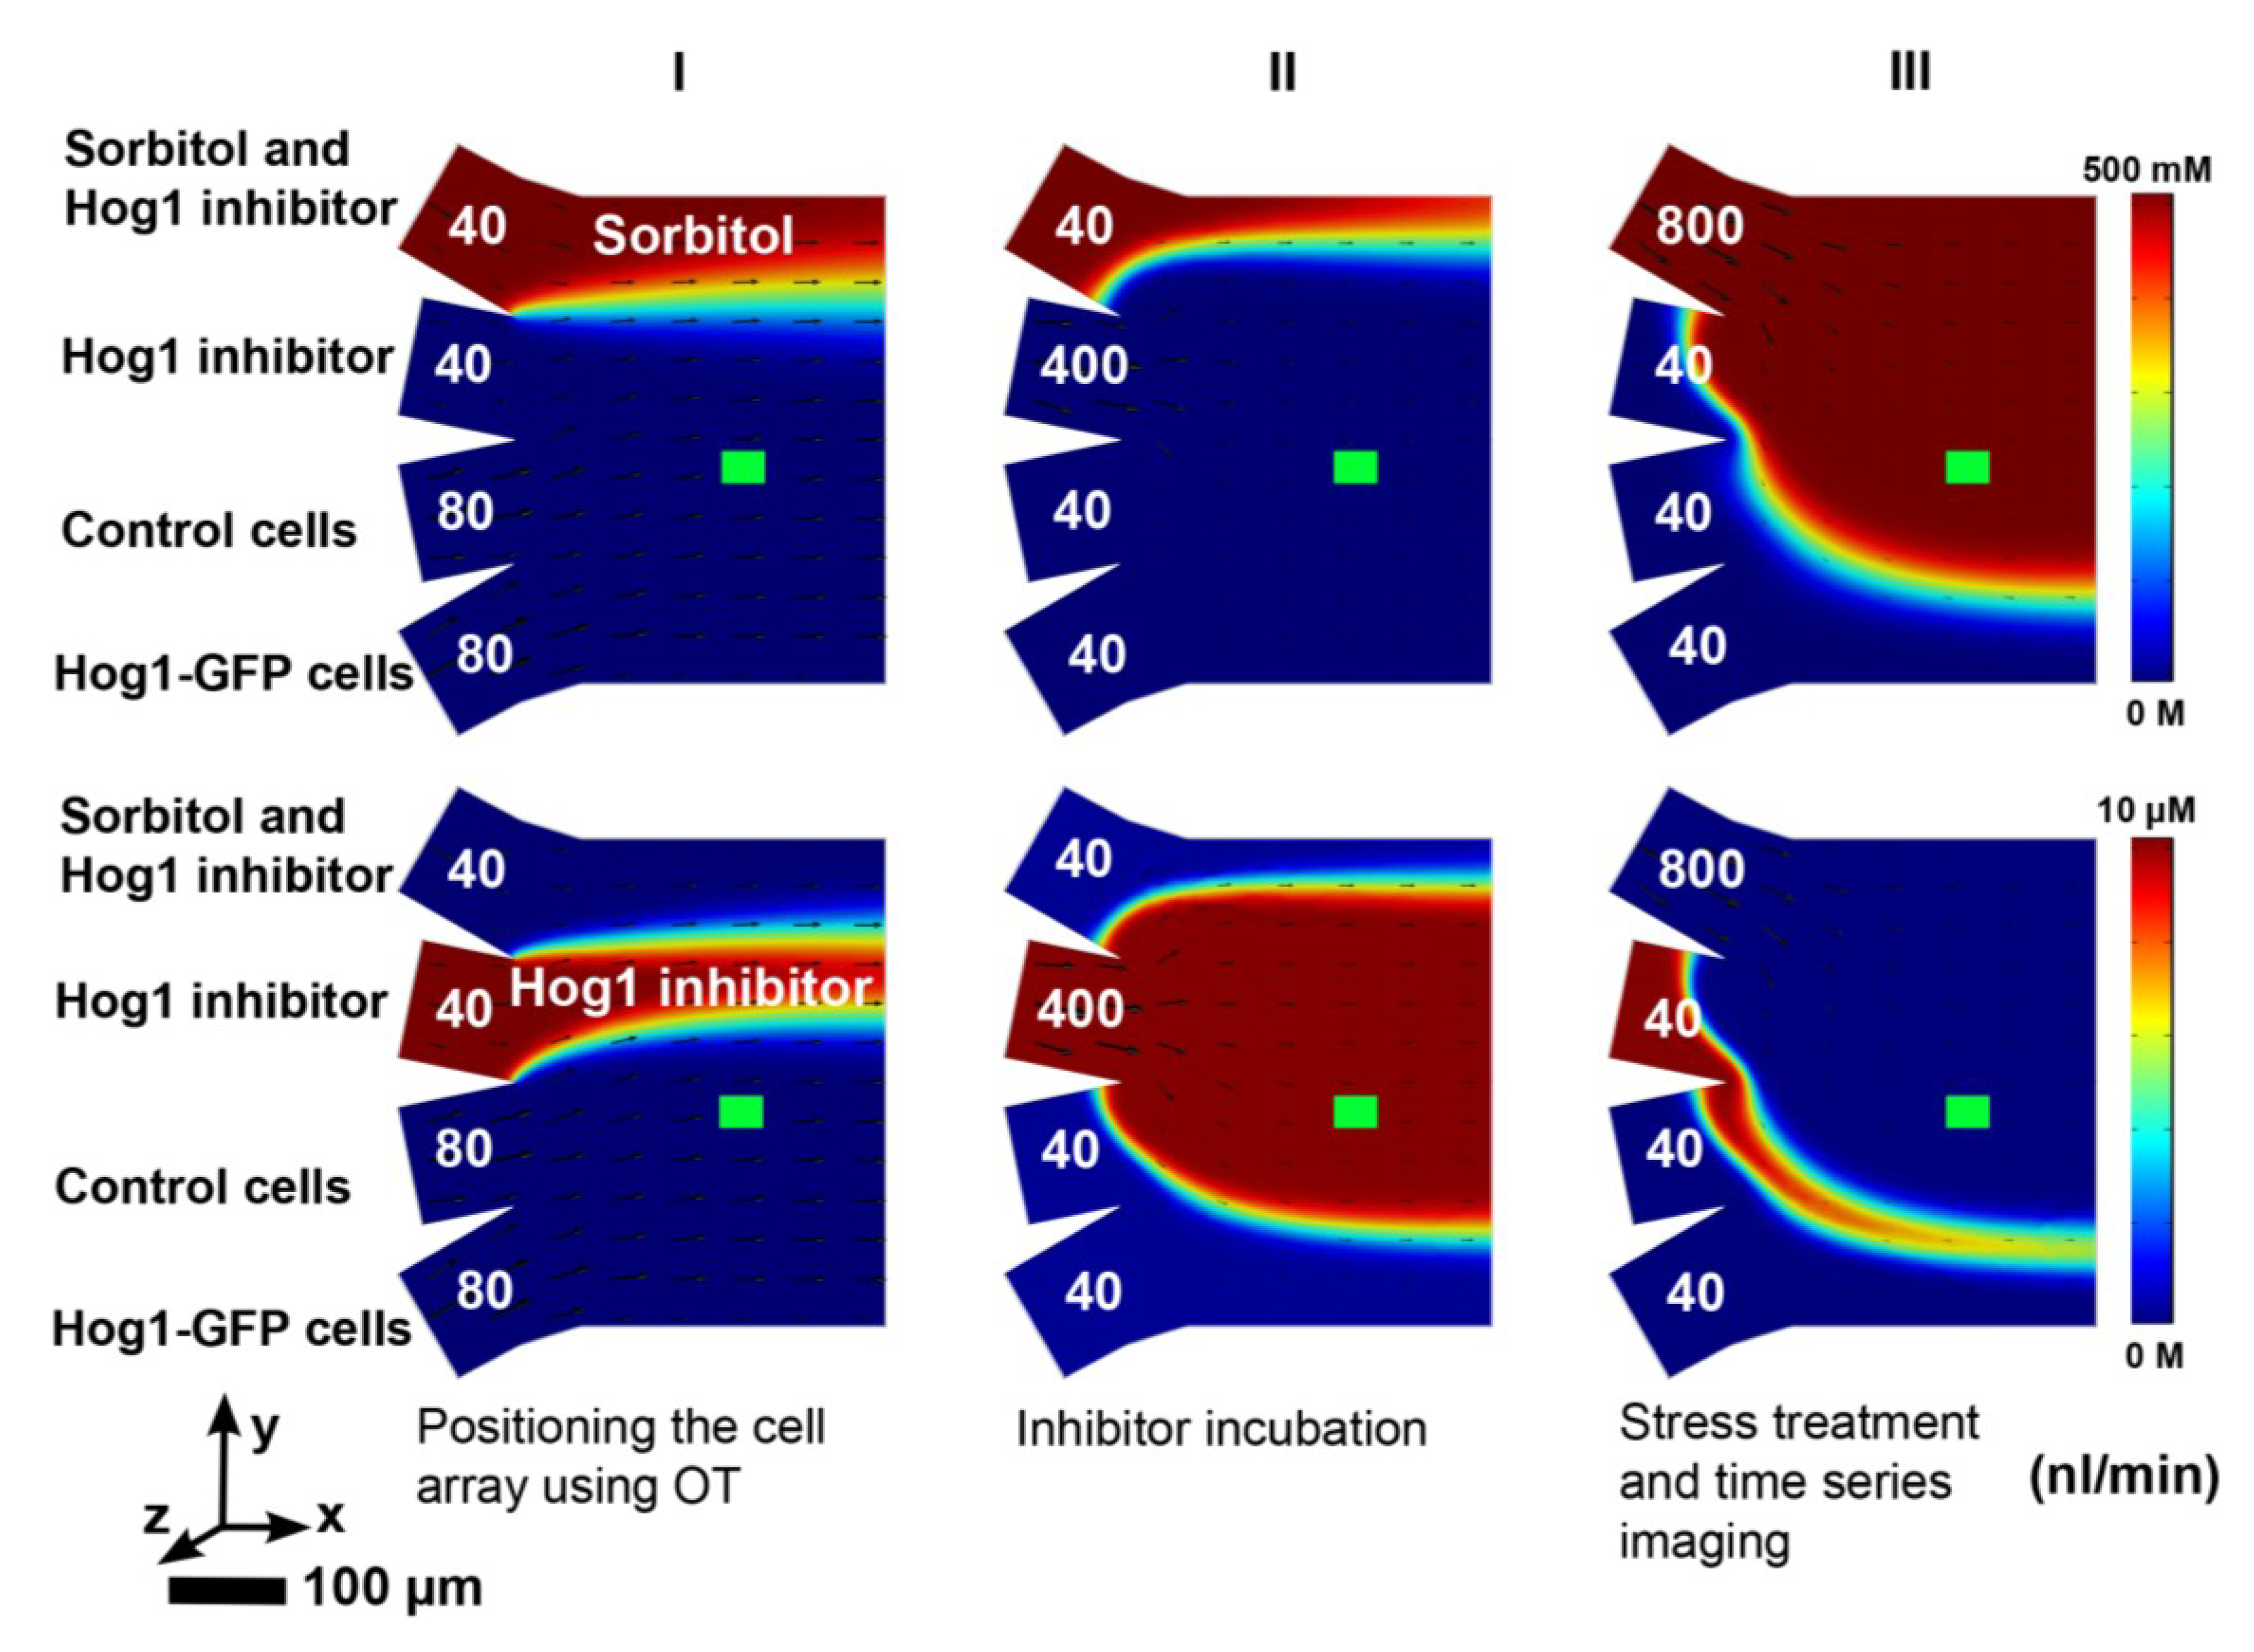
The cell array was positioned to be exposed to a specific concentration from only one inlet channel at a time (e.g., culture medium, inhibitor solution or the sorbitol-inhibitor mixture). Simulations of three different flow configurations of sorbitol and Hog1 inhibitor were performed for the four-inlet microfluidic chamber, respectively (
Figure 4):
The configuration used when trapping cells with the OT and placing them in an array required flow rates of 80 nL/min in the inlet channels containing cells and control cells respectively, and 40 nL/min in the inlet channels containing inhibitor and stress
The configuration for inhibitor incubation required flow rates of 40 nL/min in the cell, control cell and stress channel respectively and 400 nL/min in the inhibitor channel
The configuration for stress treatment required flow rates of 40 nL/min in all inlet channels except the stress channel, which required 800 nL/min
In order to have strictly laminar and stable flows at all time points, the flow in any inlet channel was kept to a minimum of 40 nL/min. According to simulations, the flow velocities at the site of the cell array (5 μm above the adhesion surface) are approximately 0.8 mm/s during inhibitor treatment and 1 mm/s during stress treatment. Gustavsson
et al. [
34] confirmed that sustained glycolytic oscillations in yeast cells stayed unaffected by this 0.2 mm/s increase in flow velocity at the cell site. Our measurements confirm that neither the Hog1 response is affected, see
Figure 5. A complete detachment of the cell array will occur if increasing the flow rate ten times (8000 nL/min in the stress channel).
Figure 4.
Simulation data on concentrations and flow velocities in the microfluidic chamber are shown. The arrow lengths are proportional to the flow velocities given at half of the channel height (a distance of 13.5 μm from the bottom surface). The concentration distribution is given at a distance of 0.1 μm from the bottom surface. The green area represents the position of the yeast cells and the pump rates are shown in nL/min for each inlet channel. The coloring represents the sorbitol flow from 0 to 500 mM (upper row) and the Hog1 inhibitor flow from 0 to 10 μM (lower row) respectively. The first configuration (column I) is used for positioning the cell array using OT, the second configuration (column II) is used for inhibitor incubation and the third configuration (column III) is used for sorbitol treatment and imaging.
Figure 5.
Single-cell response curves for dose-response and inhibition time dependence, respectively. Data were acquired from t = −30 s to t = 2700 s and the sorbitol-inhibitor mixture (500 mM sorbitol) was introduced into the microfluidic chamber at t = 0 s. (Upper row) Dose-response comparison between (from the left): sorbitol stress only, two different inhibitor concentrations, and the inhibitor only, respectively. The presented data clearly show inhibitor uptake by the cells during 20 min flow inhibitor exposure. For the experiment with only inhibitor (no sorbitol), the concentration was set to 25 µM. The figure shows that even a treatment with as low as 5 µM Hog1 inhibitor solution induces a partial inhibitory response in the cells. The number of cells in the each plot was from left to right: 86, 52, 51 and 96. (Lower row) Time response comparison of Hog1-GFP nuclear localization due to increased Hog1 inhibitor incubation times from 0 to 20 min. Immediately adding the sorbitol-inhibitor mixture (500 mM sorbitol) without prior inhibitor incubation, did barely affect the Hog1-GFP nuclear localization, but already after 5 min of inhibitor treatment, a slight decrease of the Hog1-GFP nuclear localization can be seen. The most dramatic decrease in Hog1-GFP nuclear localization could be seen after 10 min of inhibitor treatment compared to the sorbitol only treated cells and the results from the 20 min incubation time experiments. The number of cells differs depending on the number of budding cells in each experiment, the number of repetitions of the measurements, and was from left to right: 86, 30, 36, 43, 51 and 96.
![Micromachines 05 00081 g005]()
One of the main advantages with the setup is that this single-cell analysis method has a temporal resolution superior to traditional techniques. Additional fluorescein measurements revealed that within only four seconds after pump speed change, the whole cell array is covered with the new intended microenvironment. These measurements also showed that there is no gradient present in the near proximity of the site of the cell array before or after the microenvironment change, confirming the selection of the experimental area as adequate.
2.7. Hog1 Inhibitor Incubation
The Hog1 inhibitor incubation times were varied between 0 and 20 min. The time-lapse imaging started after the inhibitor incubation, at
t = −30 s and a sorbitol-inhibitor mixture was introduced at
t = 0 s. Using a sorbitol-inhibitor mixture instead of pure sorbitol induces osmotic pressure without removing the inhibitory signal. The inhibitor incubation time could be controlled down to a few seconds, as opposed to the previously developed three-inlet microfluidic chamber [
7], where the cells had to be pre-treated with the Hog1 inhibitor prior to being introduced to the microfluidic chamber. The temporal control of the inhibitor pre-treatment in this previous chamber was very poor and the mean pre-incubation time was 29 ± 13 min (see Supplementary Information, Section S2, Figures S2–S4). In this approach, incubations times ranging from 0 to 20 min were investigated.
2.8. Imaging and Analysis
Exposures were taken every 30 s for 5 min; every minute for 10 min, every other minute for yet another 10 min and every tenth minute for 20 min. In order to capture the Hog1 dynamics while minimizing the bleaching of the fluorophores, the exposures were less frequent as the measurement progressed. The acquiring of the images was performed using the highest level of the attenuator of the EL6000 mercury metal halide bulb, in order for the fluorescent intensity results to be comparable with earlier published single-cell measurements [
7]. In order to reduce the photo-bleaching rate, the intensity of the excitation light was kept to a minimum throughout the time-lapse imaging. However, when Hog1-GFP is concentrated to the nucleus, the total bleaching is likely to be faster than when the reporter protein is distributed in the cytosol [
35]. The control cells are clearly distinguishable from the Hog1-GFP cells during analysis, by their location and GFP intensity.
For each time point during the time-lapse imaging, an axial stack of seven optical sections with an internal distance of 0.8 μm was acquired for bright field, GFP and mCherry respectively [
24]. Every image sequence contained 21 photos (3 × 7 photos) per time point, and the maximum imaging frequency was two image sequences per minute. In total, 609 images were analyzed for each experiment. The fluorescence images show the Hog1-GFP/Msn2-GFP and Nrd1-mCherry (a fluorescently marked protein restricted to the nucleus) intensities in every time point. In order to interpret the migration of Hog1-GFP, the exact locations of the cell wall and the nuclear membrane had to be known. This information was retrieved from the outline of the cell contours from a bright field image and the contours of the Nrd1-mCherry intensity, respectively.
The GFP fluorescence intensity was used as a measure of the number of Hog1 proteins in a subcellular location. The images were analyzed using CellStress, an open source image-analysis software for single-cell analysis developed by Smedh
et al. [
36], and Cellstat. The software automatically identifies optical section where the nucleus is in focus (focal plane), for each individual cell. The mean GFP fluorescence intensity of the cytosol for this particular section is automatically calculated. CellStress uses both the GFP fluorescence images and the bright field images for calculating the ratio (
R) between the intensity of the cytosol of the cell focal plane and the nuclear subsection of the cocal plane. The fraction R is therefore used as an indicator of protein migration.
4. Conclusions
In this article, a single-cell study of a selective Hog1 kinase inhibitor [
22] was presented using a four-channel microfluidic system, enabling multiple signal inputs (
i.e., the Hog1 kinase inhibitor and sorbitol) to a yeast signal transduction pathway and for studying the subsequent dynamic single-cell responses during time-lapse imaging. The presence or absence of a cellular response—activation of the HOG signaling pathway—was monitored by imaging the nuclear translocation of the cytosolic MAPK, Hog1 (fluorescently tagged with GFP) on a single-cell level. This single-cell setup enables cells to be individually traced during the full time period of the experiment. The fourth channel does not only enable controlled, multiple sequential treatments of the cells, it also facilitates a controlled introduction of two different cell strains (e.g., control cells, a mutant or cells treated differently), side by side within the same cell array. Multiple cell strains within the same experiment is a unique feature which is a necessity for, as in this case, determining an expected absent cellular response. The control cells within each experiment had their reporter proteins localized to the nuclei after the equivalent treatment, since the signaling pathway of that reporter protein is not affected by the inhibitor. Hence, the inclusion of these cells further validated the appropriateness of the setup. The data obtained in four-inlet microfluidic chambers are also validated by comparison to results reported in the literature. Hence, the experimental setup of a four-inlet microfluidic chamber, which allows switching between two treatments, greatly improves the temporal resolution compared to a system where switching between different perturbation agents is not possible [
7].
The main biological conclusions are that a Hog1 inhibitor concentration of 25 µM impaired the nuclear Hog1-GFP localization for treated cells with a maximum effect after ten minutes of treatment (86% inhibition). We have shown that our achieved temporal resolution in the order of seconds was essential in order to determine the most efficient incubation time for Hog1 inhibition. The IC
50-value was established to 180 nM, in comparison to the earlier
in vitro determined value of 7.4 ± 0.41 nM [
22]. In this case, due to single-cell measurements, we can conclude that the Hog1 response is mostly homogenous. In addition, kinase inhibition using our approach is a viable alternative to genetic mutation methods when analyzing cellular pathways, circumventing compensatory mechanisms.
Our setup enables a temporal resolution controlled on the level of seconds, with a microscopy resolution on a sub cellular basis. A temporal resolution in this range proved extremely useful for determining the optimal inhibitor treatment time (of a fixed concentration) to be decided. The automatic setup enables very low inter-experimental variation and the custom made automations will provide the opportunities to elaborate with a removal of either perturbation during measurement. This would be extremely hard—not to say impossible—to accomplish using traditional biological methods.


