
Sub-Micrometer Size Structure Fabrication Using a Conductive Polymer


Abstract
:1. Introduction
2. Experimental Methods
2.1. Aqueous Solution
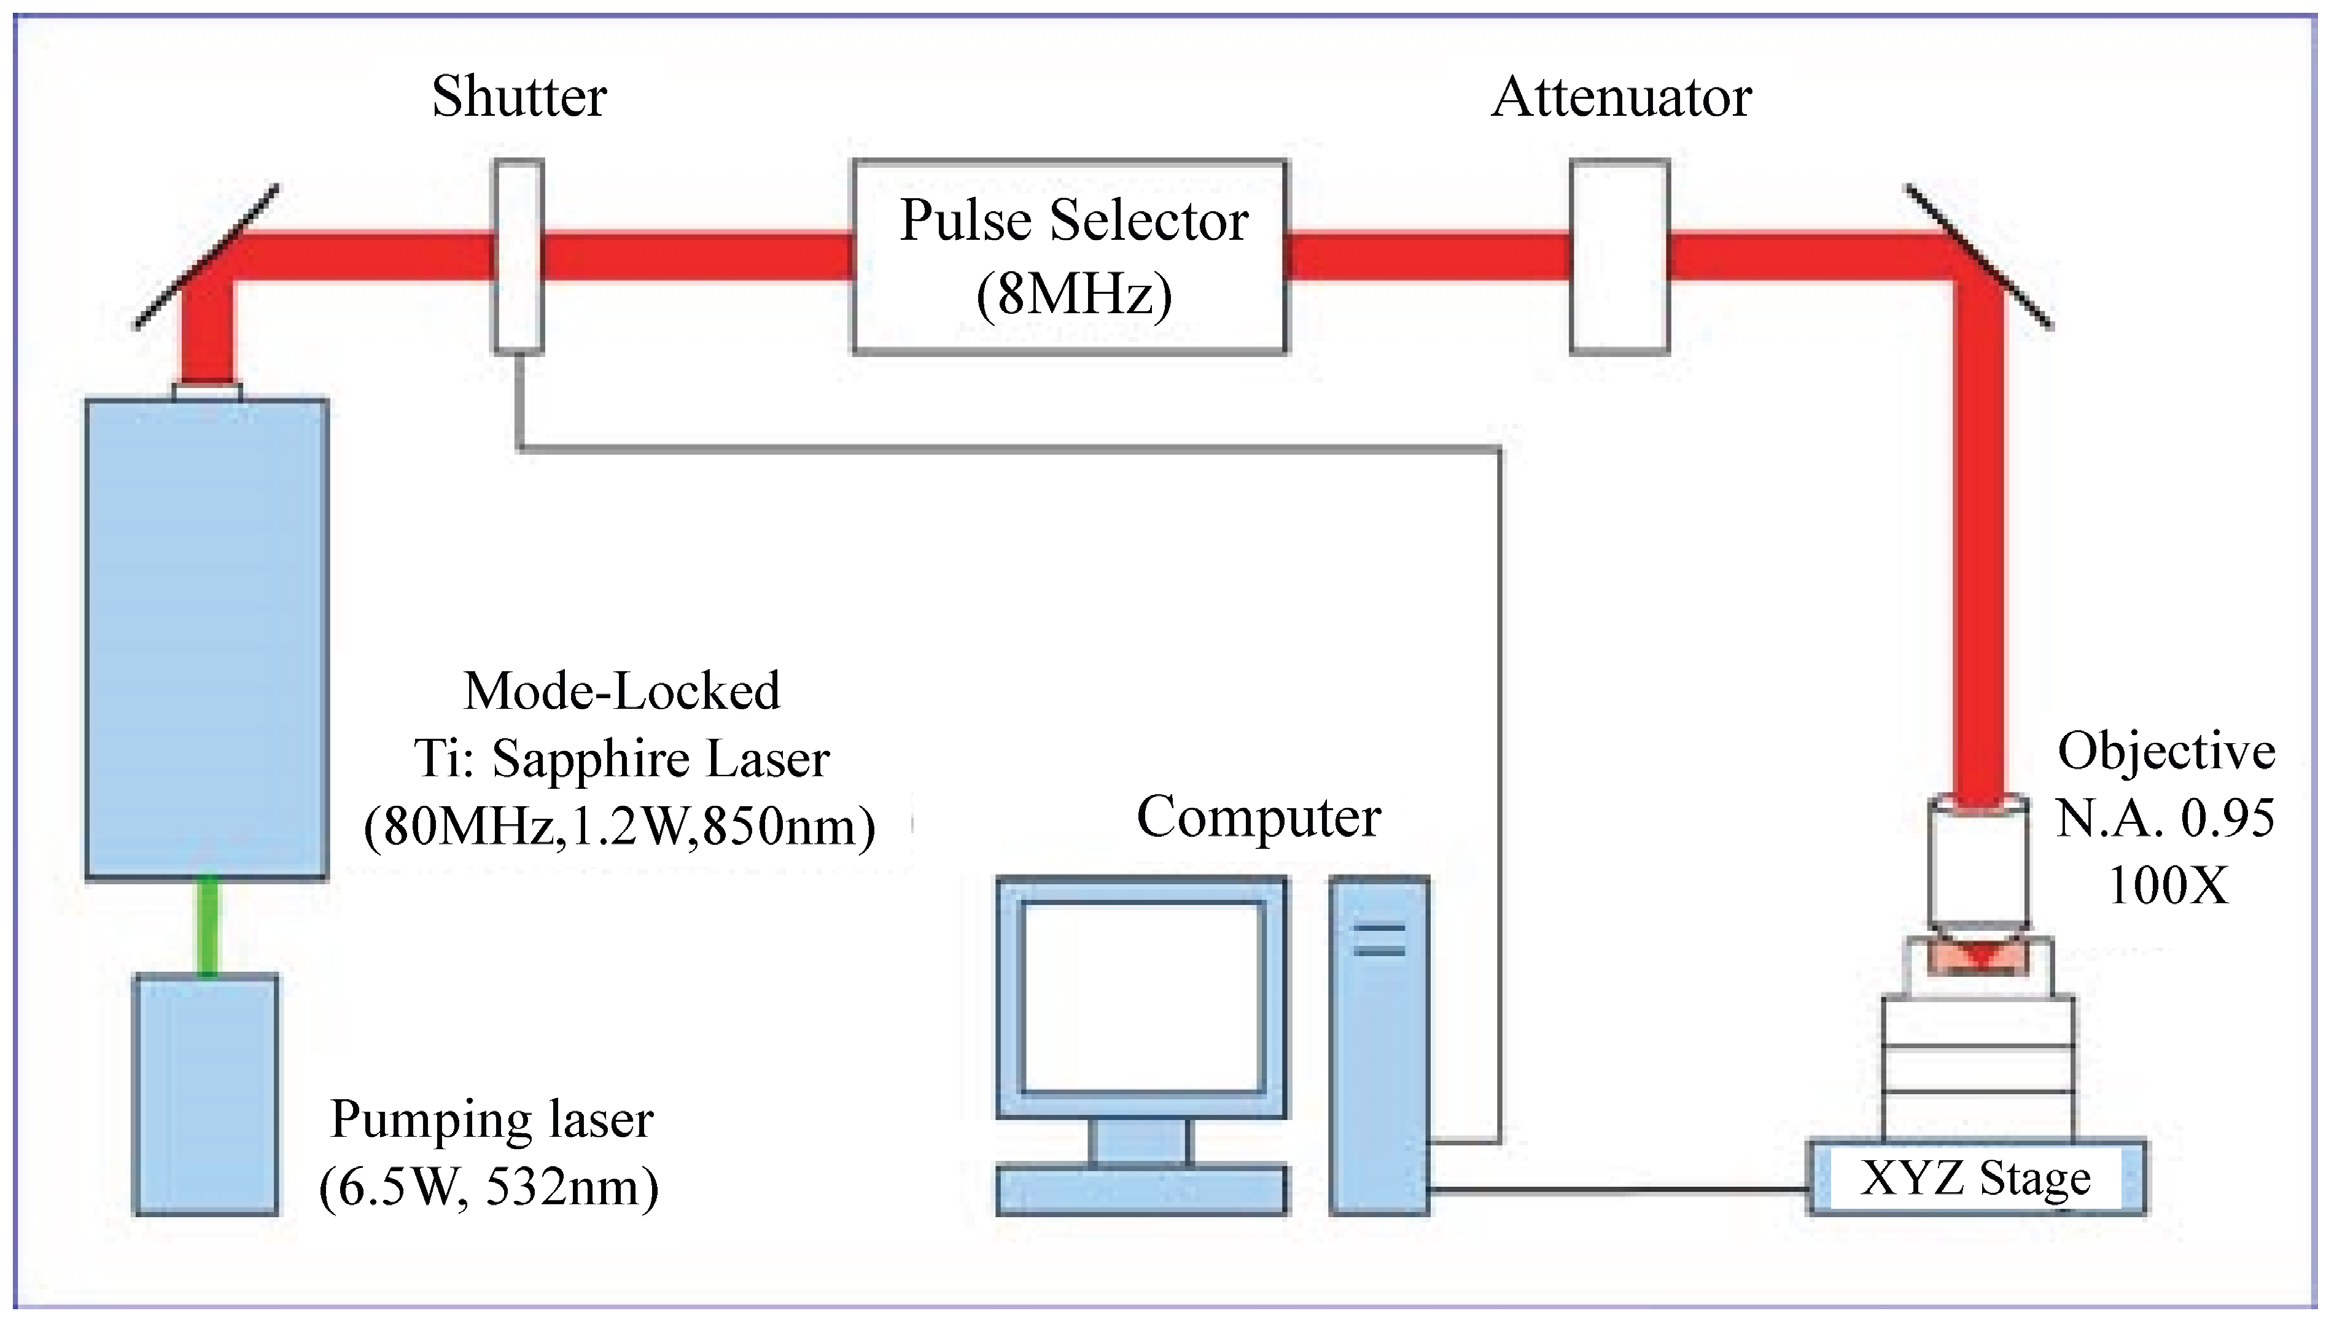
2.2. Stereolithography System

2.3. Fabrication Method
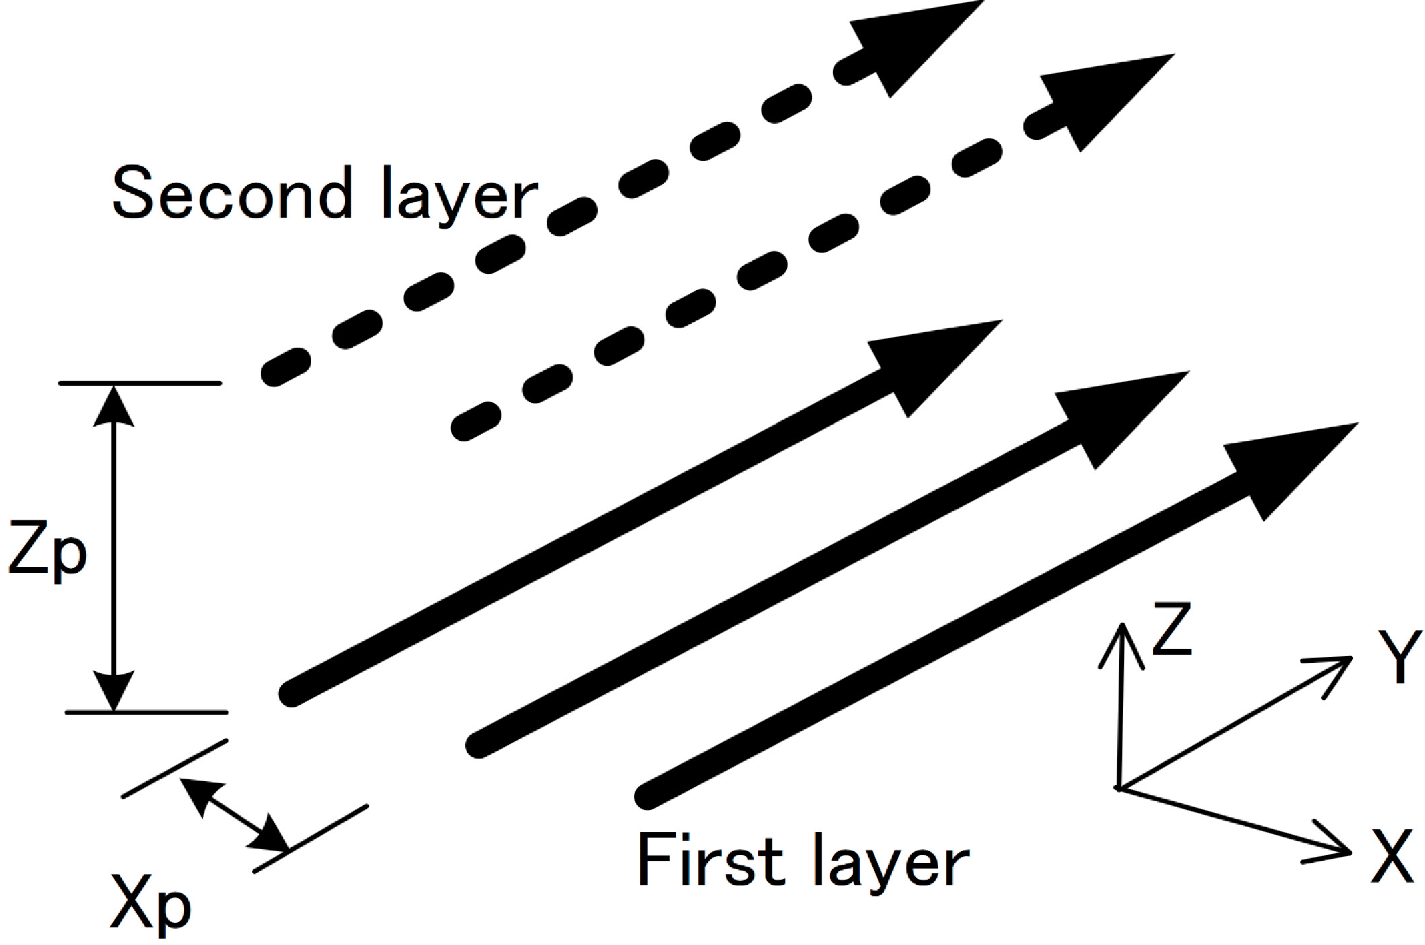
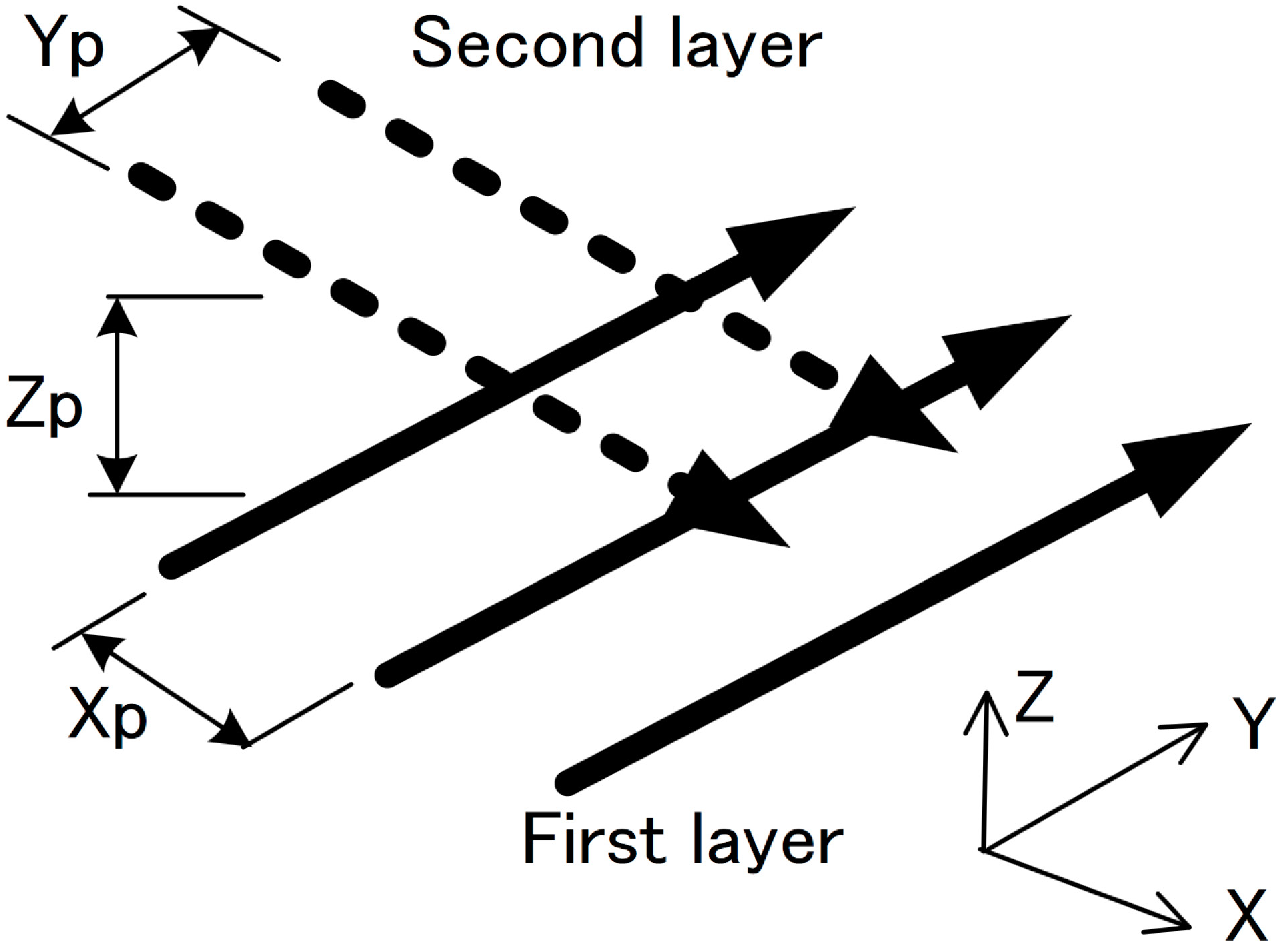
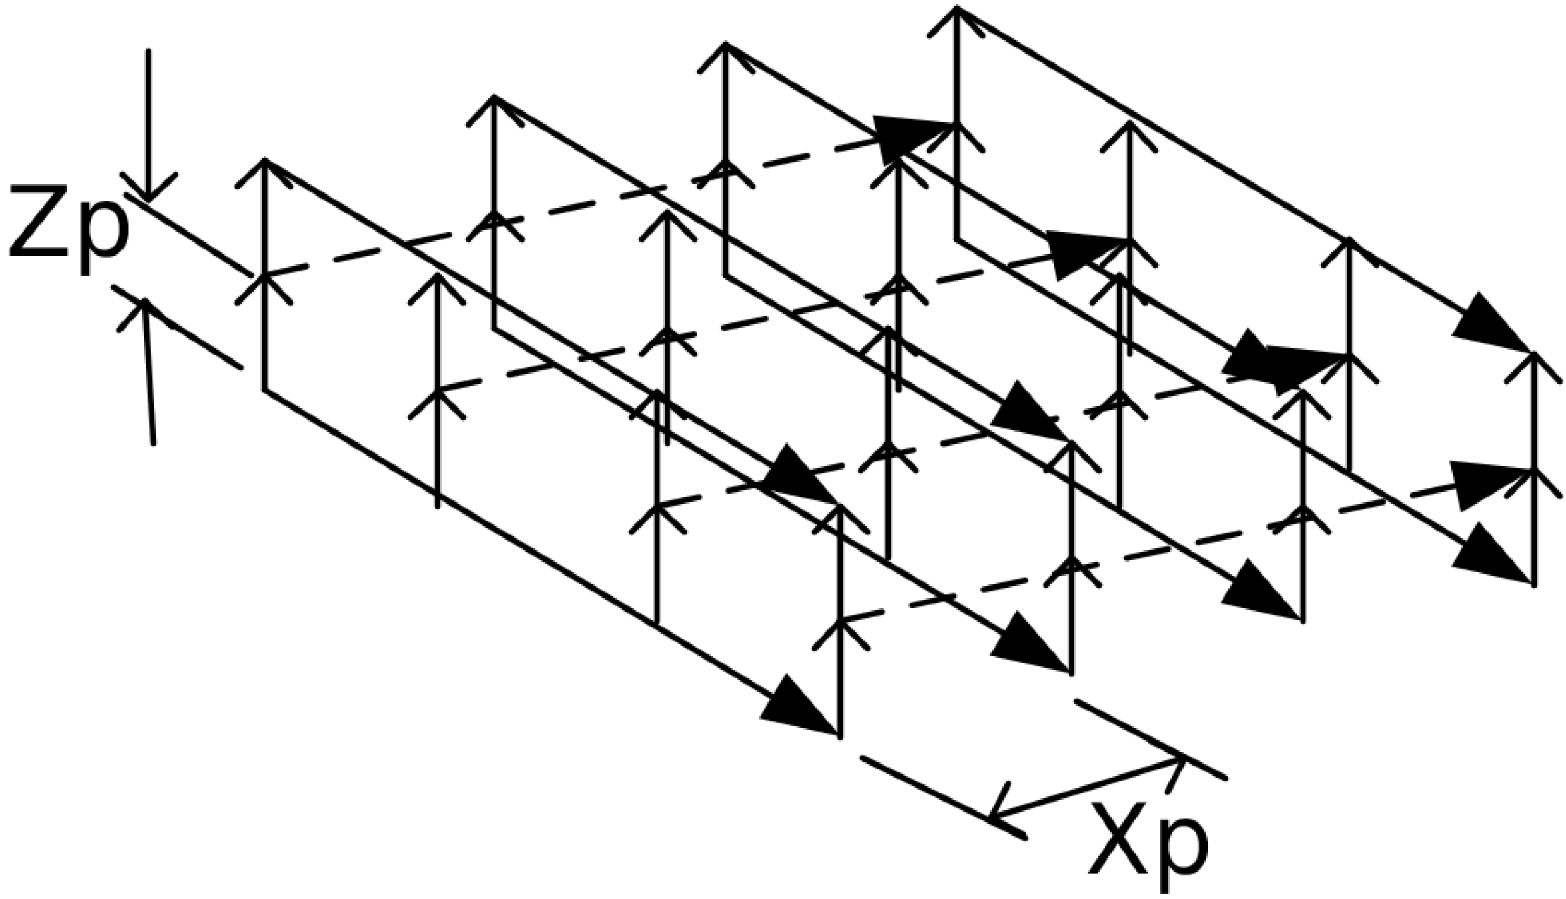
2.3.1. Line SL

2.3.2. Support Method


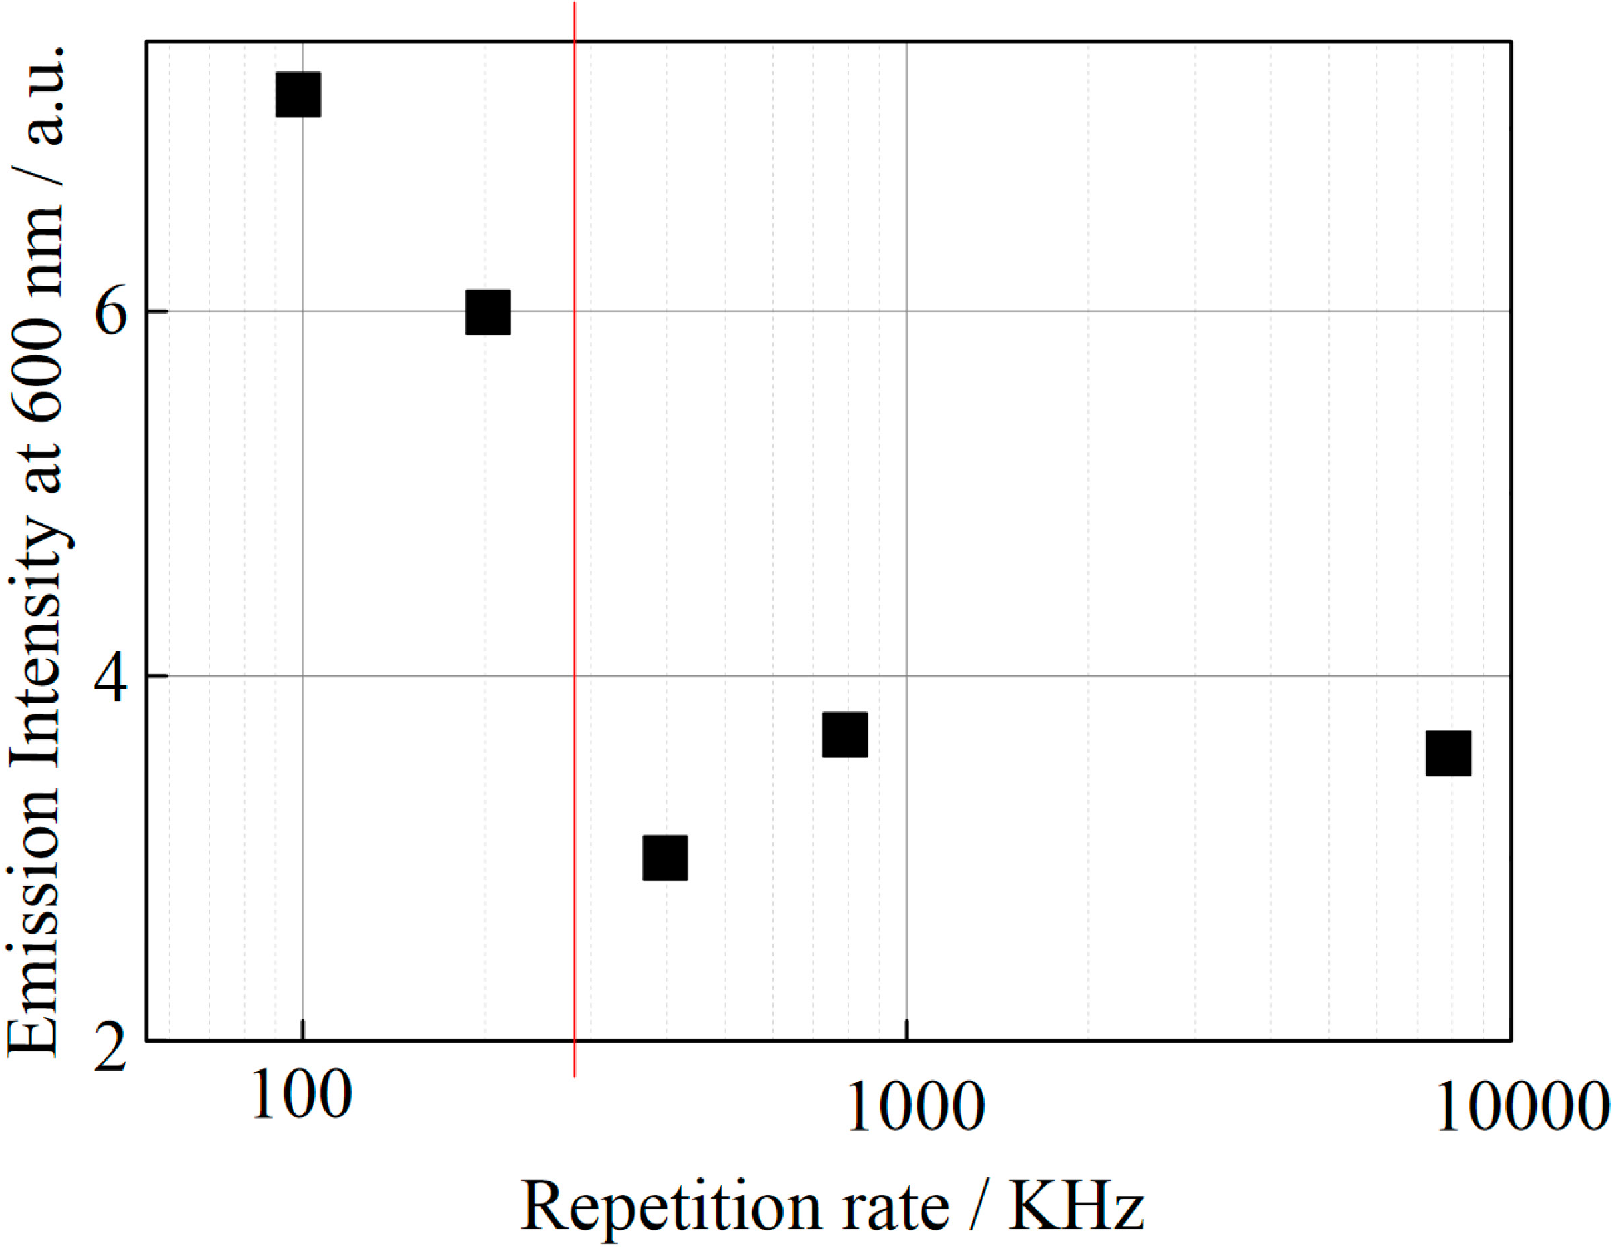
2.3.3. Reduction of the Repetition Rate of a Laser


3. Results
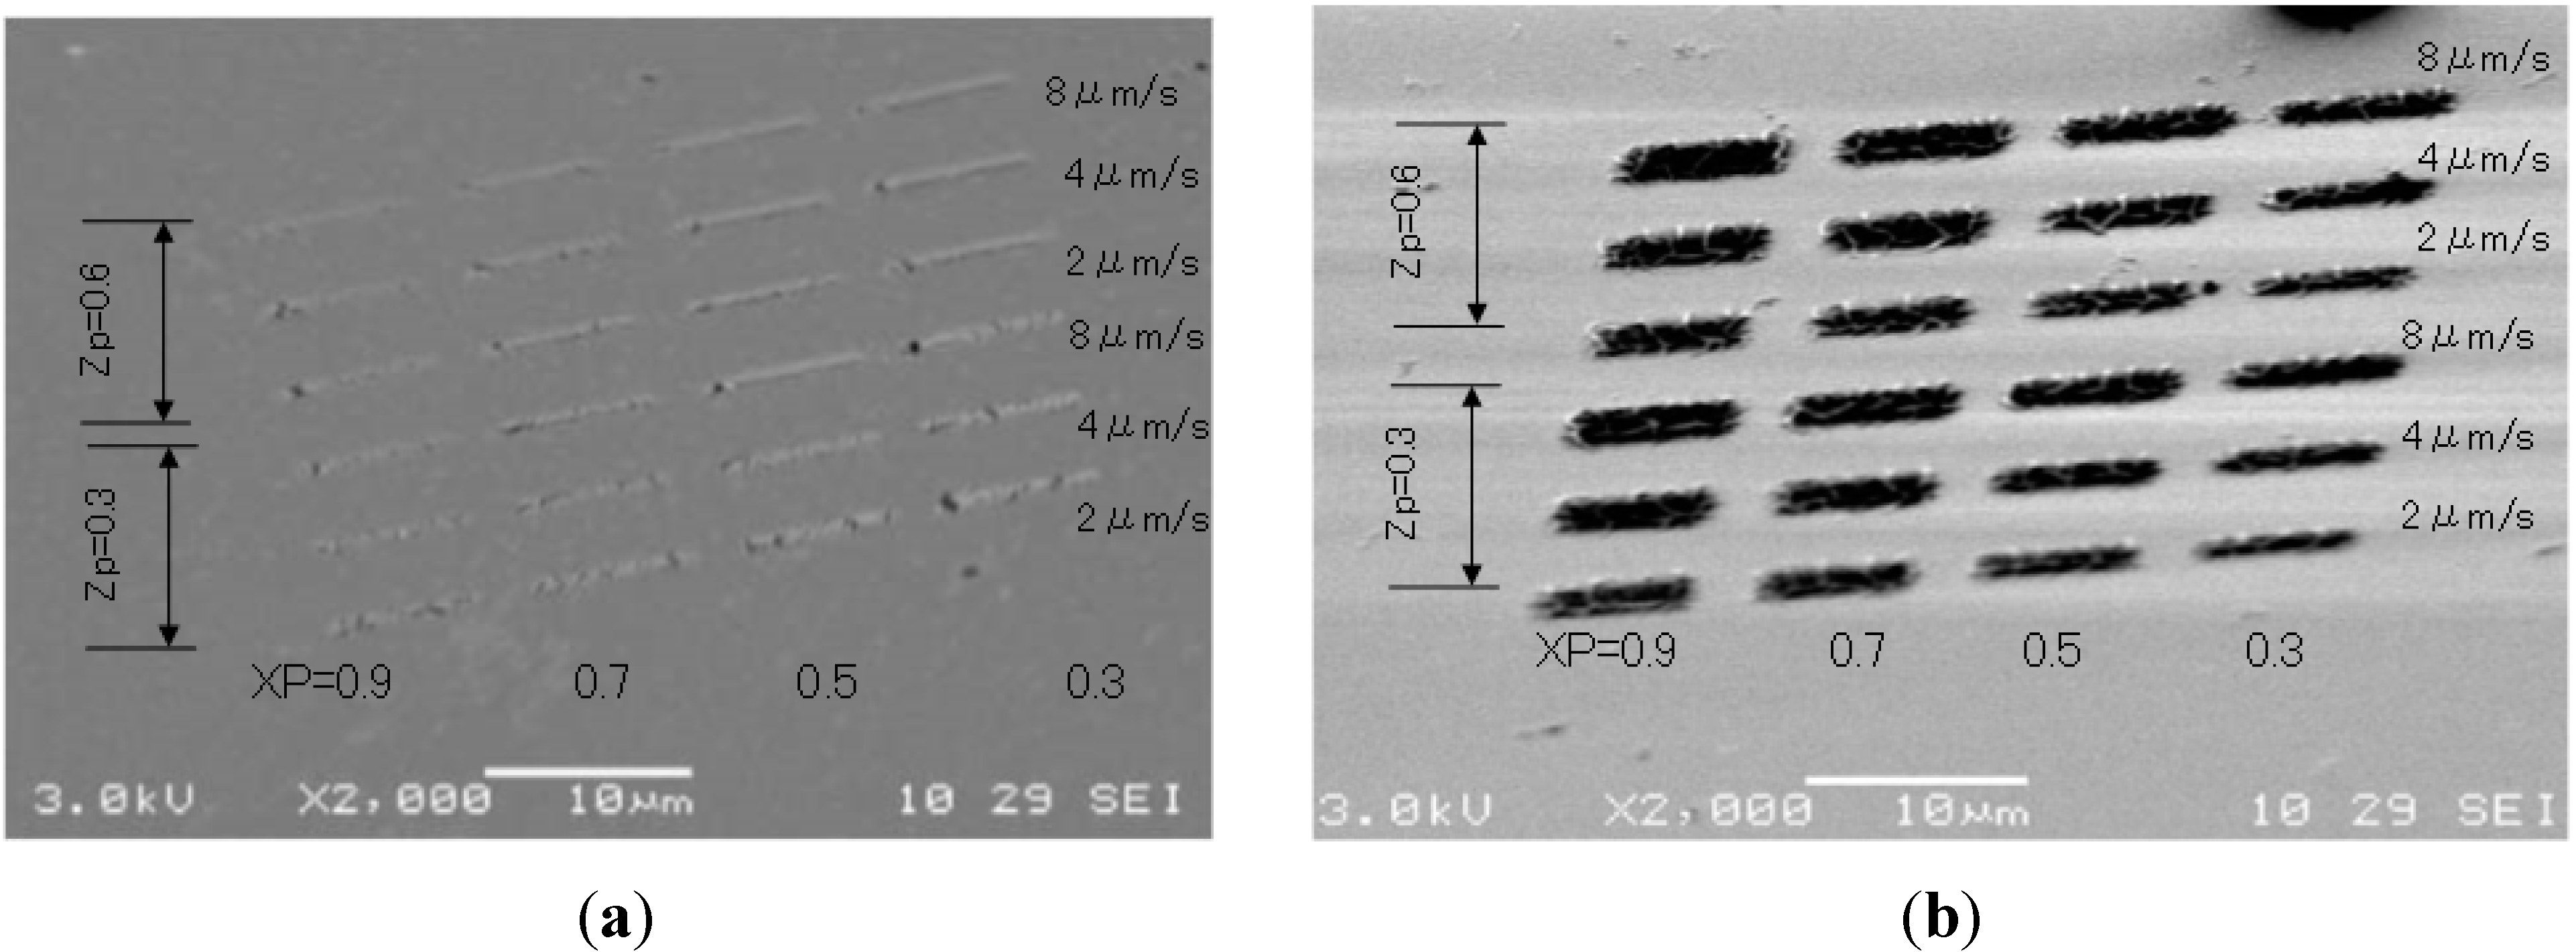
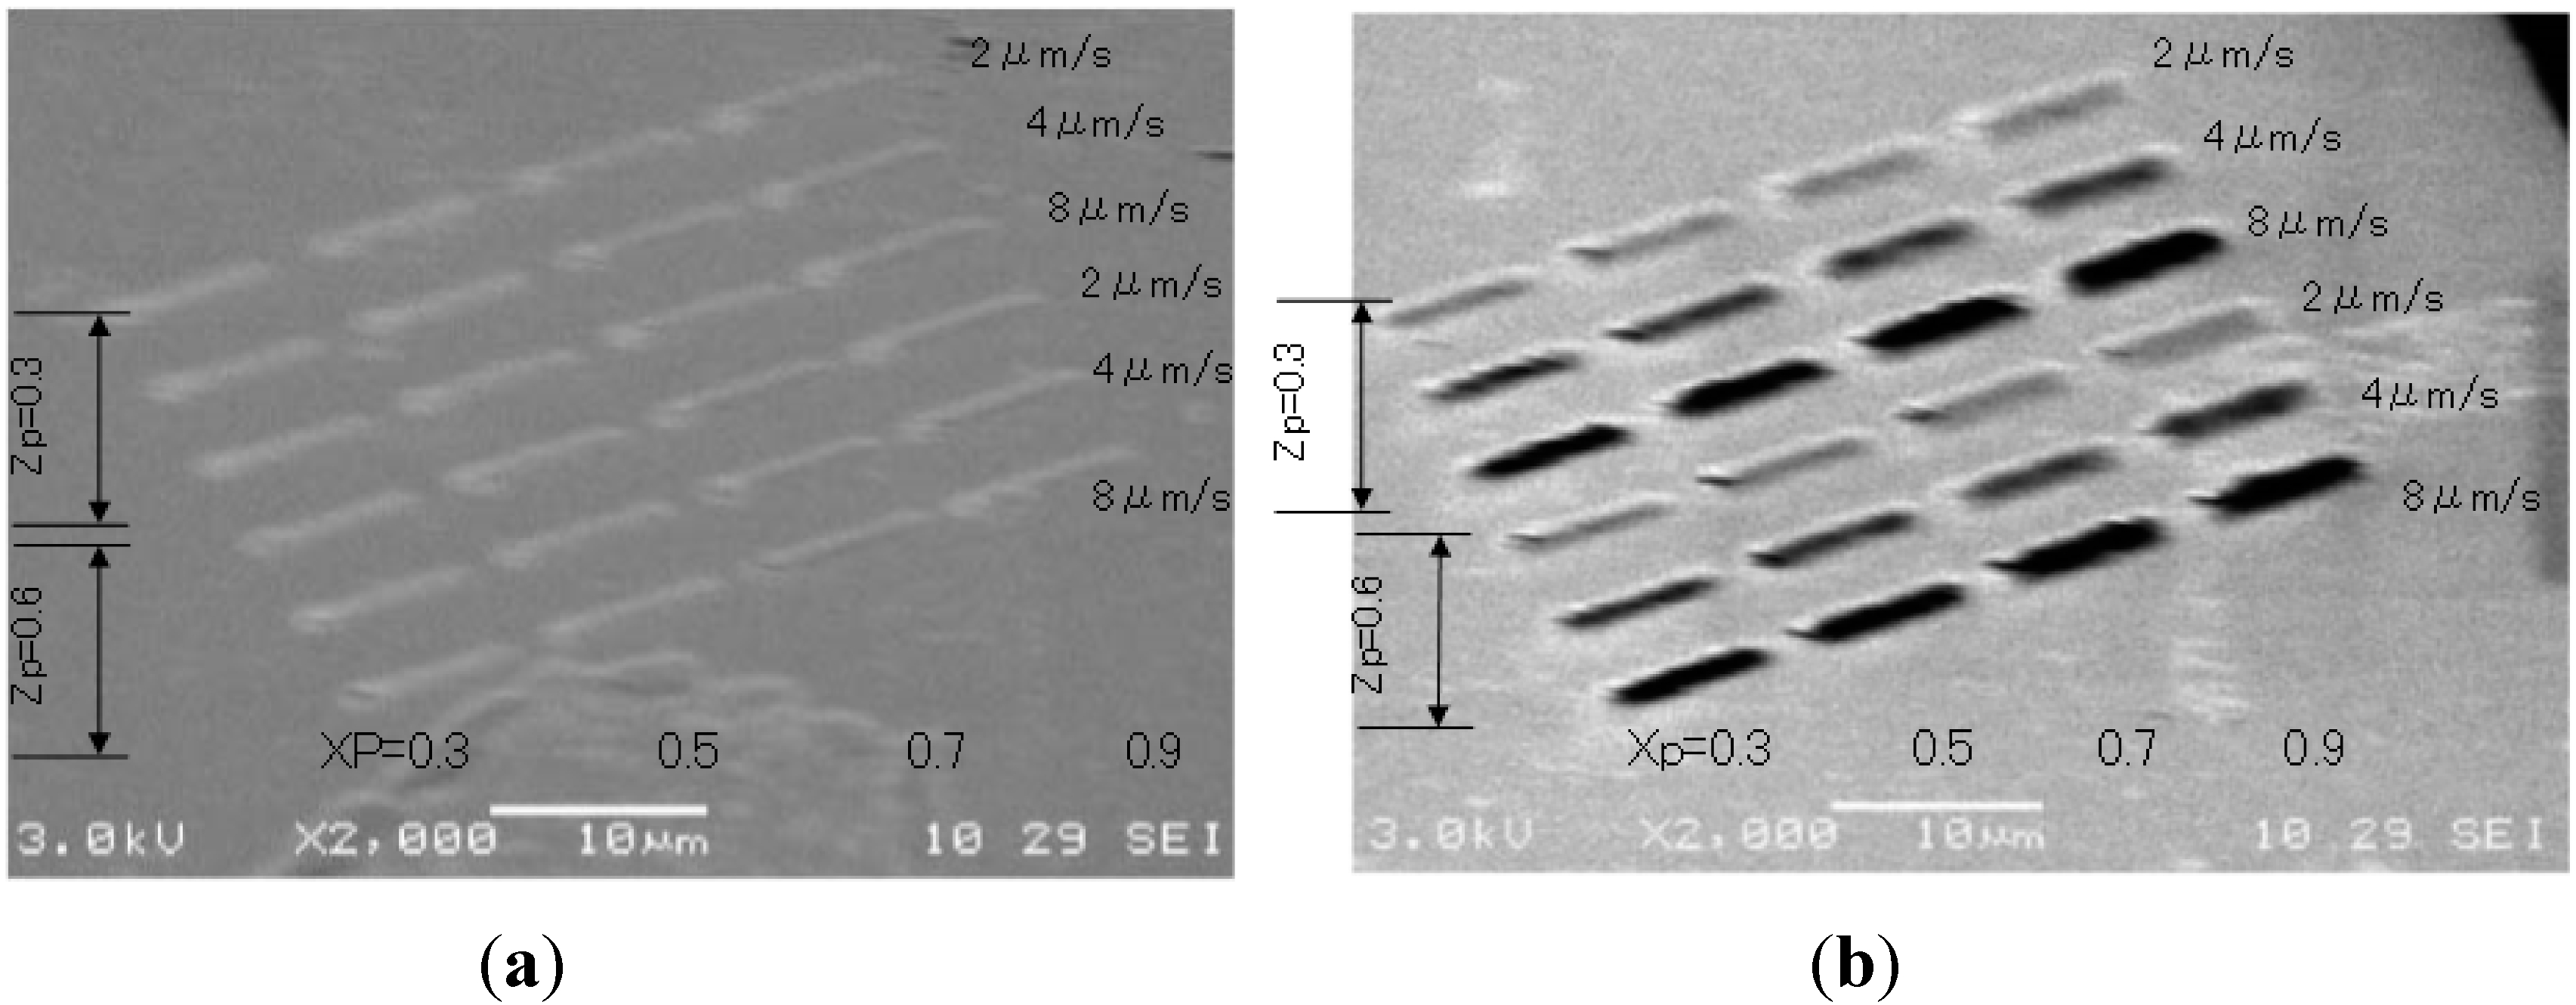
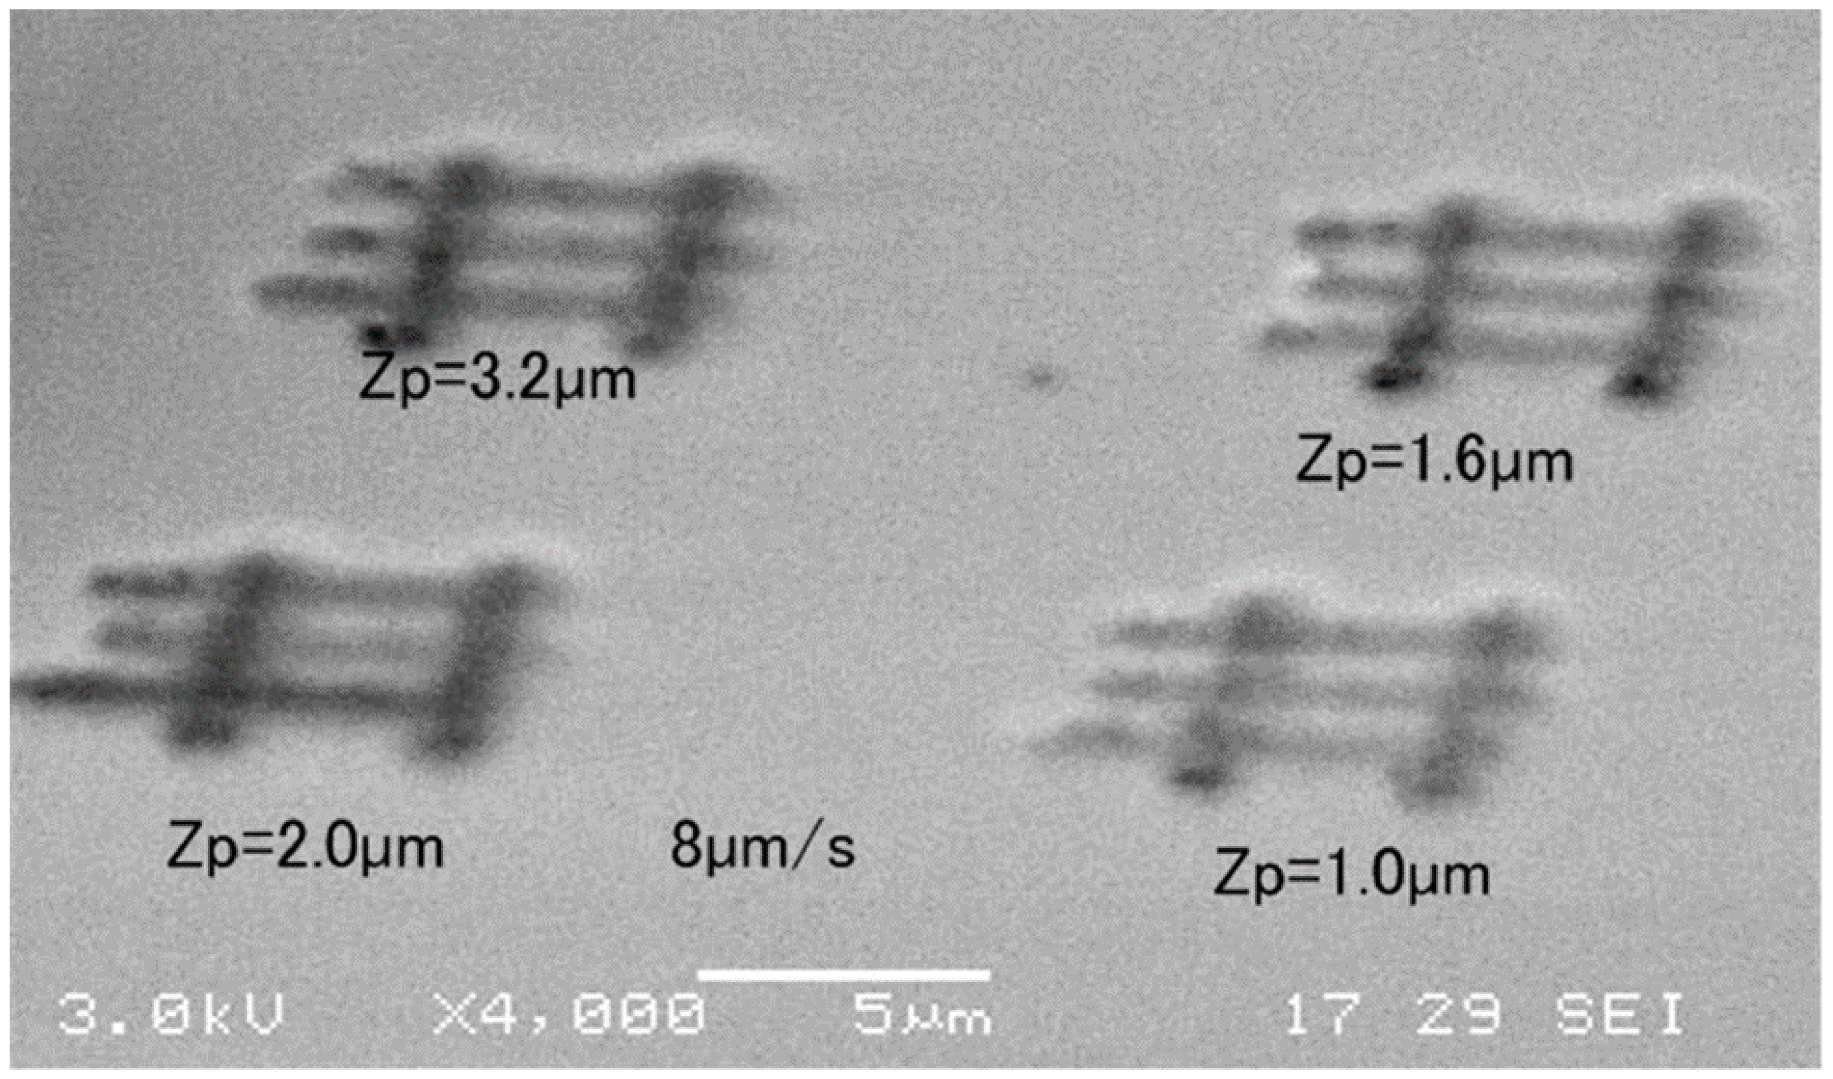
3.1. Line SL

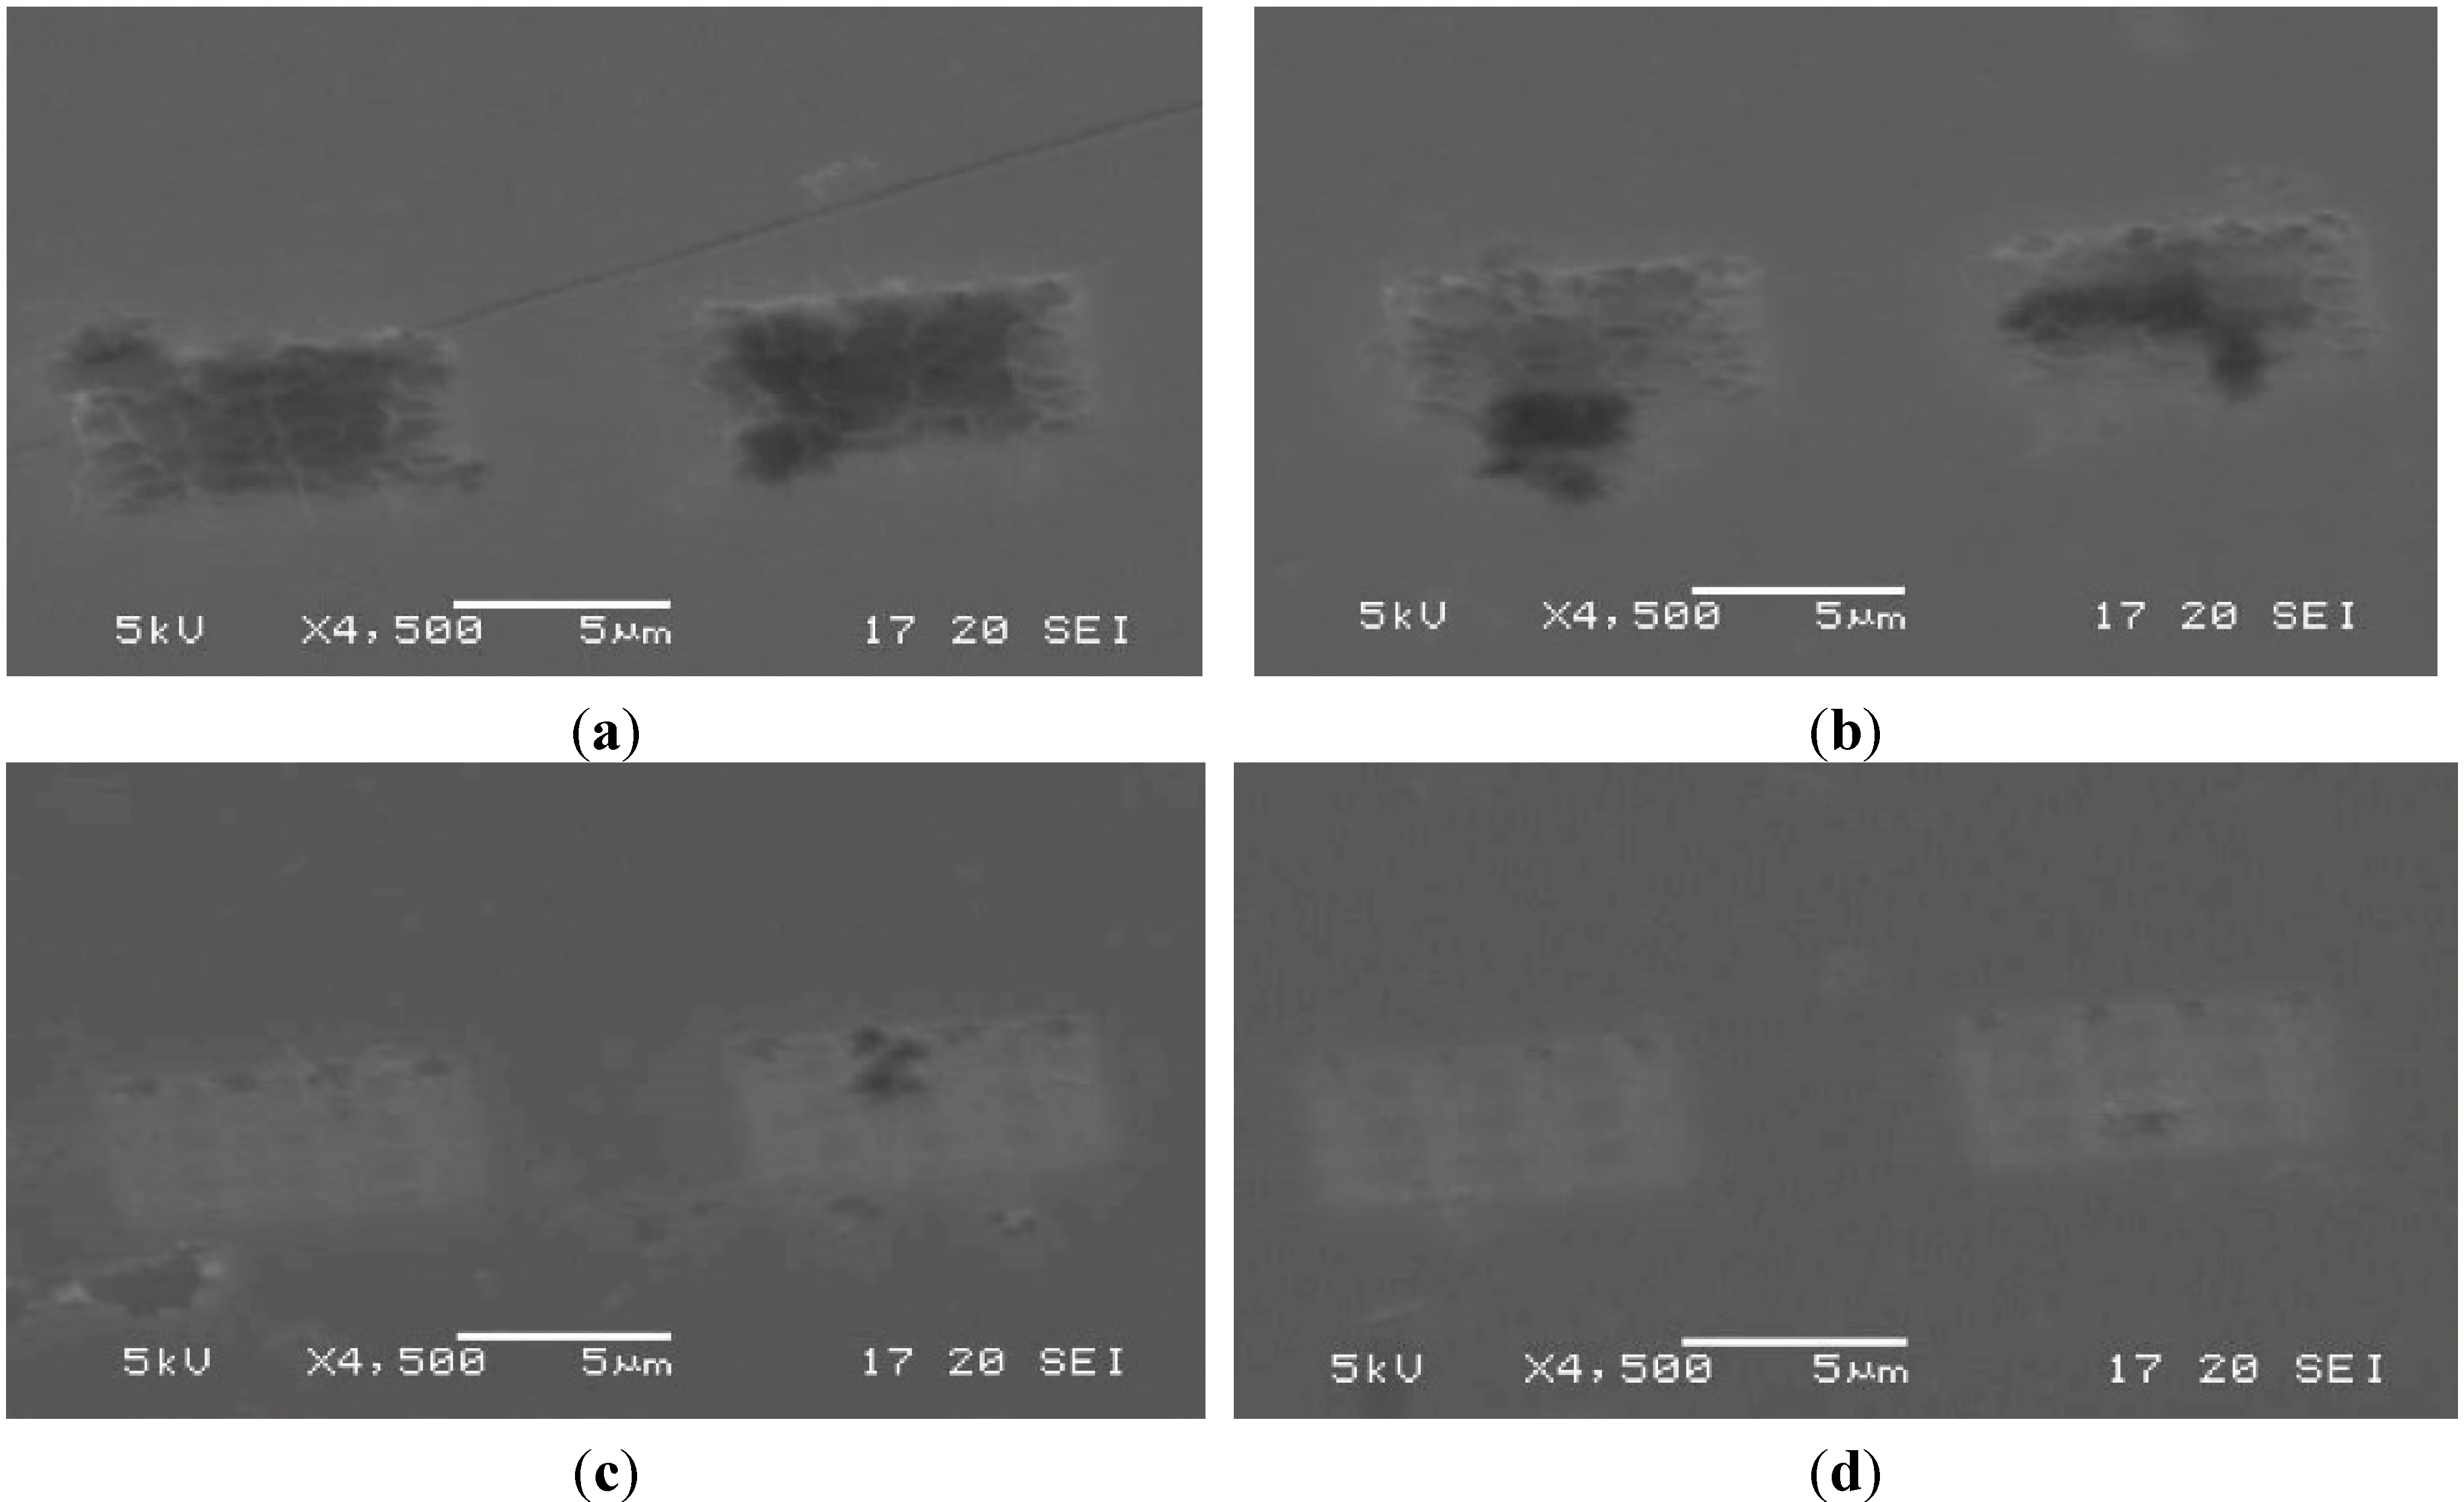
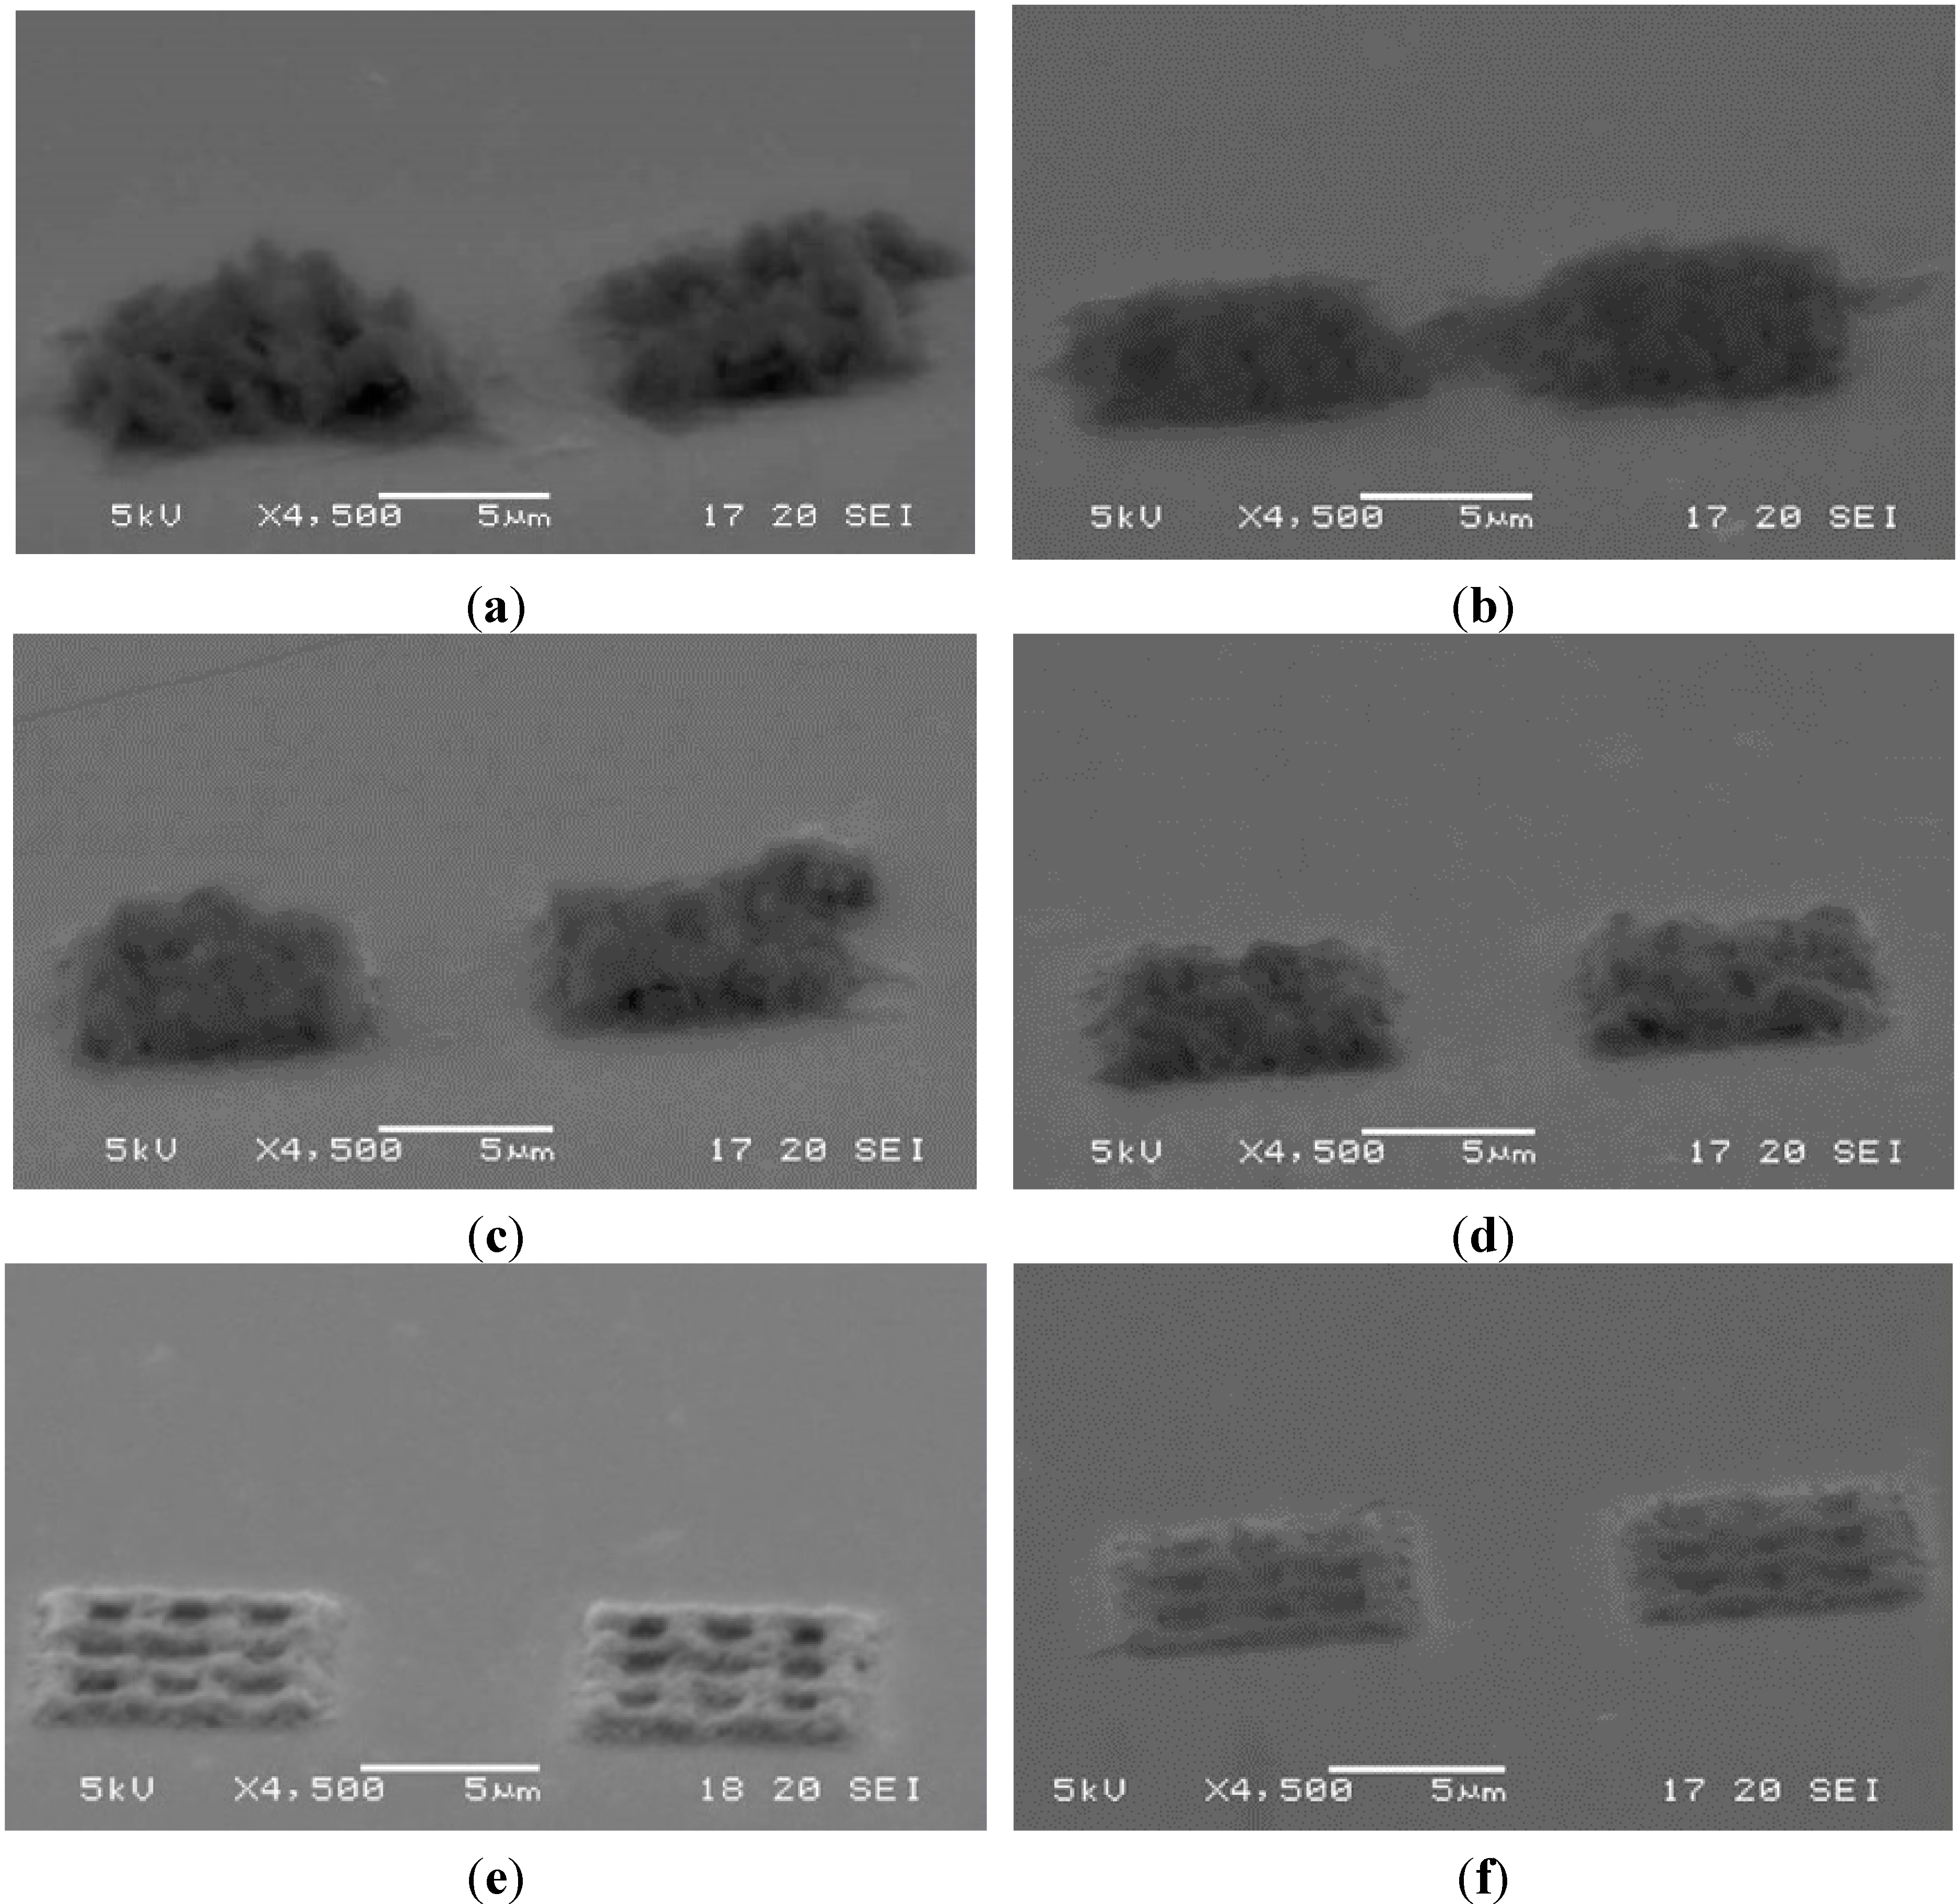
3.2. Support Method
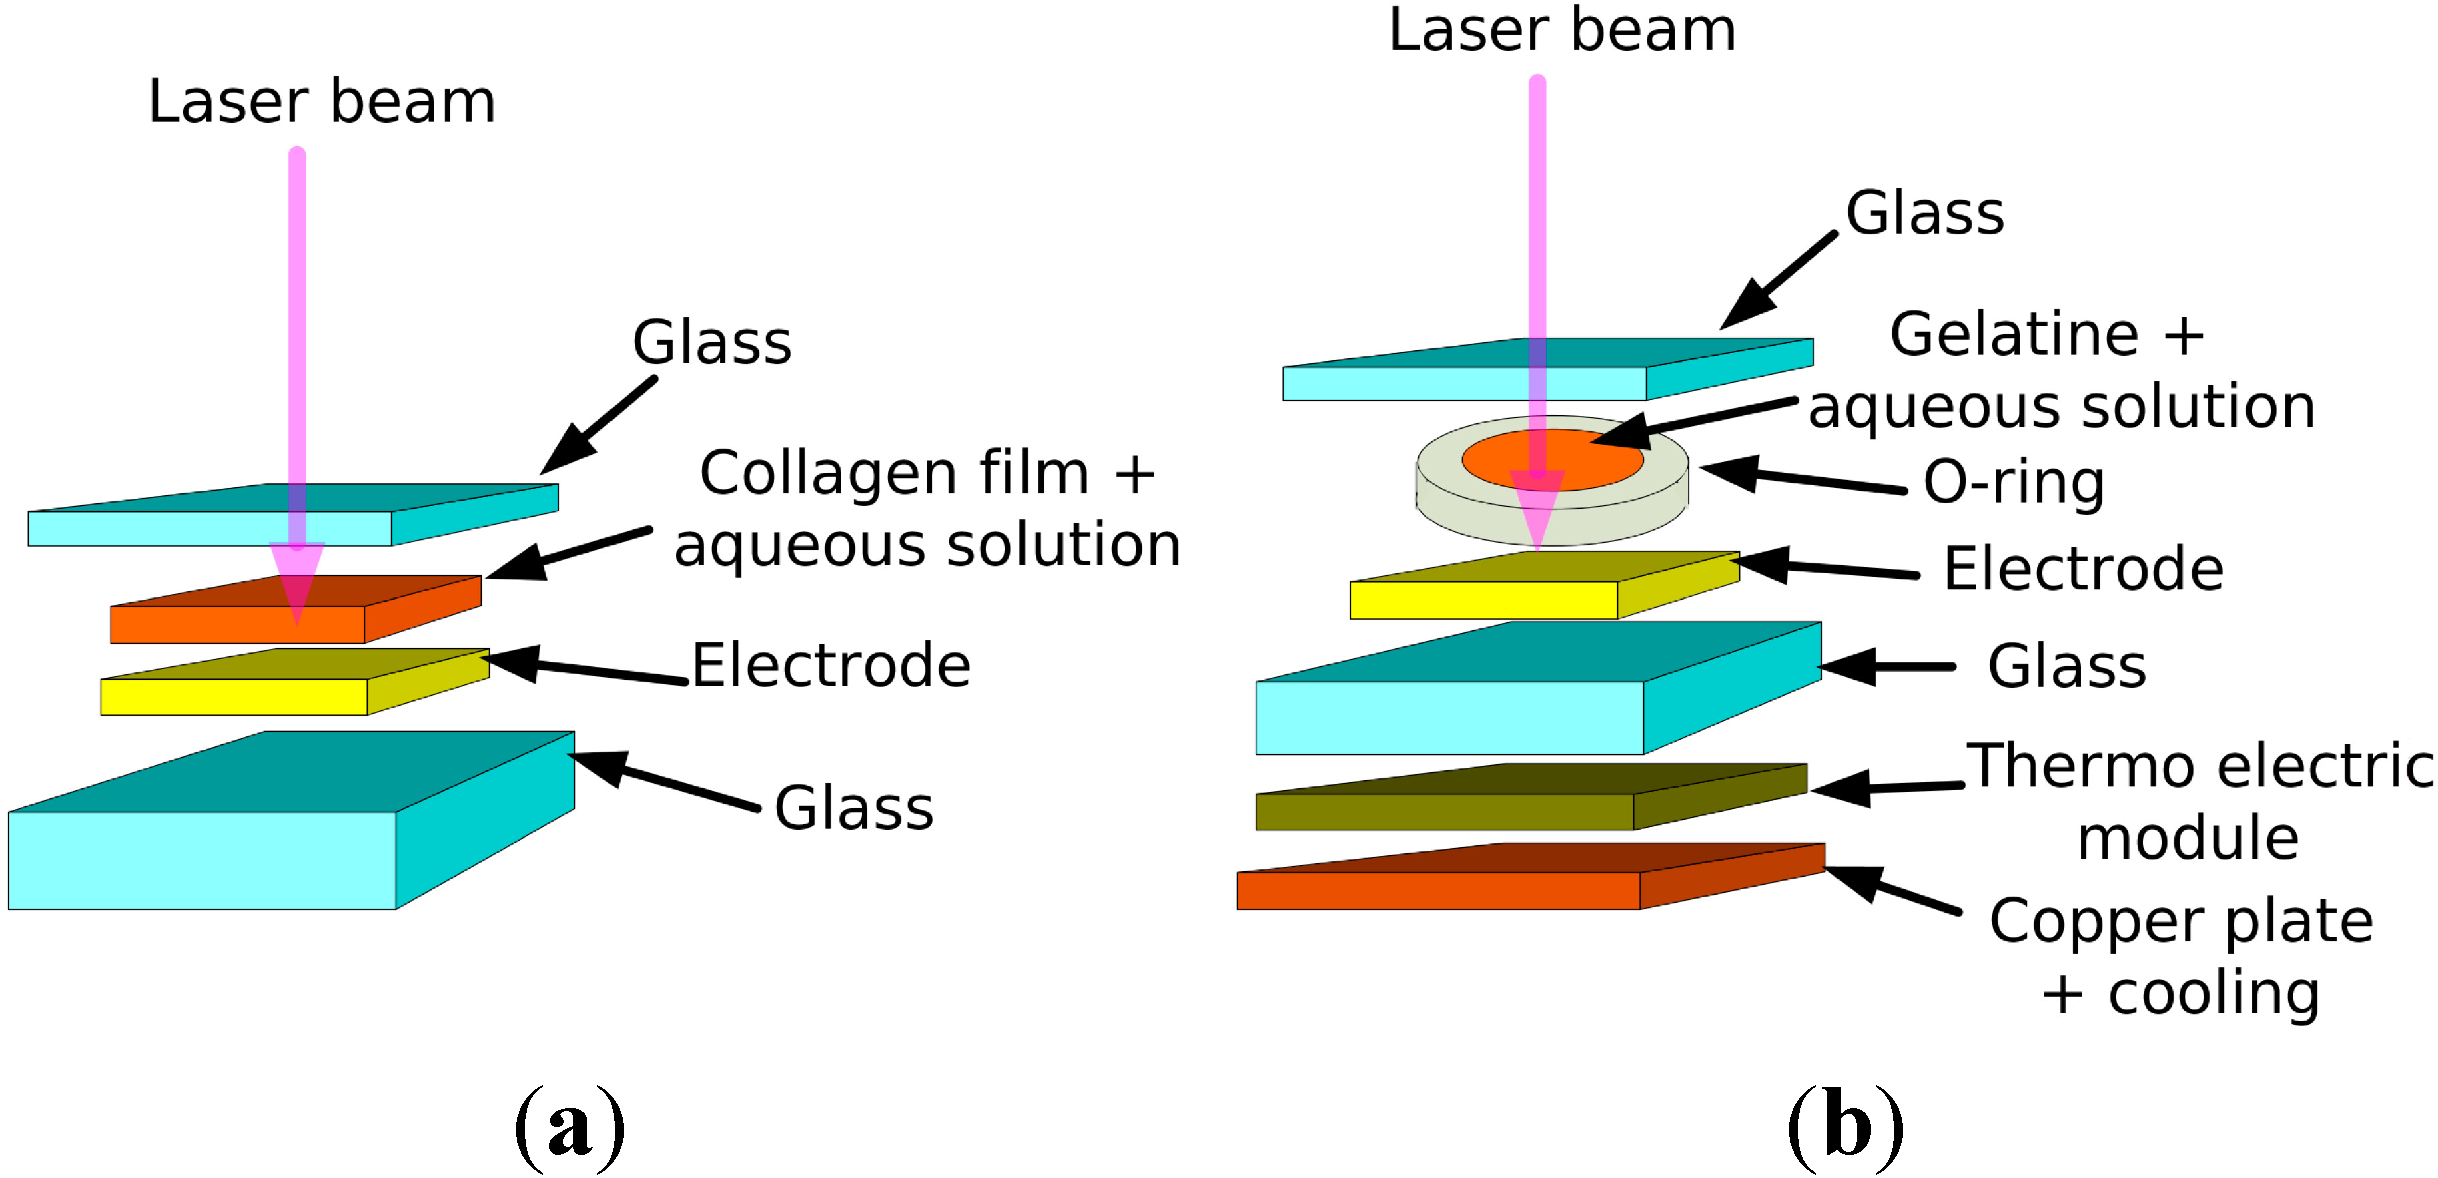
3.2.1. Case of Collagen Film

3.2.2. Case of Gelatine


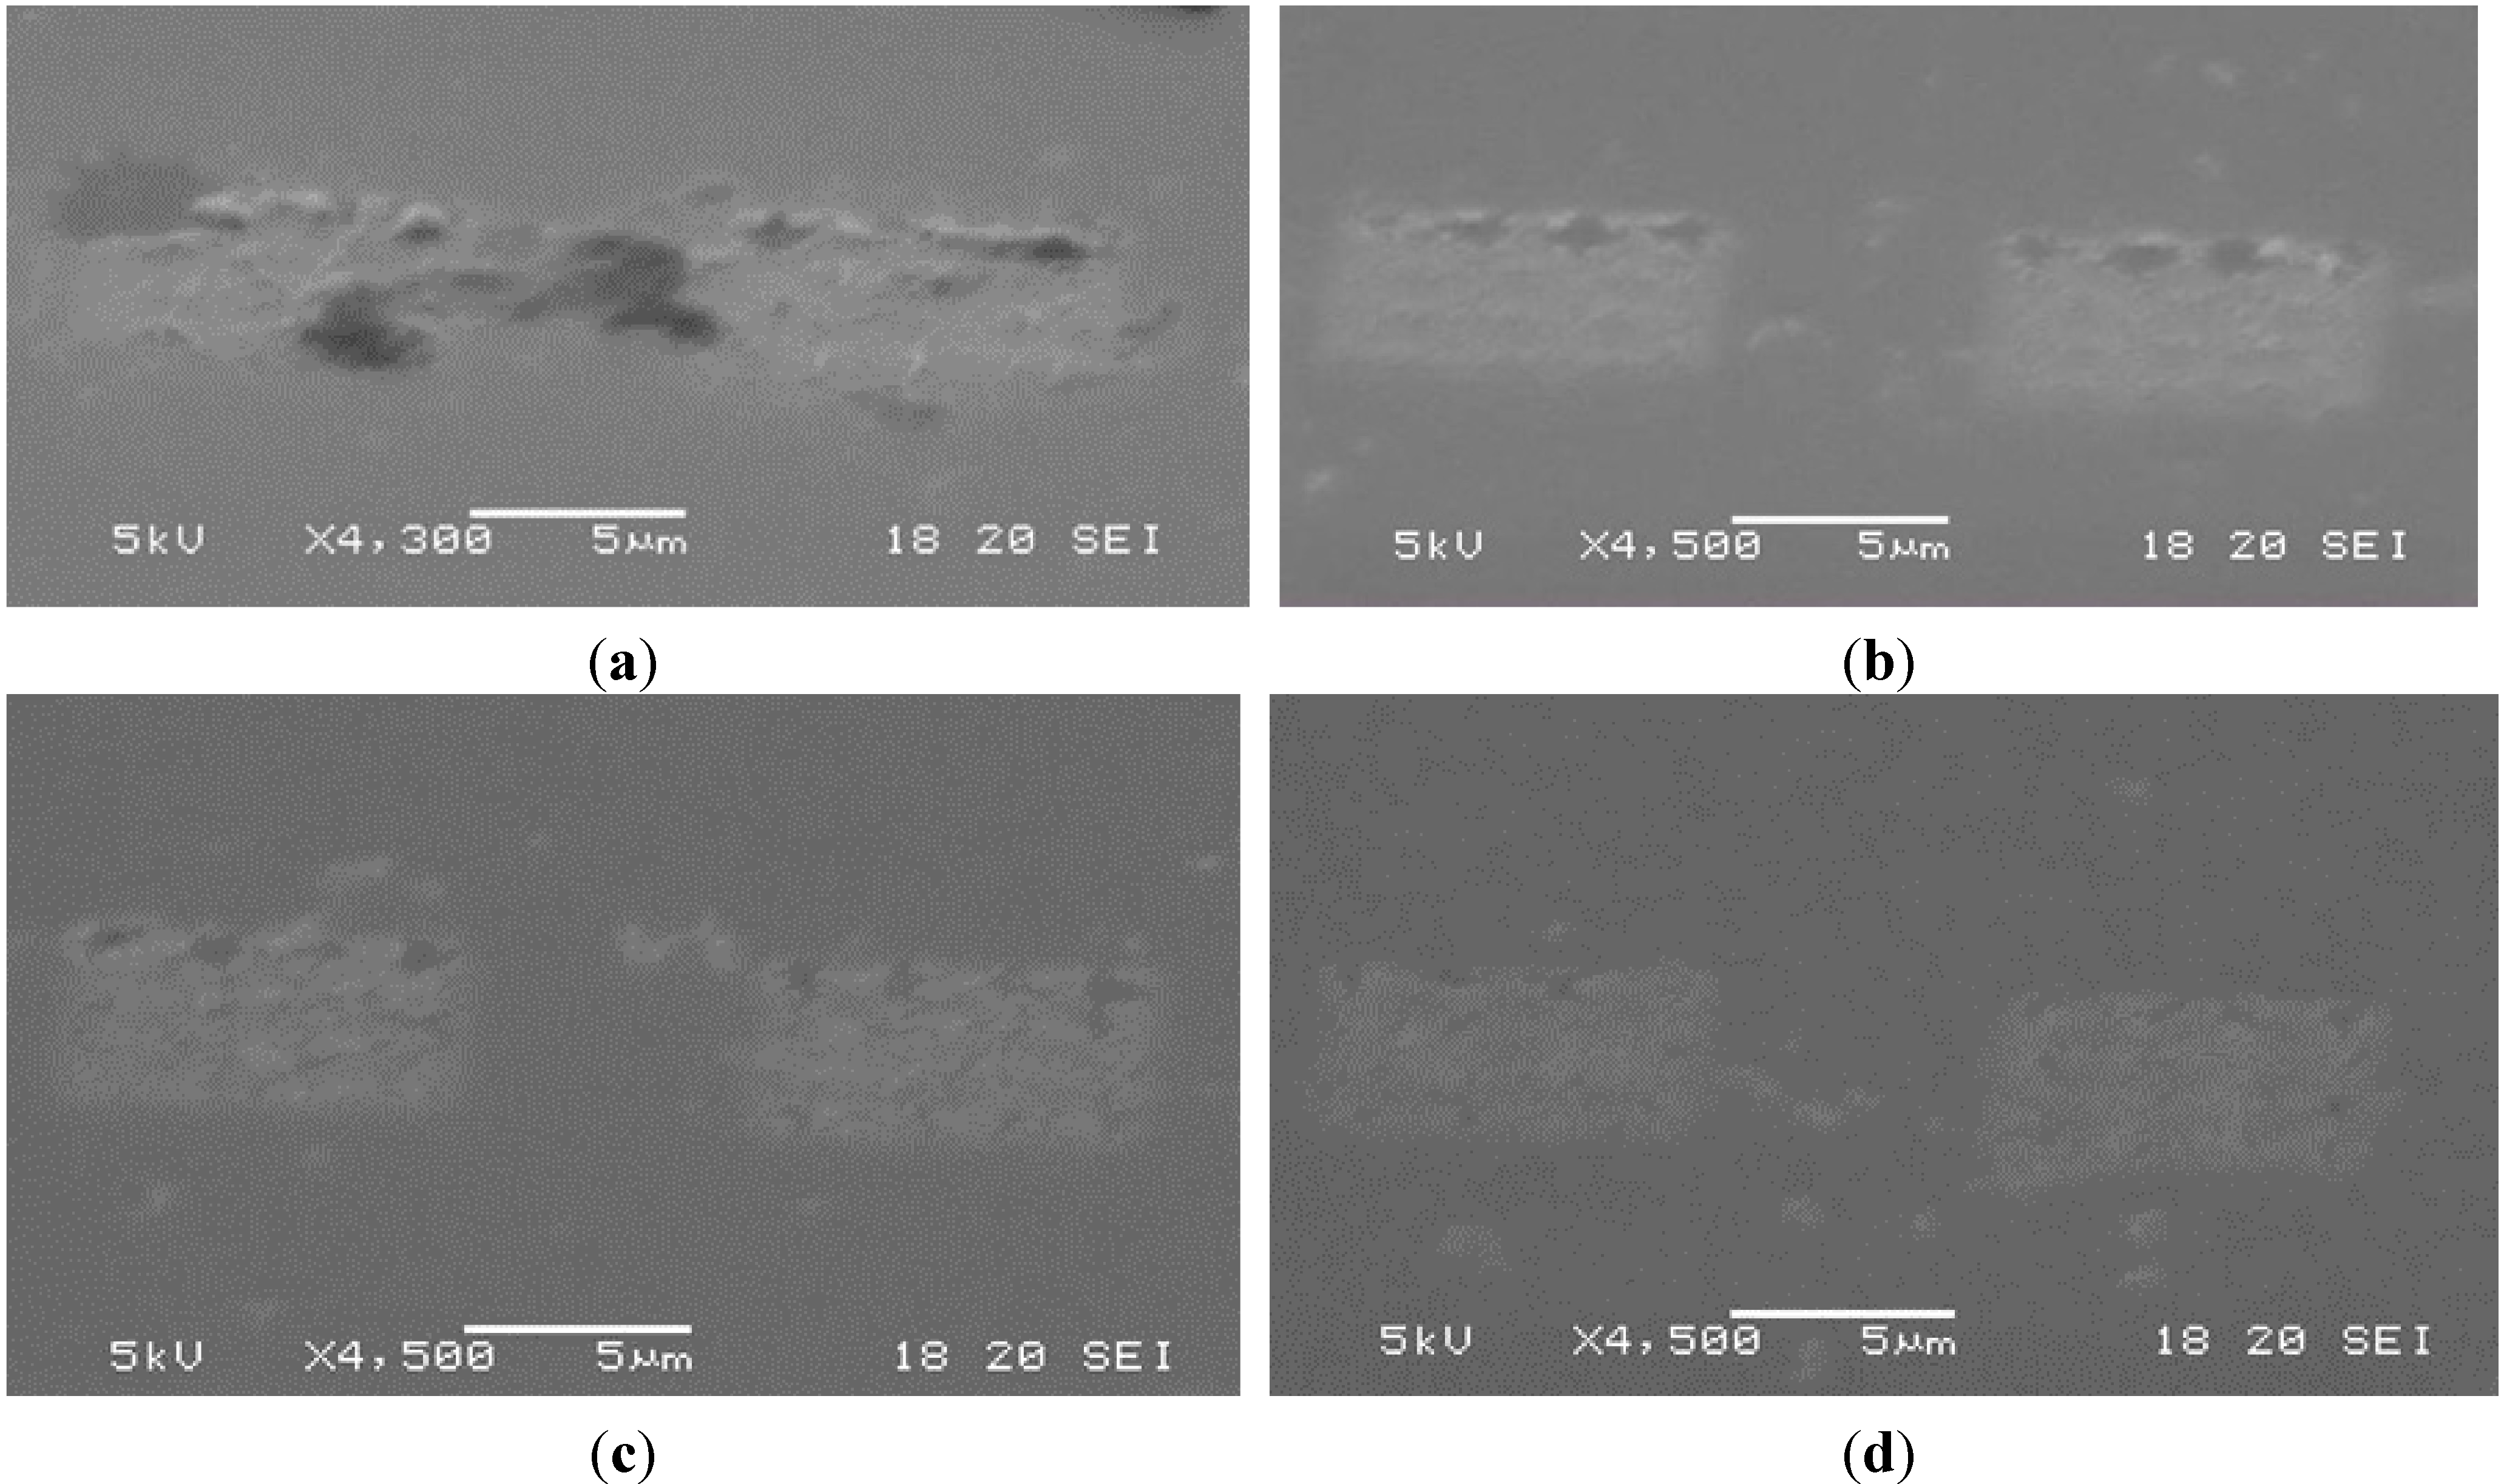
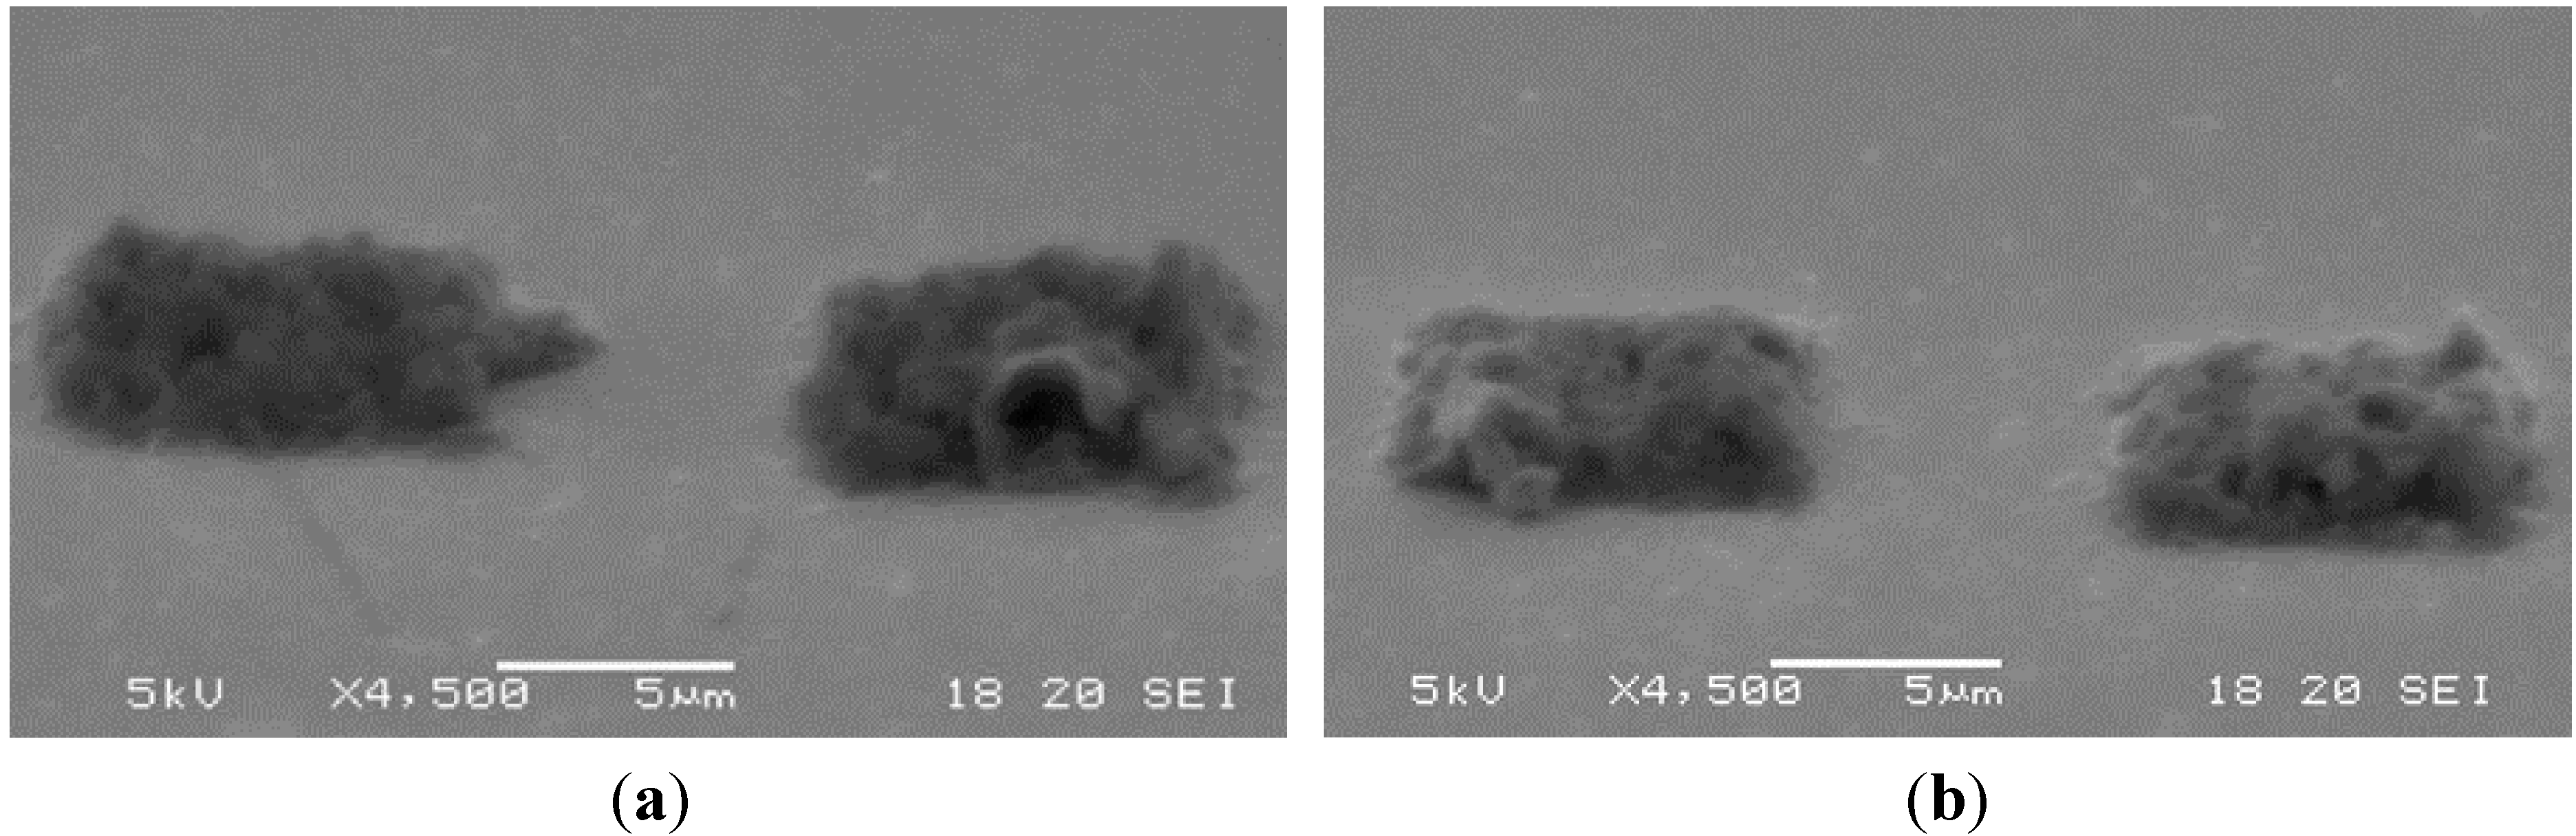
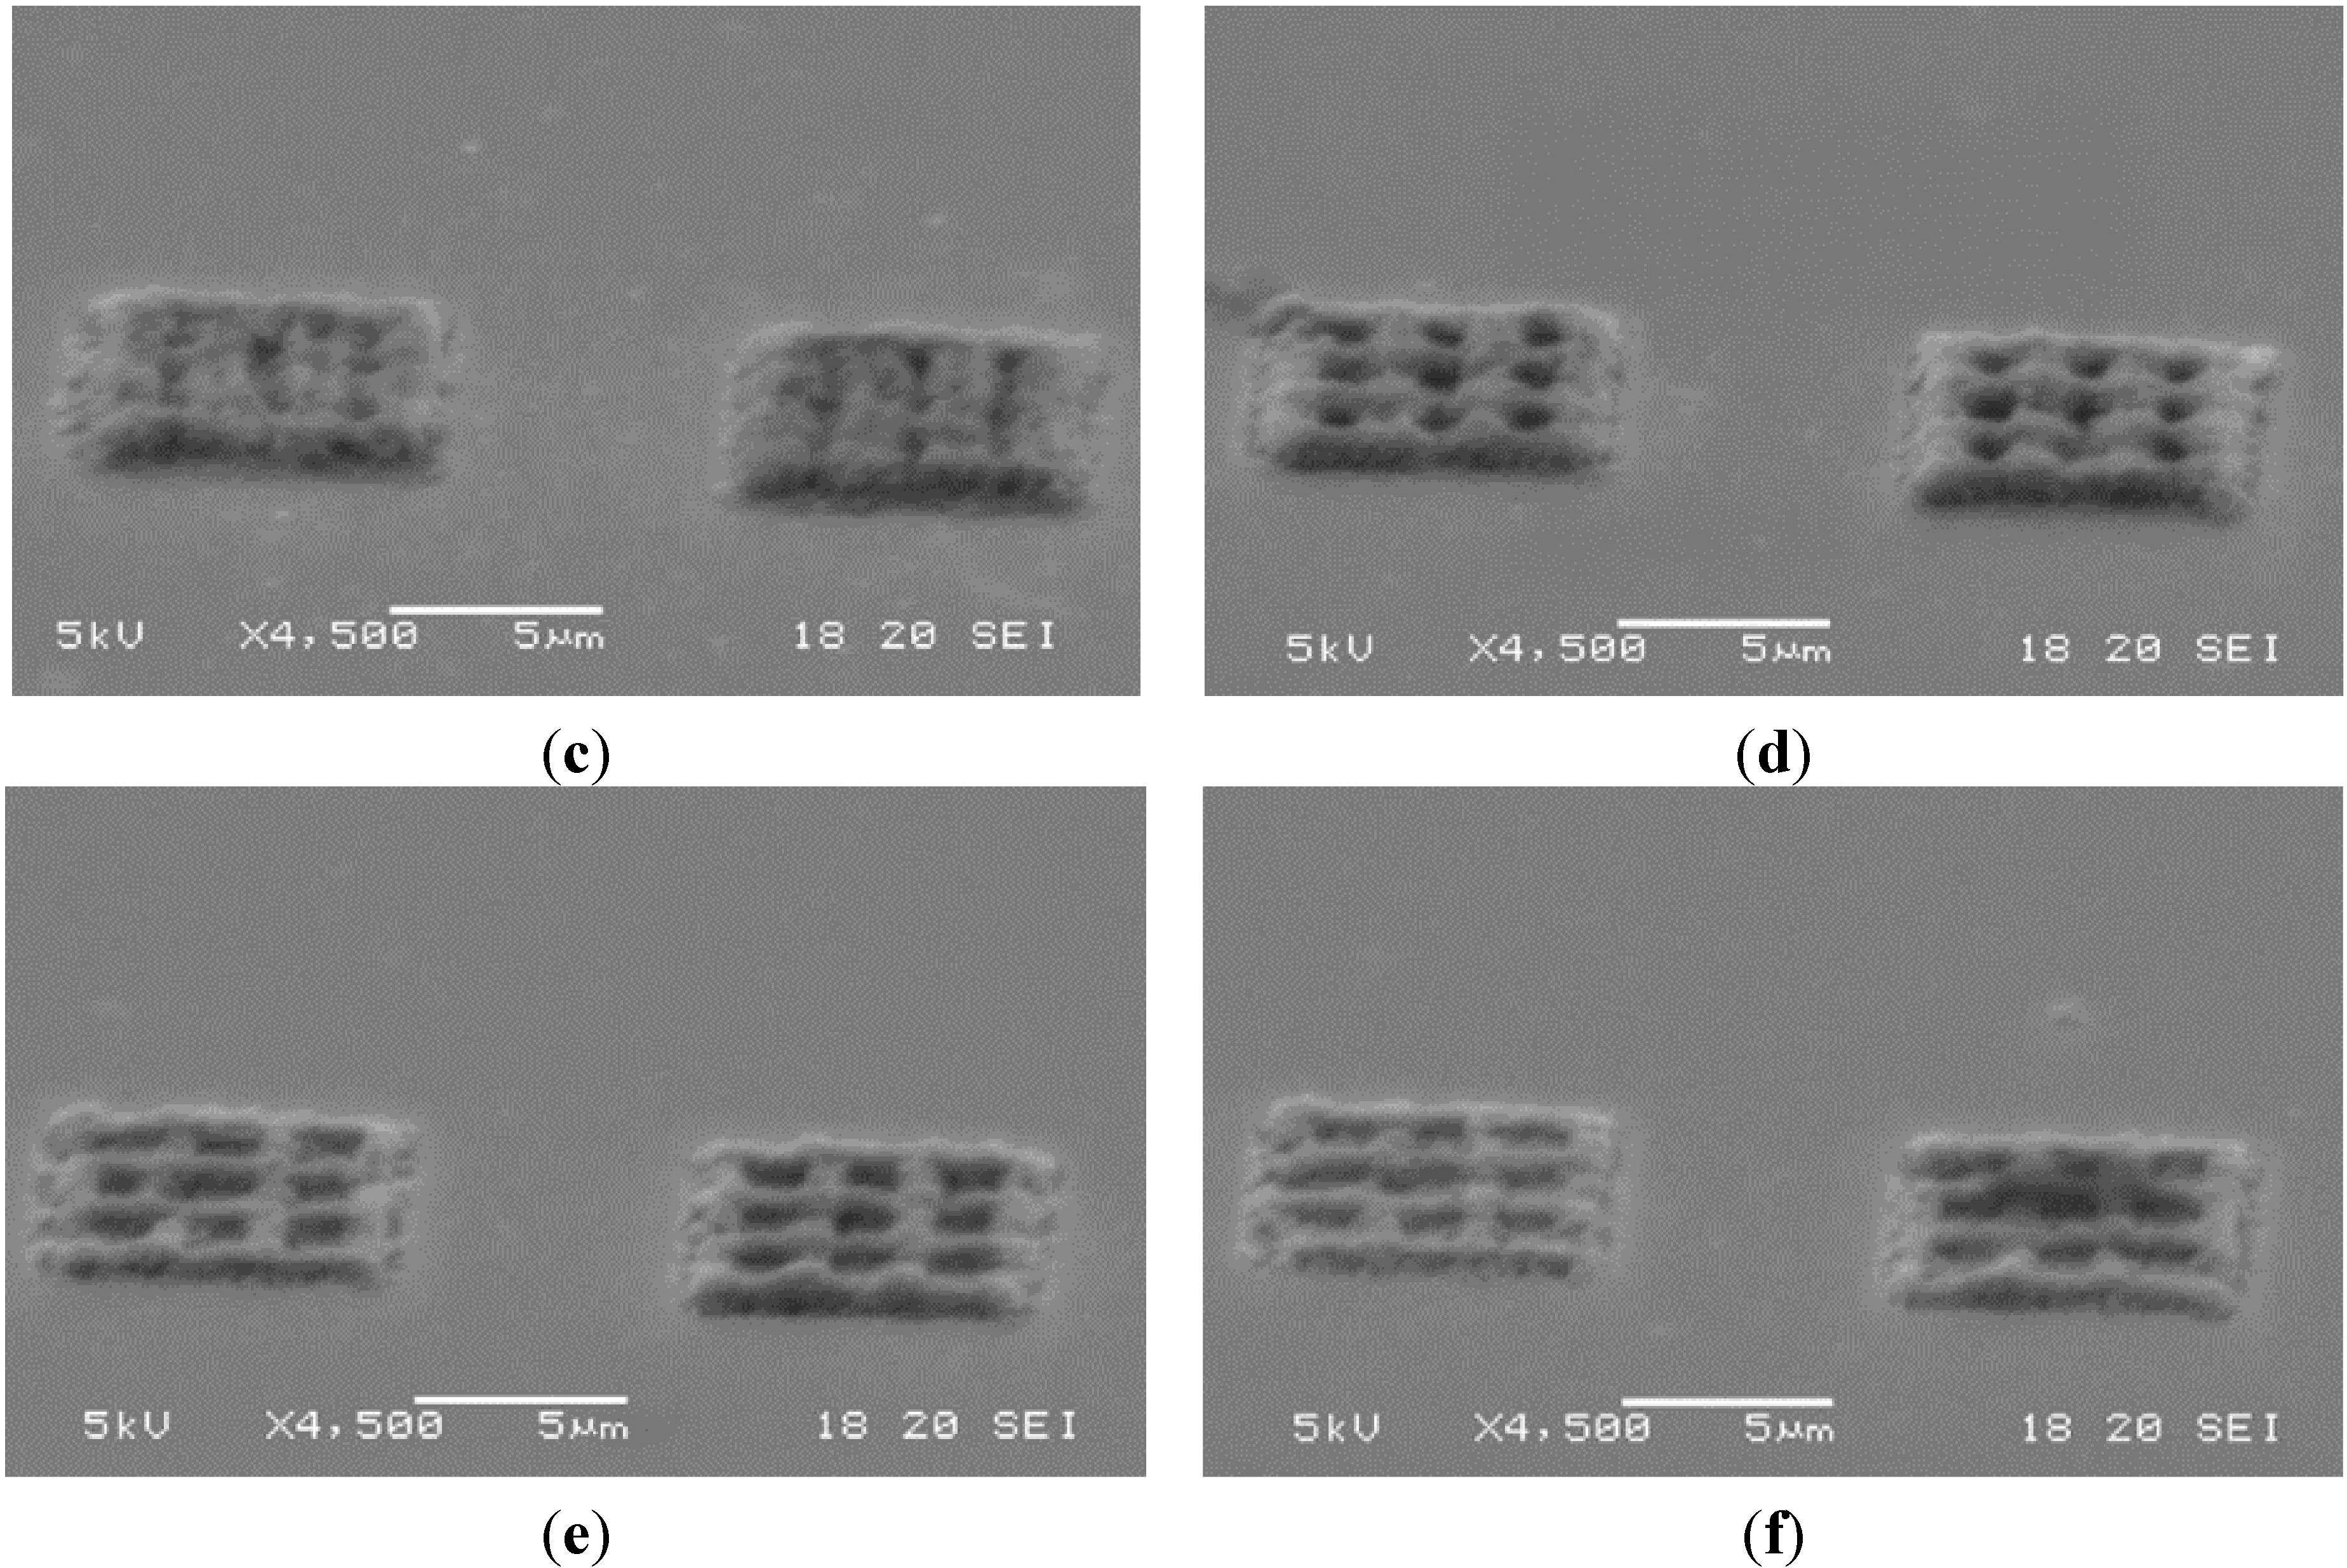
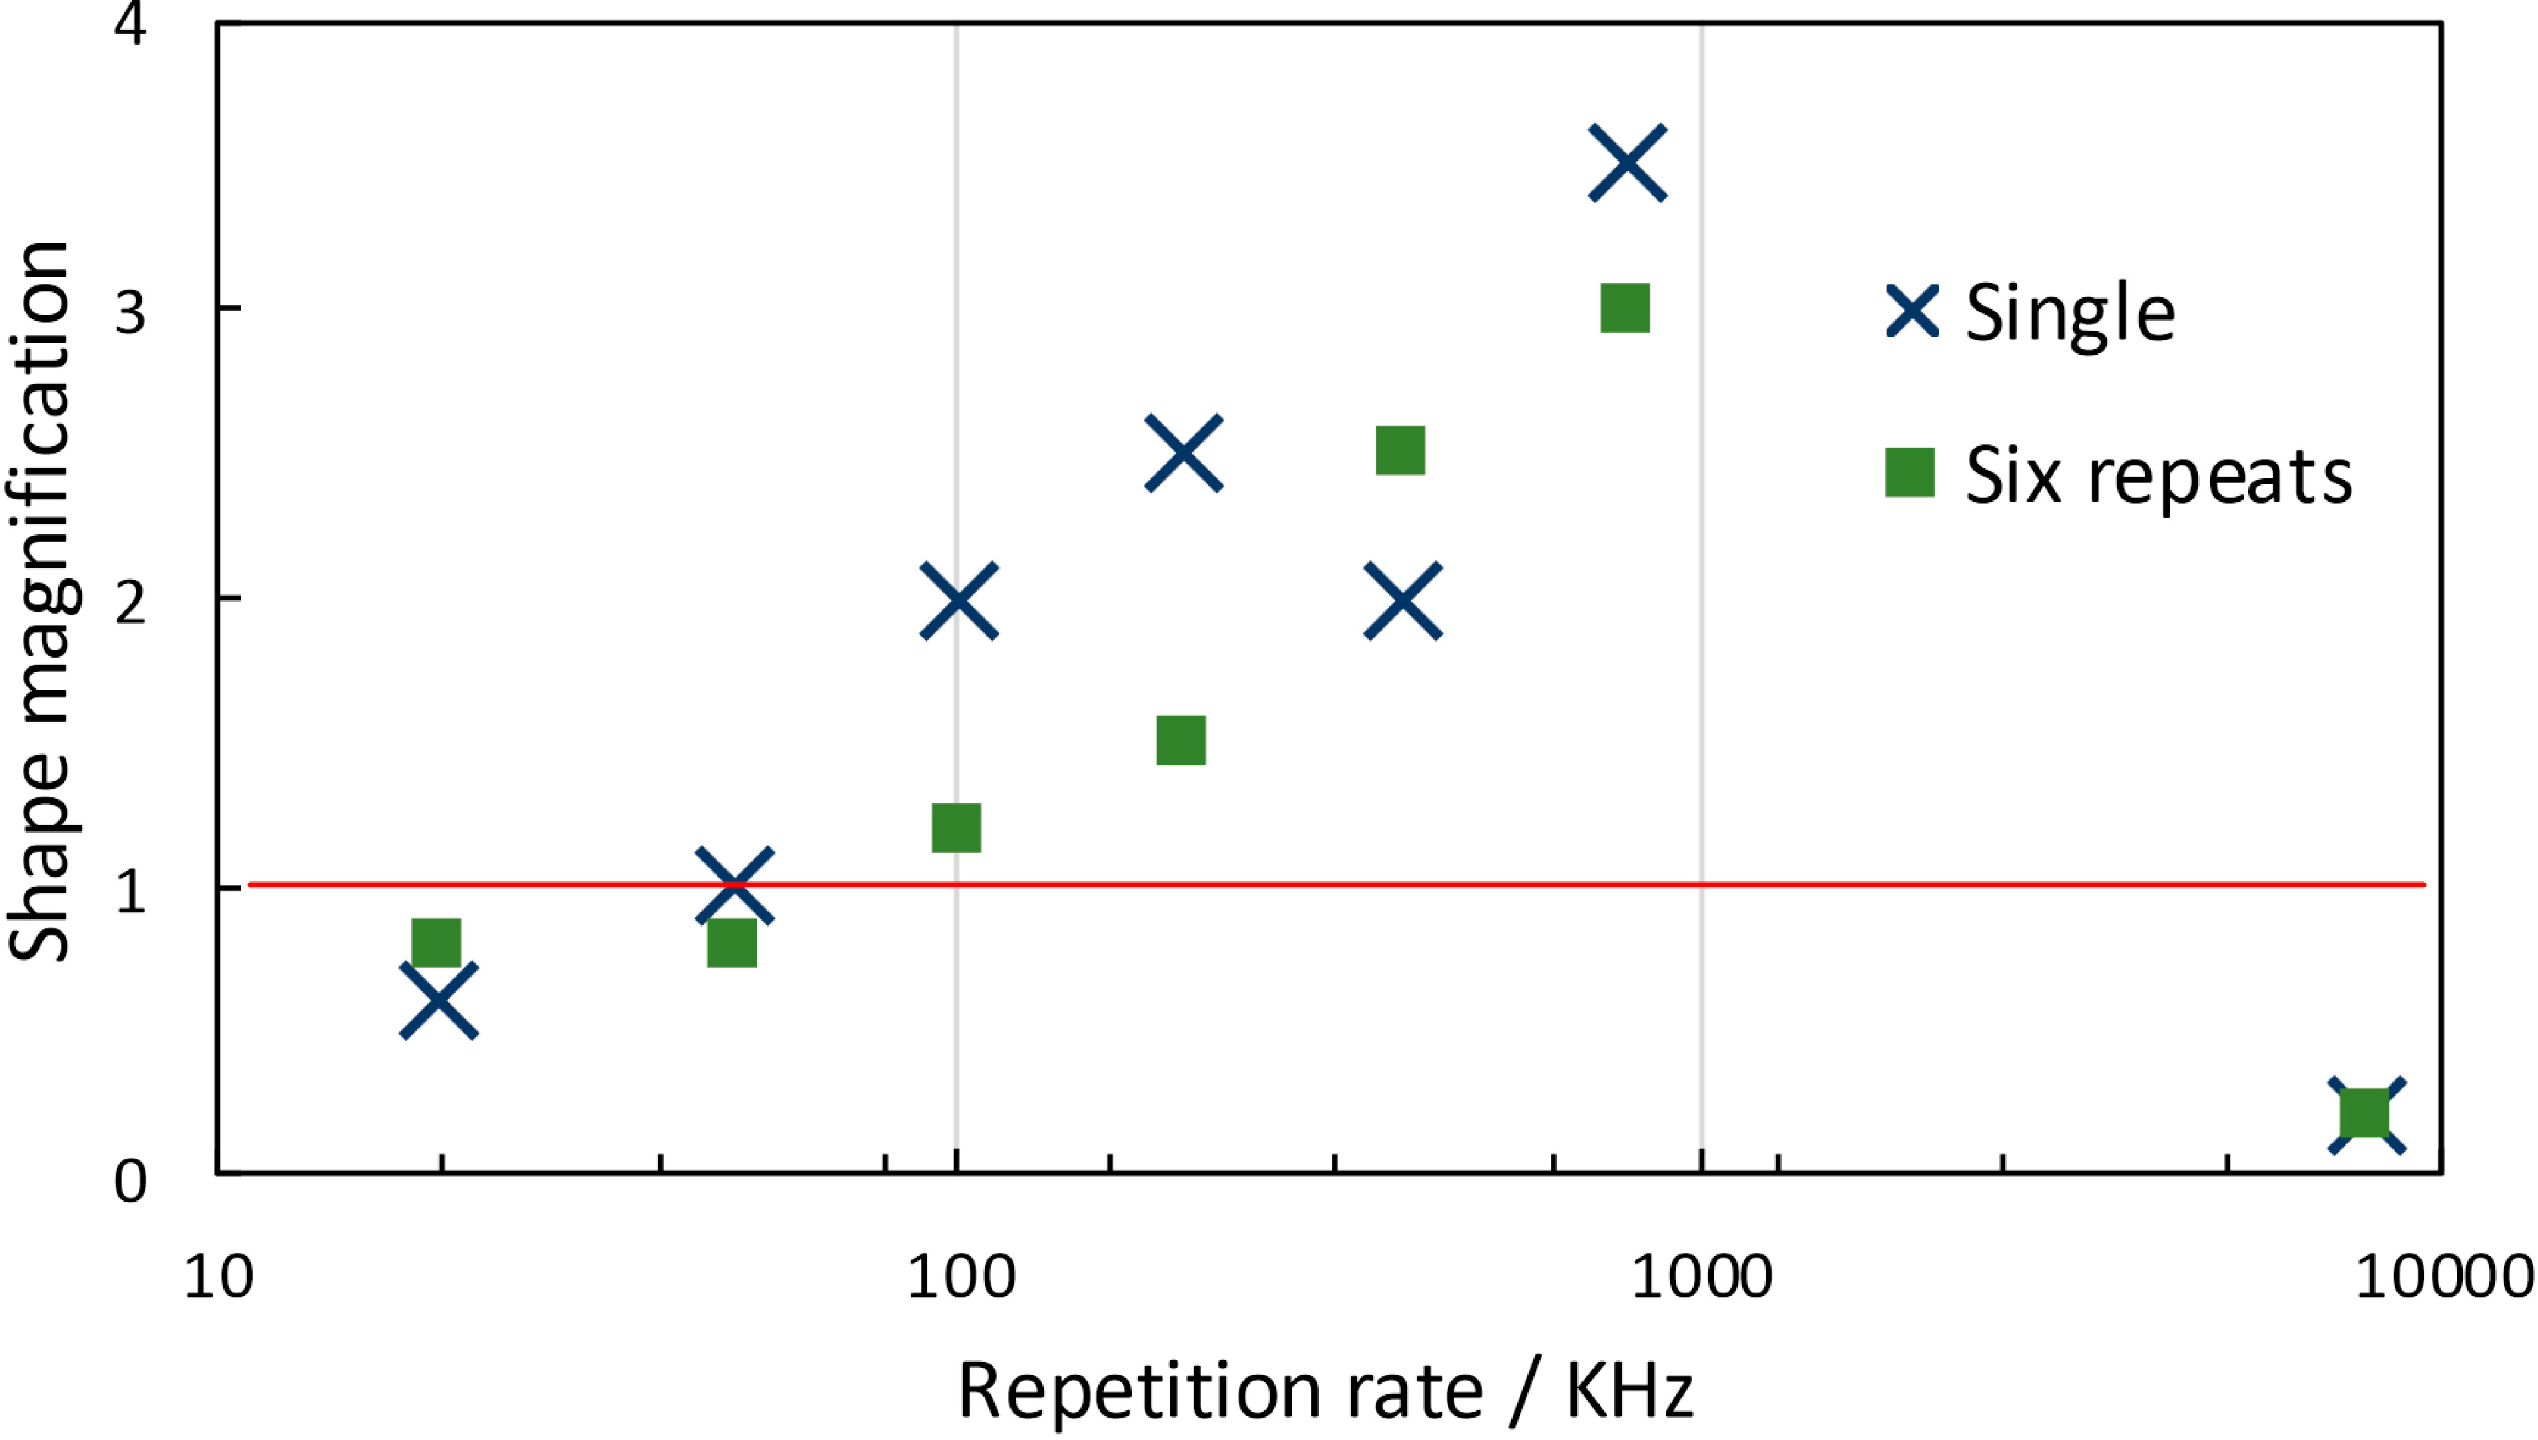
3.3. Reduction of the Repetition Rate of a Laser
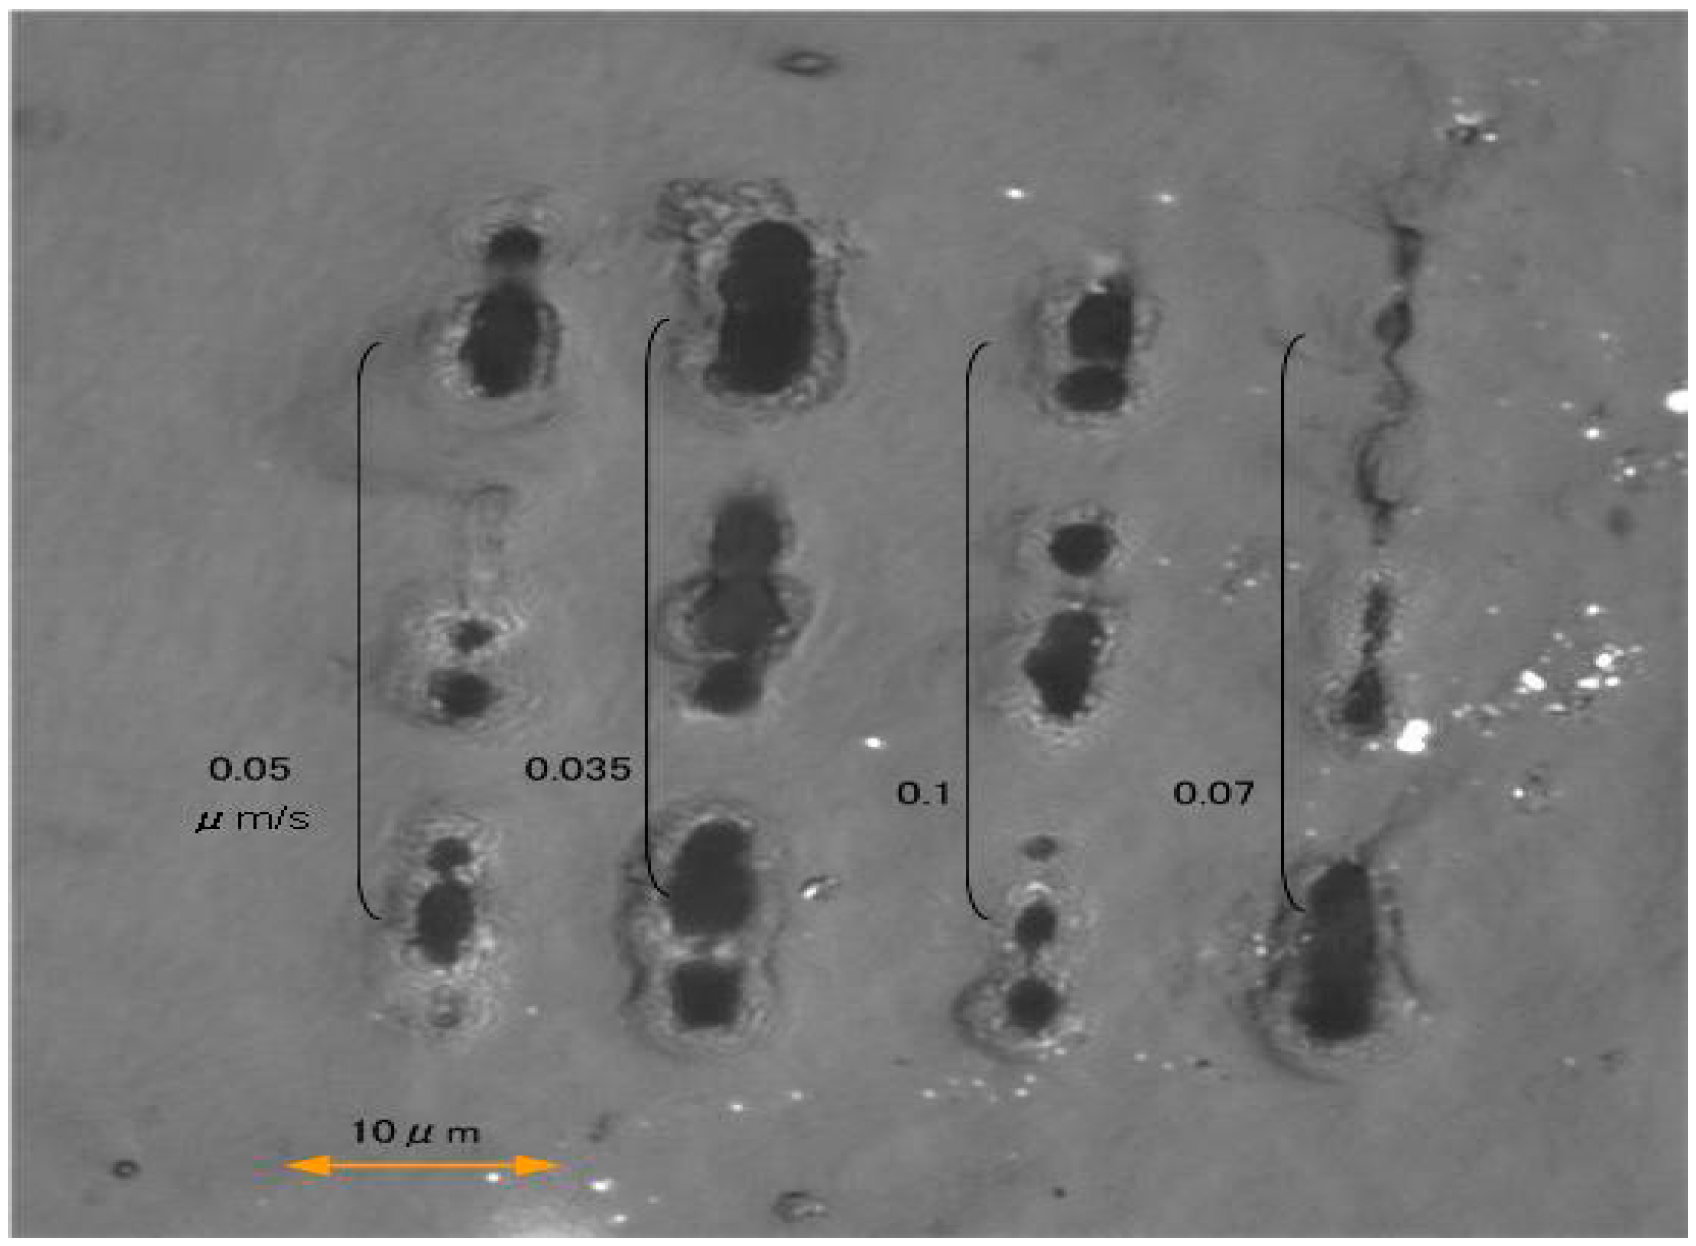
3.3.1. First Method (Single Repeat)


3.3.2. Second Method (Six Repeats)


3.3.3. Compensation Method of Shrinkage


4. Conclusions
Author Contributions
Conflicts of Interest
References
- Kobayashi, N.; Yamada, K.; Hirohashi, R. Effect of Anion Species on Electrochemical Behavior of Poly(aniline)s Electropolymerized in Dichloroethane Solution. Electrochim. Acta 1992, 37, 2101–2102. [Google Scholar] [CrossRef]
- Okano, M.; Itoh, K.; Fujishima, A.; Honda, K. Generation of organic conducting patterns on semiconductors by photoelectrochemical polymerization of pyrrole. Chem. Lett. 1986, 15, 469–472. [Google Scholar] [CrossRef]
- Iyoda, T.; Toyoda, H.; Fujitsuka, M.; Nakahara, R.; Tsuchiya, H.; Honda, K.; Shimidzu, T. The 100-.ANG.-order depth profile control of polypyrrole-poly(3-methylthiophene) composite thin film by potential-programmed electropolymerization. J. Phys. Chem. 1991, 95, 5215–5220. [Google Scholar] [CrossRef]
- Teshima, K.; Yamada, K.; Kobayashi, N.; Hirohashi, R. Photopolymerization of aniline with a tris(2,2'-bipyridyl)ruthenium complex—Methylviologen polymer bilayer electrode system. Chem. Commun. 1996, 1996, 829–830. [Google Scholar] [CrossRef]
- Cumpston, B.H.; Ananthavel, S.P.; Barlow, S.; Dyer, D.L.; Ehrlich, J.E.; Erskine, L.L.; Heikal, A.A.; Kuebler, S.M.; Sandy Lee, I.-Y.; McCord-Maughon, D.; Qin, J.; Röckel, H.; Rumi, M.; Wu, X.L.; Marder, S.R.; Perry, J.W. Two-photon polymerization initiators for three-dimensional optical data storage and microfabrication. Nature 1999, 398, 51–54. [Google Scholar] [CrossRef]
- Kawata, S.; Sun, H.-B.; Tanaka, T.; Takada, K. Finer Features for Functional Microdevices. Nature 2001, 412, 697–698. [Google Scholar] [CrossRef] [PubMed]
- Li, L.; Fourkas, J. Multiphoton Polymerization. Mater. Today 2007, 10, 30–37. [Google Scholar] [CrossRef]
- Yamada, K.; Kimura, Y.; Suzuki, S.; Chen, J.; Sone, J. Multiphoton-sensitized polymerization of pyrrole. Chem. Lett. 2006, 35, 908–909. [Google Scholar] [CrossRef]
- Sone, J.; Asami, A.; Kimura, G.; Yamada, K. Feasibility study of micro-actuator using electro conducting polymers. IEEJ Trans. Sens. Micromach. 2009, 129, 81–82. [Google Scholar] [CrossRef]
- Yamada, K.; Sone, J.; Chen, J. Three-Dimensional Photochemical Microfabrication of Conductive Polymers in Transparent Polymer Sheet. Opt. Rev. 2009, 16, 208–212. [Google Scholar] [CrossRef]
- Takada, K.; Kaneko, K.; Li, Y.; Kawata, S.; Chen, Q.; Sun, H. Temperature effects on pinpoint photopolymerization and polymerized micronanostructures. Appl. Phys. Lett. 2008, 92, 041902. [Google Scholar] [CrossRef]
- Juodkazis, S.; Mizeikis, V.; Seet, K.; Miwa, M.; Misawa, H. Two-photon lithography of nanorods in SU-8 photoresist. Nanotechnology 2005, 16, 846–849. [Google Scholar] [CrossRef]
- Eaton, S.; Zhang, H.; Herman, P.; Yoshino, F.; Shah, L.; Bovatsek, J.; Arai, A. Heat accumulation effects in femtosecond laserwritten waveguides with variable repetition rate. Opt. Express 2005, 13, 4708–4716. [Google Scholar] [CrossRef] [PubMed]
- Tanaka, T. Plasmonic metamaterials produced by two-photon-induced photoreduction technique. J. Laser Micro/Nanoeng. 2008, 3, 152–156. [Google Scholar] [CrossRef]
- Sun, H.; Kawata, S. Two-Photon Photopolymerization and 3D Lithographic Microfabrication. NMR 3D Anal. Photopolym. 2004, 170, 169–273. [Google Scholar]
- Yamada, K.; Watanabe, M.; Sone, J. Three-Dimensional Printing of Conducting Polymer Microstructures into Transparent Polymer Sheet: Relationship between Process Resolution and Illumination Conditions. Opt. Rev. 2014, 21, 679–682. [Google Scholar] [CrossRef]
- Yamada, K.; Kyoya, A.; Sone, J.; Chen, J. Evaluations of Vertical Resolution of Conductive Polymer Three-Dimensional Microstructures Photofabricated in Transparent Polymer Sheet. Opt. Rev. 2011, 18, 162–165. [Google Scholar] [CrossRef]
© 2014 by the authors; licensee MDPI, Basel, Switzerland. This article is an open access article distributed under the terms and conditions of the Creative Commons Attribution license (http://creativecommons.org/licenses/by/4.0/).
Share and Cite
Sone, J.; Yamada, K.; Asami, A.; Chen, J. Sub-Micrometer Size Structure Fabrication Using a Conductive Polymer. Micromachines 2015, 6, 96-109. https://doi.org/10.3390/mi6010096
Sone J, Yamada K, Asami A, Chen J. Sub-Micrometer Size Structure Fabrication Using a Conductive Polymer. Micromachines. 2015; 6(1):96-109. https://doi.org/10.3390/mi6010096
Chicago/Turabian StyleSone, Junji, Katsumi Yamada, Akihisa Asami, and Jun Chen. 2015. "Sub-Micrometer Size Structure Fabrication Using a Conductive Polymer" Micromachines 6, no. 1: 96-109. https://doi.org/10.3390/mi6010096