Mixing Performance of a 3D Micro T-Mixer with Swirl-Inducing Inlets and Rectangular Constriction

Abstract
:1. Introduction
2. Model Descriptions
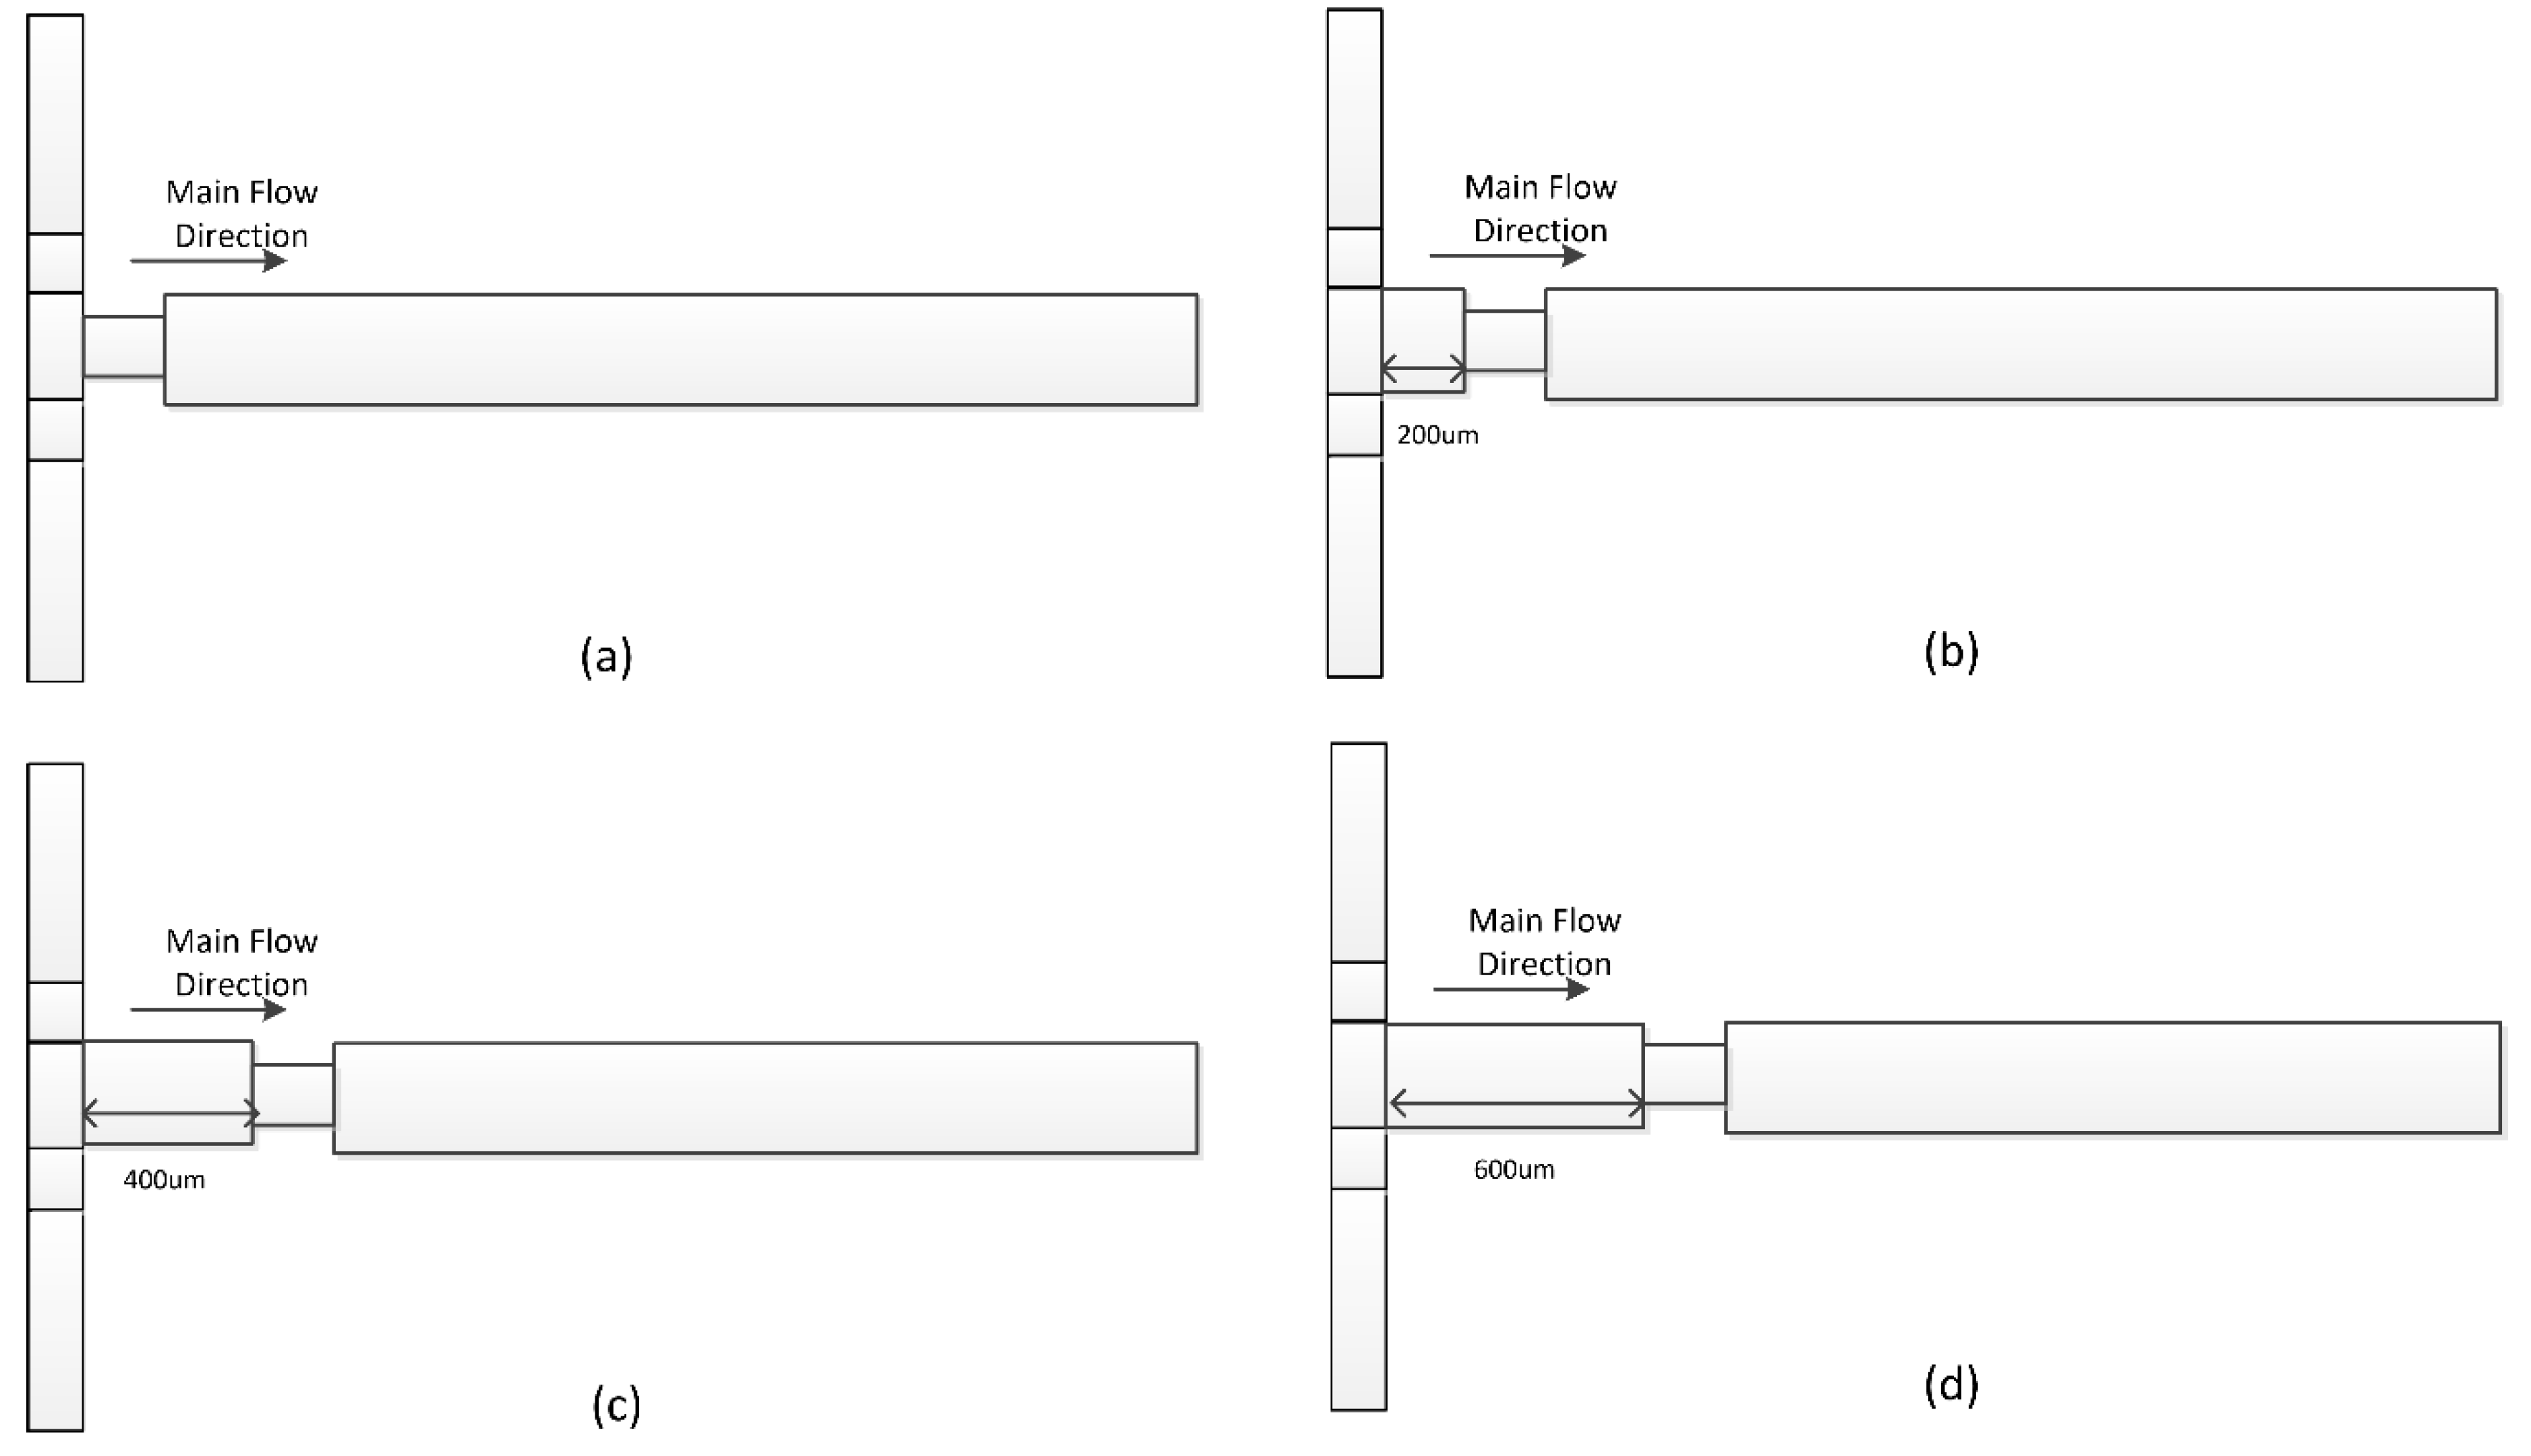
2.1. Geometric Configurations
2.2. Governing Equations and Boundary Conditions
3. Results and Discussion
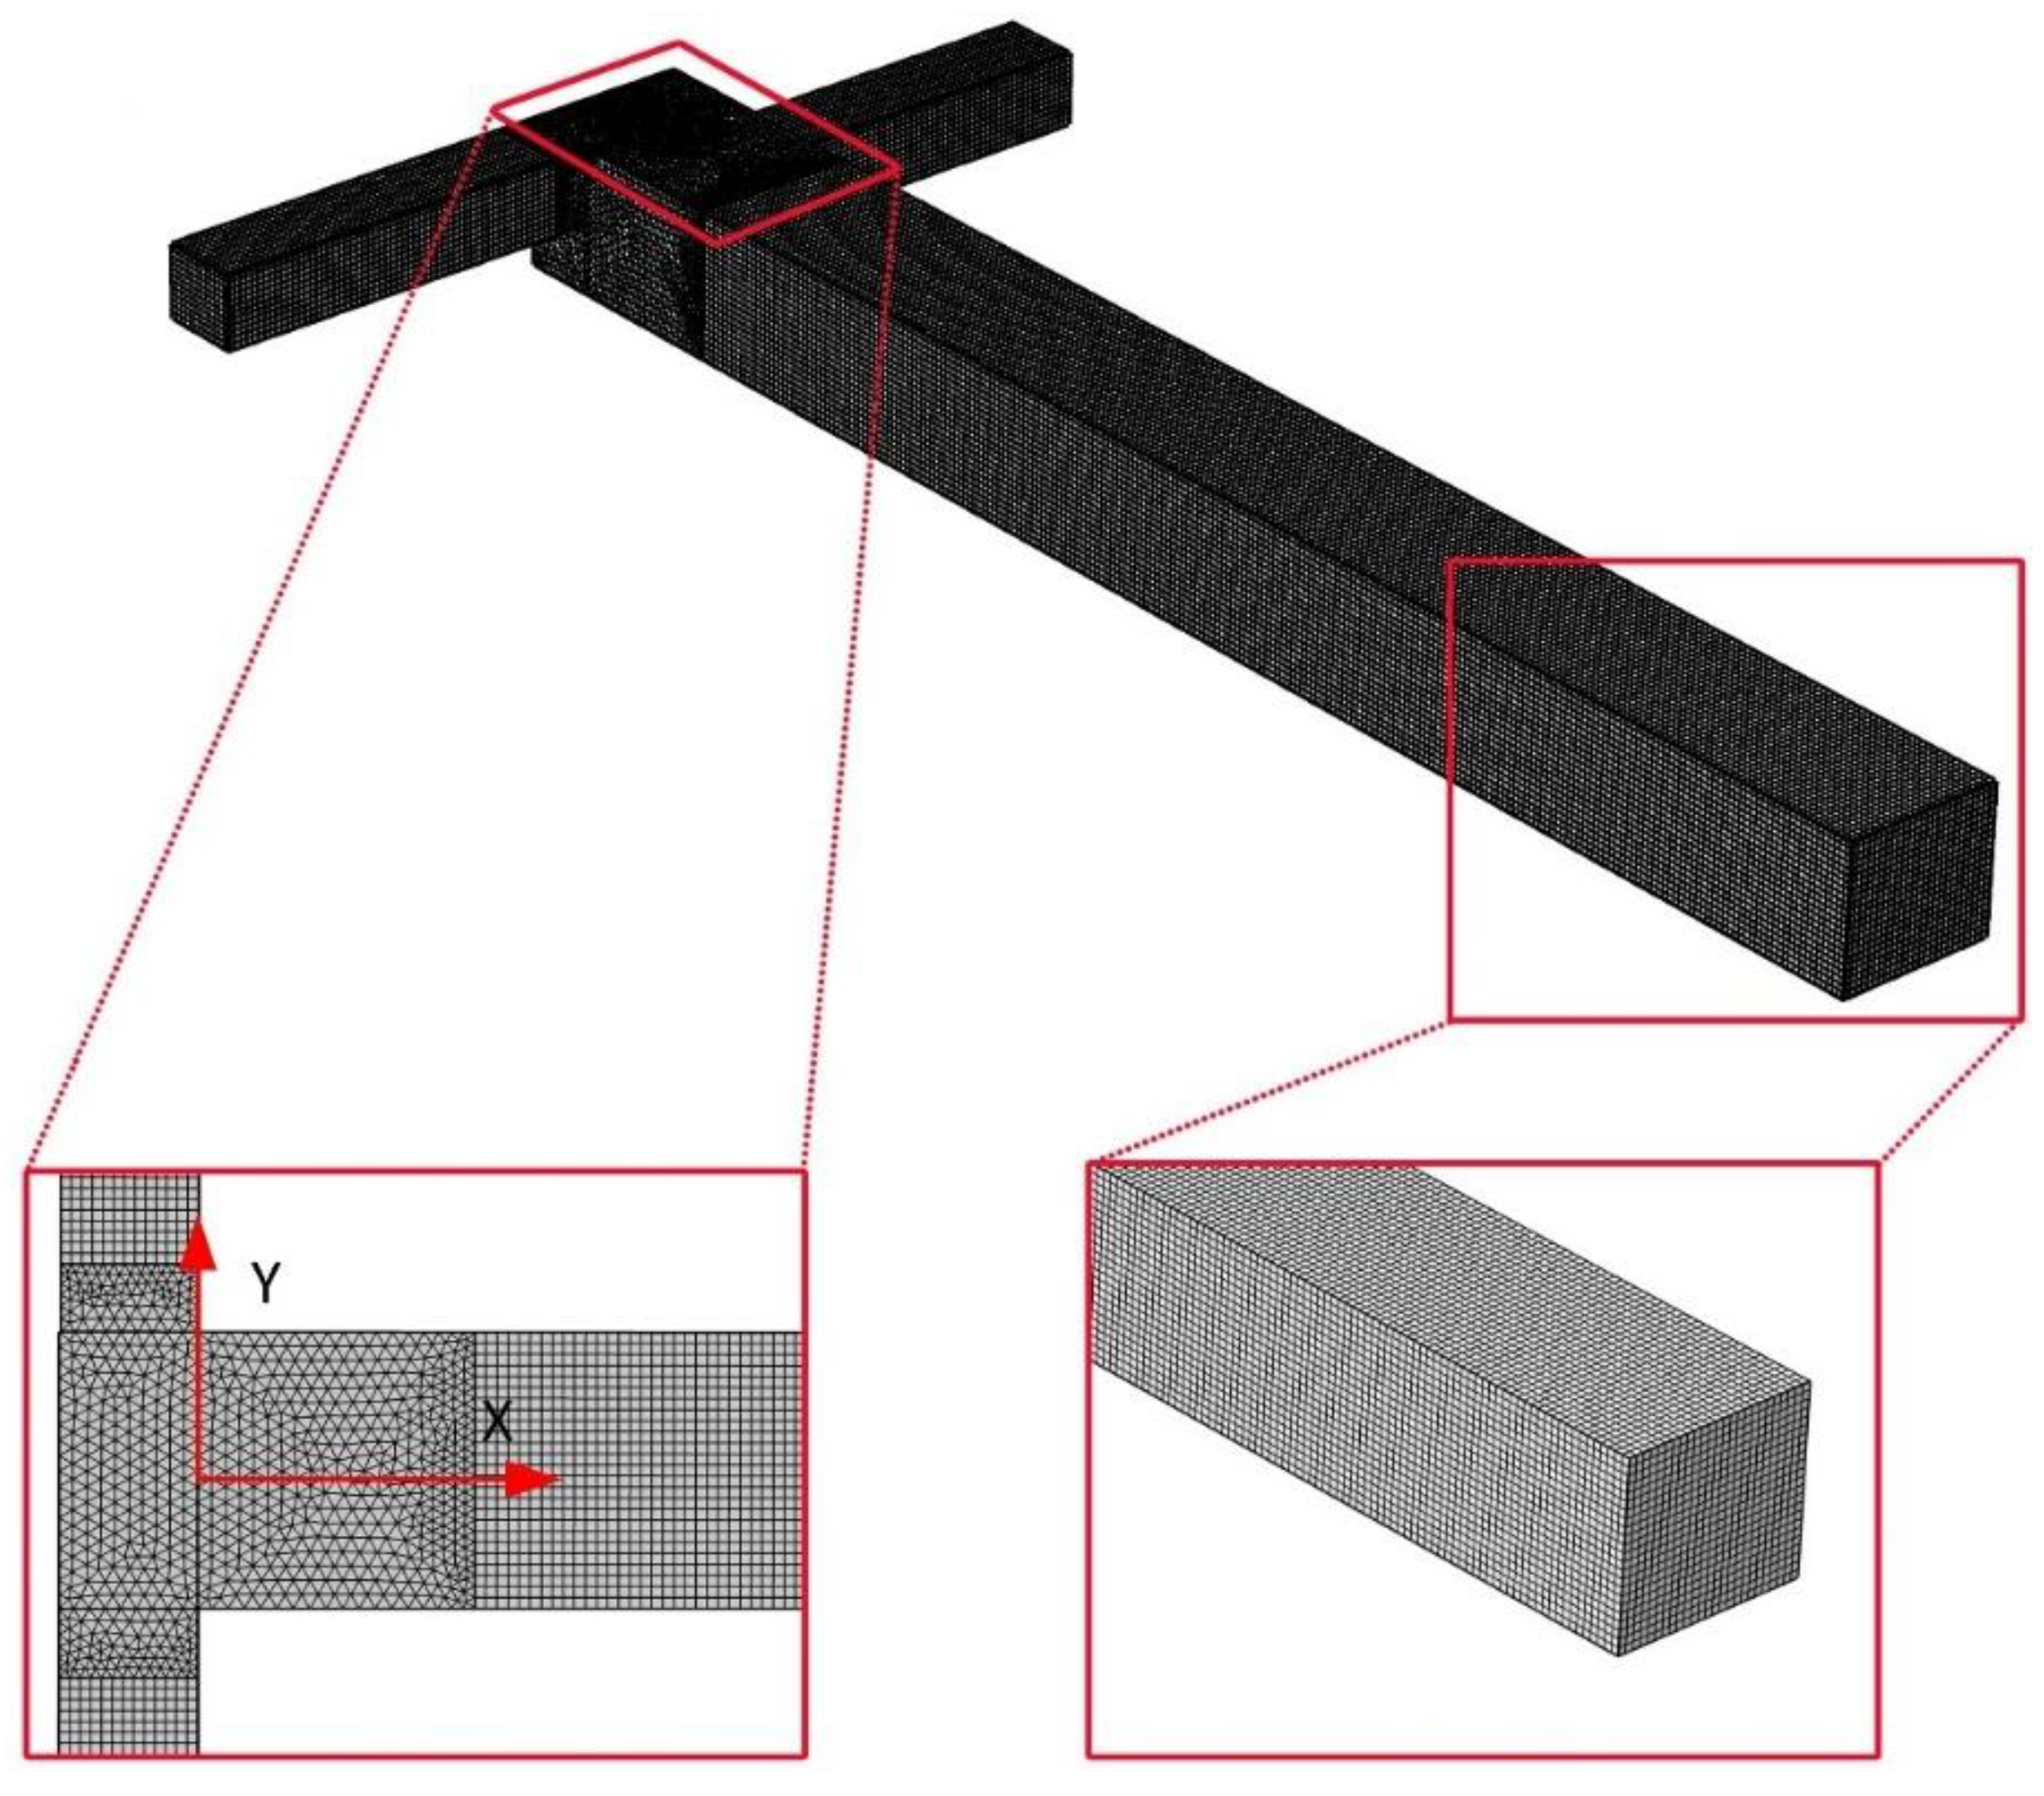
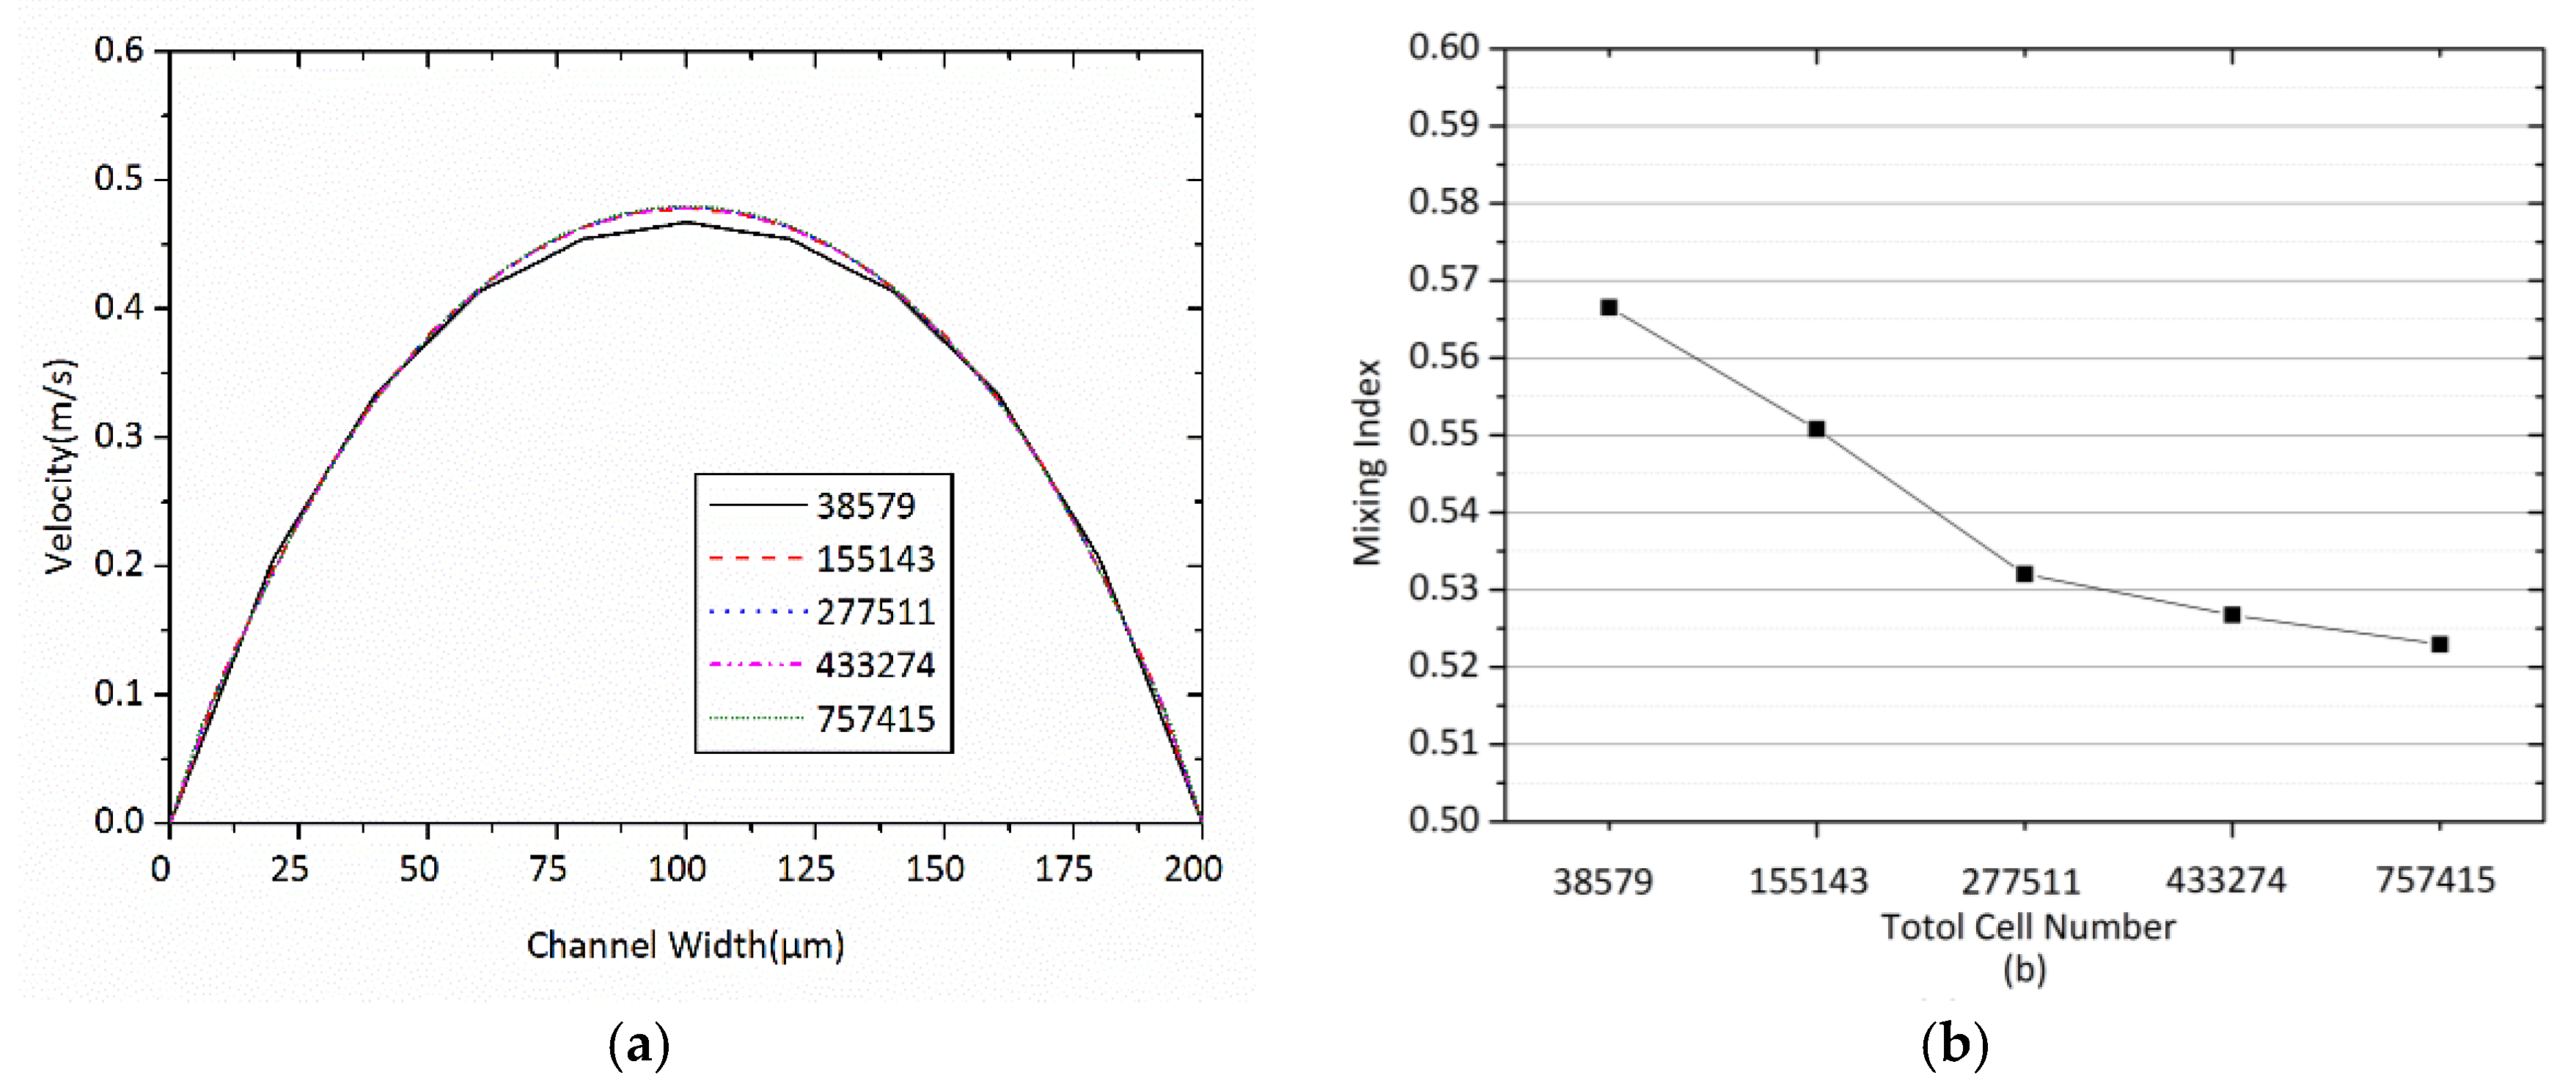
3.1. Mesh Independency
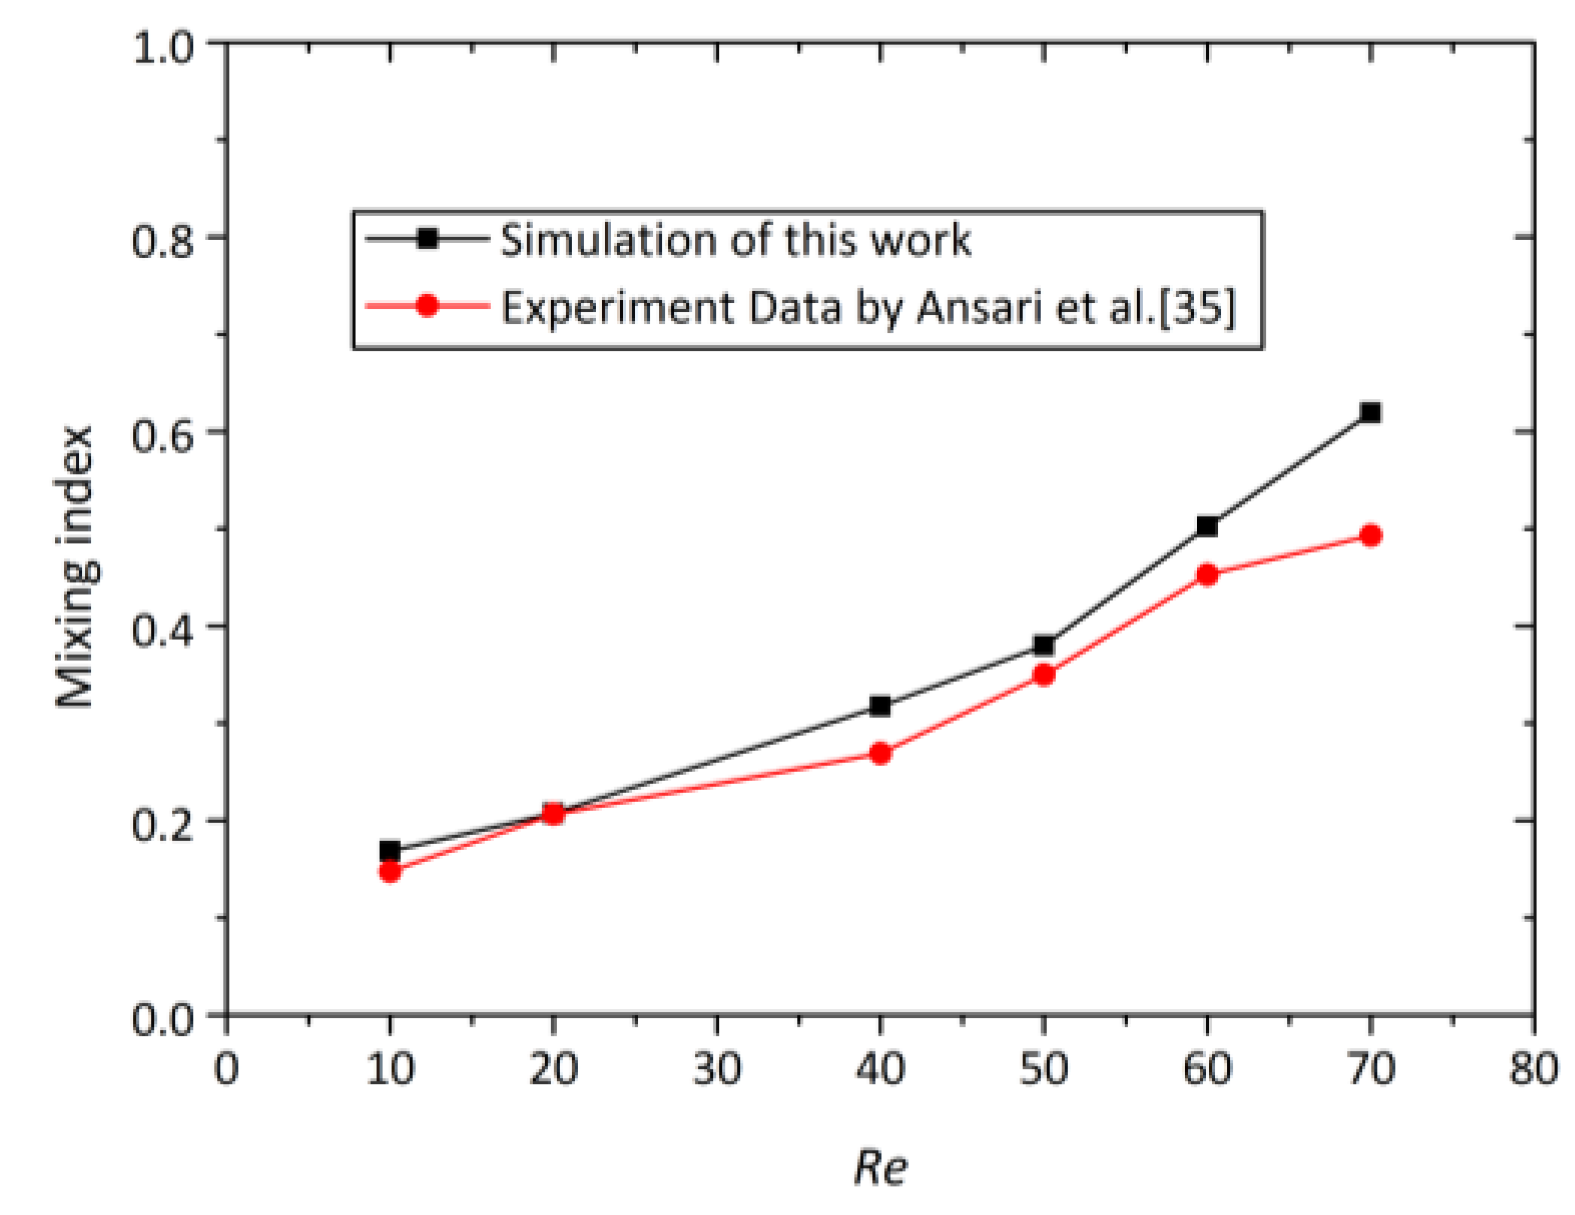
3.2. Validation
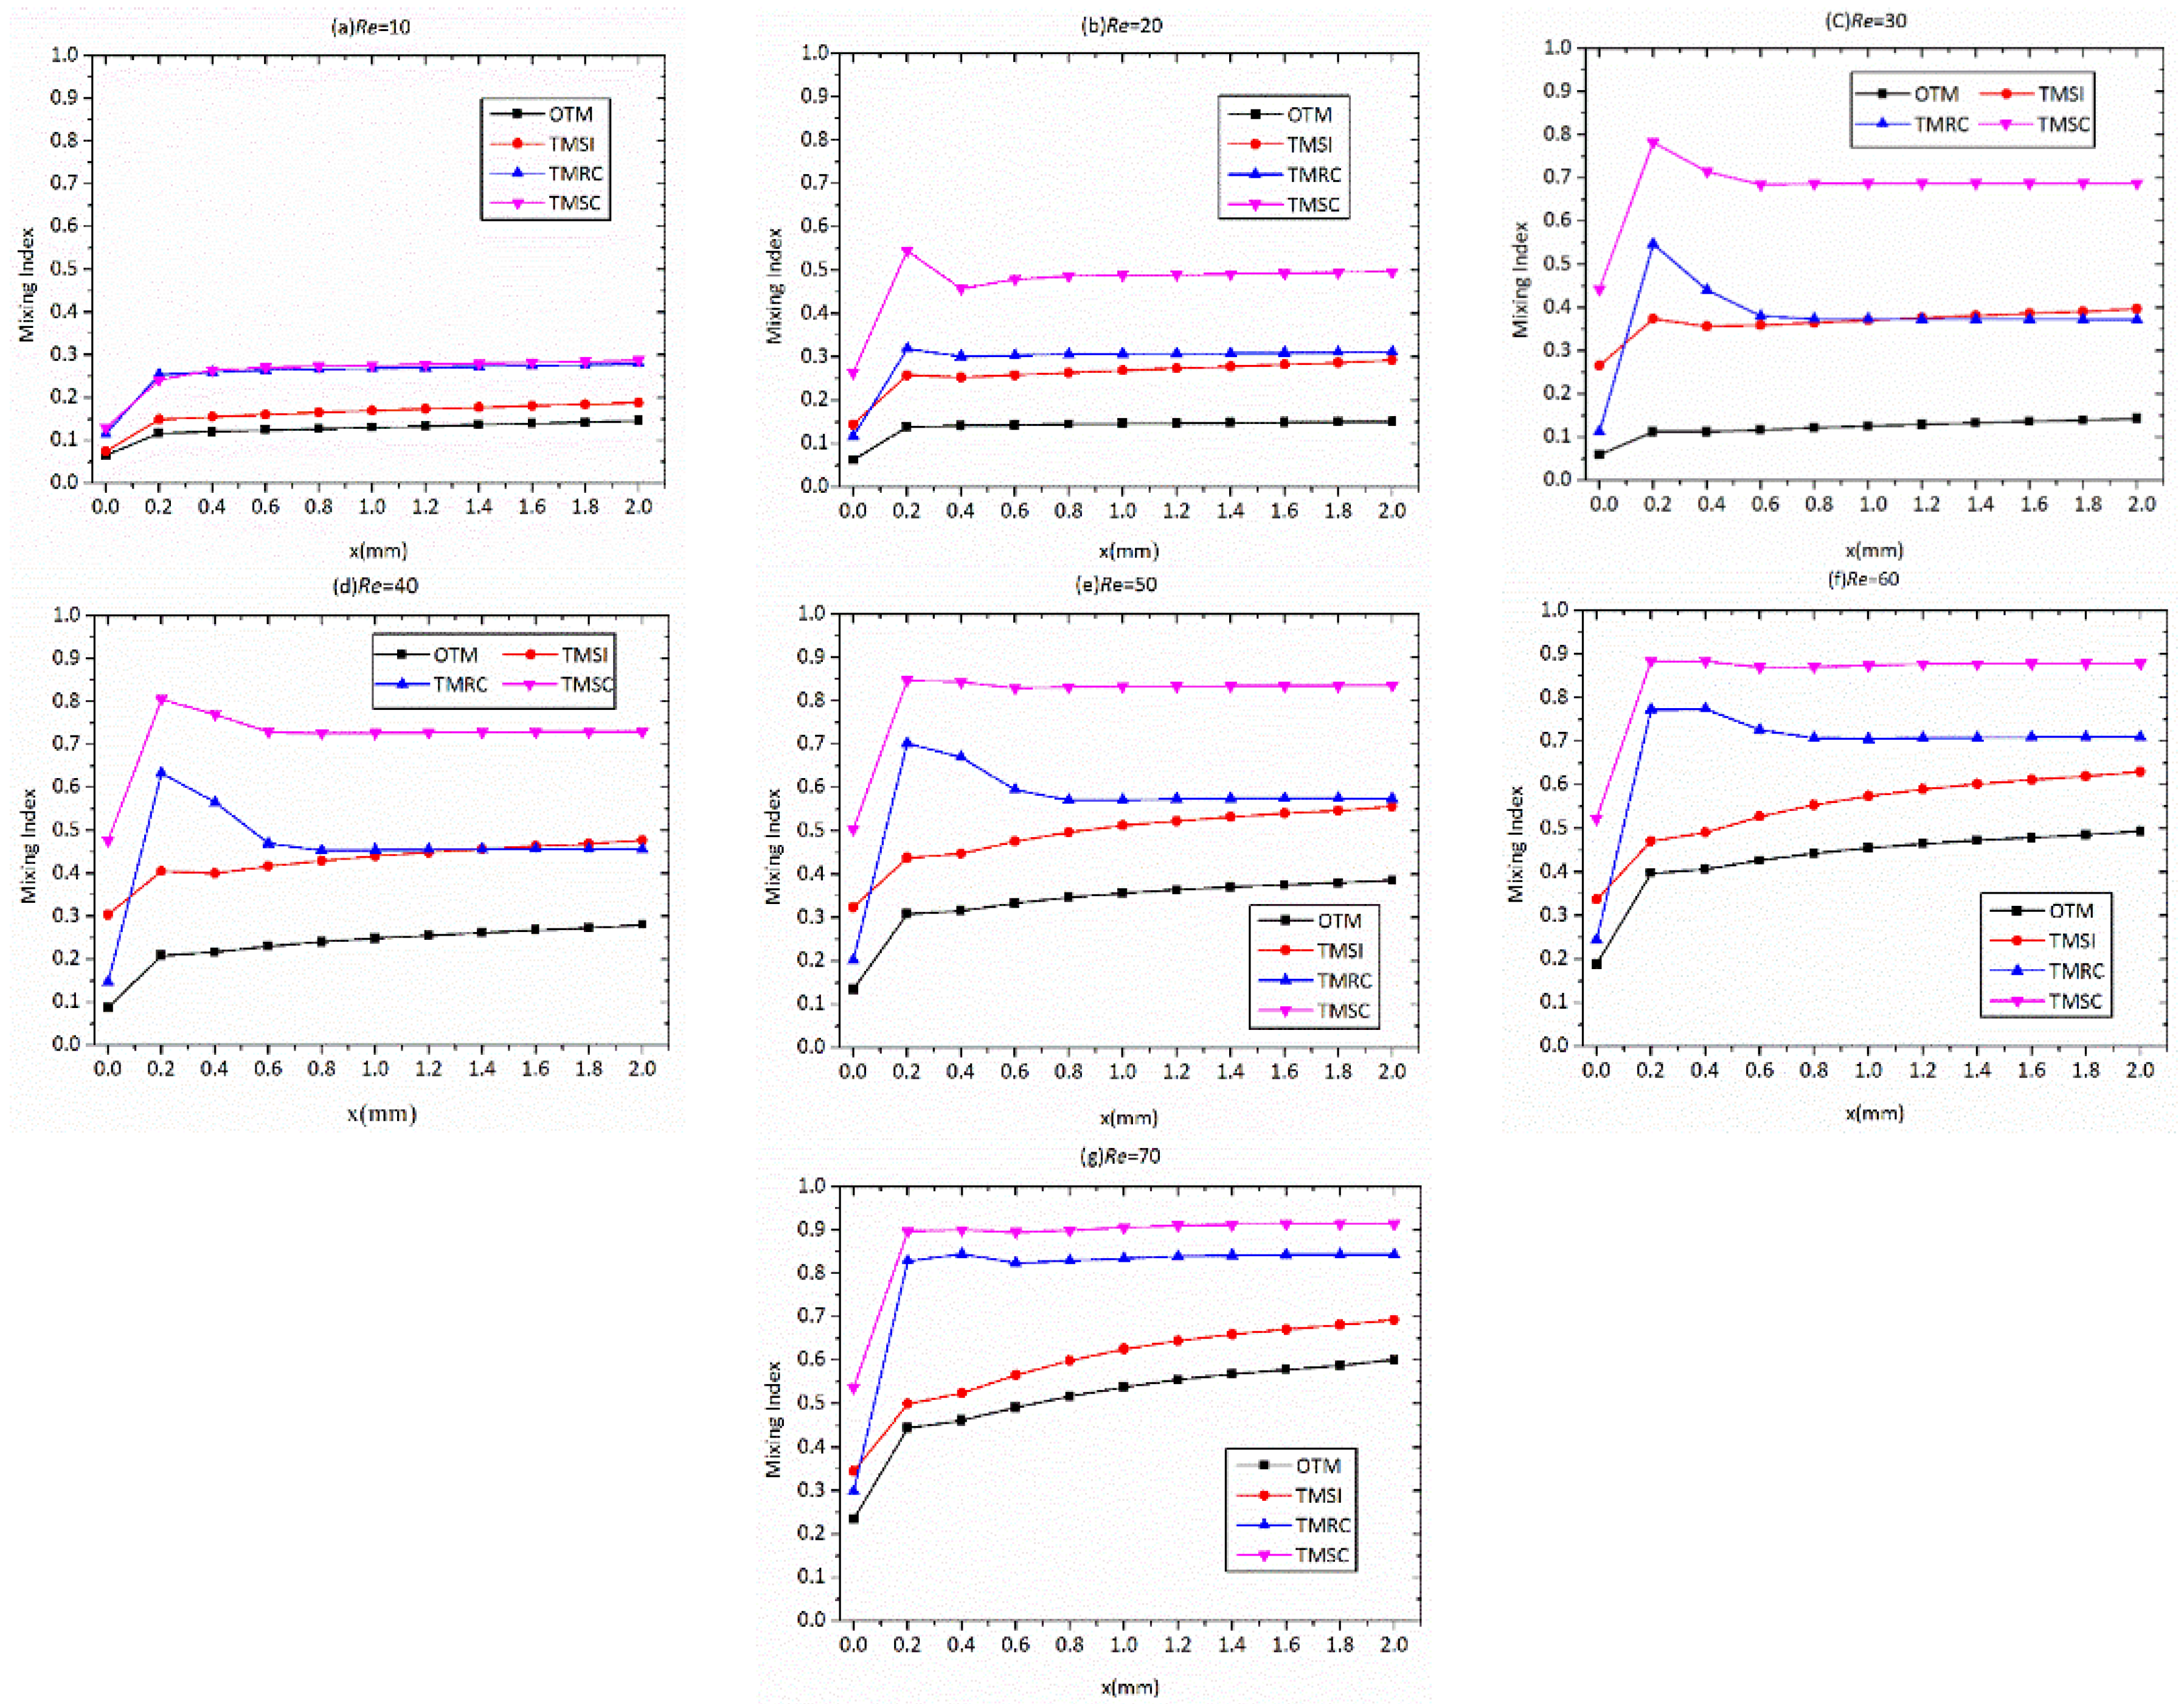
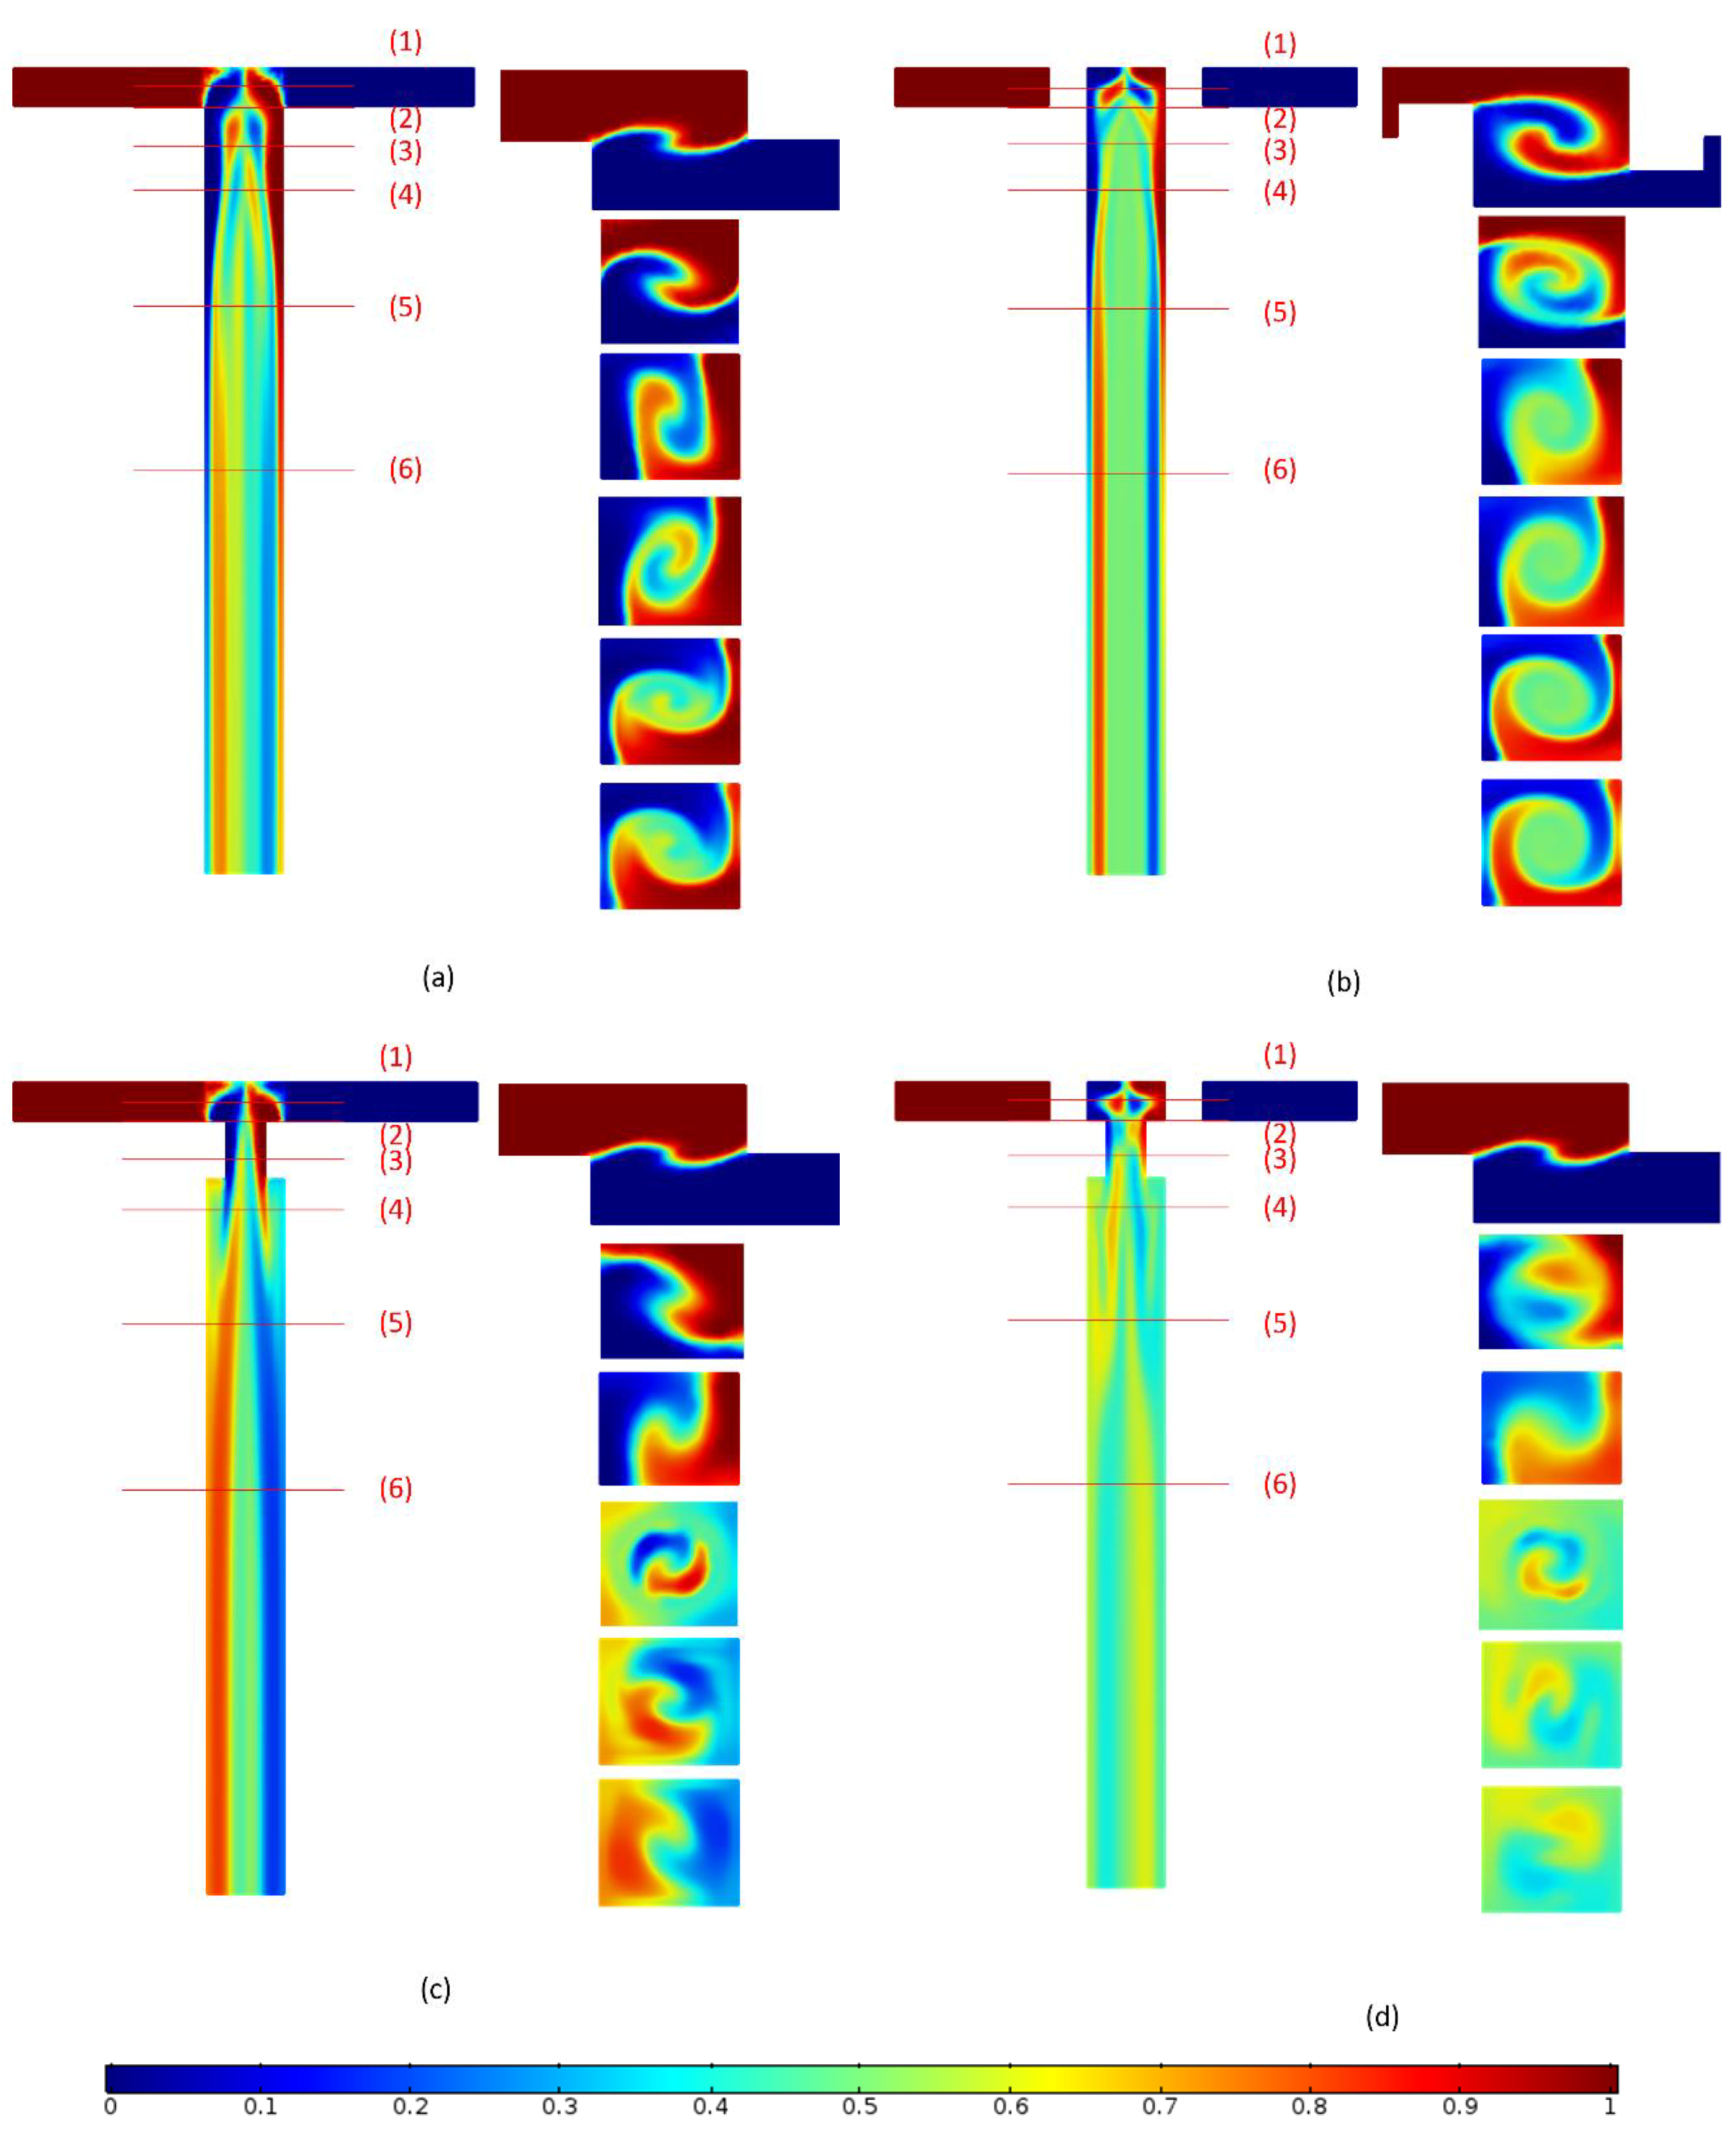
3.3. Mixing Index
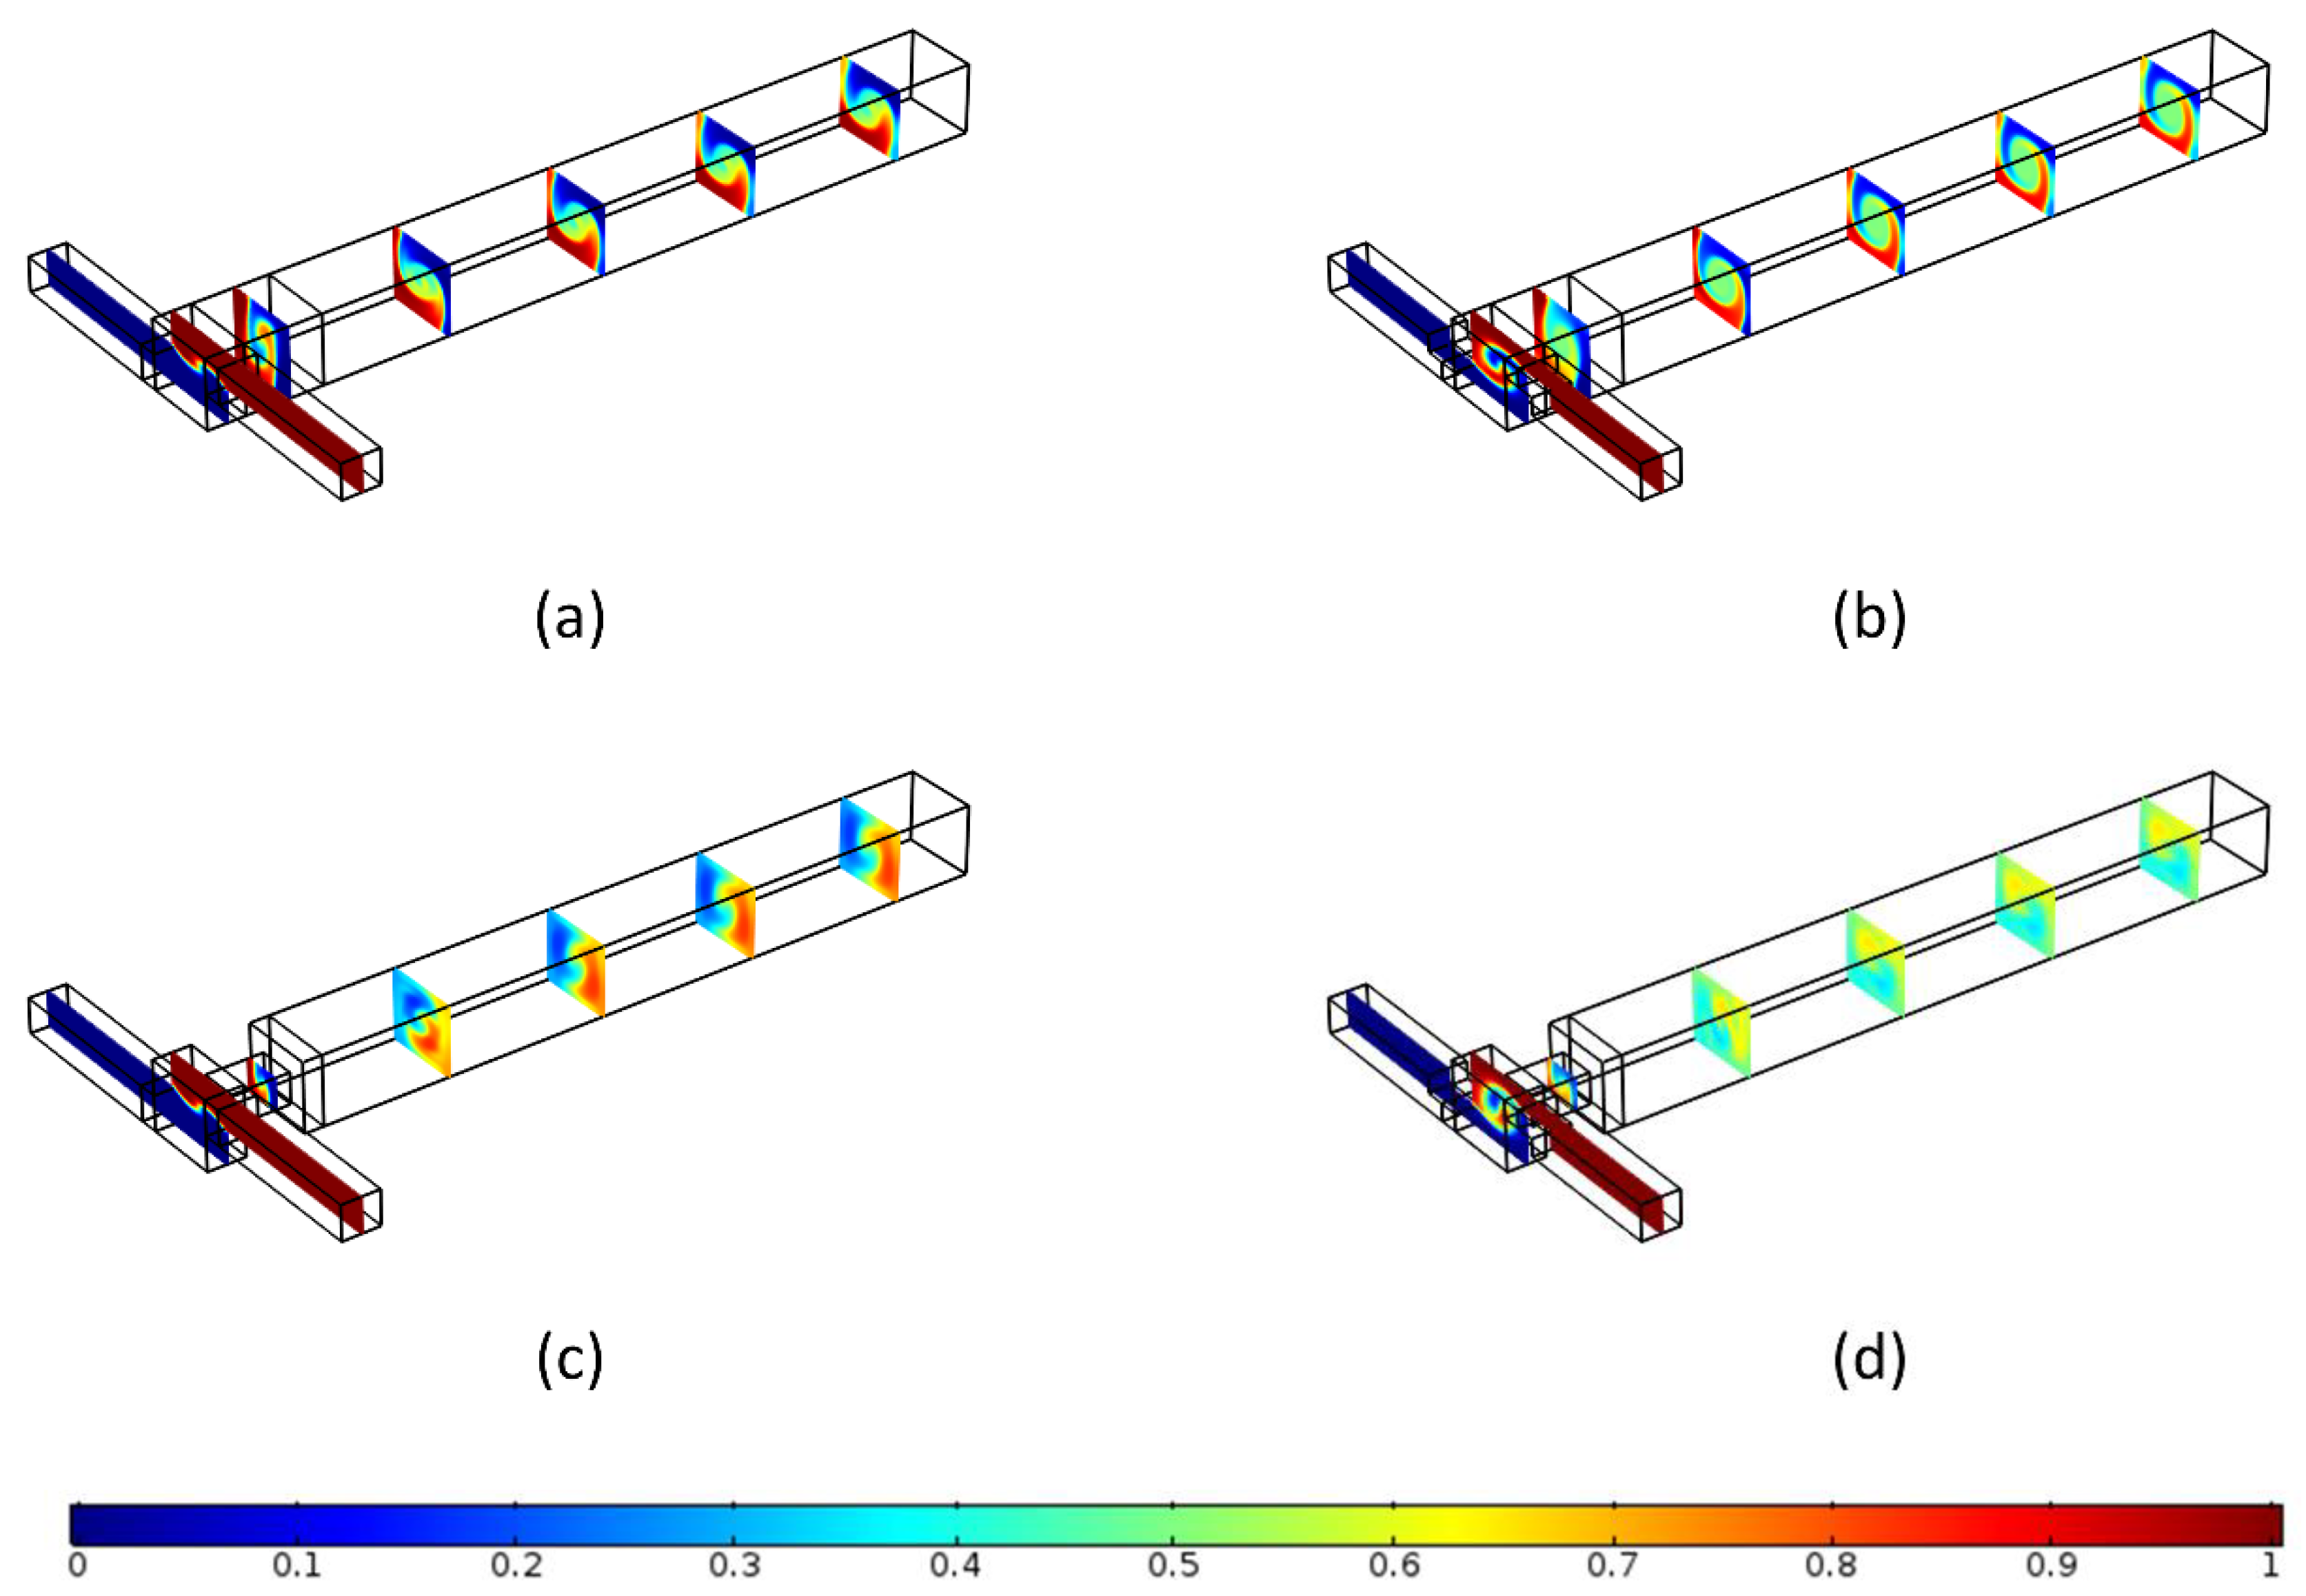
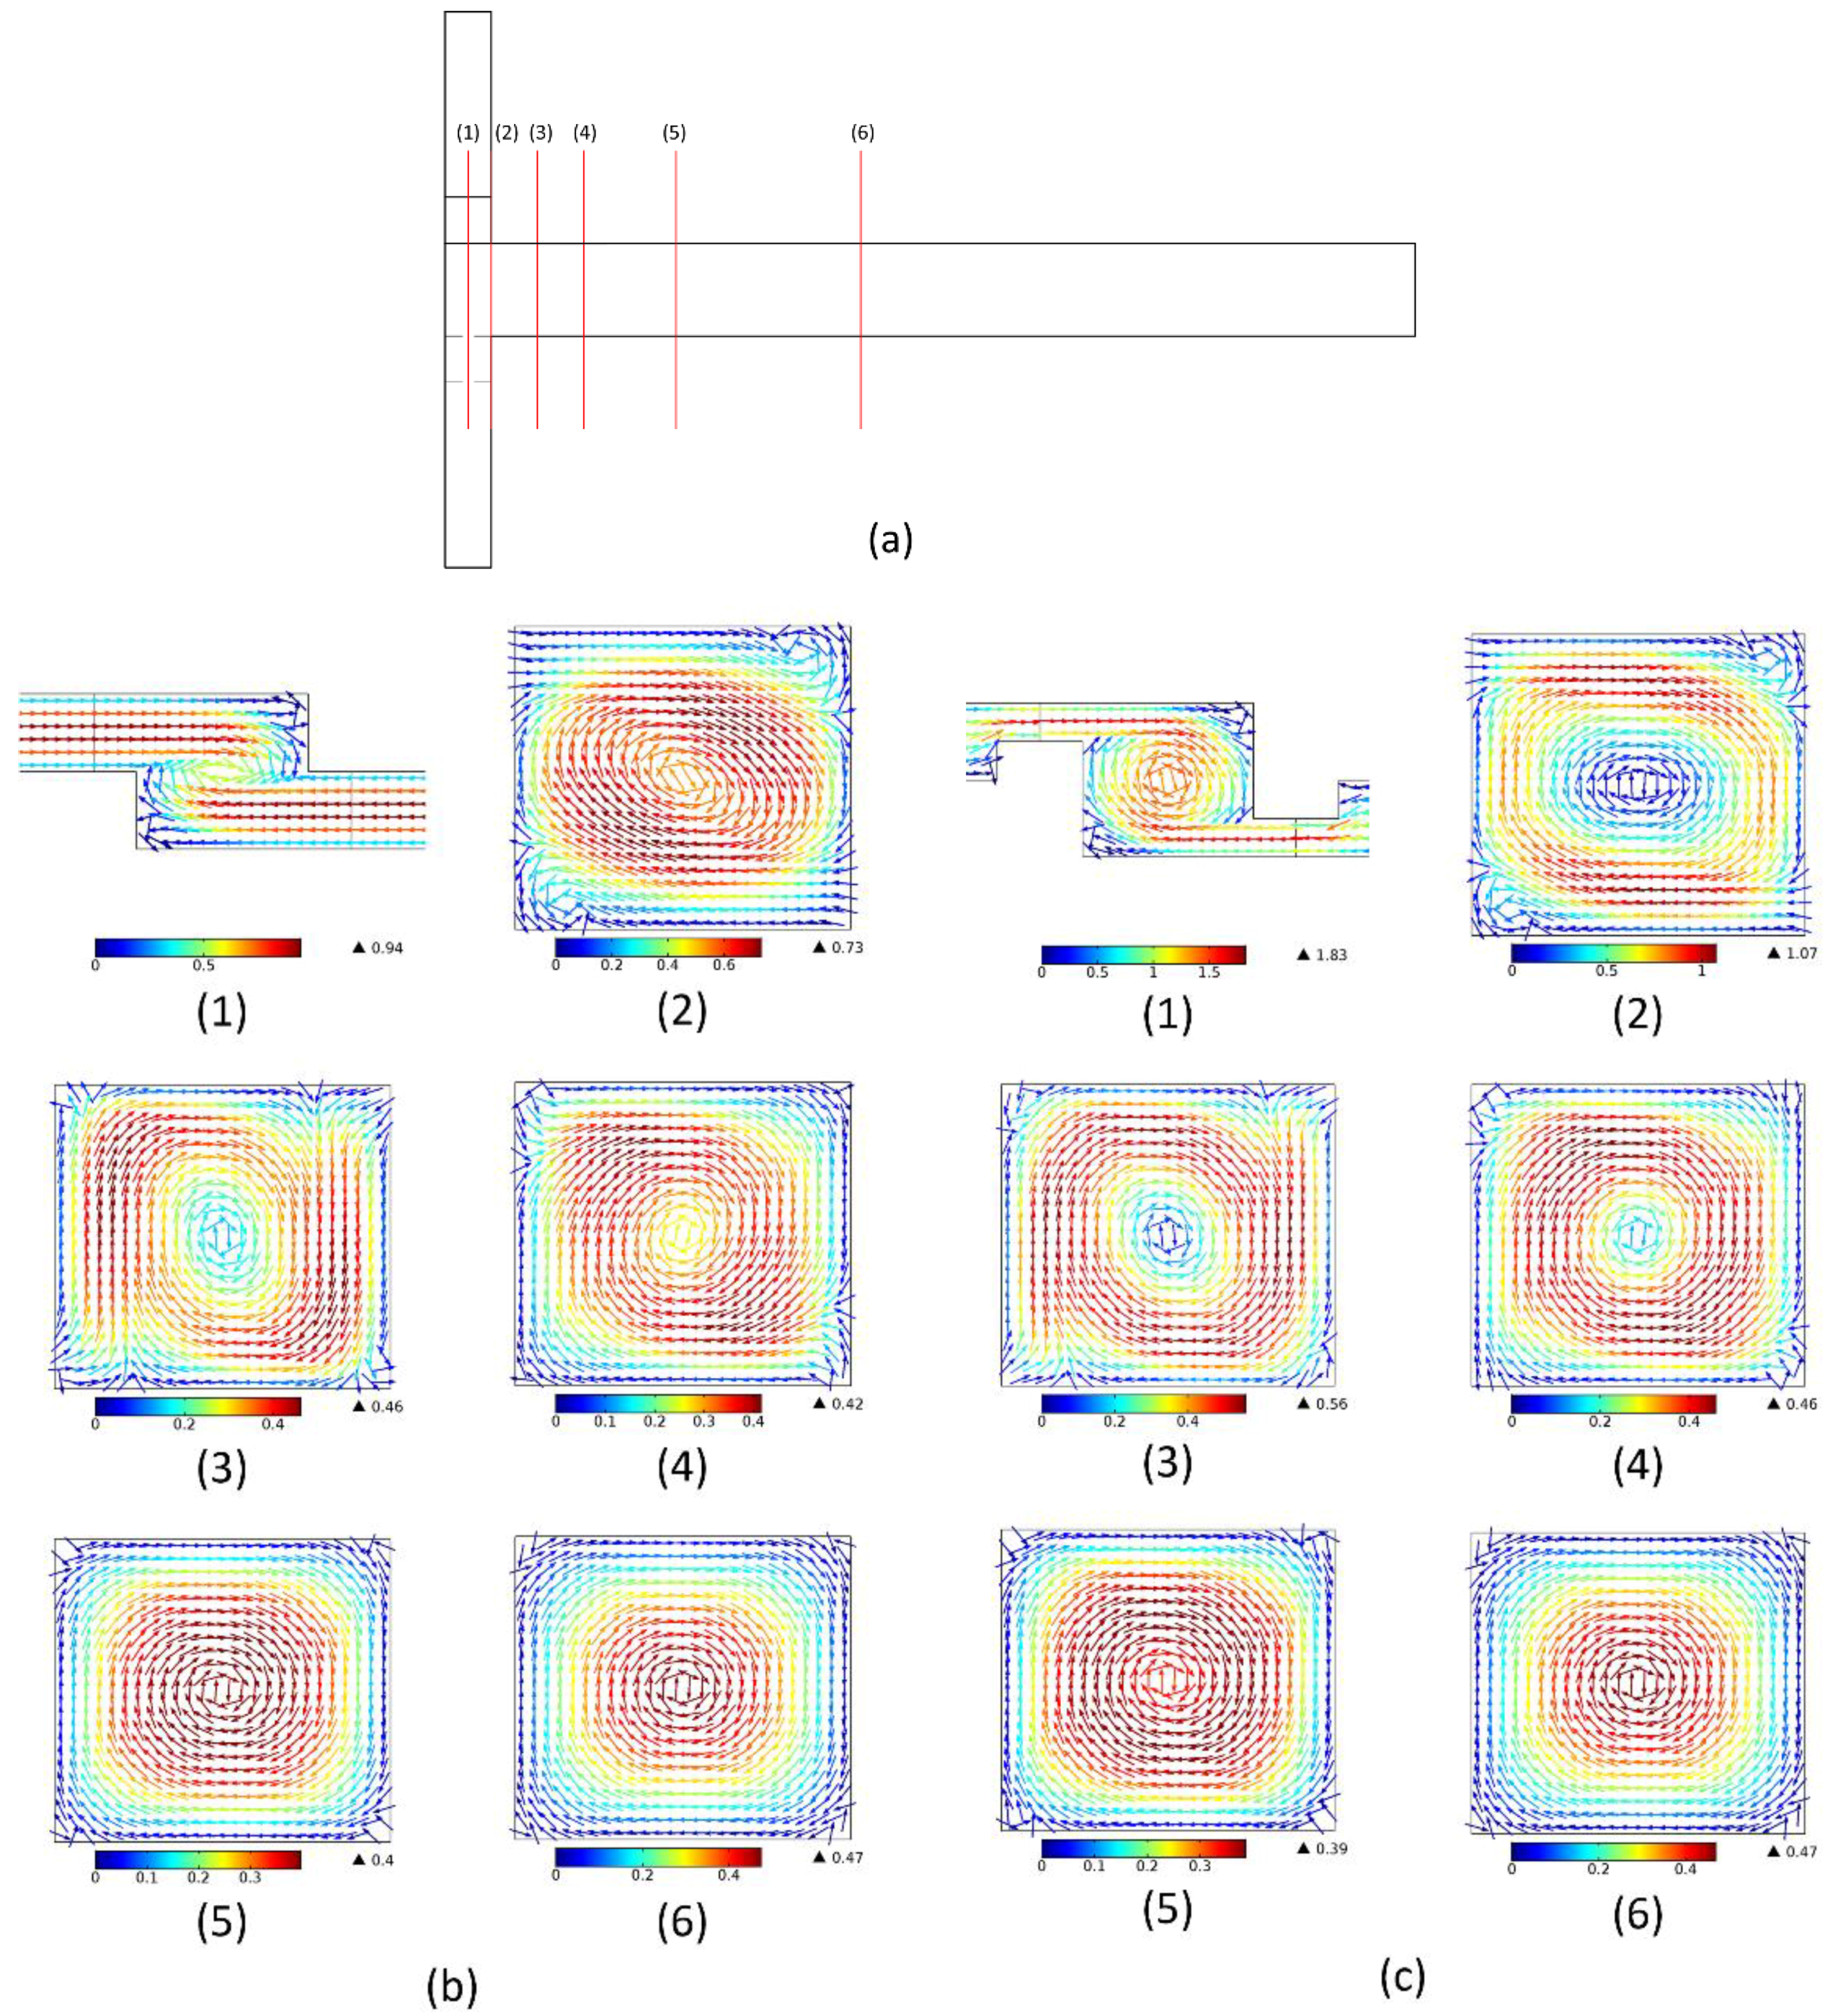
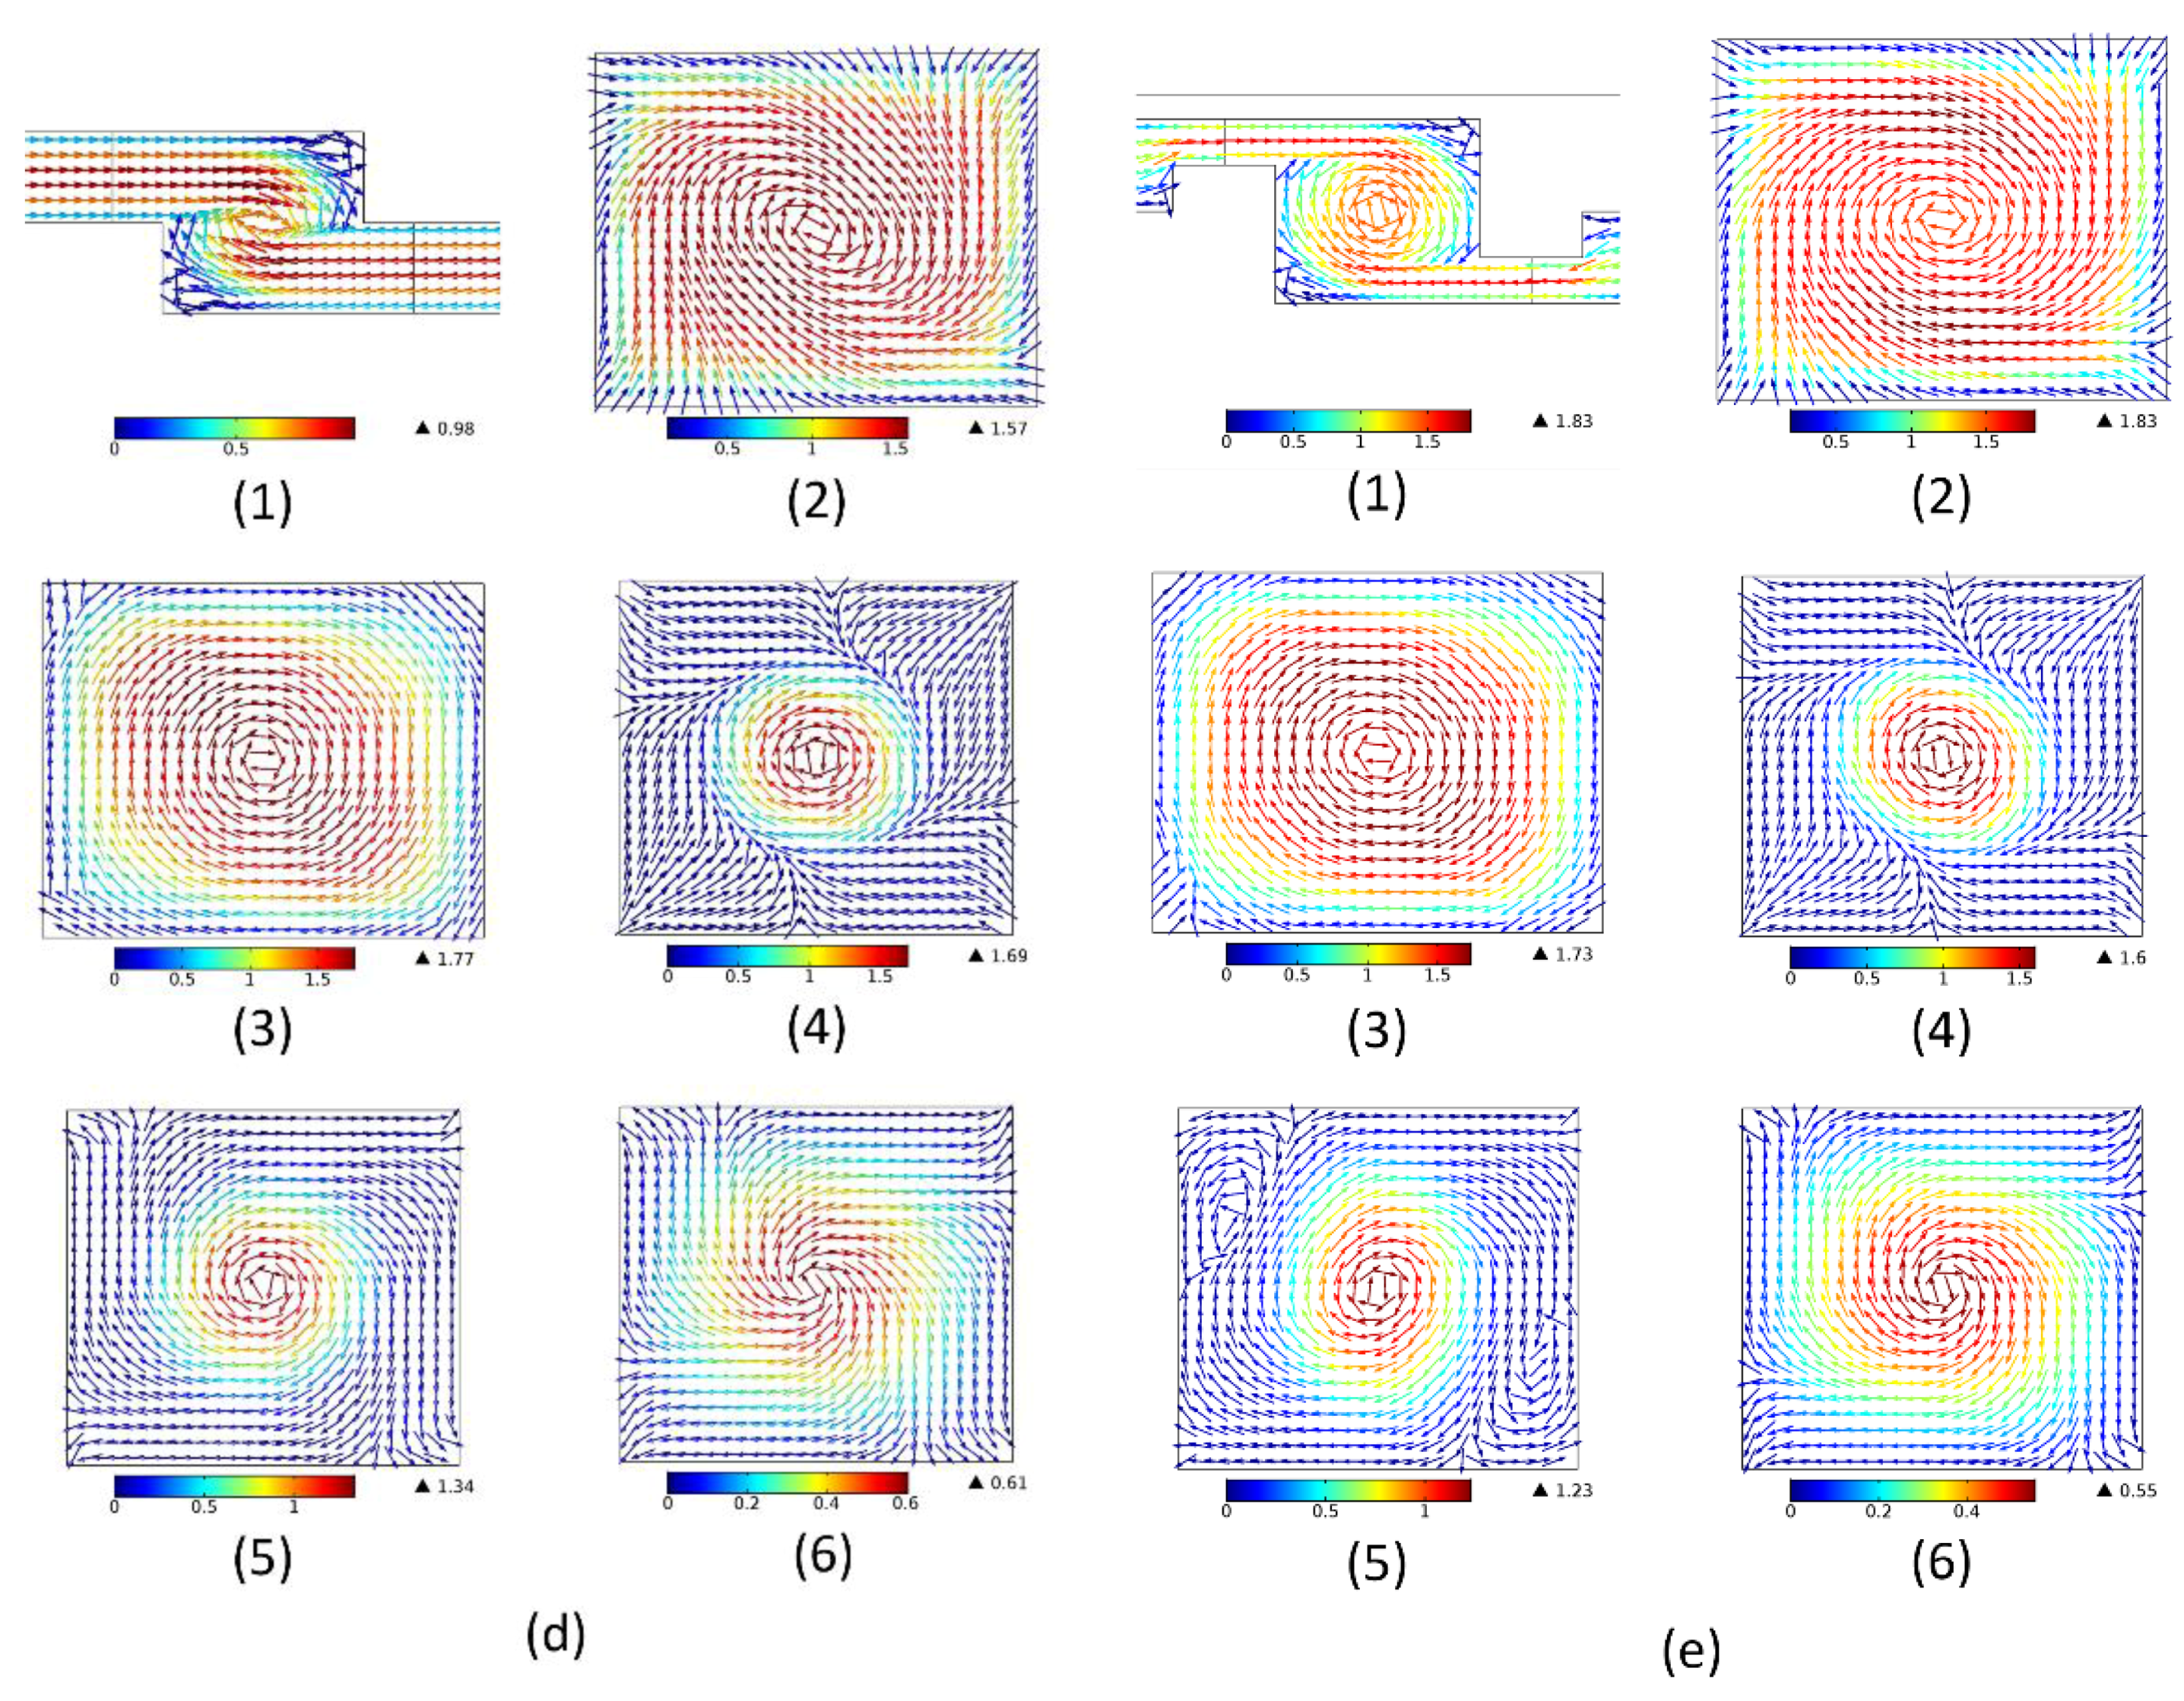
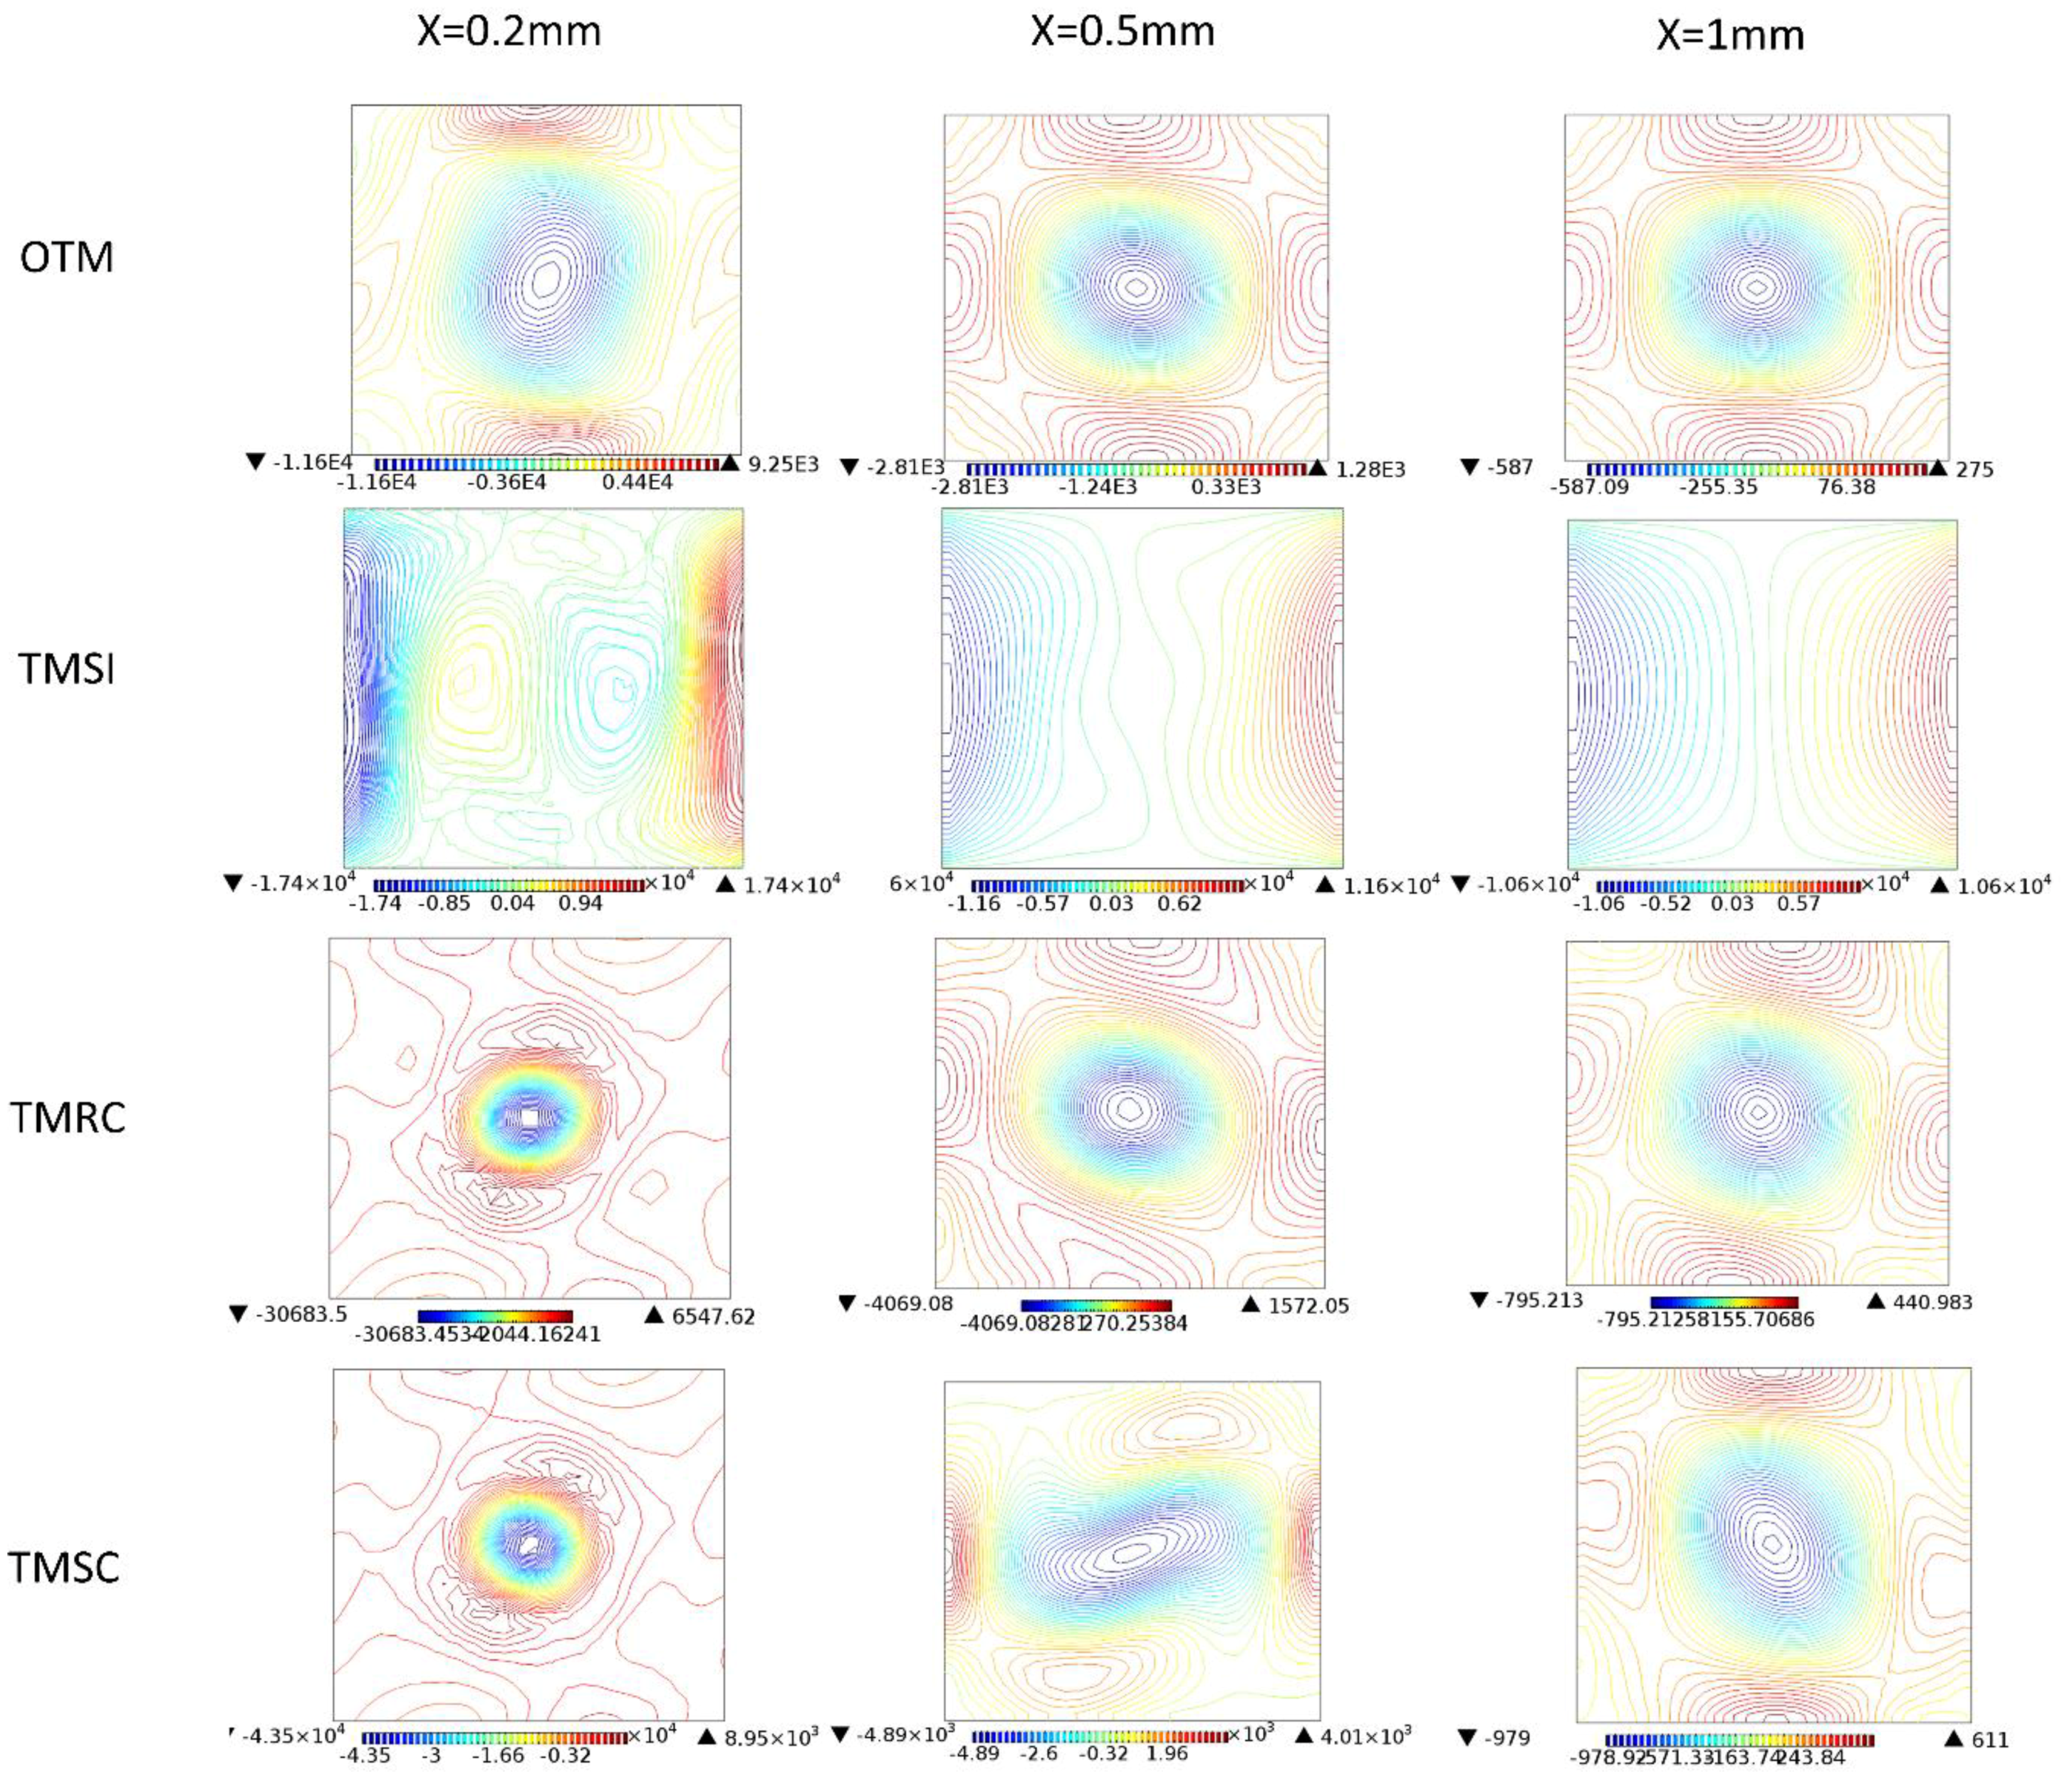
3.4. Flow Characteristics
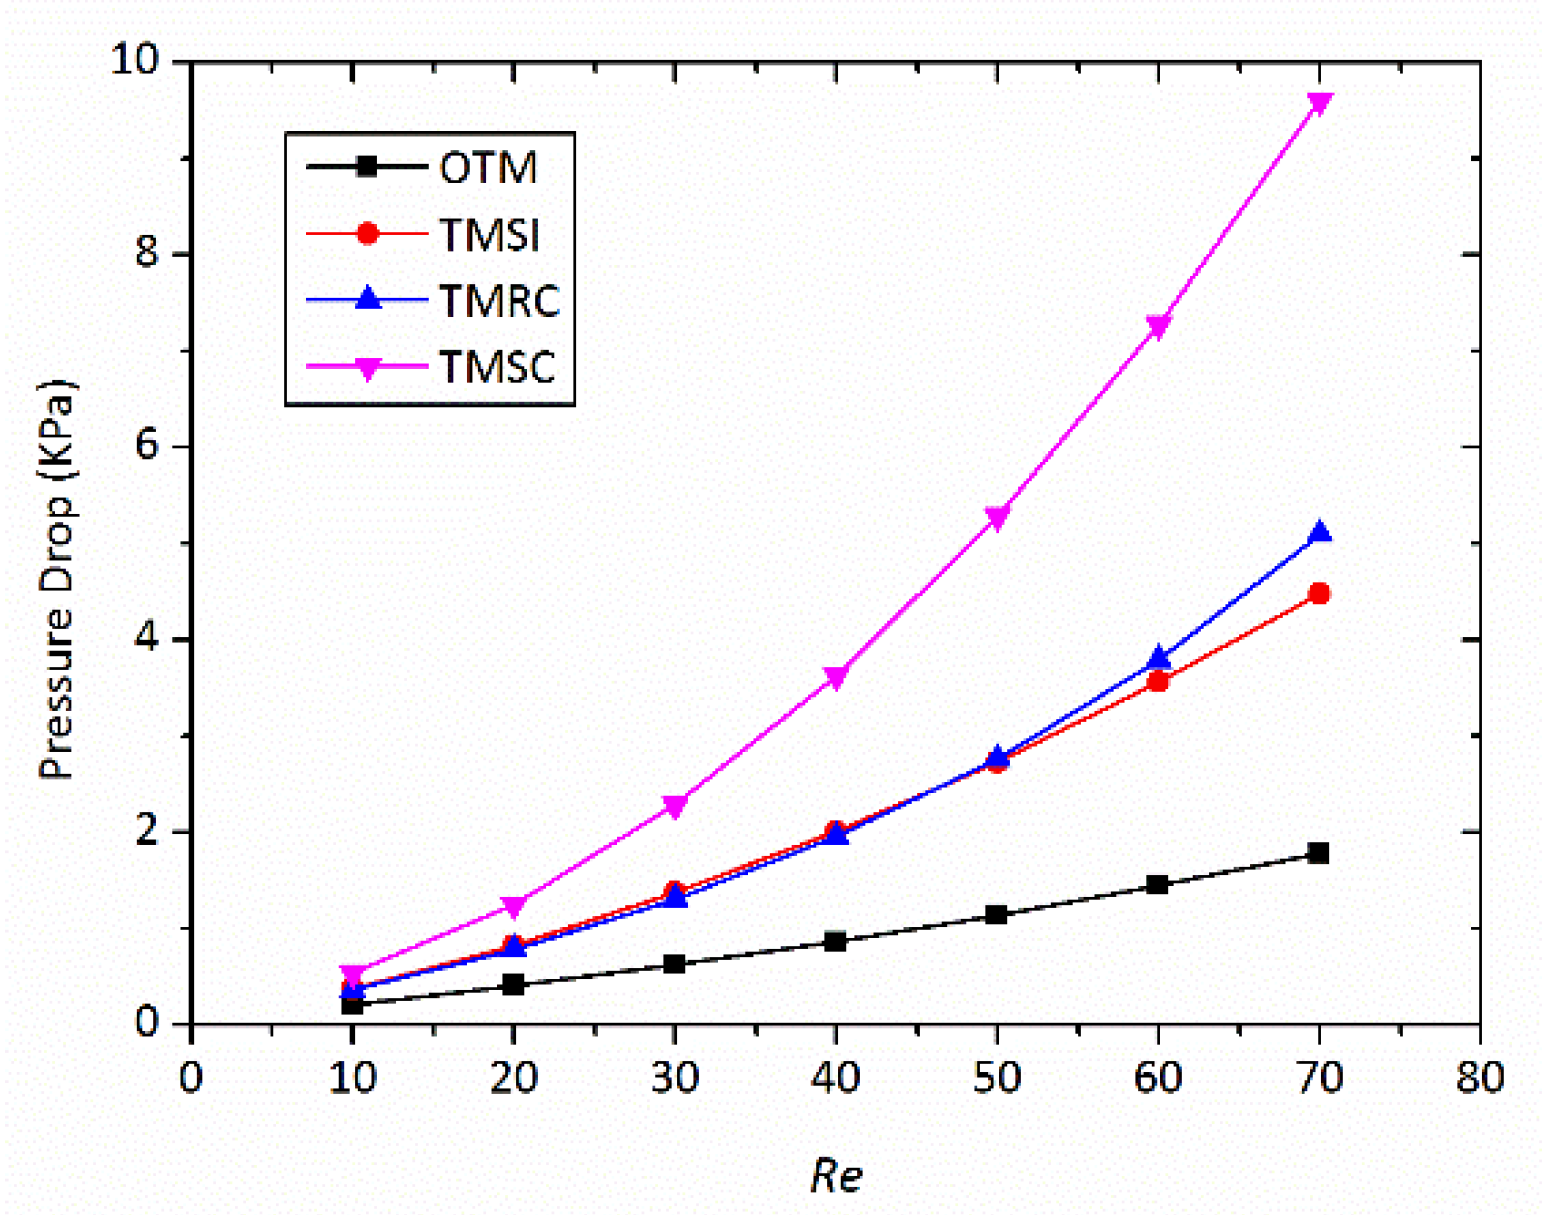
3.5. Pressure Drop
3.6. Micromixer Design
4. Conclusions
Author Contributions
Acknowledgments
Conflicts of Interest
References
- Yang, R.-J.; Fu, L.-M.; Hou, H.-H. Review and Perspectives on Microfluidic Flow Cytometers. Sens. Actuators B Chem. 2018, 266, 26–45. [Google Scholar] [CrossRef]
- Ng, T.N.; Chen, X.Q.; Yeung, K.L. Direct manipulation of particle size and morphology of ordered mesoporous silica by flow synthesis. RSC Adv. 2015, 5, 13331–13340. [Google Scholar] [CrossRef]
- Kolmykov, O.; Commenge, J.M.; Alem, H.; Girot, E.; Mozet, K.; Medjahdi, G.; Schneider, R. Microfluidic reactors for the size-controlled synthesis of ZIF-8 crystals in aqueous phase. Mater. Des. 2017, 122, 31–41. [Google Scholar] [CrossRef]
- Othman, R.; Vladisavljević, G.T.; Nagy, Z.K. Preparation of biodegradable polymeric nanoparticles for pharmaceutical applications using glass capillary microfluidics. Chem. Eng. Sci. 2015, 137, 119–130. [Google Scholar] [CrossRef] [Green Version]
- Karle, M.; Vashist, S.K.; Zengerle, R.; Stetten, F. Microfluidic solutions enabling continuous processing and monitoring of biological samples: A review. Anal. Chim. Acta 2016, 929, 1–22. [Google Scholar] [CrossRef] [PubMed]
- Basha, I.H.K.; Ho, E.T.W.; Yousuff, C.M.; Hamid, N.H.B. Towards Multiplex Molecular Diagnosis—A Review of Microfluidic Genomics Technologies. Micromachines 2017, 8, 266. [Google Scholar] [CrossRef]
- Sun, Y.; Haglund, T.A.; Rogers, A.J.; Ghanim, A.F.; Sethu, P. Review: Microfluidics technologies for blood-based cancer liquid biopsies. Anal. Chim. Acta 2018, 1012, 10–29. [Google Scholar] [CrossRef] [PubMed]
- Huang, P.H.; Xie, Y.; Ahmed, D.; Rufo, J.; Nama, N.; Chen, Y.; Chan, C.Y.; Huang, T.J. An acoustofluidic micromixer based on oscillating sidewall sharp-edges. Lab Chip 2013, 13, 3847. [Google Scholar] [CrossRef] [PubMed]
- Barani, A.; Paktinat, H.; Janmaleki, M.; Mohammadi, A.; Mosaddegh, P.; Fadaei-Tehrani, A.; Sanati-Nezhad, A. Microfluidic integrated acoustic waving for manipulation of cells and molecules. Biosensors Bioelectronics 2016, 85, 714–725. [Google Scholar] [CrossRef] [PubMed]
- Nama, N.; Huang, P.H.; Huang, T.J.; Costanzo, F. Investigation of micromixing by acoustically oscillated sharp-edges. Biomicrofluidics 2016, 10, 96–106. [Google Scholar] [CrossRef] [PubMed]
- Kok, B.; Firat, M.; Oztop, H.F.; Varol, Y. A numerical study on thermal mixing in narrow channels inserted rectangular bodies. Int. Commun. Heat Mass Transf. 2013, 44, 69–76. [Google Scholar] [CrossRef]
- Cho, C.C.; Ho, C.J.; Chen, C.K. Enhanced micromixing of electroosmotic flows using aperiodic time-varying zeta potentials. Chem. Eng. J. 2010, 163, 180–187. [Google Scholar] [CrossRef]
- Rashidi, S.; Bafekr, H.; Valipour M, S.; Esfahani, J.A. A review on the application, simulation, and experiment of the electrokinetic mixers. Chem. Eng. Process. Process Intensif. 2018, 126, 108–122. [Google Scholar] [CrossRef]
- Azimi, N.; Rahimi, M.; Abdollahi, N. Using magnetically excited nanoparticles for liquid-liquid two-phase mass transfer enhancement in a Y-type micromixer. Chem. Eng. Process. Process Intensif. 2015, 97, 12–22. [Google Scholar] [CrossRef]
- Yang, R.-J.; Hou, H.-H.; Wang, Y.-N.; Fu, L.-M. Micro-magnetofluidics in microfluidic systems: A review. Sens. Actuators B Chem. 2016, 224, 1–15. [Google Scholar] [CrossRef]
- Boroun, S.; Larachi, F. Role of magnetic nanoparticles in mixing, transport phenomena and reaction engineering—challenges and opportunities. Curr. Opin. Chem. Eng. 2016, 13, 91–99. [Google Scholar] [CrossRef]
- Shan, C.; Chen, F.; Yang, Q.; Jiang, Z.; Hou, X. 3D Multi-Microchannel Helical Mixer Fabricated by Femtosecond Laser inside Fused Silica. Micromachines 2018, 9, 29. [Google Scholar] [CrossRef]
- Schikarski, T.; Peukert, W.; Avila, M. Direct numerical simulation of water-ethanol flows in a T-mixer. Chem. Eng. J. 2017, 324, 168–181. [Google Scholar] [CrossRef]
- Mariotti, A.; Galletti, C.; Mauri, R.; Salvetti, M.V.; Brunazzi, E. Steady and unsteady regimes in a T-shaped micro-mixer: Synergic experimental and numerical investigation. Chem. Eng. J. 2018, 341, 414–431. [Google Scholar] [CrossRef]
- Andreussi, T.; Galletti, C.; Mauri, R.; Camarri, S.; Salvetti, M.V. Flow regimes in T-shaped micro-mixers. Comput. Chem. Eng. 2015, 76, 150–159. [Google Scholar] [CrossRef]
- Clark, J.; Kaufman, M.; Fodor, P.S. Mixing Enhancement in Serpentine Micromixers with a Non-Rectangular Cross-Section. Micromachines 2018, 9, 107. [Google Scholar] [CrossRef]
- Afzal, A.; Kim, K.Y. Flow and mixing analysis of non-Newtonian fluids in straight and serpentine microchannels. Chem. Eng. Sci. 2014, 116, 263–274. [Google Scholar] [CrossRef]
- Javaid, M.U.; Cheema, T.A.; Park, C.W. Analysis of Passive Mixing in a Serpentine Microchannel with Sinusoidal Side Walls. Micromachines 2017, 9, 8. [Google Scholar] [CrossRef]
- Raza, W.; Ma, S.B.; Kim, K.Y. Multi-Objective Optimizations of a Serpentine Micromixer with Crossing Channels at Low and High Reynolds Numbers. Micromachines 2018, 9, 110. [Google Scholar] [CrossRef]
- Chung, C.K.; Chang, C.K.; Lai, C.C. Simulation and fabrication of a branch-channel rhombic micromixer for low pressure drop and short mixing length. Microsyst. Technol. 2014, 20, 1981–1986. [Google Scholar] [CrossRef]
- D’Alessandro, J.; Fodor, P.S. Use of Grooved Microchannels to Improve the Performance of Membrane-Less Fuel Cells. Fuel Cells 2015, 14, 818–826. [Google Scholar] [CrossRef]
- Wang, D.; Ba, D.; Liu, K.; Hao, M.; Gao, Y.; Wu, Z.; Mei, Q. A Numerical Research of Herringbone Passive Mixer at Low Reynold Number Regime. Micromachines 2017, 8, 325. [Google Scholar] [CrossRef]
- Ritter, P.; Osorio-Nesme, A.; Delgado, A. 3D numerical simulations of passive mixing in a microchannel with nozzle-diffuser-like obstacles. Int. J. Heat Mass Transf. 2016, 101, 1075–1085. [Google Scholar] [CrossRef]
- Chen, X.; Zhao, Z. Numerical investigation on layout optimization of obstacles in a three-dimensional passive micromixer. Anal. Chim. Acta 2017, 964, 142–149. [Google Scholar] [CrossRef] [PubMed]
- Matsunaga, T.; Nishino, K. Swirl-inducing inlet for passive micromixers. RSC Advances 2013, 4, 824–829. [Google Scholar] [CrossRef]
- Santana, H.S.; Júnior, J.L.S.; Taranto, O.P. Numerical simulations of biodiesel synthesis in microchannels with circular obstructions. Chem. Eng. Process. Process Intensif. 2015, 98, 137–146. [Google Scholar] [CrossRef]
- Cortes-Quiroz, C.A.; Azarbadegan, A.; Zangeneh, M. Characterization and Optimization of a Three-Dimensional T-Type Micromixer for Convective Mixing Enhancement with Reduced Pressure Loss. In Proceedings of the ASME 2010 8th International Conference on Nanochannels, Microchannels, and Minichannels, Montreal, QC, Canada, 1–5 August 2010. [Google Scholar]
- Cortes-Quiroz, C.A.; Azarbadegan, A.; Zangeneh, M. Evaluation of flow characteristics that give higher mixing performance in the 3-D T-mixer versus the typical T-mixer. Sens. Actuators B Chem. 2014, 202, 1209–1219. [Google Scholar] [CrossRef] [Green Version]
- Cortes-Quiroz C, A.; Azarbadegan, A.; Zangeneh, M. Effect of channel aspect ratio of 3-D T-mixer on flow patterns and convective mixing for a wide range of Reynolds number. Sens. Actuators B Chem. 2017, 239, 1153–1176. [Google Scholar] [CrossRef]
- Ansari, M.A.; Kim, K.Y.; Anwar, K. Vortex micro T-mixer with non-aligned inputs. Chem. Eng. J. 2012, 181–182, 846–850. [Google Scholar] [CrossRef]
- Rabani, R.; Talebi, S.; Rabani, M. Numerical analysis of lamination effect in a vortex micro T-mixer with non-aligned inputs. Heat Mass Transf. 2016, 52, 611–619. [Google Scholar] [CrossRef]
- Siconolfi, L.; Fani, A.; Camarri, S.; Salvetti, M.V. Effect of geometry modifications on the engulfment in micromixers: Numerical simulations and stability analysis. Eur. J. Mech. 2016, 55, 360–366. [Google Scholar] [CrossRef]
- You, J.B.; Choi, Y.; Im, S.G. Influence of adjusting the inlet channel confluence angle on mixing behaviour in inertial microfluidic mixers. Microfluidics Nanofluidics 2017, 21, 121. [Google Scholar] [CrossRef]
- Hossain, S.; Kim, K.Y. Mixing performance of a serpentine micromixer with non-aligned inputs. Micromachines 2015, 6, 842–854. [Google Scholar] [CrossRef]
- Xia, G.D.; Li, Y.F.; Wang, J.; Zhai, Y.L. Numerical and experimental analyses of planar micromixer with gaps and baffles based on field synergy principle. Int. Commun. Heat Mass Transf. 2016, 71, 188–196. [Google Scholar] [CrossRef]
- Lu, Y.C.; Zhu, S.; Wang, K.; Luo, G. Simulation of the mixing process in a straight tube with sudden changed cross-section. Chin. J. Chem. Eng. 2016, 24, 711–718. [Google Scholar] [CrossRef]
- Wu, Z.; Nguyen, N.T.; Huang, X. Nonlinear diffusive mixing in microchannels: Theory and experiments. J. Micromech. Microeng. 2004, 14, 604–611. [Google Scholar] [CrossRef]
- Tran-Minh, N.; Karlsen, F.; Tao, D.; Le-The, H. A Simple and Low Cost Micromixer for Laminar Blood Mixing: Design, and Analysis. Biomed. Inform. Technol. 2014, 404, 91–104. [Google Scholar]
- Chen, X.; Shen, J. Numerical analysis of mixing behaviors of two types of E-shape micromixers. Int. J. Heat Mass Transf. 2016, 106, 593–600. [Google Scholar] [CrossRef]
- Falk, L.; Commenge, J. Characterization of Mixing and Segregation in Homogeneous Flow Systems. In Micro Process Engineering: A Comprehensive Handbook; Wiley-VCH Verlag GmbH & Co. KGaA: Weinheim, Germany, 2013; Volumes 1–3, pp. 145–173. [Google Scholar]
- Falk, L.; Commenge, J.M. Performance comparison of micromixers. Chem. Eng. Sci. 2010, 65, 405–411. [Google Scholar] [CrossRef]


| Type | W3/µm | H3/µm | W4/µm | H4/µm | L4/µm |
|---|---|---|---|---|---|
| OTM | - | - | - | - | - |
| TMSI | 100 | 50 | - | - | - |
| TMRC | - | - | 100 | 90 | 150 |
| TMSC | 100 | 50 | 90 | 90 | 150 |
© 2018 by the authors. Licensee MDPI, Basel, Switzerland. This article is an open access article distributed under the terms and conditions of the Creative Commons Attribution (CC BY) license (http://creativecommons.org/licenses/by/4.0/).
Share and Cite
Zhang, J.; Luo, X. Mixing Performance of a 3D Micro T-Mixer with Swirl-Inducing Inlets and Rectangular Constriction. Micromachines 2018, 9, 199. https://doi.org/10.3390/mi9050199
Zhang J, Luo X. Mixing Performance of a 3D Micro T-Mixer with Swirl-Inducing Inlets and Rectangular Constriction. Micromachines. 2018; 9(5):199. https://doi.org/10.3390/mi9050199
Chicago/Turabian StyleZhang, Jinxin, and Xiaoping Luo. 2018. "Mixing Performance of a 3D Micro T-Mixer with Swirl-Inducing Inlets and Rectangular Constriction" Micromachines 9, no. 5: 199. https://doi.org/10.3390/mi9050199