Article

Crystal Structure and Computational Study on Methyl-3-Aminothiophene-2-Carboxylate

1
Key Laboratory of Electromagnetic Transformation and Detection of Henan province, College of Physics and Electronic Information, Luoyang Normal University, Luoyang 471934, China
2
College of Science, Langfang Normal University, Langfang 065000, China
3
School of Chemistry and Chemical Engineering, Hunan University of Science and Technology, Xiangtan 411201, China
*
Authors to whom correspondence should be addressed.
Crystals 2020, 10(1), 19; https://doi.org/10.3390/cryst10010019
Submission received: 17 November 2019 / Revised: 16 December 2019 / Accepted: 17 December 2019 / Published: 1 January 2020

Abstract

:
Methyl-3-aminothiophene-2-carboxylate (matc) is a key intermediate in organic synthesis, medicine, dyes, and pesticides. Single crystal X-ray diffraction analysis reveals that matc crystallizes in the monoclinic crystal system P21/c space group. Three matc molecules in the symmetric unit are crystallographically different and further linked through the N–H⋯O and N–H⋯N hydrogen bond interactions along with weak C–H⋯S and C–H⋯Cg interactions, which is verified by the three-dimensional Hirshfeld surface, two-dimensional fingerprint plot, and reduced density gradient (RDG) analysis. The interaction energies within crystal packing are visualized through dispersion, electrostatic, and total energies using three-dimensional energy-framework analyses. The dispersion energy dominates in crystal packing. To better understand the properties of matc, electrostatic potential (ESP) and frontier molecular orbitals (FMO) were also calculated and discussed. Experimental and calculation results suggested that amino and carboxyl groups can participate in various inter- and intra-interactions.

1. Introduction

Methyl-3-aminothiophene-2-carboxylate (matc) is a significantly important intermediate in pharmaceutical products such as anti-hypertensives [1,2], antitumors [3], anti-HIV-1 integrase [4], human cytomegalovirus inhibitors [5], hepatitis C virus inhibitors [6], Xa factor inhibitors [7], antineoplastic PAK4 activase inhibitors [8], phosphatidylinositol 3-kinase PI3K inhibitors [9], and antithrombotic activity drugs [10]. It is also a key starting material in agrochemical products, providing herbicidal protection through thiafulone or the sulfonylurea herbicide [11]. Moreover, compounds containing thiophene can serve as crucial precursors for a variety of functional materials of luminescence, redox, non-linear optical discoloration, and electronic transport, owing to their highly photophysical properties [10,12]. In addition, it is worth noting that it can be used as the starting material to obtain various thiophenic structures [11,13] with extremely reactive properties. Although matc is of academic and practical interest, its molecular structure is still unclear, to the best of our knowledge.
The melting point of matc is about 63–64 °C [14]. Thus, it is in the solid state at room temperature, which favors the determination of the crystal structure. In view of its crucial role, we reported herein the crystal structure and hydrogen bonds of matc using X-ray crystallography, which is the key to understanding the functions and properties of organic molecules. Based on the experimental results, a Hirshfeld surface and a fingerprint plot were generated to explore the intermolecular interactions in the crystalline structure, while the reduced density gradient (RDG) was calculated to analyze the intermolecular interaction in the matc trimer. On the other hand, the significant local extrema of electrostatic potential (ESP) on the vdW surface and the composition of HOMO and LUMO were analyzed to point out the attack sites of nucleophilic and electrophilic reactions. We hope that our results can provide some basis for the deeper understanding of matc.

2. Experimental Details

2.1. Materials and Methods

Commercial matc was dissolved in ethanol, and then the obtained solution was filtered for slow evaporation at 25 °C. After one day, yellow sticked-shape crystals were examined under an optical microscope and collected.
Crystal diffraction data were collected on a Rigaku XtaLAB synergy four-circle diffractometer (Rigaku Corporation, Japan) with CuKα (λ = 1.54184) radiation. Absorption corrections were applied by the CrysAlis PRO softeware (Rigaku Oxford Diffraction, 2015, Yarnton, UK) [15] for data reduction and analysis. Crystal structures were solved by direct methods and refined by the full-matrix least-squares method on F2 using SHELXL-2016 (University of Göttingen, Version 2016, Germany) [16] algorithms in Olex2 (Durham University, 2009, UK) [17]. All non-hydrogen atoms were refined with anisotropic displacement parameters. The positions of the H-atoms of NH2 and methyl groups were identified in difference Fourier maps with Uiso(H) = 1.2Ueq(N) and Uiso(H) = 1.5Ueq(C), and those of the ring were geometrically refined using a riding model with Uiso(H) = 1.2Ueq(C). The structure refinement parameters are summarized in Table 1. In addition, the as-synthesized solid samples were also analyzed using powder X-ray diffraction to ensure that no polymorphic transformations occurred.

2.2. Computational Methods

The experimentally determined crystal structure was used as the initial geometry for Density Functional Theory (DFT) calculation, using the Gaussian 09 program package (Gaussian Inc., revision D.01, Wallingford, USA) [18] in the gas phase. The three-dimensional Hirshfeld surfaces [19] and two-dimensional fingerprint plots [20] of the structures were obtained by using the CrystalExplorer 17.5 software (The University of Western Australia, Version 17.5, Perth, Australia) [21]. The intermolecular interaction energy for the cluster with a radius of 3.8 Å around the central molecule was performed by the CrystalExplorer 17.5 software with embedded B3LYP/6-31G** level. In order to deeply analyze structure and excitation characteristics, the geometry optimization of the matc monomer was carried out at the B3LYP/def-2TZVP level. The evaluation of ESP distribution, the calculation of orbital composition, and the variety of electron density difference were made via the Multiwfn 3.7 program (Beijing Kein Research Center for Natural Sciences, Version 3.7, Beijing, China) [22]. Additionally, the reduced density gradient (RDG) analysis, the isosurface of molecular orbital, and the ESP-mapped vdW surface were rendered using the VMD 1.9.1 program (University of Illinois and Beckman Institute, Version 1.9.1, Urbana, USA) [23].

3. Results and Discussion

3.1. Crystal Structural Descriptions

Crystal structural determination revealed that matc crystallizes in the monoclinic crystal system P21/c space group. Its asymmetric unit consists of three crystallographically independent matc molecules, as depicted in Figure 1. Generally, The C=O groups were located in the same plane as the ring, and all of the C–S, C–N, and C–O bond lengths fell within the ranges of 1.7113(19)–1.7395(16), 1.347(2)–1.354(2), and 1.344(2)–1.446(2) Å, respectively. All three matc molecules were almost structurally identical, and only a very slight difference was found (Tables S1 and S2, See Supplementary Materials). Amongst them, deviations on the bond distances and angles of the N–H and C–H groups were obvious due to the difference in the refining method, and the largest distance between analogous atoms in superimposed molecules was about 0.063 Å. Additionally, the C=O bond lengths were 1.226(2), 1.222(2), and 1.219(2) Å, respectively, due to the strong hydrogen bonds. A simple survey revealed that the related compounds [24,25,26] containing the 3-methoxy-2-thiophenamine fragment often had the intramolecular N–H⋯O hydrogen bond, forming a seven-membered ring. This is a benefit due to the amine and carbonyl groups that are on the same side as thiophene. The strong N–H⋯O and N–H⋯N hydrogen bond interaction, as shown in Figure 2 and Table 2, was responsible for the crystal packing. All of the three molecules in the asymmetric unit exhibited an S(6) motif by an intramolecular N–H⋯O–C hydrogen bond. These three molecules were further linked together by two intermolecular N–H⋯O hydrogen bonds and one N–H⋯N hydrogen bond, leading to the three common D motifs. Hence, the first-level graph set was DDDS(6)S(6)S(6). Based on the intermolecular N–H⋯O hydrogen bonds, the basic motif in this structure was an infinite chain including all three crystallographically independent molecules. Intermolecular N–H⋯N interaction joined this helical chain with a similar helical chain into a double chain running in the b-axis direction (Figure S1). Further, a weak C–H⋯S contact with a distance of 3.5794(18) Å between C and S atoms, along with C–H⋯Cg interactions, stabilized the crystal 3-D packing (Table 2 and Figure S1), where Cg is the centroid of the thiophene ring.

3.2. Hirshfeld Surface Analysis and Fingerprint Plots

The Hirshfeld surface analysis combined with fingerprint plots is a powerful tool to explore intermolecular interactions [27,28]. As shown in Figure 3, the bright red spots on the Hirshfeld surface correspond to N–H⋯O hydrogen bonds involving O⋯H/H⋯O contacts. These contacts are represented by two large spikes at the bottom of the fingerprint plot (Figure S2). The H⋯H contacts were the highest contribution to the molecular packing due to the abundance of hydrogen on the molecular surface [29,30,31,32]. Due to a significantly long distance and the prominent role of van der Waals interactions, the C⋯H/H⋯C and S⋯H/H⋯S contacts were not visible on the Hirshfeld surfaces. The N⋯H/H⋯N interactions were about the N–H⋯N hydrogen bonds, characterized by two small spikes on the sides of the fingerprint plot. The other minor contacts, such as C⋯S/S⋯C and S⋯O/O⋯S contacts, were only a very small contribution to the Hirshfeld surface in crystal. The percentage contributions of each interaction to the Hirshfeld surface are depicted in Figure 4.
In order to understand the nature of the intermolecular interaction, energy-framework computational analysis can be used to quantitatively characterize the calculated interaction energy between the molecular pairs in molecular crystals [33,34]. The total interaction energy was calculated by generating the molecular cluster of radius 3.8 Å around the selected three different molecules in the asymmetric unit. The total interaction energies (Etot = −326.6 kJ/mol) can be divided into total electrostatic (Eele = −173.5 kJ/mol), total polarization (Epol = −37.4 kJ/mol), total dispersion (Edis = −392.2 kJ/mol), and total repulsion (Erep = 368.3 kJ/mol). Obviously, the dispersion interaction energy was larger than the electrostatic interaction energy, indicating that the dispersion interaction energy was dominated for an environment of whole three-molecules set interactions. Although dispersion interaction energy was predominant, electrostatic energy was not neglected, and it will be offset by repulsion in every case. Coulomb interaction energy (red), dispersion energy (green), and total interaction energy (blue) between the molecular pairs along the b axis, with respect to the selected molecule, are respectively shown in Figure 5. The absence of the cylinders in a particular direction was ascribed to the exclusion of the interactions below 8 kJ/mol. The highest value of the total energy between the molecular pairs was −29.4 kJ/mol, because the N–H⋯O hydrogen bond of two adjacent molecules significantly increased the electrostatic energy, resulting in greater total intermolecular interaction energy. The visualization of electrostatic and dispersion components shed light on the nature of the intermolecular interaction.

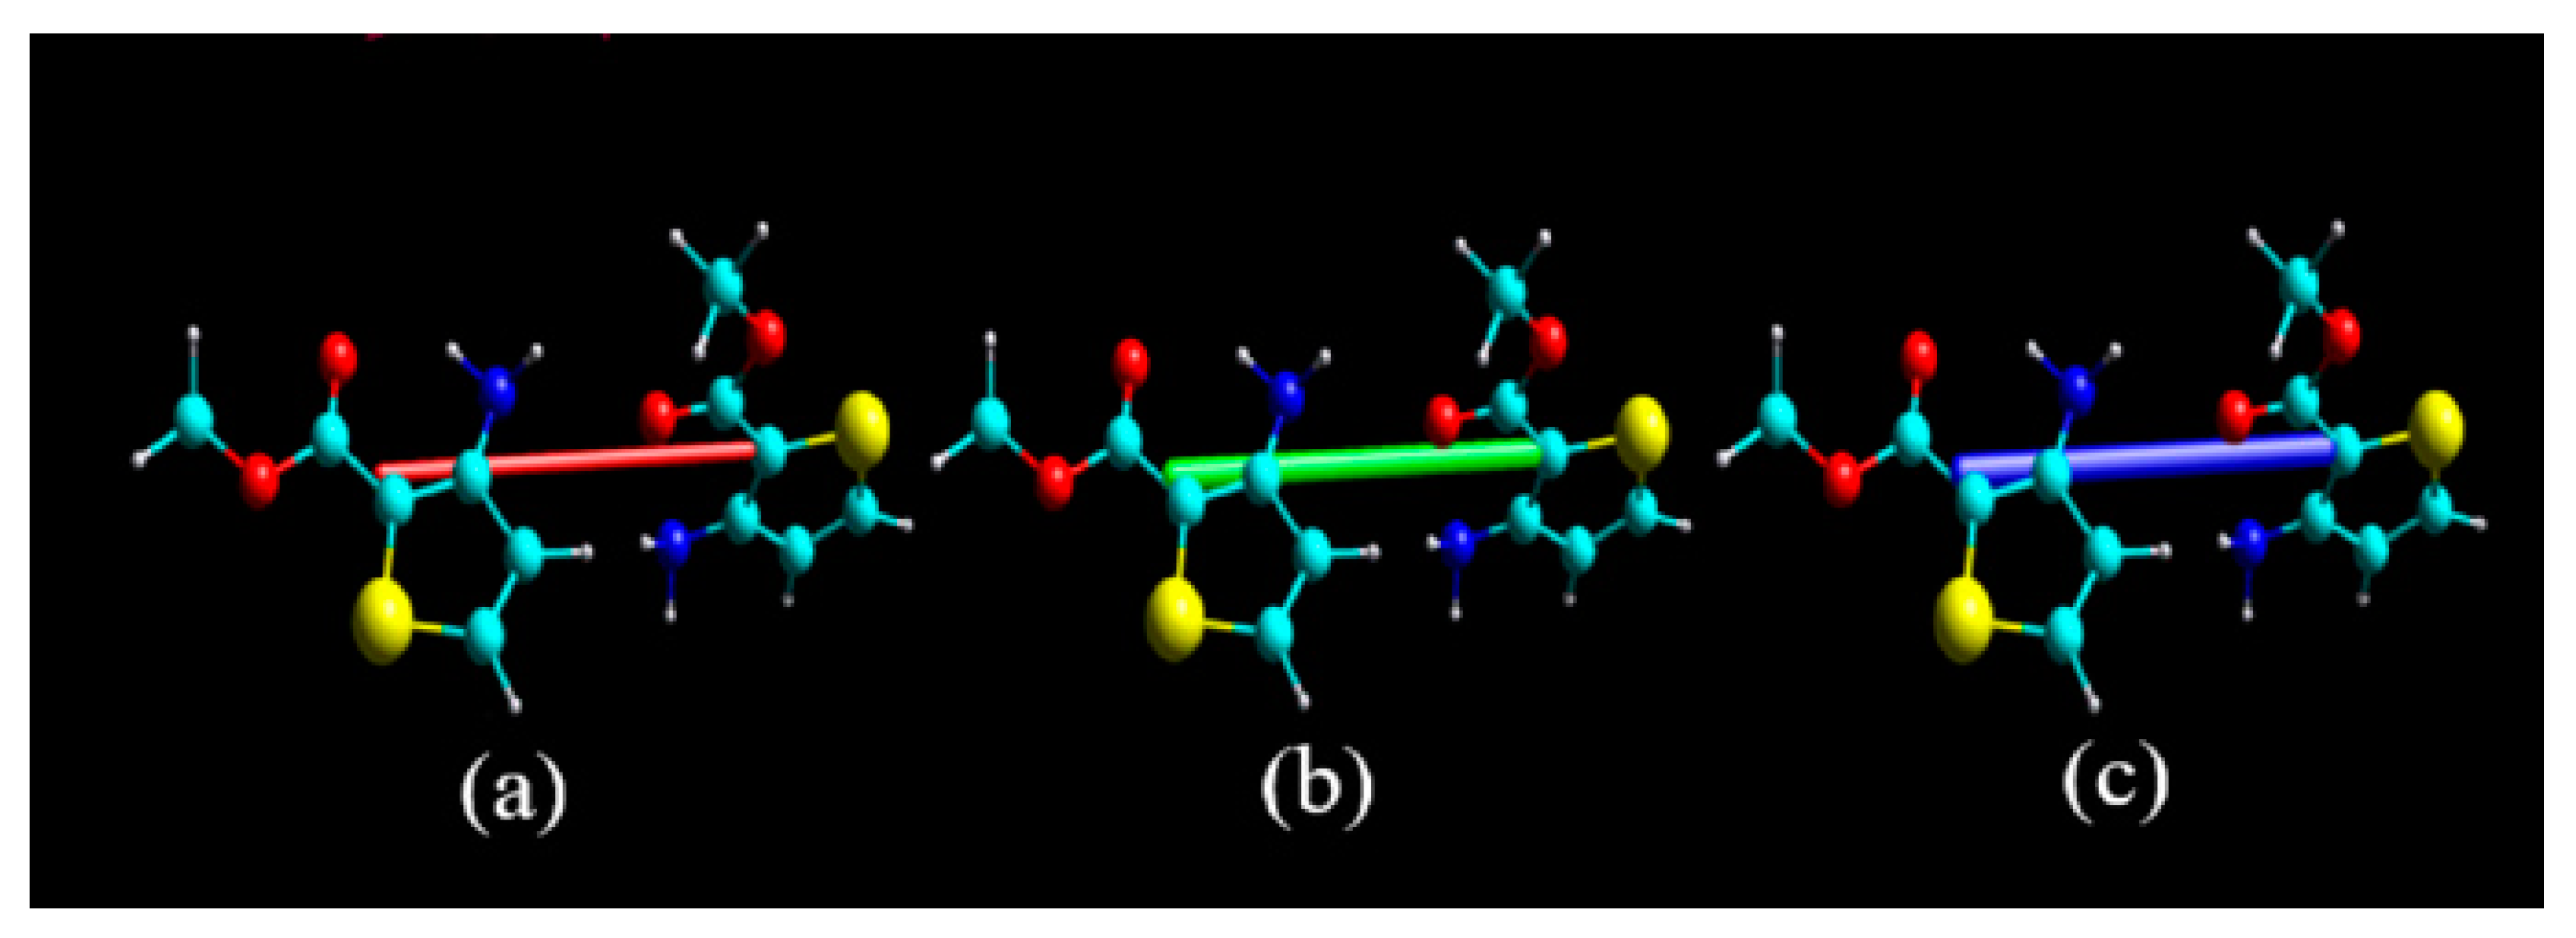
3.3. Reduced Density Gradient Analysis

To analyze weak interactions, the reduced density gradient (RDG) is a popular method [35]. The configuration of a trimer including three matc molecules was optimized at the B3LYP/6-31G* level and analyzed. In Figure 6, the more blue isosurface indicates the stronger hydrogen bonds, while the more red isosurface reveals the larger steric effect, and the green isosurface corresponds to a weak van der Waals interaction. In Figure 6b, a red shuttle-shaped region in the middle of the ring reflects the strong steric hindrance effect, corresponding to the red spike of the scatter plot in Figure 6a. On the RDG isosurface, the blue color between the carboxyl and amino groups of a neighboring molecule implies the formation of an intermolecular N–H⋯O hydrogen bond. Similarly, the formation of N–H⋯N hydrogen bonds can also be seen in the adjacent area. This is in agreement with the determined crystal structure. The color between the carboxyl group oxygen (O) and ring hydrogen (H) of a neighboring molecule is a large area of green flat plate, which embodies the role of van der Waals interactions and intermolecular C–H⋯O contacts.
The intramolecular interactions are also vividly exhibited. The color between the oxygen atom of the carboxyl group and the hydrogen atom of the amino group is half-blue and half-brown, and indicates a weak intramolecular N–H⋯O hydrogen bond and steric hindrance effect. This is also found in the crystal structure of matc. Obviously, amino groups in the matc structure mainly participate in the formation of various interactions in the trimeric unit, and they are generally taken as a starting material for the design of a new inhibitor.

3.4. Electrostatic Potential Surface and Frontier Molecular Orbitals Analysis

The electrostatic potential (ESP) is a very convenient descriptor for understanding sites of electrophilic and nucleophilic reactions and intermolecular interactions [36,37,38]. Figure 7 provides the ESP-mapped vdW surface and surface extrema. The red region indicates the possible site for electrophilic attack, while the blue region for nucleophilic attack. Additionally, it can be seen that the global surface minimum value (−32.64 kcal/mol) was found at the oxygen atom of the carboxyl group, indicating the most favorable site for the positively charged species and the most possible acceptor. Meanwhile, the global surface maximum (39.36 kcal/mol) is about the hydrogen atoms of the amino group, corresponding to the stronger ability to attract negatively charged atoms and to the most possible donor. This observation clearly explained the reason why carboxyl and amino groups could form H-bonds prior to the other group in the matc crystal structure.
The HOMO (highest occupied molecular orbital) and LUMO (lowest unoccupied molecular orbital) are essential in predicting the chemical stability of a molecule [39,40,41]. As seen from Figure S3, both the HOMO and LUMO are mainly delocalized over the thiophene ring and constitute a highly delocalized π bond. The nitrogen atoms of the amino group had a contribution of 27.9% to HOMO, while the carbon atoms of the carboxyl group had a contribution of 14.3% to LUMO. The HOMO–LUMO gap was about 4.537 eV, which implies that matc has a low kinetic stability and a high chemical reactivity.

4. Conclusions

Matc attracted considerable attention in the past many years due to its significant pharmacological activities and photophysical properties, and thus its structure is important for understanding the role of matc in various chemical processes. Our results identified that matc crystallizes in the P21/c space group, and that the N–H⋯O and N–H⋯N hydrogen bond interactions, along with other weak interactions, stabilize the crystal packing. This fact is further verified by the three-dimensional Hirshfeld surface, two-dimensional fingerprint plot analysis, and reduced density gradient (RDG). The three-dimensional energy-framework analyses clearly indicated that the dispersion interaction energy is predominantly interaction energy. The amino and carboxyl groups participate in various types of intermolecular and intramolecular interactions. The HOMO–LUMO gap implies that matc has a low kinetic stability and a high chemical reactivity.

Supplementary Materials

The following are available online at https://www.mdpi.com/2073-4352/10/1/19/s1. Table S1 selected bond distances of matc; Table S2 selected bond angles of matc; Figure S1: (a) a view of the strong hydrogen-bonds along the b axis in matc; (b) weak interactions in the asymmetric unit of matc; Figure S2: two-dimensional fingerprint plots with decomposition of each intermolecular contacts in matc; Figure S3: contour plots and energies of HOMO and LUMO of matc.

Author Contributions

Writing—original draft preparation, Y.T.; writing—review and editing, Y.T., L.H. and K.S.; visualization, A.S. and Y.T.; project administration, Z.L. and J.D.; funding acquisition, K.S.; data curation, L.H., Q.Z. and W.L. All authors have read and agreed to the published version of the manuscript.

Funding

This work was supported by Key Science and Technology Research Project of Henan Province (grant no. 182102310650) and the Excellent Team of Spectrum Technology and Application of Henan province (grant no. 18024123007).

Conflicts of Interest

The authors state that there are no conflicts of interest.

References

  1. Sabri, S.S.; El-Abadla, N.S.; El-Abadelah, M.M.; Voelter, W. Synthesis and Properties of Some New 1,4-Dihydrothieno [3,2-e][1,2,4] triazepin-5-ones. Z. Nat. 2006, 61, 65–68. [Google Scholar]
  2. Russell, R.K.; Press, J.B.; Rampulla, R.A.; McNally, J.J.; Falotico, R.; Keiser, J.A.; Brigh, D.A.; Tobia, A. Thiophene systems. 9. Thienopyrimidinedione derivatives as potential antihypertensive agents. J. Med. Chem. 1988, 31, 1786–1793. [Google Scholar] [CrossRef] [PubMed]
  3. Snégaroff, K.; Lassagne, F.; Bentabed-Ababsa, G.; Nassar, E.; Ely, S.C.S.; Hesse, S.; Perspicace, E.; Derdour, A.; Mongin, F. Direct metallation of thienopyrimidines using a mixed lithium–cadmium base and antitumor activity of functionalized derivatives. Org. Biomol. Chem. 2009, 7, 4782–4788. [Google Scholar] [CrossRef] [Green Version]
  4. Brzozowski, Z.; Sławiński, J.; Sączewski, F.; Sanchez, T.; Neamati, N. Synthesis, anti-HIV-1 integrase, and cytotoxic activities of 4-chloro-N-(4-oxopyrimidin-2-yl)-2-mercaptobenzenesulfonamide derivatives. Eur. J. Med. Chem. 2008, 43, 1188–1198. [Google Scholar] [CrossRef] [PubMed]
  5. Lin, Y.; Liu, X.; Yan, R.; Li, J.; Pannecouque, C.; Witvrouw, M.; de Clercq, E. Synthesis and anti-HIV evaluation of novel 1,3-disubstituted thieno [3,2-c][1,2,6] thiadiazin-4(3H)-one 2,2-dioxides (TTDDs). Bioorganic Med. Chem. 2008, 16, 157–163. [Google Scholar] [CrossRef] [PubMed]
  6. Lazerwith, S.E.; Lew, W.; Zhang, J.; Morganelli, P.; Liu, Q.; Canales, E.; Clarke, M.O.; Doerffler, E.; Byun, D.; Mertzman, M.; et al. Discovery of GS-9669, a thumb site II non-nucleoside inhibitor of NS5B for the treatment of genotype 1 chronic hepatitis C infection. J. Med. Chem. 2013, 57, 1893–1901. [Google Scholar] [CrossRef] [PubMed]
  7. Wiley, M.R.; Weir, L.C.; Briggs, S.; Bryan, N.A.; Buben, J.; Campbell, C.; Chirgadze, N.Y.; Conrad, R.C.; Craft, T.J.; Ficorilli, J.V.; et al. Structure-based design of potent, amidine-derived inhibitors of factor Xa: Evaluation of selectivity, anticoagulant activity, and antithrombotic activity. J. Med. Chem. 2000, 43, 883–899. [Google Scholar] [CrossRef] [PubMed]
  8. Murray, B.W.; Guo, C.; Piraino, J.; Westwick, J.K.; Zhang, C.; Lamerdin, J.; Dagostino, E.; Knighton, D.; Loi, C.M.; Zager, M.; et al. Small-molecule p21-activated kinase inhibitor PF-3758309 is a potent inhibitor of oncogenic signaling and tumor growth. Proc. Natl. Acad. Sci. USA 2010, 107, 9446–9451. [Google Scholar] [CrossRef] [Green Version]
  9. Tian, Q.; Cheng, Z.; Yajima, H.M.; Savage, S.J.; Green, K.L.; Humphries, T.; Reynolds, M.E.; Babu, S.; Gosselin, F.; Askin, D.; et al. A practical synthesis of a PI3K inhibitor under noncryogenic conditions via functionalization of a lithium triarylmagnesiate intermediate. Org. Process Res. Dev. 2013, 17, 97–107. [Google Scholar] [CrossRef]
  10. Rizwan, K.; Zubair, M.; Rasool, N.; Ali, S.; Zahoor, A.F.; Rana, U.A.; Khan, S.U.D.; Shahid, M.; Jaafar, H.Z. Regioselective synthesis of 2-(bromomethyl)-5-aryl-thiophene derivatives via palladium (0) catalyzed suzuki cross-coupling reactions: As antithrombotic and haemolytically active molecules. Chem. Cent. J. 2014, 8, 74. [Google Scholar] [CrossRef] [Green Version]
  11. Labat, Y. Thioglycolic Acid. In Kirk-Othmer Encyclopedia of Chemical Technology; Wiley: Hoboken, NJ, USA, 2000. [Google Scholar]
  12. Baumgartner, T. π-Conjugated Heterocyclic fused Bithiophene Materials. J. Inorg. Organomet. Polym. Mater. 2005, 15, 389–409. [Google Scholar] [CrossRef]
  13. Fuller, L.S. Thiophene and thiophene derivatives. In Kirk-Othmer Encyclopedia of Chemical Technology; Wiley: Hoboken, NJ, USA, 2000. [Google Scholar]
  14. Huddleston, P.R.; Barker, J.M. A Convenient Synthesis of 2-Substituted 3-Hydroxy-and 3-Amino-Thiophens from Derivatives of 2-Chloroacrylic Acid. Synth. Commun. 1979, 9, 731–734. [Google Scholar] [CrossRef]
  15. Rigaku, O.D. CrysAlis PRO; Rigaku Oxford Diffraction: Yarnton, UK, 2015. [Google Scholar]
  16. Sheldrick, G.M. Crystal structure refinement with SHELXL. Acta Cryst. 2015, 71, 3–8. [Google Scholar]
  17. Dolomanov, O.V.; Bourhis, L.J.; Gildea, R.J.; Howard, J.A.; Puschmann, H. OLEX2: A complete structure solution, refinement and analysis program. J. Appl. Crystallogr. 2009, 42, 339–341. [Google Scholar] [CrossRef]
  18. Frisch, M.J.; Trucks, G.W.; Schlegel, H.B.; Scuseria, G.E.; Robb, M.; Cheeseman, J.R.; Scalmani, G.; Barone, V.; Mennucci, B.; Petersson, G.A.; et al. Gaussian 09; Revision D. 01; Gaussian. Inc.: Wallingford, CT, USA, 2009. [Google Scholar]
  19. Spackman, M.A.; Jayatilaka, D. Hirshfeld surface analysis. CrystEngComm 2009, 11, 19–32. [Google Scholar] [CrossRef]
  20. Spackman, M.A.; McKinnon, J.J. Fingerprinting intermolecular interactions in molecular crystals. CrystEngComm 2002, 4, 378–392. [Google Scholar] [CrossRef]
  21. Turner, M.J.; McKinnon, J.J.; Wolff, S.K.; Grimwood, D.J.; Spackman, P.R.; Jayatilaka, D.; Spackman, M.A. Crystal Explorer17.5; The University of Western Australia: Perth, Australia, 2017. [Google Scholar]
  22. Lu, T.; Chen, F. Multiwfn: A multifunctional wavefunction analyzer. J. Comput. Chem. 2012, 33, 580–592. [Google Scholar] [CrossRef]
  23. Humphrey, W.; Dalke, A.; Schulten, K. VMD: Visual molecular dynamics. J. Mol. Graph. 1996, 14, 33–38. [Google Scholar] [CrossRef]
  24. Alizadeh, A.; Vahabi, A.H.; Bazgir, A.; Khavasi, H.R.; Zhu, Z.; Zhu, L.G. Determinative role of ring size and substituents in highly selective synthesis of functionalized bicyclic guanidine and tetra substituted thiophene derivatives based on salt adducts afforded by cyclic thioureas and ketene dithioacetal. Tetrahedron 2016, 72, 1342–1350. [Google Scholar] [CrossRef]
  25. Sahu, S.N.; Gupta, M.K.; Singh, S.S.; Yadav, P.; Panwar, R.; Kumar, A.; Ram, V.J.; Kumar, B.; Pratap, R. One pot synthesis of tetrasubstituted thiophenes: [3 + 2] annulation strategy. RSC Adv. 2015, 5, 36979–36986. [Google Scholar] [CrossRef]
  26. Alizadeh, A.; Moafi, L.; Ghanbaripour, R.; Abadi, M.H.; Zhu, Z.; Kubicki, M. A new route for the synthesis of 1,3,4-trisubstituted pyrazolo[4,3-c]quinolines via a multicomponent reaction. Tetrahedron 2015, 71, 3495–3499. [Google Scholar] [CrossRef]
  27. Singh, H. A DFT approach for theoretical and experimental study of structure, electronic, Hirshfeld surface and spectroscopic properties of 12-(4-bromophenyl)-2-(prop-2-ynyloxy)-9,10-dihydro-8H-benzo [a]xanthen-11(12H)-on single crystal. Chem. Phys. 2019, 524, 1–13. [Google Scholar] [CrossRef]
  28. McKinnon, J.J.; Fabbiani, F.P.A.; Spackman, M.A. Comparison of polymorphic molecular crystal structures through Hirshfeld surface analysis. Cryst. Growth Des. 2007, 7, 755–769. [Google Scholar] [CrossRef]
  29. McKinnon, J.J.; Spackman, M.A.; Mitchell, A.S. Novel tools for visualizing and exploring intermolecular interactions in molecular crystals. Acta Crystallogr. Sect. B Struct. Sci. 2004, 60, 627–668. [Google Scholar] [CrossRef] [PubMed]
  30. Hemissi, H.; Nasri, A.; Rzaigui, M. Chiral self-assembly of a novel (CuII/ReVII)-heterobimetallic l-Arginine complex: Crystal structure, Hirshfeld surface analysis, spectroscopic properties and biochemical studies. J. Mol. Struct. 2019, 1186, 307–316. [Google Scholar] [CrossRef]
  31. Tan, X.J.; Zhang, L.Y.; Sun, Y.K.; Zhou, X.M. Synthesis, structure and antiproliferative and optical activities of two new biphenyl-derived Schiff bases. Acta Cryst. 2019, 75, 97–106. [Google Scholar] [CrossRef]
  32. Gumus, I.; Solmaz, U.; Binzet, G.; Keskin, E.; Arslan, B.; Arslan, H. Hirshfeld surface analyses and crystal structures of supramolecular self-assembly thiourea derivatives directed by non-covalent interactions. J. Mol. Struct. 2018, 1157, 78–88. [Google Scholar] [CrossRef]
  33. Edwards, A.J.; Mackenzie, C.F.; Spackman, P.R.; Jayatilaka, D.; Spackman, M.A. Intermolecular interactions in molecular crystals: What’s in a name? Faraday Discuss. 2017, 203, 93–112. [Google Scholar] [CrossRef] [Green Version]
  34. Geetha, D.V.; Al-Ostoot, F.H.; Mohammed, Y.H.E.; Sridhar, M.A.; Khanum, S.A.; Lokanath, N.K. Synthesis, Elucidation, Hirshfeld surface analysis, and DFT calculations of 4-chloro-N-[2-(2-1H-indol-3-yl-acetylamino)-phenyl]-benzamide. J. Mol. Struct. 2019, 1178, 384–393. [Google Scholar] [CrossRef]
  35. Tao, Y.; Han, L.; Li, X.; Han, Y.; Liu, Z. Molecular structure, spectroscopy (FT-IR, FT-Raman), thermodynamic parameters, molecular electrostatic potential and HOMO-LUMO analysis of 2, 6-dichlorobenzamide. J. Mol. Struct. 2016, 1108, 307–314. [Google Scholar] [CrossRef]
  36. Lu, T.; Manzetti, S. Wavefunction and reactivity study of benzo [a] pyrene diol epoxide and its enantiomeric forms. Struct. Chem. 2014, 25, 1521–1533. [Google Scholar] [CrossRef]
  37. Tao, Y.; Han, L.; Han, Y.; Liu, Z. A combined experimental and theoretical analysis on molecular structure and vibrational spectra of 2, 4-dihydroxybenzoic acid. Spectrochim. Acta 2015, 137, 1078–1085. [Google Scholar] [CrossRef] [PubMed]
  38. Tao, Y.; Li, X.; Han, L.; Zhang, W.; Liu, Z. Spectroscopy (FT-IR, FT-Raman), hydrogen bonding, electrostatic potential and HOMO-LUMO analysis of tioxolone based on DFT calculations. J. Mol. Struct. 2016, 1121, 188–195. [Google Scholar] [CrossRef]
  39. Qi, Y.; Tang, Z.; Zhan, H.; Wang, Y.; Zhao, Y.; Fei, X.; Tian, J.; Yu, L.; Liu, J. A new interpretation of the ESIPT mechanism of 2-(benzimidazol-2-yl)-3-hydroxychromone derivatives. Spectrochim. Acta 2020, 224, 117359. [Google Scholar] [CrossRef] [PubMed]
  40. Qi, Y.; Lu, M.; Wang, Y.; Tang, Z.; Gao, Z.; Tian, J.; Fei, X.; Li, Y.; Liu, J. A theoretical study of the ESIPT mechanism of 3-hydroxyflavone derivatives: Solvation effect and the importance of TICT for its dual fluorescence properties. Org. Chem. Front. 2019, 6, 3136–3143. [Google Scholar] [CrossRef]
  41. Yin, X.; Lai, X.Y.; Wang, X.; Liu, Y.T. Theoretical insight into the photophysical properties of long-lifetime Ir (iii) and Rh (iii) complexes for two-photon photodynamic therapy. Phys. Chem. Chem. Phys. 2019, 21, 8394–8401. [Google Scholar] [CrossRef]
Figure 1. Asymmetric unit and atom-labeling for matc. Atomic displacement ellipsoids are depicted at the 50% probability level. A, B, and C in orange designate the three different molecules in the asymmetric unit.
Crystals 10 00019 g001
Figure 2. Strong N–H⋯N and N–H⋯O hydrogen bond interactions indicated by dash line in matc. Methyl groups are omitted for clarity.
Crystals 10 00019 g002
Figure 3. A view of the Hirshfeld surfaces mapped over the dnorm of matc. Color scaled from −0.50 a.u. (red) to 1.20 a.u. (blue).
Crystals 10 00019 g003
Figure 4. The percentage contributions of each interaction to the Hirshfield surface for matc.
Crystals 10 00019 g004
Figure 5. Typical energy-framework diagrams of matc along the b axis: (a) Coulomb interaction energies (red); (b) dispersion interaction energies (green); (c) total interaction energies (blue).
Crystals 10 00019 g005
Figure 6. (a) The scatter graph; (b) the corresponding color-filled gradient isosurfaces map of the matc trimer structure.
Crystals 10 00019 g006
Figure 7. ESP-mapped molecular vdW surface of matc (ρ = 0.001 e/bohr3).
Crystals 10 00019 g007
Table 1. Structure refinement parameters for matc.
CCDC Number 1946321
Empirical formulaC6H7NO2S
Formula weight157.19
Temperature/K100
Crystal systemmonoclinic
Crystal size/mm30.26 × 0.25 × 0.22
Space groupP21/c
a, b, and c/Å14.7315(2), 6.1118(1), 24.2439(3)
Β/°95.984(1)
Volume/Å32170.93(5)
Z12
ρcalc g/cm31.443
μ/mm−13.480
F(000)984.0
2Θ range for data collection/°6.032 to 151.934
Index ranges‒18 ≤ h ≤ 18, ‒7 ≤ k ≤ 4, ‒30 ≤ l ≤ 28
Reflections collected20121
Independent reflections4440 [Rint = 0.0457, Rsigma = 0.0352]
Data/restraints/parameters4440/0/274
Goodness-of-fit on F21.058
Final R indexes [I > = 2σ (I)]R1 = 0.0384, wR2 = 0.1040
Final R indexes [all data]R1 = 0.0423, wR2 = 0.1094
Largest diff. peak/hole/e Å30.46/−0.34
Table 2. Hydrogen bond and weak interactions of matc.
Donor–H⋯AcceptorDistance of D–H/ÅDistance of H⋯A/ÅDistance of D⋯A/ÅAngle of D–H⋯A/˚
N1H1A···O20.852.242.836(2)127
N1–H1B···O4 i0.842.062.8827(19)169
N2–H2B···O40.802.312.8644(19)127
N3–H3D···O2 ii0.822.112.895(2)159
N3–H3E···O50.862.252.830(2)125
N2–H2B···N3 iii0.802.493.195(2)147
C9–H9B···S10.982.863.5794(18)131
C3–H3C···Cg1 iv0.982.793.655(2)148
C5–H5···Cg1 ii0.952.923.569(2)126
C9–H9C···Cg2 iv0.982.673.4942(19)142
Symmetry codes: (i) −x, y 1 2 , −z + 1 2 ; (ii) −x + 1, y 1 2 , −z + 1 2 ; (iii) −1 + x, −1 + y, z; (iv) x, 1 + y, z.

