Abstract
Chloroform (CHCl3) and dichloromethane (CH2Cl2) are model systems for the study of intermolecular interactions, such as hydrogen bonds and halogen–halogen interactions. Here we report a joint computational (density-functional perturbation theory (DFPT) modelling) and experimental (Raman scattering) study on the behaviour of the crystals of these compounds up to a pressure of 32 GPa. Comparing the experimental information on the Raman band positions and intensities with the results of calculations enabled us to characterize the pressure-induced evolution of the crystal structure of both compounds. We find that the previously proposed P63 phase of CHCl3 is in fact a metastable structure, and that up to 32 GPa the ambient-pressure Pnma structure is the ground state polymorph of this compound. For CH2Cl2 we confirm the stability of the ambient-pressure Pbcn structure up to 32 GPa. We show that the high-pressure evolution of the crystal geometry of CHCl3 in the Pnma structure is a result of the subtle balance between dipole–dipole interactions, hydrogen bonds and Cl···Cl contacts. For CH2Cl2 (Pbcn structure) the dipole–dipole interactions and hydrogen bonds are the main factors influencing the pressure-induced changes in the geometry.
1. Introduction
Chloroform (trichloromethane, CHCl3) and dichloromethane (methylene chloride, CH2Cl2) are are some of the most widely used solvents in both industry and research. Their use is motivated by their ability to dissolve many substances in large quantities, despite the hazards associated with handling of these liquids [1,2].
Both CHCl3 and CH2Cl2 are characterized by non-zero dipole moments. Hence the study of the interactions of these molecules in the liquid and solid state leads to a better understanding of the interplay between close packing and polar aggregation [3,4,5,6,7]. Both molecules are also model systems for the study of intermolecular interactions such as halogen–halogen bonding [8,9,10], or hydrogen bonding [11,12,13]. In this context experiments on crystals subject to pressures exceeding 0.1 GPa (=1 kbar) are particularly informative, as compression-induced changes in the intermolecular geometry yield information on the origin and relative strength of such interactions [12,14,15]. High-pressure experiments enable probing even very weak interactions such as those between two bound fluorine atoms (F···F contacts) [16,17].
Throughout the years considerable effort was made to study the effect of pressure on crystals containing tri- and dihalomethane molecules [18,19,20,21,22,23,24,25,26,27,28,29,30,31,32,33,34,35,36,37]. Most of this research was conducted in the group of prof. Hiroyasu Shimizu (Gifu University), prof. Anthony Anderson (University of Waterloo), and prof. Andrzej Katrusiak (Adam Mickiewicz University in Poznań).
As can be seen from the summary shown in Table 1, the majority of experiments on these systems were conducted for pressures not exceeding 10 GPa in the case of spectroscopic measurements (Raman scattering and, Infrared, IR absorption), and 3 GPa in the case of X-ray diffraction (mostly on single crystals). The only exception is iodoform (CH3I) which was studied by powder X-ray diffraction up to 40 GPa, and by Raman spectroscopy up to 22 GPa [27]. Computational studies on the high-pressure transformations of crystals containing tri- and dihalomethane are also scarce, with only CHBr3 and CHI3 investigated [38,39].

Table 1.
Summary of high-pressure experimental studies on tri- and dihalomethane molecules. Pressure is given in GPa and Raman/IR refers to Raman scattering/IR absorption experiments.
Here we report a joint computational and experimental study on the high-pressure behaviour of CHCl3 and CH2Cl2 up to 32 GPa. By performing Raman scattering measurements, with the use of the diamond anvil cell (DAC) and a confocal microscope, we were able to monitor the evolution of the Raman-active vibrations as a function of pressure. Comparing the information on the Raman band positions and intensities with the results of density functional theory (DFT) calculations enabled us to characterize the pressure-induced evolution of the crystal structure of both compounds. We find that the previously proposed P63 phase of CHCl3 is in fact a metastable structure, and that up to 32 GPa the ambient-pressure Pnma structure is the ground state polymorph of this compound. For CH2Cl2 we confirm the stability of the ambient-pressure Pbcn structure up to 32 GPa. For both compounds the persistence at large compression of structures found at 1 atm is the result of their smaller volume at GPa pressures compared to other hypothetic phases. Analysis of the calculated crystal geometry of CHCl3 (Pnma structure) and CH2Cl2 (Pbcn structure) is also performed in the context of competing intermolecular interactions (dipole–dipole, hydrogen bonds, Cl···Cl interactions).
2. Materials and Methods
High-pressure experiments: For both CHCl3 and CH2Cl2 five high-pressure runs were conducted with the use of a diamond anvil cell (DAC) equipped with Ia diamonds with a 300 µm culet. The sample was enclosed by a stainless-steel gasket pre-indented to a thickness of ca. 35 µm. The gasket hole (radius from 120 µm to 270 µm) was laser-drilled. The sample space, containing several ruby chips, was filled with liquid CHCl3 (Sigma Aldrich, anhydrous, ≥99% purity) or CH2Cl2 (Merck, anhydrous, ≥99% purity) after which the DAC was closed. No pressure-transmitting medium was used. The pressure was determined with the use of a ruby fluorescence scale [40].
Raman spectroscopy: The spectra were acquired with an Alpha300M+ confocal microscope (Witec Gmbh, Ulm, Germany) equipped with a motorized stage. The confocal set-up enabled acquiring the signal from a small portion of the sample (approximately 2 × 2 × 2 µm) located only few µm from the ruby used for pressure determination. This partly alleviated the problems associated with pressure gradients inside the DAC which result from the lack of a pressure-transmitting medium. The good accordance between experimental Raman shifts and those simulated for hydrostatic conditions (vide infra) indicated that the probed sample region exhibited quasi-hydrostatic conditions.
We used a 532 nm laser line delivered to the microscope through a single-mode optical fibre. The laser power at the sample did not exceed 5 mW. The backscattered Raman signal was collected through a 20× long working distance objective (numerical aperture, N.A., equal to 0.4), and passed through a multi-mode optical fibre (50 µm core diameter) to a lens based spectrometer (Witec UHTS 300, f/4 aperture, focal length 300 mm) coupled with a back-illuminated Andor iDUS 401 detector (Oxford Instruments, Abingdon-on-Thames, UK) thermoelectrically cooled to −60 °C. The spectra were collected with the use of an 1800 mm grating resulting in a 1.2 cm−1 spectral resolution. Typical acquisition time was 1 s with 20 accumulations. The spectra were post-processed (background subtraction and cosmic-ray removal) with the Project FIVE software (Witec Gmbh, Ulm, Germany). The position of Raman bands was established with the Fityk 1.3.1 software by fitting the observed bands with Pseudo-Voigt profiles [41]. At selected pressures Raman mapping of the whole sample enclosed in the DAC was conducted in order to confirm the sample integrity.
DFT calculations: Periodic DFT calculations of the geometry and enthalpy of possible high-pressure polymorphs of CHCl3 and CH2Cl2 utilized the Perdew-Burke-Ernzerhof (PBE) functional [42], as implemented in CASTEP (academic version 19.11) [43]. In order to properly account for van der Waals interactions between molecules in the crystal lattice we used the dispersion correction of Tkatchenko and Scheffler [44]. We found that the chosen method very well reproduces the geometry (lattice vectors) and the vibration frequencies of the known structures of both compounds with differences in the range of 1% to 3% (see Tables S1–S4 in the Supplementary Materials), with the only exception being the frequencies of the C-Cl asymmetric stretching modes, which are underestimated by around 5% for CH2Cl2 and 8% for CHCl3.
The thermodynamic stability of various CHCl3 and CH2Cl2 polymorphs was judged by comparing their enthalpy (H), and thus the calculations formally correspond to T = 0 K at which temperature the Gibbs free energy (G = H − S·T, where S is the entropy) is equal to the enthalpy.
The valence electrons were described with a plane-wave basis set (1020 eV cut-off), while norm-conserving pseudopotentials were used for the description of core electrons. The convergence criterion for the electronic minimization was 10−7 eV per atom. Sampling of the Brillouin zone was done through a Monkhorst–Pack mesh [45] with a 2π × 0.03 Å−1 spacing of k-points. Geometry optimization of the crystal structures was performed with the use of the Broyden–Fletcher–Goldfarb–Shanno scheme [46]. Structures were optimized until the forces acting on the atoms were smaller than 5 meV/Å, the difference between the applied hydrostatic pressure and all of the stress components was smaller than 0.1 GPa, and the maximum ionic displacement was smaller than 5 × 10⁻⁴ Å.
We also used CASTEP and the PBE functional with dispersion corrections for calculation of the intensity and frequency of Γ-point Raman-active vibrational modes using density-functional perturbation theory (DFPT) [47]. The Raman activity of each vibrational mode (Si) was converted into the intensity (Ii) assuming the following relation:
where ν0 is the laser frequency, νi is the mode frequency, T is the temperature (taken as equal to 293 K). Visualization of all structures was performed with the VESTA software package [48].
3. Results
3.1. Raman Spectrum of Chloroform
The piramidal (C3v symmetry) molecule of CHCl3 exhibits six vibrational modes of a1 and e symmetry, all of them Raman-active (Table 2). We were able to observe all of these modes in the liquid compressed in the DAC (Figure 1). We find that at room temperature chloroform freezes at 0.7 GPa, in accordance with values reported in previous studies (0.6–0.8 GPa) [18,19,20,21]. The spectrum of the polycrystalline phase obtained just above the freezing pressure resembles that of the liquid, but with sharper and more intense bands (Figure 1). Moreover freezing induces shifts of the position of Raman bands (Figure 2a) with the largest one for the ν1(a1) band (increase in frequency by 10 cm−1), and the ν5(e) vibration (decrease by 8 cm−1).
Table 2.
Intramolecular vibrations of chloroform (CHCl3). Experimental frequency is given in cm−1.
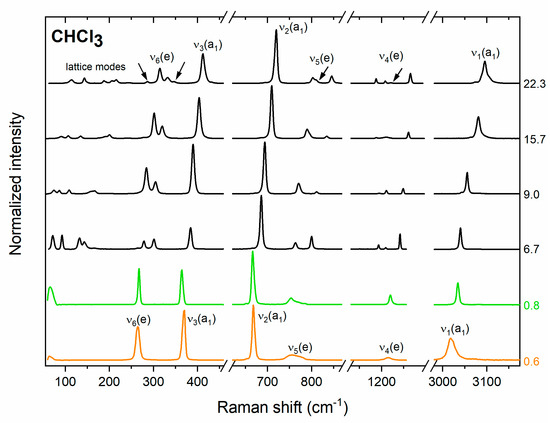
Figure 1.
Experimental Raman spectrum of liquid (orange line) and polycrystalline (green and black lines) CHCl3 at selected pressure (given in GPa). Green lines denote spectra obtained from the disordered P63 structure and black lines denote spectra of the Pnma phase. Arrows indicate new bands appearing upon compression of the Pnma structure.
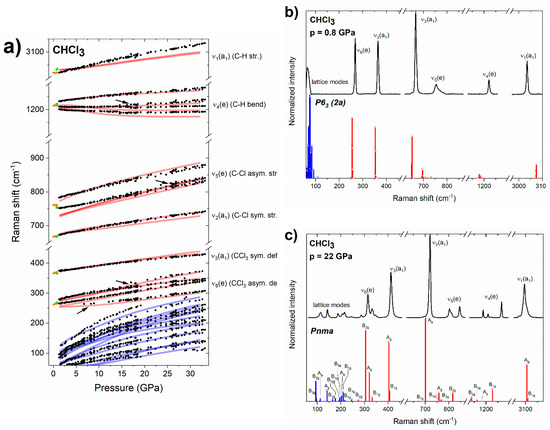
Figure 2.
(a) Pressure dependence of the experimental frequencies of Raman bands of liquid (orange dots) and solid (green/black dots for P63/Pnma) chloroform. Arrows indicate new bands appearing upon compression of the Pnma structure. Blue/red lines mark the simulated frequencies for lattice/internal Raman-active modes of the Pnma structure. For ease of comparison, the theoretical frequencies were scaled by 1.03 (with the exception of the ν1/ν5 modes which were scaled by 0.99/1.05). (b) Experimental Raman spectrum of solid chloroform at 0.8 GPa, together with Raman intensities simulated for the P63 (2a) structure (blue/red bars for lattice/internal modes, all of them of A symmetry). (c) Experimental Raman spectrum of solid chloroform at 22 GPa together with Raman intensities simulated for the Pnma structure (blue/red bars for lattice/internal modes, symmetry labels are given).
The Raman spectrum of the crystalline phase obtained just above the freezing point is very well reproduced by the simulation conducted for a CHCl3 polymorph derived from the disordered structure of P63 (Z = 2) symmetry reported by Dziubek and Katrusiak at 0.75 GPa (Figure 2b) [21]. This structure, to which we refer to as P63 (2a), is built by localizing the disorder of CHCl3 molecules in a 2 × 1 × 1 supercell of the original P63 structure. This procedure leads to a structure formally exhibiting P1 symmetry and Z = 4 for which all 57 vibrational modes are Raman active. However, as seen in Figure 2b, their frequencies are closely grouped into bands corresponding to lattice modes and each of the molecular (internal) vibrations. This indicates that the phase observed just above the freezing point is identical to the P63 disordered polymorph proposed by Dziubek and Katrusiak [21].
A more detailed analysis of the vibrational structure simulated for the P63 (2a) structure indicates that modes assigned to the ν5(e) band exhibit the largest spread in frequencies (693–733 cm−1, Δν = 40 cm−1) followed by the ν4(e) modes (1172–1190 cm−1, Δν = 18 cm−1); the remaining bands have Δν values below 8 cm−1. This is in accordance with the experimental spectrum of P63 CHCl3 in which the ν5(e) and ν4(e) bands exhibit much more pronounced broadening as compared to other modes (Figure 2b).
The disordered P63 phase was only observed in a very narrow pressure range up to 0.9 GPa. Above that pressure, splitting of the modes of e symmetry (ν4, ν5, ν6) were observed in the spectrum (Figure 1). Both the pressure evolution of the frequencies of the Raman bands (Figure 2a), as well as their intensities (Figure 2c) are consistent with those simulated for the ambient pressure structure of CHCl3 of Pnma symmetry and Z = 4 [50,51]. This finding is in accordance with the suggestion of Shimizu and Matsumoto that the high-pressure phase of solid CHCl3 is isostructural with the ambient-pressure one [18]. We found that the Pnma structure persists up to the highest pressure achieved in this study (32 GPa). Weak additional signals appearing above 20 GPa in the vicinity of bands of e symmetry (Figure 1) can all be accounted for assuming that CHCl3 adopts the Pnma structure (Figure 2a).
The observation of the ambient pressure Pnma structure at high pressure is consistent with most of the earlier studies [18,19,20]. However, in contrast to those experiments we did not find evidence for an additional phase transition at 4.6 GPa [18], or 6 GPa [19,20]. We note that phase transitions at these pressures were inferred from minor changes in the slope of the pressure dependence of Raman frequencies. As can be seen in Figure 2a, such changes, among them softening (negative dν/dp) of the lowest-frequency component of the ν4(e) band, are reproduced by simulations conducted for the Pnma structure.
In two experimental runs we observed that the liquid transformed directly to the Pnma polymorph. This, together with the fact that the P63 (2a) structure is thermodynamically less stable than Pnma at ambient and high pressure (vide infra), strongly suggests that the disordered P63 structure is obtained as a metastable phase. This is in line with the study of Stanila et al. which observed the formation of a metastable solid phase of CHCl3 upon flash-freezing of the compressed liquid [20].
3.2. Raman Spectrum of Dichloromethane
The CH2Cl2 molecule (C2v symmetry) exhibits nine vibrational modes of a1, a2, b1 and b2 symmetry, all of them Raman active (Table 3). We were able to observe all of these modes in the liquid compressed in the DAC (Figure 3b). At room temperature the spectrum of liquid dichloromethane can be observed even up to 2.8 GPa. This value is higher than previously reported pressure of freezing (1.1–1.4 GPa) [29,30,31], which indicates that in our room-temperature experiments we observed kinetic-driven stabilization of liquid CH2Cl2 beyond its thermodynamic stability window. The spectrum of the solid obtained upon freezing is in accordance with that obtained in the previous Raman study [29]. Upon crystallization we observed splitting of the ν4(a1) and the ν9(b2) bands (Figure 3b). The splitting of the former band increases with pressure (Figure 3a).
Table 3.
Intramolecular vibrations of dichloromethane (CH2Cl2). Experimental frequency is given in cm−1.
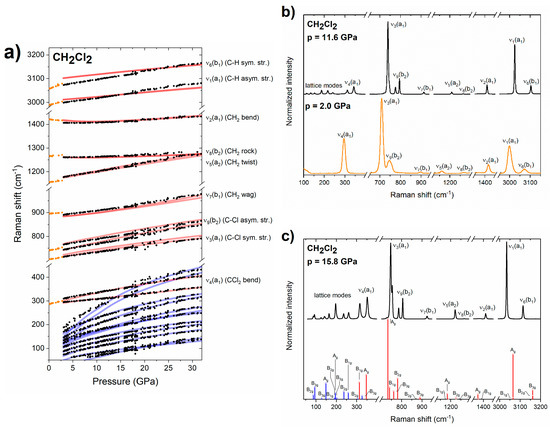
Figure 3.
(a) Pressure dependence of the experimental frequencies of Raman bands of liquid (orange dots) and solid (black dots) for CH2Cl2. Blue/red lines mark vibrational frequencies simulated for lattice/internal Raman-active modes of the Pbcn structure. For ease of comparison the theoretical frequencies were scaled by 1.03 (with the exception of the ν1/ν5 modes which were scaled by 0.99/1.05). (b) Experimental Raman spectrum of liquid/solid CH2Cl2 at 0.6/5.4 GPa (orange/black lines). (c) Experimental Raman spectrum of solid CH2Cl2 at 15.8 GPa together with Raman intensities simulated for the Pbcn structure (blue/red bars for lattice/internal modes, symmetry labels of vibrational modes are also given).
Single-crystal X-ray diffraction measurements indicated that upon high-pressure freezing CH2Cl2 crystallizes in the ambient-pressure structure of Pbcn symmetry (Z = 4) [31,53,54]. Both the pressure evolution of the Raman bands (Figure 3a), and the spectrum of the solid (Figure 3c) are reproduced by DFT calculations conducted for the Pbcn phase. In particular, calculations are able to reproduce the non-linear behaviour of the ν2(a1) band, as well as the crossing of the ν4(a1) band with the highest-frequency lattice modes above 17 GPa (Figure 3a). Based on this accordance we conclude that CH2Cl2 remains in the Pbcn structure up to 32 GPa, the highest pressure achieved in our study. We did not find evidence for a phase transition at 4.5, as suggested by Shimizu and co-workers based on slight changes in the slope of the pressure dependence of some of the internal modes [29,30].
For both CHCl3 and CH2Cl2 the frequency of the C–H and C–Cl stretching vibrations increases with pressure. This hints at the shortening of these bonds upon compression – a notion supported by the calculated pressure dependence of bond lengths for the Pnma/Pbcn polymorphs of CHCl3/CH2Cl2 (Figure 4). On the other hand in both compounds C–H deformation modes (C–H bend in CHCl3 and CH2 bend and rock) exhibit some degree of softening with pressure with this effect being more pronounced for CHCl3. For both compounds the low-frequency CCl2/CCl3 deformation modes are split in the solid phase, and this splitting increases with pressure. As noted earlier this is a result of the enhancement of dipole–dipole interactions upon compression [55].
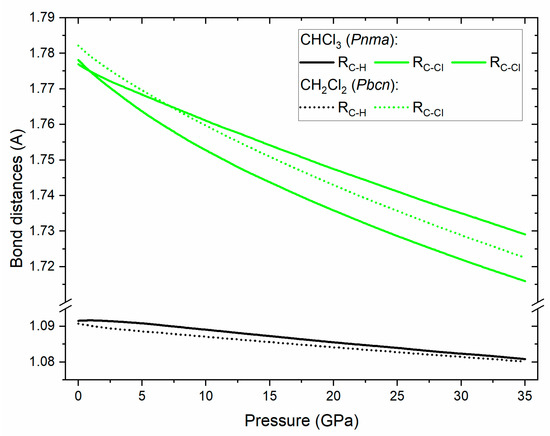
Figure 4.
Simulated dependence of the C-H (black lines) and C-Cl (green lines) bond lengths in CHCl3 in the Pnma structure (full lines) and CH2Cl2 in the Pbcn structure (dotted lines).
We note that the Pnma structure of CHCl3 exhibits chlorine atoms in two Wyckoff positions (4c and 8d); this allows a pair of C–Cl bonds to have a different lengths than the third bond. Our calculation indicates that above 1 GPa such a splitting does occur (Figure 4) with the difference between the two bonds reaching 0.8% at 32 GPa.
3.3. DFT Calculations
In order to elucidate the phase stability of chloroform and dichloromethane we compared the pressure dependence of the relative enthalpies of various phases of both compounds (Figure 5). In the case of CHCl3 we focused on the relative stability of the ambient pressure Pnma structure with respect to the P63 (2a) structure (an ordered variant of the P63 phase of chloroform observed in an earlier study) [21]. As can be seen in Figure 5a the P63 (2a) polymorph has higher enthalpy than Pnma both at ambient (effectively 0 GPa) and high pressure. This indicates that it is observed experimentally as a metastable form. The observation of this polar structure is most probably a kinetic effect resulting from a low activation barrier for the nucleation of P63 crystals from the compressed liquid. We note that neutron diffraction measurements indicate that the local structure of liquid chloroform is dominated by a collinear arrangement of CHCl3 molecules analogous to that found in the P63 structure [5]. This would explain the low barrier for crystallization of P63 from compressed chloroform. It is noteworthy to point out that in a similar fashion DFT calculations indicated that the P63 polymorph of bromoform, also experimentally observed at high pressure, is a metastable phase [38].
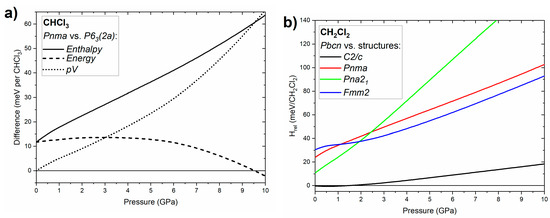
Figure 5.
(a) Pressure dependence of the enthalpy, energy and p∙V term of the P63 (2a) structure of CHCl3 with respect to the Pnma phase; (b) pressure dependence of the enthalpy of the C2/c, Pnma, Pna21, and Fmm2 structures of CH2Cl2 with respect to the Pbcn phase.
Inspection of the differences in energy and the pressure–volume term (p·V) between P63 (2a) and Pnma (Figure 5a) demonstrates that the high-pressure stability of the latter phase is a result of its smaller volume, and hence the lower value of the p·V term. In other words, CHCl3 molecules are better packed in the Pnma polymorph, although above 9.5 GPa this results in a higher energy for this crystal compared to P63 (2a).
For dichloromethane we compared the enthalpy of the ambient-pressure Pbcn phase with that calculated for polymorphs isostructural with phases found for other dihalomethanes: C2/c (CH2Br2, CH2I2 phase I, CH2BrCl phase I, CH2BrI), Pnma (CH2ClI phase III) and Pna21 (CH2ClI phase IV), and Fmm2 (CH2I2 phase II) [12]. As can be seen in Figure 5b the Pbcn phase is favoured at high pressures, in accordance with our experimental findings. Inspection of the crystal volumes indicate that this is a result of the smaller volume of this phase at pressures exceeding 0.8 GPa. Interestingly, below 2 GPa the C2/c phase is nearly degenerate in terms of enthalpy with Pbcn. The fact that only the latter phase was observed by experiment might be connected to its stabilization by the entropy (S·T) term at finite temperatures.
As a final note on the stability of the Pnma phase of CHCl3, and the Pbcn phase of CH2Cl2 we show in Figure S1 in the Supplementary Materials that both structures are dynamically stable (i.e., do not exhibit imaginary phonon modes) at 32 GPa.
4. Discussion
As it was mentioned earlier CHCl3 and CH2Cl2 crystals are model systems for studying the interplay between various intermolecular forces, in particular dipole–dipole interactions, hydrogen bonds, and halogen–halogen interactions. The latter ones are typically classified into two groups: symmetrical type I interactions, with both ‒X···X (X = Cl, Br, I) angles equal, and type II interactions with one ‒X···X angle equal to 90° and the other equal to 180° [8]. Type I contacts stem from close-packing requirements and weak dispersion interactions. Type II interactions, often referred to as halogen bonds [9,56,57], are stronger interactions resulting from the pairing of a nucleophilic region of one halogen atom with an electrophilic region of the other one.
We have performed the analysis of the computed geometry of the Pnma crystal of CHCl3 and Pbcn structure of CH2Cl2 at high pressures. The three main types of interaction are visualized in Figure 6 and Figure 7. For the analysis of dipole–dipole interactions we assumed cut-off radii of 4.5 Å. The maximum length of Cl···Cl and H···Cl contacts taken into account was equal to the sum of the theoretical van der Waals radii for these atoms at 32 GPa (RCl = 1.48 Å, RH = 1.10 Å) [58,59,60].
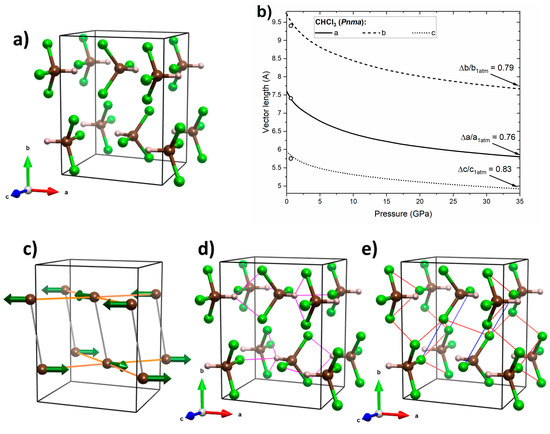
Figure 6.
(a) Crystal geometry of CHCl3 in the Pnma structure at 32 GPa, where brown/grey/green balls mark C/H/Cl atoms, respectively; (b) calculated pressure dependence of the lattice vectors of the this structure (black lines) together with experimental data from ref. [21] (open circles); (c) interactions between molecular dipoles (green arrows), where those energetically favourable are shown in orange and those unfavourable ones are shown in grey; (d) the network of hydrogen bonds (magenta lines); and (e) Cl···Cl interactions, with type II interactions shown in blue and type I interactions in red.
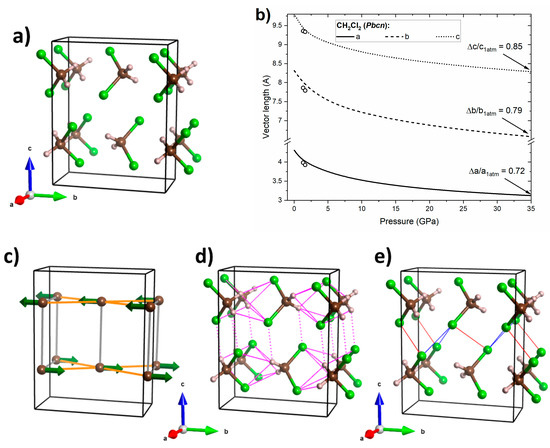
Figure 7.
(a) Crystal geometry of CH2Cl2 in the Pbcn structure at 32 GPa, where brown/grey/green balls mark C/H/Cl atoms, respectively; (b) calculated pressure dependence of the lattice vectors of the this structure (black lines) together with experimental data from ref. [31] (open circles); (c) interactions between molecular dipoles (green arrows), where those energetically favourable are shown in orange and unfavourable ones in grey; (d) network of hydrogen bonds (magenta lines), where those connecting molecules within the ab plane are indicated by full lines and dotted lines indicate interactions primarily along the c vector; (e) Cl···Cl interactions with type II interactions shown in blue and type I interactions in red.
The calculated pressure dependence of the lattice vectors of the Pnma structure of CHCl3 (Figure 6a) indicates the largest linear compression along the a axis (Figure 7b). This can be attributed to the favourable dipole–dipole interactions and presence of hydrogen bonds in the ac plane (H···Cl distances between 2.2 and 2.4 Å at 32 GPa, Figure 6c,d). Interestingly Pnma exhibits lowest compression along the c axis. This could be attributed to the presence of type I Cl···Cl interactions linking molecules neighbouring along this axis (Cl···Cl distances between 2.8 and 3.0 Å at 32 GPa, Figure 6e. An earlier study suggested that halogen–halogen interactions of this type become repulsive upon compression [16]. The intermediate shrinkage of the b axis can be linked to the competition between attractive type II Cl···Cl interactions linking molecules neighbouring along this axis (Figure 6e) and unfavourable dipole-dipole interactions along this direction. The above analysis suggests that the structure evolution in Pnma is governed by an interplay of dipole–dipole interactions, hydrogen bonding, and Cl···Cl interactions (both repulsive and attractive).
For the Pbcn structure of CH2Cl2 (Figure 7a) larger differences in lattice compressibility are found than for the Pnma polymorph of CHCl3. The a and b lattice vectors are more compressible than the c vector (Figure 7b)—in accordance with experimental data obtained by Podsiadło and co-workers in a narrower pressure range [31]. The larger compressibility in the ab plane can be traced back to the existence of favourable interactions of molecular dipoles within this plane (Figure 7c). In addition, the hydrogen bonding network (H···Cl distances between 2.4 and 2.5 Å at 32 GPa), which is much richer than for the Pnma structure of CHCl3, is confined mostly within this plane (Figure 7d). On the other hand, repulsive dipole–dipole interaction can be found along the c axis. Moreover, molecules in the c direction are linked only by one type of hydrogen bond, as well as a network of weak Cl···Cl interactions (Cl···Cl distances between 2.7 and 2.9 Å at 32 GPa, Figure 7e). This analysis suggests that the compressibility of the Pbcn structure is governed mainly by dipole–dipole interactions and hydrogen bonds, with halogen bonds playing only a minor role.
We note that for both CHCl3 and CH2Cl2 the shortening of hydrogen bonds does not lead to weakening of the C–Cl or C–H covalent bonds within the molecules—as evidenced experimentally by the constant increases with pressure of the frequency of both the C–Cl and C–H stretching vibrations.
5. Conclusions
By combining high-pressure Raman scattering experiments with DFT modelling we elucidated the phase stability of compressed chloroform and dichloromethane. We found that for both compounds the ambient-pressure structures (Pnma for CHCl3 and Pbcn for CH2Cl2) persist up to 32 GPa as the thermodynamically most stable phases. Our results indicate that the previously described P63 structure of CHCl3 is a metastable phase formed during freezing of the compressed liquid. Analysis of the DFT-derived geometries of the CHCl3 and CH2Cl2 crystals indicates that for both systems dipole–dipole interactions and hydrogen bonds are important factors in the geometry changes upon compression. Halogen–halogen (Cl···Cl) interactions also play an important role in the case of chloroform, while they are less important in the case of dichloromethane.
Supplementary Materials
The following are available online at https://www.mdpi.com/2073-4352/10/10/920/s1, Table S1: Comparison of the calculated and experimental geometry of CHCl3 structures, Table S2: Comparison of the calculated and experimental vibrations of Raman-active modes of CHCl3, Table S3: Comparison of the calculated and experimental geometry of CH2Cl2 structures, Table S4: Comparison of the calculated and experimental vibrations of the Raman-active modes of CH2Cl2, Figure S1: Calculated phonon dispersion curves for the Pnma structure of CHCl3, and the Pbcn structure of CH2Cl2 at 32 GPa.
Author Contributions
Conceptualization, D.K.; funding acquisition, D.K.; investigation, D.K., T.C. and J.R.; methodology, D.K.; supervision, D.K.; writing—original draft, D.K.; writing—review and editing, D.K. All authors have read and agreed to the published version of the manuscript.
Funding
This research was funded by the Polish National Science Centre (NCN), grant number UMO-2016/23/B/ST4/03250. The APC was funded by the Polish National Science Centre (NCN), grant number UMO-2016/23/B/ST4/03250.
Acknowledgments
This research was carried out with the support of the Interdisciplinary Centre for Mathematical and Computational Modelling (ICM), University of Warsaw, under grants nos. GB74-8 and GB80-11. We thank Marek Tkacz for making available the laser drilling system at the Institute of Physical Chemistry of the Polish Academy of Sciences.
Conflicts of Interest
The authors declare no conflict of interest.
References
- Joshi, D.R.; Adhikari, N. An Overview on Common Organic Solvents and Their Toxicity. J. Pharm. Res. Int. 2019, 28, 1–18. [Google Scholar] [CrossRef]
- Vidal, S. Safety First: A Recent Case of a Dichloromethane Injection Injury. ACS Central Sci. 2020, 6, 83–86. [Google Scholar] [CrossRef] [PubMed]
- Curtin, D.Y.; Paul, I.C. Chemical consequences of the polar axis in organic solid-state chemistry. Chem. Rev. 1981, 81, 525–541. [Google Scholar] [CrossRef]
- Pidcock, E. Achiral molecules in non-centrosymmetric space groups. Chem. Commun. 2005, 3457–3459. [Google Scholar] [CrossRef]
- Shephard, J.J.; Callear, S.K.; Salzmann, C.G.; Soper, A.K.; Imberti, S.; Evans, J.S.O. Polar stacking of molecules in liquid chloroform. Chem. Commun. 2015, 51, 4770–4773. [Google Scholar] [CrossRef]
- Karnes, J.J.; Benjamin, I. On the local intermolecular ordering and dynamics of liquid chloroform. J. Mol. Liq. 2017, 248, 121–126. [Google Scholar] [CrossRef]
- Shephard, J.J.; Evans, J.S.O.; Salzmann, C. Local structure and orientational ordering in liquid bromoform. Mol. Phys. 2019, 117, 3337–3344. [Google Scholar] [CrossRef]
- Desiraju, G.R.; Parthasarathy, R. The nature of halogen.cntdot. cntdot. cntdot.halogen interactions: Are short halogen contacts due to specific attractive forces or due to close packing of nonspherical atoms? J. Am. Chem. Soc. 1989, 111, 8725–8726. [Google Scholar] [CrossRef]
- Cavallo, G.; Metrangolo, P.; Milani, R.; Pilati, T.; Priimagi, A.; Resnati, G.; Terraneo, G. The Halogen Bond. Chem. Rev. 2016, 116, 2478–2601. [Google Scholar] [CrossRef]
- Politzer, P.; Murray, J.S.; Clark, T. Halogen bonding: An electrostatically-driven highly directional noncovalent interaction. Phys. Chem. Chem. Phys. 2010, 12, 7748–7757. [Google Scholar] [CrossRef]
- Allen, F.H.; Wood, P.A.; Galek, P.T.A. Role of chloroform and dichloromethane solvent molecules in crystal packing: An interaction propensity study. Acta Crystallogr. Sect. B Struct. Sci. Cryst. Eng. Mater. 2013, 69, 379–388. [Google Scholar] [CrossRef] [PubMed]
- Podsiadło, M.; Olejniczak, A.; Katrusiak, A. Halogen⋯halogen contra C–H⋯halogen interactions. CrystEngComm 2014, 16, 8279–8285. [Google Scholar] [CrossRef]
- Kaźmierczak, M.; Katrusiak, A. Quantitative estimate of cohesion forces. CrystEngComm 2015, 17, 9423–9430. [Google Scholar] [CrossRef]
- Bujak, M.; Podsiadło, M.; Katrusiak, A. Halogen and hydrogen bonds in compressed pentachloroethane. CrystEngComm 2016, 18, 5393–5397. [Google Scholar] [CrossRef]
- Boldyreva, E.V. CHAPTER 2. High Pressure Crystallography: Elucidating the Role of Intermolecular Interactions in Crystals of Organic and Coordination Compounds. In Supramolecular Amphiphiles; Royal Society of Chemistry (RSC): London, UK, 2018; pp. 32–97. [Google Scholar]
- Kurzydłowski, D.; Wang, H.B.; Troyan, I.A.; Eremets, M.I. Lone-pair interactions and photodissociation of compressed nitrogen trifluoride. J. Chem. Phys. 2014, 141, 064706. [Google Scholar] [CrossRef] [PubMed]
- Rusek, M.; Kwaśna, K.; Budzianowski, A.; Katrusiak, A. Fluorine···Fluorine Interactions in a High-Pressure Layered Phase of Perfluorobenzene. J. Phys. Chem. C 2019, 124, 99–106. [Google Scholar] [CrossRef]
- Shimizu, H.; Matsumoto, K. High-pressure Raman study of liquid and molecular crystals at room temperature. 3. Chloroform and chloroform-d. J. Phys. Chem. 1984, 88, 2934–2936. [Google Scholar] [CrossRef]
- Yongnian, Z.; Huan, L.; Xianyi, L.; Guangtian, Z. High-pressure Raman studies of liquid and molecular crystal chloroform and bromoform at room temperature. Phys. B+C 1986, 139, 526–529. [Google Scholar] [CrossRef]
- Stanila, D.; Smith, W.; Anderson, A. Infrared Spectra of Chloroform at High Pressures. Spectrosc. Lett. 2002, 35, 703–713. [Google Scholar] [CrossRef]
- Dziubek, K.F.; Katrusiak, A. Polar Symmetry in New High-Pressure Phases of Chloroform and Bromoform. J. Phys. Chem. B 2008, 112, 12001–12009. [Google Scholar] [CrossRef]
- Fourme, R. Appareillage pour études radiocristallographiques sous pression et à température variable. J. Appl. Crystallogr. 1968, 1, 23–30. [Google Scholar] [CrossRef]
- Dziubek, K.; Podsiadło, M.; Katrusiak, A. Molecular Symmetry and Isostructural Relations in Crystal Phases of Trihalomethanes CHCl3, CHBrCl2, CHBr2Cl, and CHBr3. J. Phys. Chem. B 2009, 113, 13195–13201. [Google Scholar] [CrossRef] [PubMed]
- Shimizu, H.; Matsumoto, K. High-Pressure Raman Study of Phase Transitions in Solid Bromoform. J. Phys. Soc. Jpn. 1984, 53, 4438–4444. [Google Scholar] [CrossRef]
- Stanila, D.; Smith, W.; Anderson, A. Infrared Spectra of Bromoform at High Pressures. Spectrosc. Lett. 2001, 34, 199–210. [Google Scholar] [CrossRef]
- Stanila, D.; Smith, W.; Anderson, A. Raman and Infrared Spectra of Iodoform at High Pressures. Spectrosc. Lett. 2002, 35, 689–702. [Google Scholar] [CrossRef]
- Liu, D.; Lei, W.; Wang, K.; Bao, G.; Li, F.; Hao, J.; Liu, B.; Cui, T.; Cui, Q.; Zou, G. Compression and Probing C−H···I Hydrogen Bonds of Iodoform under High Pressure by X-ray Diffraction and Raman Scattering. J. Phys. Chem. B 2009, 113, 7430–7434. [Google Scholar] [CrossRef] [PubMed]
- Bertolotti, F.; Curetti, N.; Benna, P.; Gervasio, G. The effects of P–T changes on intermolecular interactions in crystal structure of iodoform. J. Mol. Struct. 2013, 1041, 106–112. [Google Scholar] [CrossRef]
- Shimizu, H. High-pressure Raman study of liquid and molecular crystal at room temperature. Methylene chloride. Chem. Phys. Lett. 1984, 105, 268–272. [Google Scholar] [CrossRef]
- Shimizu, H.; Xu, J.; Mao, H.; Bell, P. High-pressure FT IR measurements of crystalline methylene chloride up to 120 kbar in the diamond anvil cell. Chem. Phys. Lett. 1984, 105, 273–276. [Google Scholar] [CrossRef]
- Podsiadło, M.; Dziubek, K.; Katrusiak, A. In situ high-pressure crystallization and compression of halogen contacts in dichloromethane. Acta Crystallogr. Sect. B Struct. Sci. 2005, 61, 595–600. [Google Scholar] [CrossRef]
- Podsiadło, M.; Katrusiak, A. Isobaric and isochoric freezing of CH2BrCl and isostructural relations between CH2Cl2, CH2Br2 and CH2BrCl. Acta Crystallogr. Sect. B Struct. Sci. 2007, 63, 903–911. [Google Scholar] [CrossRef] [PubMed]
- Podsiadło, M.; Katrusiak, A. Competing Patterns of Weak Directional Forces in Pressure-Frozen CH2ClI and CH2I2. J. Phys. Chem. B 2008, 112, 5355–5362. [Google Scholar] [CrossRef] [PubMed]
- Itié, J.; Chatelet, M. High-pressure Raman study of dibromomethane. Chem. Phys. Lett. 1994, 221, 393–396. [Google Scholar] [CrossRef]
- Podsiadło, M.; Dziubek, K.; Szafrański, M.; Katrusiak, A. Molecular interactions in crystalline dibromomethane and diiodomethane, and the stabilities of their high-pressure and low-temperature phases. Acta Crystallogr. Sect. B Struct. Sci. 2006, 62, 1090–1098. [Google Scholar] [CrossRef]
- Podsiadło, M.; Katrusiak, A. Isostructural relations in dihalomethanes and disproportionation of bromoiodomethane. CrystEngComm 2008, 10, 1436. [Google Scholar] [CrossRef]
- Zhou, Y.; Lee, S.A.; Anderson, A. Raman Studies of Molecular Crystals at High Pressures. III. Methylene Iodide. J. Raman Spectrosc. 1996, 27, 499–502. [Google Scholar] [CrossRef]
- Bao, G.; Duan, D.; Zhou, D.; Jin, X.; Liu, B.; Cui, T. A New High-Pressure Polar Phase of Crystalline Bromoform: A First-Principles Study. J. Phys. Chem. B 2010, 114, 13933–13939. [Google Scholar] [CrossRef]
- Bao, G.; Duan, D.; Tian, F.; Wang, L.; Liu, B.; Cui, T. Structural, electronic, and optical properties of crystalline iodoform under high pressure: A first-principles study. J. Chem. Phys. 2011, 134, 34508. [Google Scholar] [CrossRef]
- Dewaele, A.; Torrent, M.; Loubeyre, P.; Mezouar, M. Compression curves of transition metals in the Mbar range: Experiments and projector augmented-wave calculations. Phys. Rev. B 2008, 78, 104102. [Google Scholar] [CrossRef]
- Wojdyr, M. Fityk: A general-purpose peak fitting program. J. Appl. Crystallogr. 2010, 43, 1126–1128. [Google Scholar] [CrossRef]
- Perdew, J.P.; Burke, K.; Ernzerhof, M. Generalized Gradient Approximation Made Simple. Phys. Rev. Lett. 1996, 77, 3865–3868. [Google Scholar] [CrossRef] [PubMed]
- Clark, S.J.; Segall, M.D.; Pickard, C.J.; Hasnip, P.J.; Probert, M.I.J.; Refson, K.; Payne, M.C. First principles methods using CASTEP. Z. Für Krist. Cryst. Mater. 2005, 220, 567–570. [Google Scholar] [CrossRef]
- Tkatchenko, A.; Scheffler, M. Accurate Molecular Van Der Waals Interactions from Ground-State Electron Density and Free-Atom Reference Data. Phys. Rev. Lett. 2009, 102, 073005. [Google Scholar] [CrossRef] [PubMed]
- Monkhorst, H.J.; Pack, J.D. Special points for Brillouin-zone integrations. Phys. Rev. B 1976, 13, 5188–5192. [Google Scholar] [CrossRef]
- Pfrommer, B.G.; Côté, M.; Louie, S.G.; Cohen, M.L. Relaxation of Crystals with the Quasi-Newton Method. J. Comput. Phys. 1997, 131, 233–240. [Google Scholar] [CrossRef]
- Refson, K.; Tulip, P.R.; Clark, S.J. Variational density-functional perturbation theory for dielectrics and lattice dynamics. Phys. Rev. B 2006, 73, 155114. [Google Scholar] [CrossRef]
- Momma, K.; Izumi, F. VESTA 3for three-dimensional visualization of crystal, volumetric and morphology data. J. Appl. Crystallogr. 2011, 44, 1272–1276. [Google Scholar] [CrossRef]
- Bhagavantam, S.; Venkateswaran, S. The Raman spectra of some organic halogen compounds. Proc. R. Soc. London. Ser. A Math. Phys. Sci. 1930, 127, 360–373. [Google Scholar] [CrossRef]
- Fourme, R.; Renaud, M. Etude de la structure cristalline du chloroforme a 185 degree K. Comptes Rendus Des Seances L’Academie Des Sci. Ser. B 1966, 263, 69. [Google Scholar]
- Andrews, B.; Anderson, A.; Torrie, B. Raman and infrared spectra of crystalline chloroform. Chem. Phys. Lett. 1984, 104, 65–70. [Google Scholar] [CrossRef]
- Welsh, H.L.; Crawford, M.F.; Thomas, T.R.; Love, G.R. Raman Spectroscopy of Low Pressure Gases and Vapors. Can. J. Phys. 1952, 30, 577–596. [Google Scholar] [CrossRef]
- Kawaguchi, T.; Tanaka, K.; Takeuchi, T.; Watanabé, T. The Crystal Structure of Methylene Bichloride, CH2Cl2. Bull. Chem. Soc. Jpn. 1973, 46, 62–66. [Google Scholar] [CrossRef]
- Ito, M. Raman Spectra of Polycrystalline Chloromethanes at Liquid Nitrogen Temperature. J. Chem. Phys. 1964, 40, 3128. [Google Scholar] [CrossRef]
- Brown, C.W.; Obremski, R.J.; Allkins, J.R.; Lippincott, E.R. Vibrational Spectra of Single Crystals and Polycrystalline Films of CH2Cl2 and CH2Br2. J. Chem. Phys. 1969, 51, 1376–1384. [Google Scholar] [CrossRef]
- Mukherjee, A.; Desiraju, G.R. Halogen bonds in some dihalogenated phenols: Applications to crystal engineering. IUCrJ 2013, 1, 49–60. [Google Scholar] [CrossRef]
- Varadwaj, P.R.; Varadwaj, A.; Marques, H.M. Halogen Bonding: A Halogen-Centered Noncovalent Interaction Yet to Be Understood. Inorganics 2019, 7, 40. [Google Scholar] [CrossRef]
- Rahm, M.; Hoffmann, R.; Ashcroft, N.W. Atomic and Ionic Radii of Elements 1-96. Chem. A Eur. J. 2016, 22, 14625–14632. [Google Scholar] [CrossRef]
- Rahm, M.; Ångqvist, M.; Rahm, J.M.; Erhart, P.; Cammi, R. Non-bonded Radii of the Atoms Under Compression. ChemPhysChem 2020. [Google Scholar] [CrossRef]
- The Atoms Under Pressure (AUP) database. Available online: https://www.rahmlab.com/atoms-under-pressure/ (accessed on 15 September 2020).


© 2020 by the authors. Licensee MDPI, Basel, Switzerland. This article is an open access article distributed under the terms and conditions of the Creative Commons Attribution (CC BY) license (http://creativecommons.org/licenses/by/4.0/).