Article

Investigation of the Structural and Luminescent Properties and the Chromium Ion Valence of Li2CaGeO4 Crystals Doped with Cr4+ Ions

1
School of Materials Science and Engineering, Changchun University of Science and Technology, Changchun 130022, China
2
Changchun Polytechnic, Changchun 130033, China
3
Jilin Provincial Science and Technology Innovation Center of Optical Materials and Chemistry, Changchun 130022, China
*
Author to whom correspondence should be addressed.
These authors contributed equally to this work and should be considered co-first authors.
Crystals 2020, 10(11), 1019; https://doi.org/10.3390/cryst10111019
Submission received: 16 September 2020 / Revised: 4 November 2020 / Accepted: 4 November 2020 / Published: 9 November 2020

Abstract

:
Herein, we report on the growth of Cr4+–Li2CaGeO4 crystals by the flux growth method from the flux of LiCl, as well as on the effect of doping Li2CaGeO4 with Cr4+ ions on the NIR region spectral properties and crystal structure. The results quantified the occupancy of Cr4+ in Ge4+ sites. The emission spectrum presented broad bands in the NIR region, i.e., 1000–1500 nm excited by 980 nm, with maximum peaks at 1200 nm at room temperature caused by the transition of 3T23A2 in Cr4+ ions. The lifetime decreased with the Cr4+ ion doping concentration, specifically from 14.038 to 12.224 ms. The chemical composition and the valence state of chromium in Li2CaGeO4 were analyzed using X-ray photoelectron spectroscopy, which showed that the chromium in Li2CaGeO4 was tetravalent and no trivalent chromium was found. Therefore, the Cr4+–Li2CaGeO4 crystal has a great potential and future in optical applications.

1. Introduction

Since the first demonstration of the tetrahedral laser action in coordinated tetravalent chromium at the end of the 1980s [1,2,3], Cr4+-doped media have attracted significant attention in femtosecond [4,5] and tunable solid-state lasers [6,7,8] because they emit very important wavelengths at 1.1–1.6 µm. Cr4+-doped materials have many advantages, including a simple energy level structure, allowing continuous-wave and pulse operation with low threshold pump power, and a broad absorption band overlapping the working wavelengths of several commercial pump lasers [9]. Lasers emitting in this range have increasingly been used in medicine [10], spectroscopy [11], telecommunications systems [12], etc. These lasers possess a number of unique properties, including a broad tuning range, the possibility for direct diode pumping and producing femtosecond pulses, the fact that the transmission maximum of fused silica optical fibers is located within the wavelength range of these lasers, and the fact that radiation of this wavelength range is safe for the eyes [13].
However, due to the lack of truly effective ion hosts, the adoption of Cr4+ lasers has been limited. Currently, the most widely used Cr4+-doped media are Y3Al5O12 (garnet) [1] and Mg2SiO4 (forsterite) [2]. In addition, according to reports, other hosts also have laser effects, including Cr4+–Y2SiO5 [14], Cr4+–Ca2M2SiO7 (M = Al, Ga) [15], Cr4+–CaSnOSiO4 [16], Cr4+–LiMO2 (M = Al, Ga) [17], Cr4+–GSGG [18], Cr4+–Y3Sc0.5Al4.5O12 [19], Cr4+–Ca2GeO4 [20], and Cr4+–LuAG [21]. However, these media have several disadvantages. The fluorescent quantum yield of these media is quite low due to the nonradiative transition of Cr4+ ions; as a result, the quantum efficiency amounts to approximately 9% for Mg2SiO4 and 14–22% for YAG [22]. Another disadvantage is the presence of Cr3+ ions in the Cr4+ ions [23]. Due to the problems mentioned, finding an appropriate medium to perform Cr4+ ion doping is still an active area of research. Currently, the germanate materials are promising candidates due to their tetrahedral environment preferred by Cr4+ [24].
Li2CaGeO4 is a tetragonal system with a spatial structure and lattice constants a = b = 5.14 Å and c = 6.59 Å [25]. As the ionic radius of Cr4+ (CN = 4, 0.39 Å) is very close to the ionic radius of Ge4+ (CN = 4, 0.41 Å), Cr ions can enter germanate crystals, Cr4+ can replace the tetrahedral position of Ge4+, and Cr4+ is thus more compatible in the structure. The appearance of Cr3+ in citrate crystals is avoided, and there is no introduction of Cr3+ impurities in forsterite crystals. In this paper, Cr4+–Li2CaGeO4 crystals were grown using the flux growth method from the flux of LiCl, and the properties of the Cr4+–Li2CaGeO4 crystals were studied.

2. Experimental Procedure

2.1. Sample Preparation

In this paper, in order to reduce the volatilization of the raw materials during the crystal growth process, segregation and other crystals were avoided. First, Li2CaGe1−xCrxO4 polycrystalline material was prepared by the high-temperature solid-phase synthesis method. A series of Li2CaGe1−xCrxO4 samples (x = 0.01, 0.03, 0.05, 0.07, and 0.1) were prepared using CaCO3 (AR), Li2CO3 (AR), GeO2 (99.999%), and Cr2O3 (99.999%) as starting materials, mixed in stoichiometric amounts and sintered at 900 °C for 5 h in an air atmosphere. This prepared polycrystalline material was used as the initial material for the subsequent crystal growth process and some measurements.
Cr4+–Li2CaGeO4 crystals were grown by the flux growth method from the flux of LiCl. The initial solution contained 70 wt% LiCl and 30 wt% Li2CaGe1−xCrxO4. The experiments were performed in platinum crucibles of 70 mm height and 70 mm diameter, and the total amount of the initial solution was 300 g. The crystallization parameters were as follows: Crystal growth temperature range of 700–900 °C. After complete melting of the raw materials, the solution was homogenized at 900 °C for 5 h and the saturation temperature of the melt was measured by the test seed crystal method; crystallization began at 5–10 °C above the saturation temperature, and then dropped to the saturation temperature after 3 h. After constant temperature growth, the drawing rate was 0.1–0.2 mm/h; the seed rotation speed was 18–22 rpm; and the growth cycle was approximately 25 days. Crystals were extracted from the liquid surface and then cooled to room temperature at a rate of 20 °C/hour to obtain crystals. Finally, the completely transparent, dark-green Cr4+–Li2CaGeO4 crystals were grown under the crystallization parameters.

2.2. Characterizations

Differential scanning calorimetry (DSC)/thermogravimetry (TG) for the determination of the synthesis temperature was measured using a Netzsch STA449C at a heating rate of 10 K/min from room temperature to 1400 °C. The crystal structures of all of the samples were checked with X-ray powder diffraction (XRD) (Ultima IV-X) with CuKα radiation at 40 kV and 20 mA at room temperature. The data were collected in the 2θ range of 10–80°. The infrared absorption spectrum of the samples was measured using the PerkinElmer Frontier infrared spectrometer, while the Raman spectrum was measured using the MKI-1000 Raman spectrometer. The luminescence characteristics of the samples were investigated using a steady-state Fluorolog-III spectrofluorometer with a high spectral resolution at room temperature. The fluorescence lifetime of the different doping concentrations of the crystals was measured by Fluorolog-III fluorescence spectroscopy. X-ray photoelectron spectroscopy (XPS) analyses were performed using the EP13-002 electron analyzer. The C (1s) signal (284.6 eV) was employed as a reference for the calibration of the binding energies of different elements to correct for the charge effect. All of the measurements, in addition to the DSC/TG, were performed at room temperature.

3. Results and Discussion

3.1. The Phase Formation Temperature

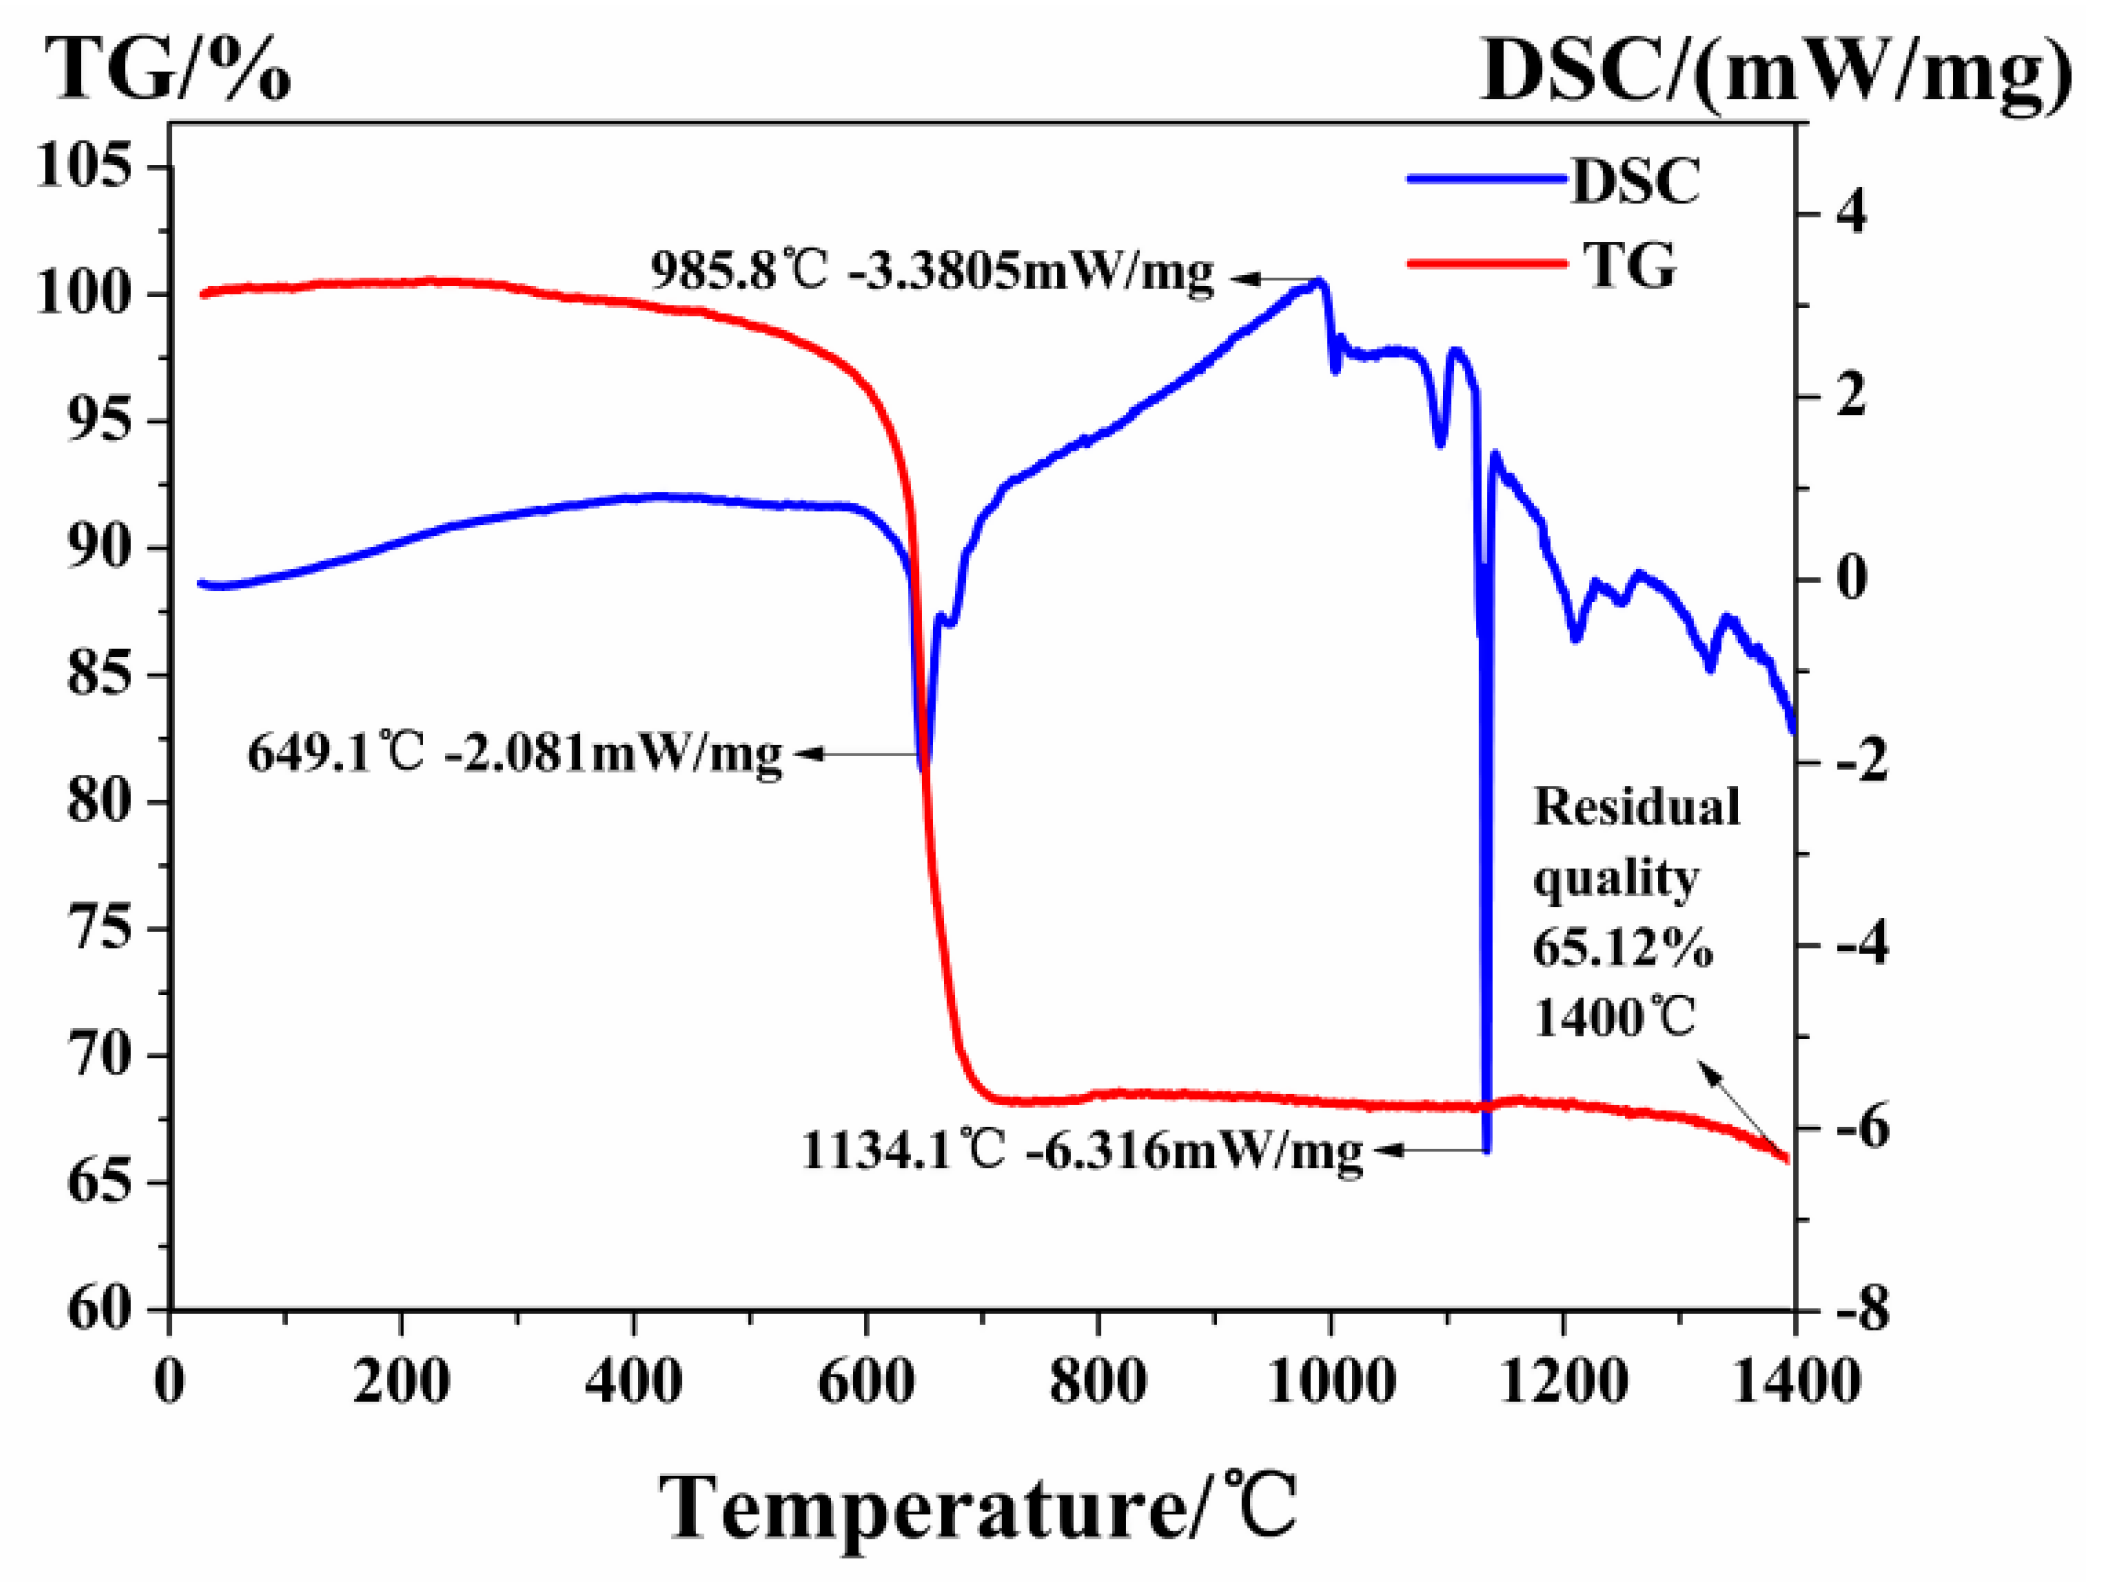
Figure 1 shows a Li2CaGaO4 crystal with a mass of 2.9090 g, while Figure 2 illustrates the DSG/TG curve of the heating process for Li2CaGaO4. The TG curve indicates that the mass loss occurred in three main steps. The first step (from 285 to 600 °C) yielded a weight loss of approximately 4–5%, which was mainly caused by the adsorption of water in the precursor and the adsorption of CO2 on the surface in the form of carbonic acid. This phenomenon can be verified by the DSC curve, where exothermal processes occurred over this temperature range. The second weight loss step was approximately 30–31%, occurring in the temperature range of 600–750 °C and attributed to the decomposition and volatilization of metal carbonates or metal oxides. The DSC curve diagram at 649.1 °C has a sharp endothermic peak in this temperature range, which is also the phase-forming temperature of Li2CaGeO4. The third step yielded a weight loss of approximately 2–3% after 800 °C. The mass loss after 800 °C was mainly due to the volatilization of GeO2. There is a large, sharp endothermic peak at 1134.1 °C, and according to Ref. [24], 1134 °C may be the melting temperature of Li2CaGeO4.

3.2. Crystal Structure Analysis

According to the literature (Table 1) Li2CaGeO4 is a tetragonal crystal system with space group I 4 2 m and lattice parameters a = b = 5.141 Å, c = 6.595 Å, c/a = 1.2828, V = 174.31 Å3, and Z = 2. The Li2CaGeO4 crystal structure consists of [LiO4] and [GeO4] tetrahedra and a [CaO6] octahedron [25]. In the structure of Li2CaGeO4, Ca is in a dodecahedral position, Ge has four types of tetrahedra, and the other tetrahedron is occupied by Li [26]. According to the work reported by Shannon [27], we know the connection between the coordination number and the ionic radius, so we can determine the ionic radii of cations with Li+ ions (CN = 4, ion radius = 0.59 Å), Ca2+ ions (CN = 8, ion radius = 1.12 Å), Ge4+ ions (CN = 4, ion radius = 0.39 Å), and Cr4+ ions (CN = 4, ion radius = 0.41 Å). As the Cr4+ ionic radius is similar to that of Ge4+, Cr4+ ions can replace the cation site Ge4+ in the tetrahedron symmetry.
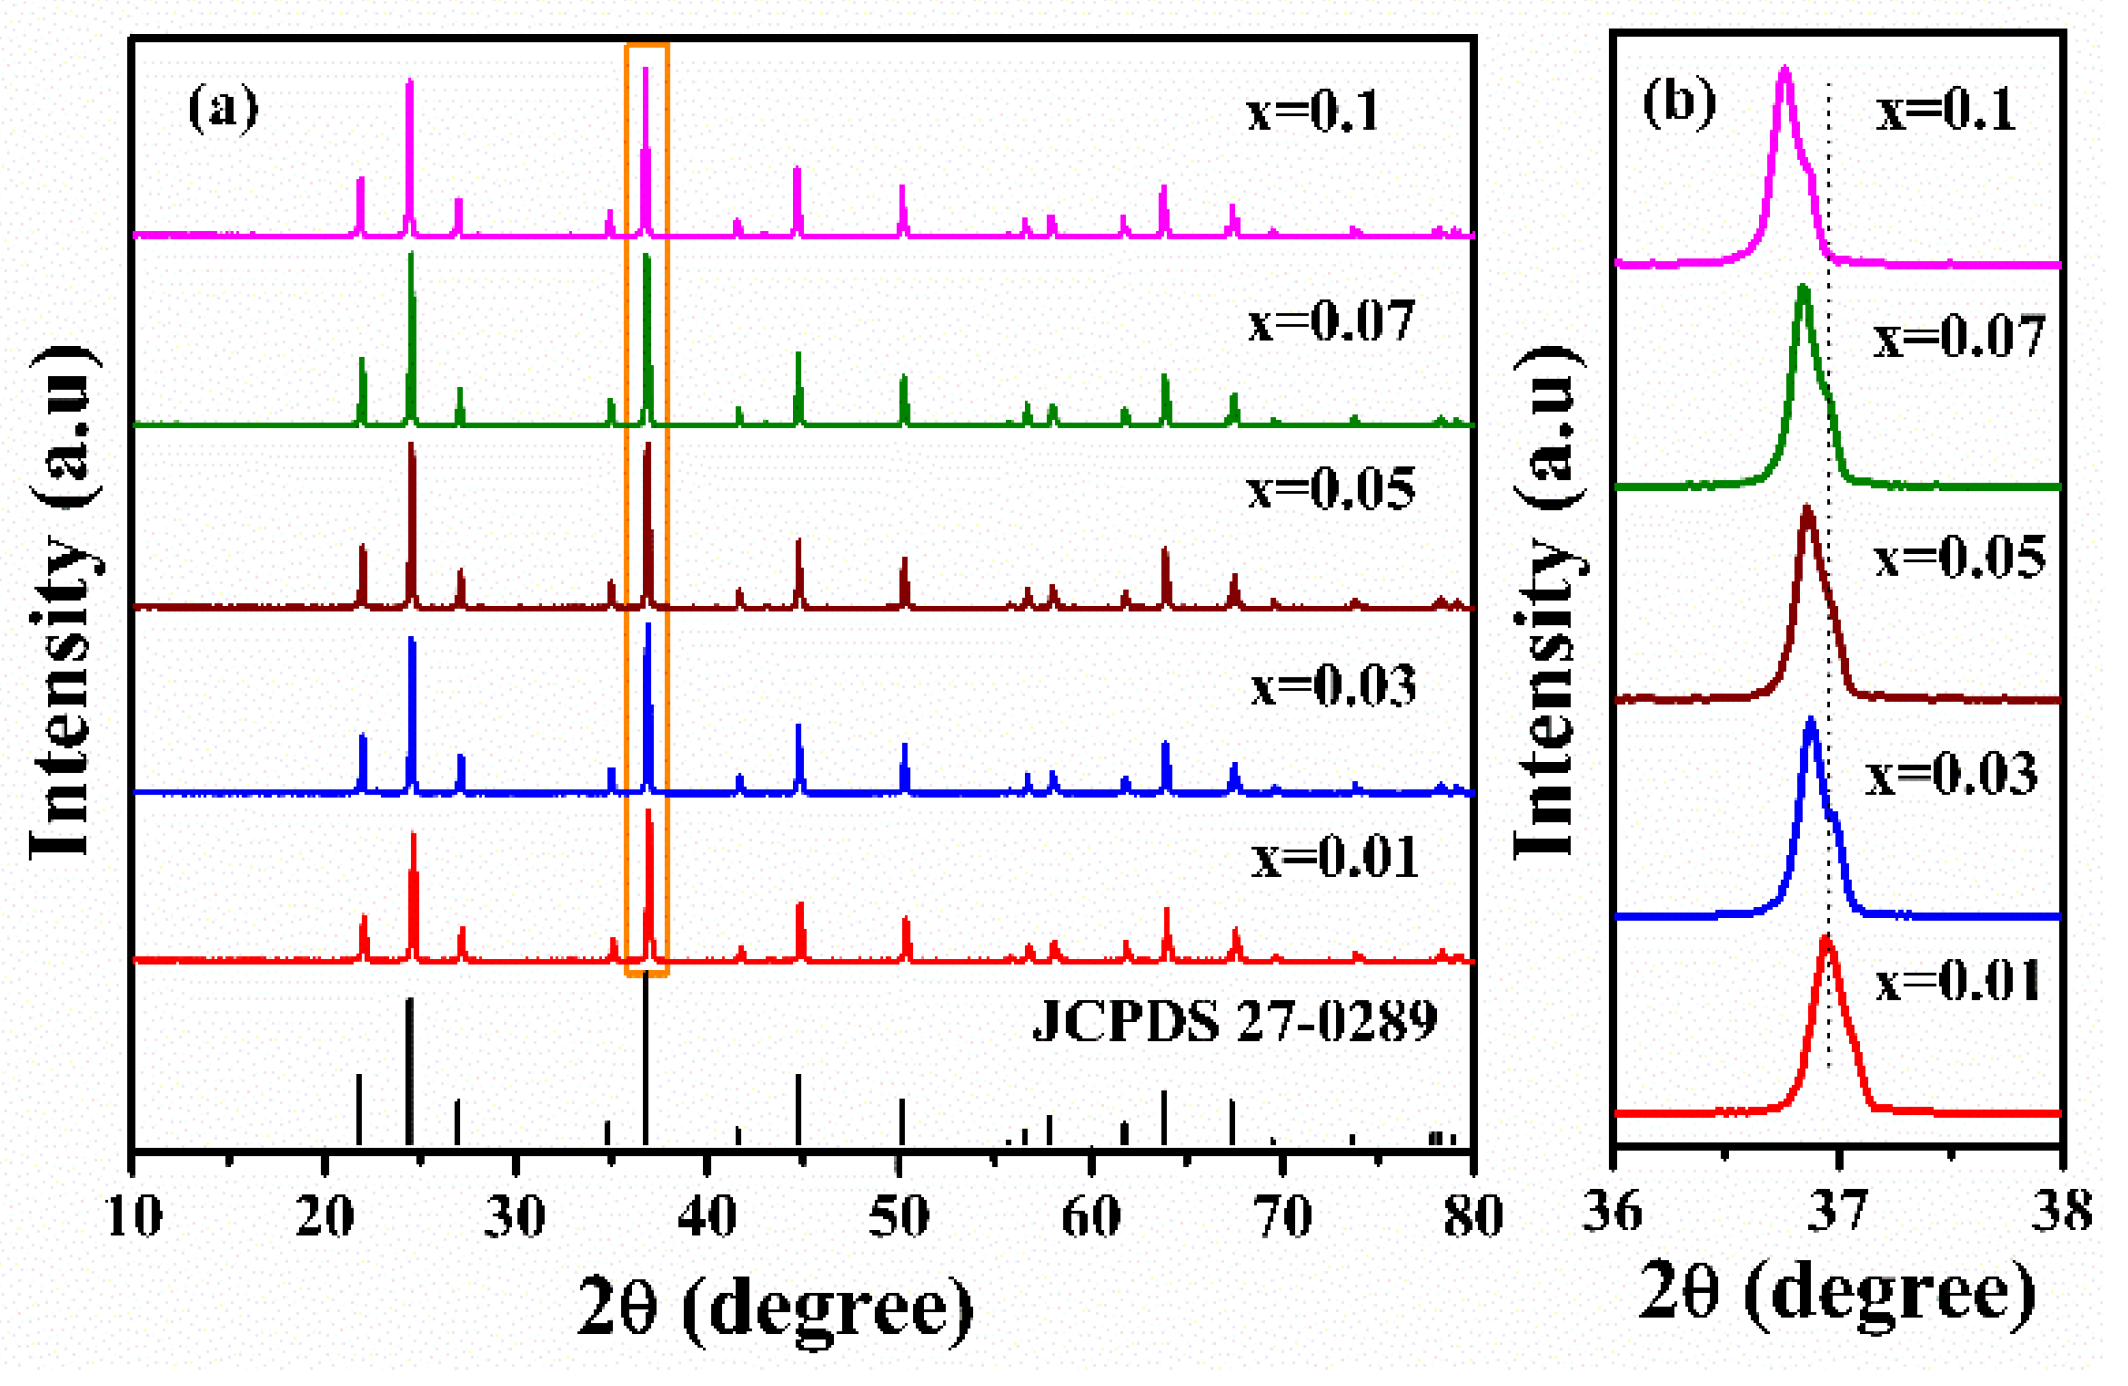
Figure 3a shows the representative XRD patterns of Li2CaGe1−xCrxO4 (x = 0.01, 0.03, 0.05, 0.07, and 0.1), along with the corresponding standard XRD pattern of Li2CaGeO4. All of the diffraction peaks of the as-prepared samples can be matched well with the data of pure Li2CaGeO4 (JCPDS 027-0289). According to the XRD analysis, the upping of Cr4+ ions in the studied concentration did not cause any phase transition or a new phase of the crystal structure. However, the XRD patterns of the Cr4+-doped samples showed regular changes, as evidenced in Figure 3b. With the increase in the Cr4+ doping concentrations, the leading peak compared to the peak of doped Li2CaGeO4 gradually shifted to a low 2θ angle. This change is due to an increase in the number of Cr4+ ions to replace the Ge4+ sites. This phenomenon also confirms that the Cr4+ ions successfully entered the crystal lattice of Li2CaGeO4 and substituted the Ge4+ ions. According to the Bragg equation (Equation (1)):
2 d sin θ = n λ
where d is the spacing between the planes in the atomic lattice, θ is the angle between the incident ray and the scattering planes, n is an integer, and λ is the wavelength of the incident X-ray, the expansion of lattice cells due to the replacement of smaller ionic radii (r) of Cr4+ substituted for Ge4+.

3.3. Fourier Infrared Spectrum Spectroscopy Analysis

The Fourier infrared spectra of Li2CaGe1−xCrxO4 (x = 0.01, 0.03, 0.05, 0.07, and 0.1) are shown in Figure 4. Figure 4a shows the FT-IR spectra in the range of 4000–400 cm−1. It can be seen from the figure that the vibration absorption bands of all samples are basically the same, which proves that the main lattice structure of the doped crystals did not change, which corresponds to the XRD analysis of the Li2CaGe1−xCrxO4 crystals. The main vibration absorption bands of the sample were concentrated in the range of 1000–400 cm−1, and in the range of 4000–1000 cm−1, there were mainly two absorption peaks at 3445 and 1443 cm−1; the vibration absorption band at 3445 cm−1 is a typical characteristic of hydroxyl stretching (γ-OH), while the absorption band at 1443 cm−1 is the absorption band of the OH vibration absorption of water and CO32− of CO2 in the air [28]. Figure 4b shows the FT-IR spectra of the absorption bands in the range of 1000–400 cm−1. In this range, the Li2CaGe1–xCrxO4 crystals showed four main vibration absorption bands: 878, 746, 512, and 425 cm−1. The two absorption bands located at 878 cm−1 were caused by the stretching vibration of Ge–O bonds (terminal groups); the absorption band detected at 746 cm−1 can be attributed to the asymmetrical stretching vibration of Ge–O–Ge bonds; the absorption band at 512 cm−1 was caused by the symmetrical stretching vibration of Ge–O–Ge bonds; the absorption band around 425 cm−1 can be attributed to the deformation vibration of O–Cr–O bonds, which also shows that the Cr ions were indeed doped into the Li2CaGeO4 crystals [29,30,31]. In addition, the absorption band of the symmetrical stretching vibration of the Ge–O–Ge bonds moved in the low-wavenumber direction as the Cr4+ ion doping concentration increased from 512 to 500 cm−1, which means that the energy required for the vibration became lower and the Ge–O–Ge bonds became more unstable. Meanwhile, as the Cr4+ ion doping concentration increased, the Ge–O bond vibration increased, thereby increasing the absorption band at 878 cm−1. This is because when Cr ions occupy the tetrahedral position of Ge ions in Li2CaGeO4 crystals, the Cr ions combine with O ions to form O–Cr–O bonds that break the Ge–O–Ge bonds, resulting in some Ge–O–Ge bonds becoming Ge–O bonds.

3.4. Raman Spectrum Analysis

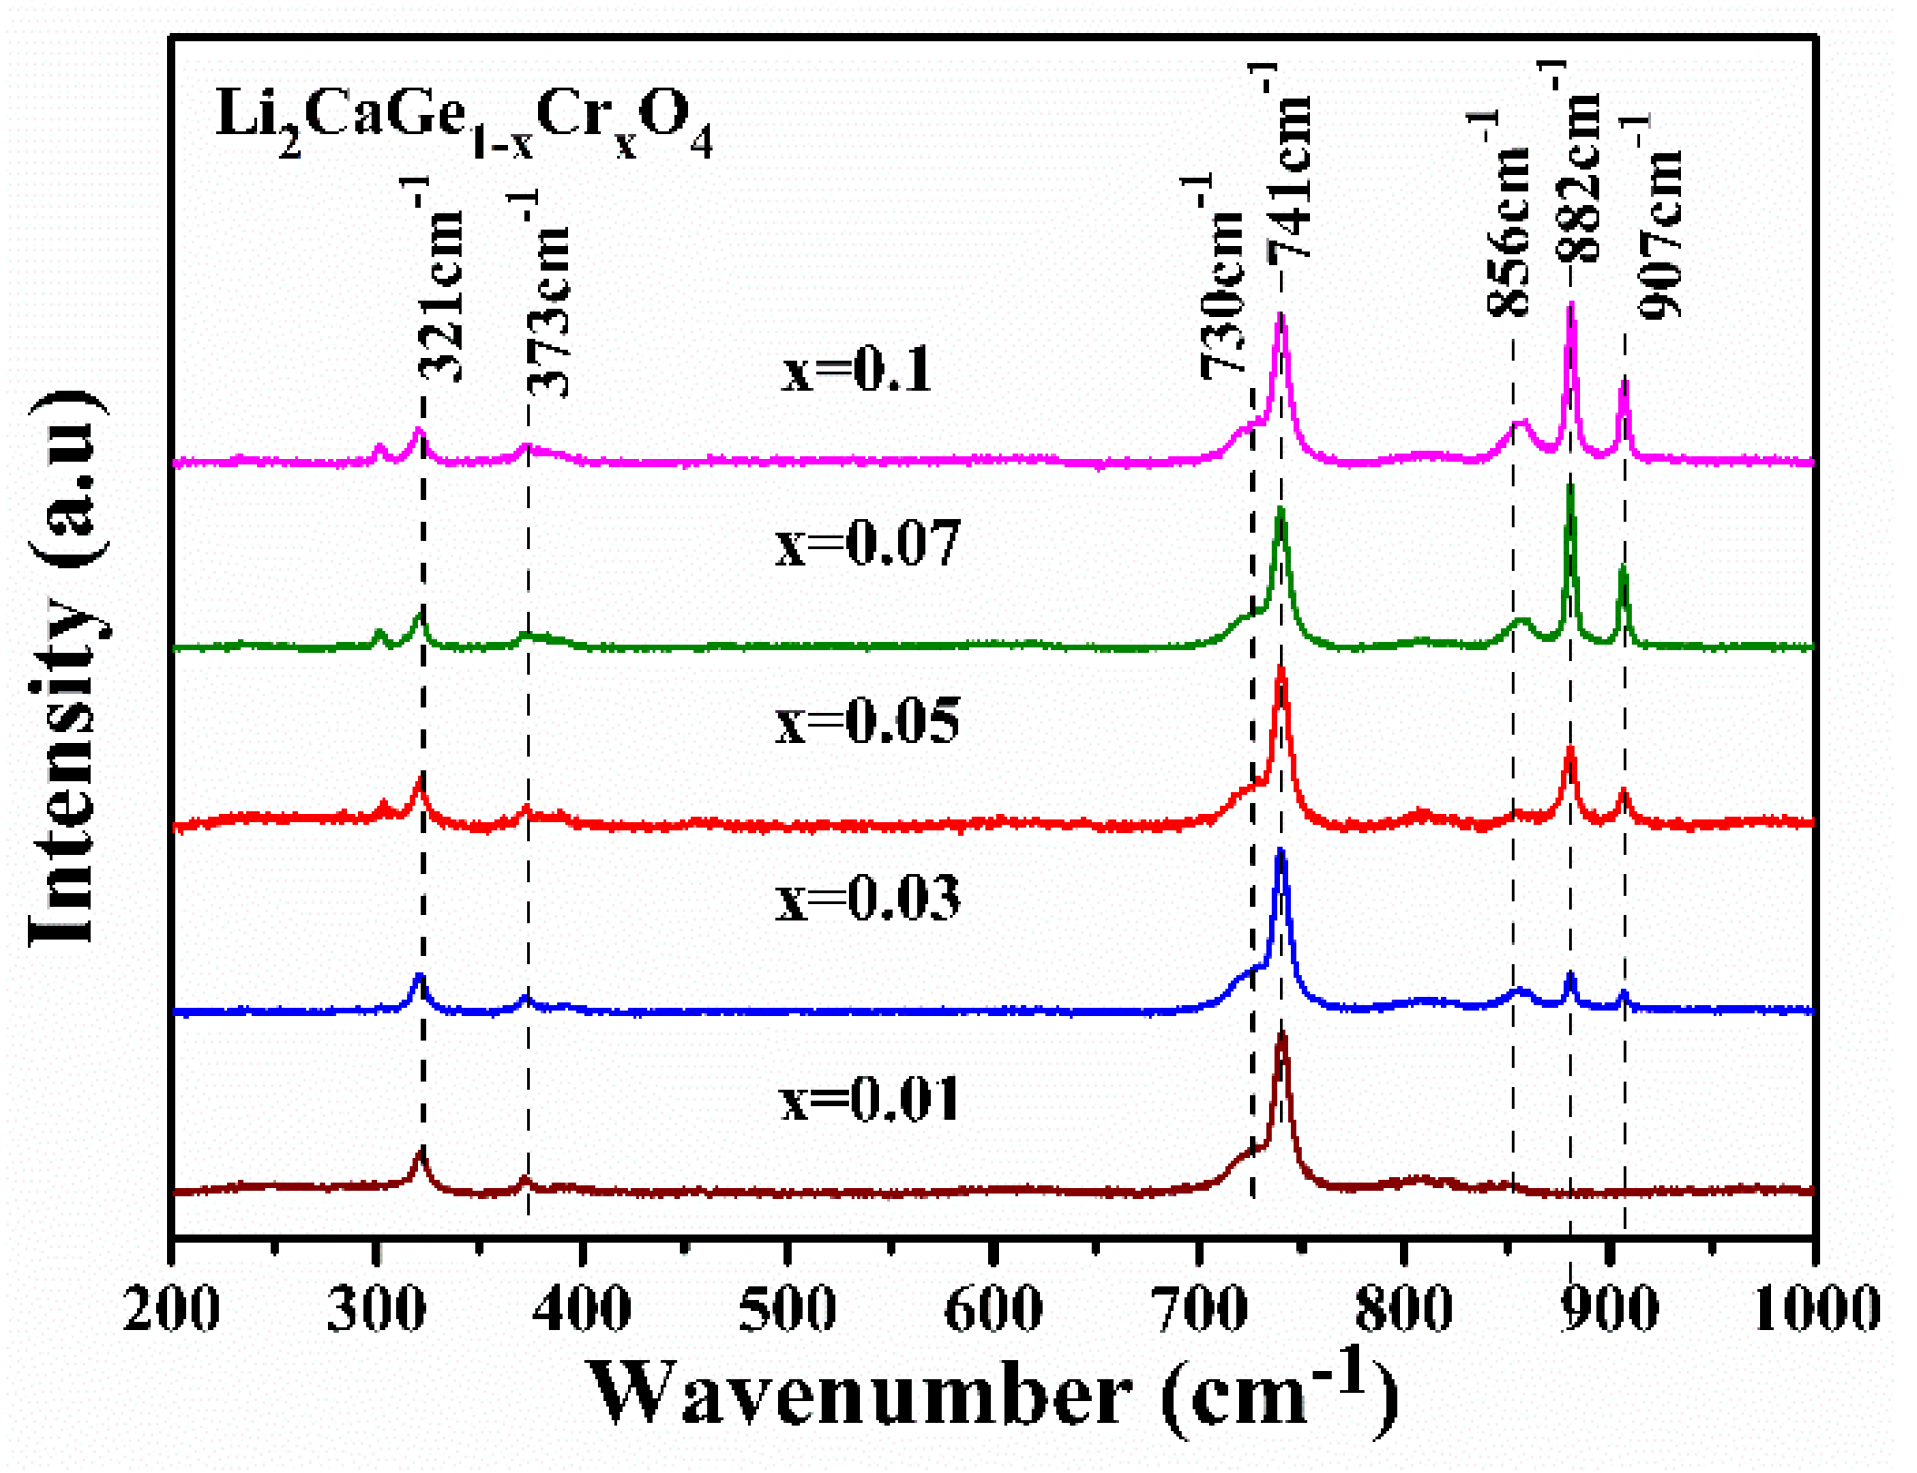
Figure 5 shows the Raman spectra of the Li2CaGe1−xCrxO4 (x = 0.01, 0.03, 0.05, 0.07, and 0.1) crystals, consisting of seven Raman peaks: 321, 373, 730, 741, 856, 882, and 907 cm−1. The first four Raman peaks (i.e., 321, 373, 730, and 741 cm−1) remained basically consistent and did not change with the increase in Cr4+ concentration. The two Raman peaks at 730 and 741 cm−1 were caused by the (GeO4)4+ tetrahedral n3 and n1 stretching modes. The peak located around 373 cm−1 was caused by the bending vibration of O–Ge–O bonds, while the peak at 321 cm−1 can be attributed to the tetrahedral GeO4 vibrations [32,33]. In addition, the intensity of the other three Raman peaks (i.e., 856, 882, and 907 cm−1) gradually increased as the Cr4+ ion doping concentration increased, showing that these three Raman peaks are related to Cr ions. The two Raman peaks located around 856 and 882 cm−1 correspond to the n1 and n3 vibration modes of the CrO4, which also proves that Cr4+ ions preferentially occupy the Ge4+ tetrahedron position in Li2CaGeO4 crystals. Finally, the Raman peak at 907 cm−1 belongs to the symmetric stretching vibration of CrO3 [34,35].

3.5. Luminescence Properties and Analysis

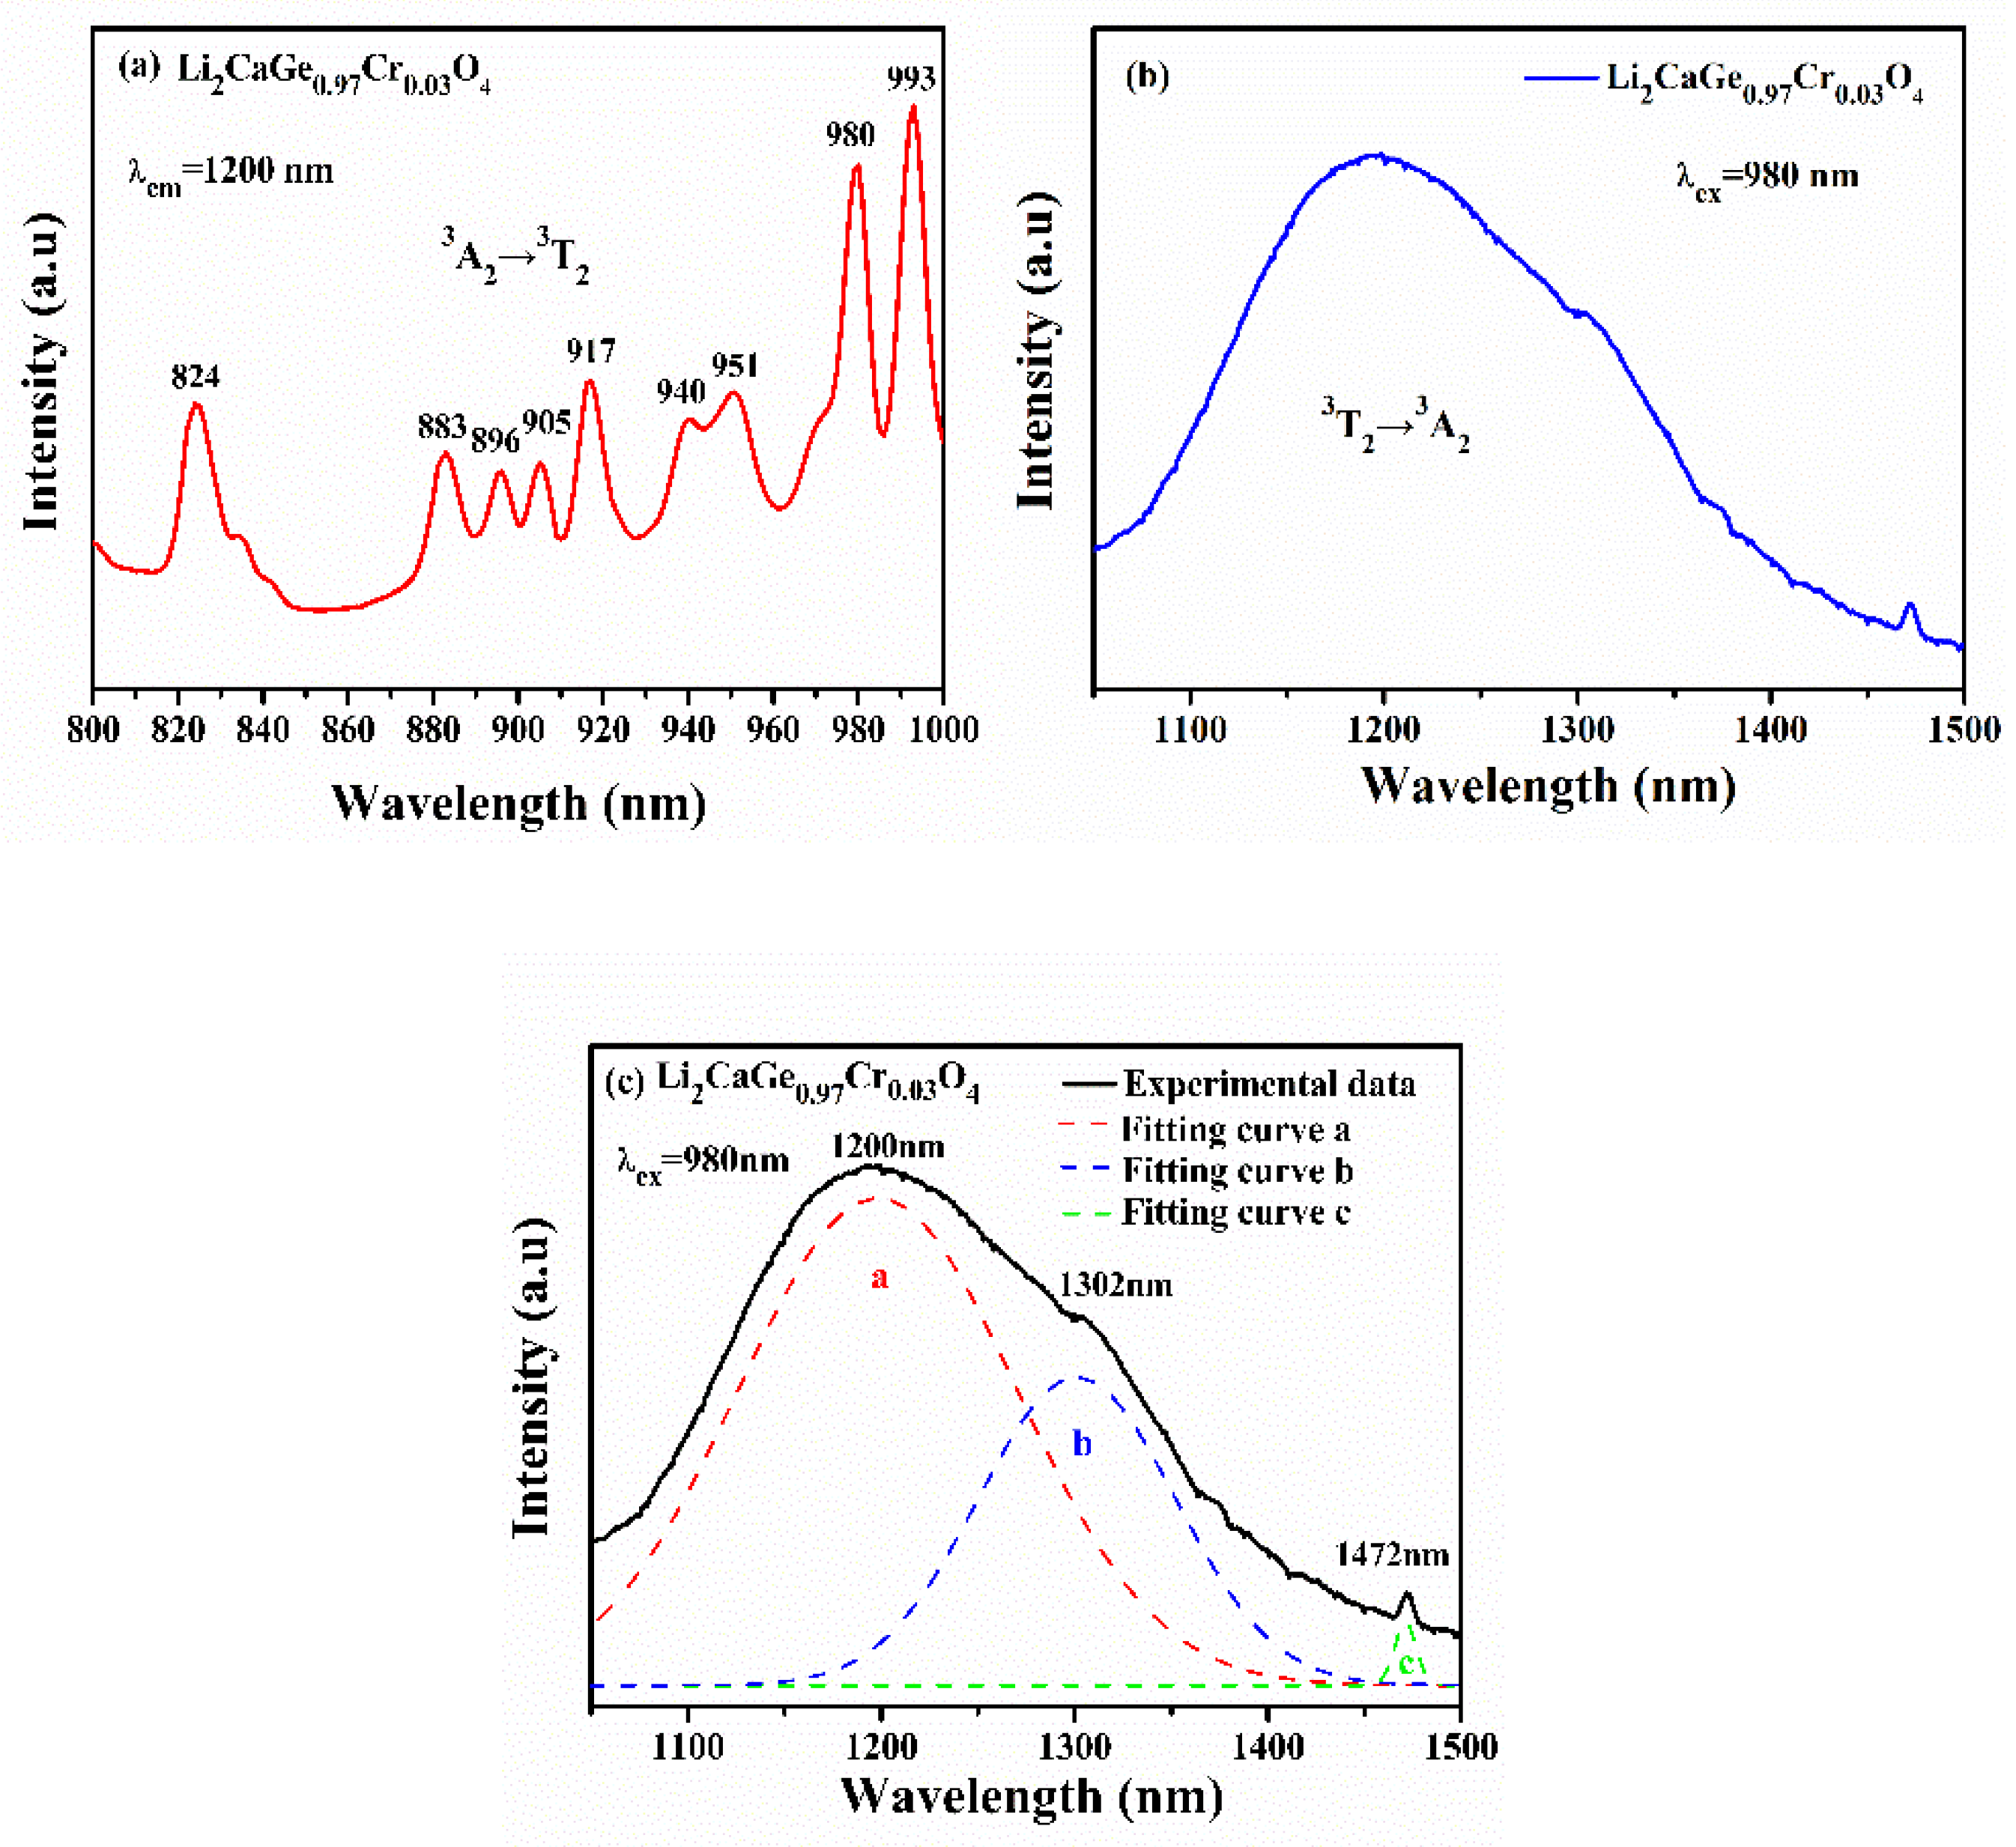
Figure 6 shows the PLE and PL spectra of the Li2CaGe0.97Cr0.03O4 sample at room temperature. Figure 6a shows the excitation spectra of the sample, where the excitation spectrum monitored at 1200 nm covers a broad spectral region from 800 to 1000 nm, which contains nine excitation bands derived from the 3A23T2 transitions of the Cr4+ ion, with the strongest stimulated peak located at 993 nm. The emission spectra are shown in Figure 6b for the 980 nm excitations at room temperature. The emission spectrum of the Li2CaGe0.97Cr0.03O4 sample appeared between 1500 and 1000 nm, with luminescence resulting from the phonon-coupled 3T23A2 transition of the Cr4+ ions [36]. The single band with peaks at 1200 nm (λex = 980 nm) can be attributed to the Cr4+ ions. Figure 6c illustrates the Gaussian fits of the emission spectra for Li2CaGe0.97Cr0.03O4. We obtained three different fitted peaks located at 1200, 1302, and 1492 nm (λex = 980 nm), specified as the transitions of three different orbital components from the 3t2 excited state to the 3A2 ground state [37] (3A″(1)→3A2, 3A′(2)→3A2, 3A′(3)→3A2).
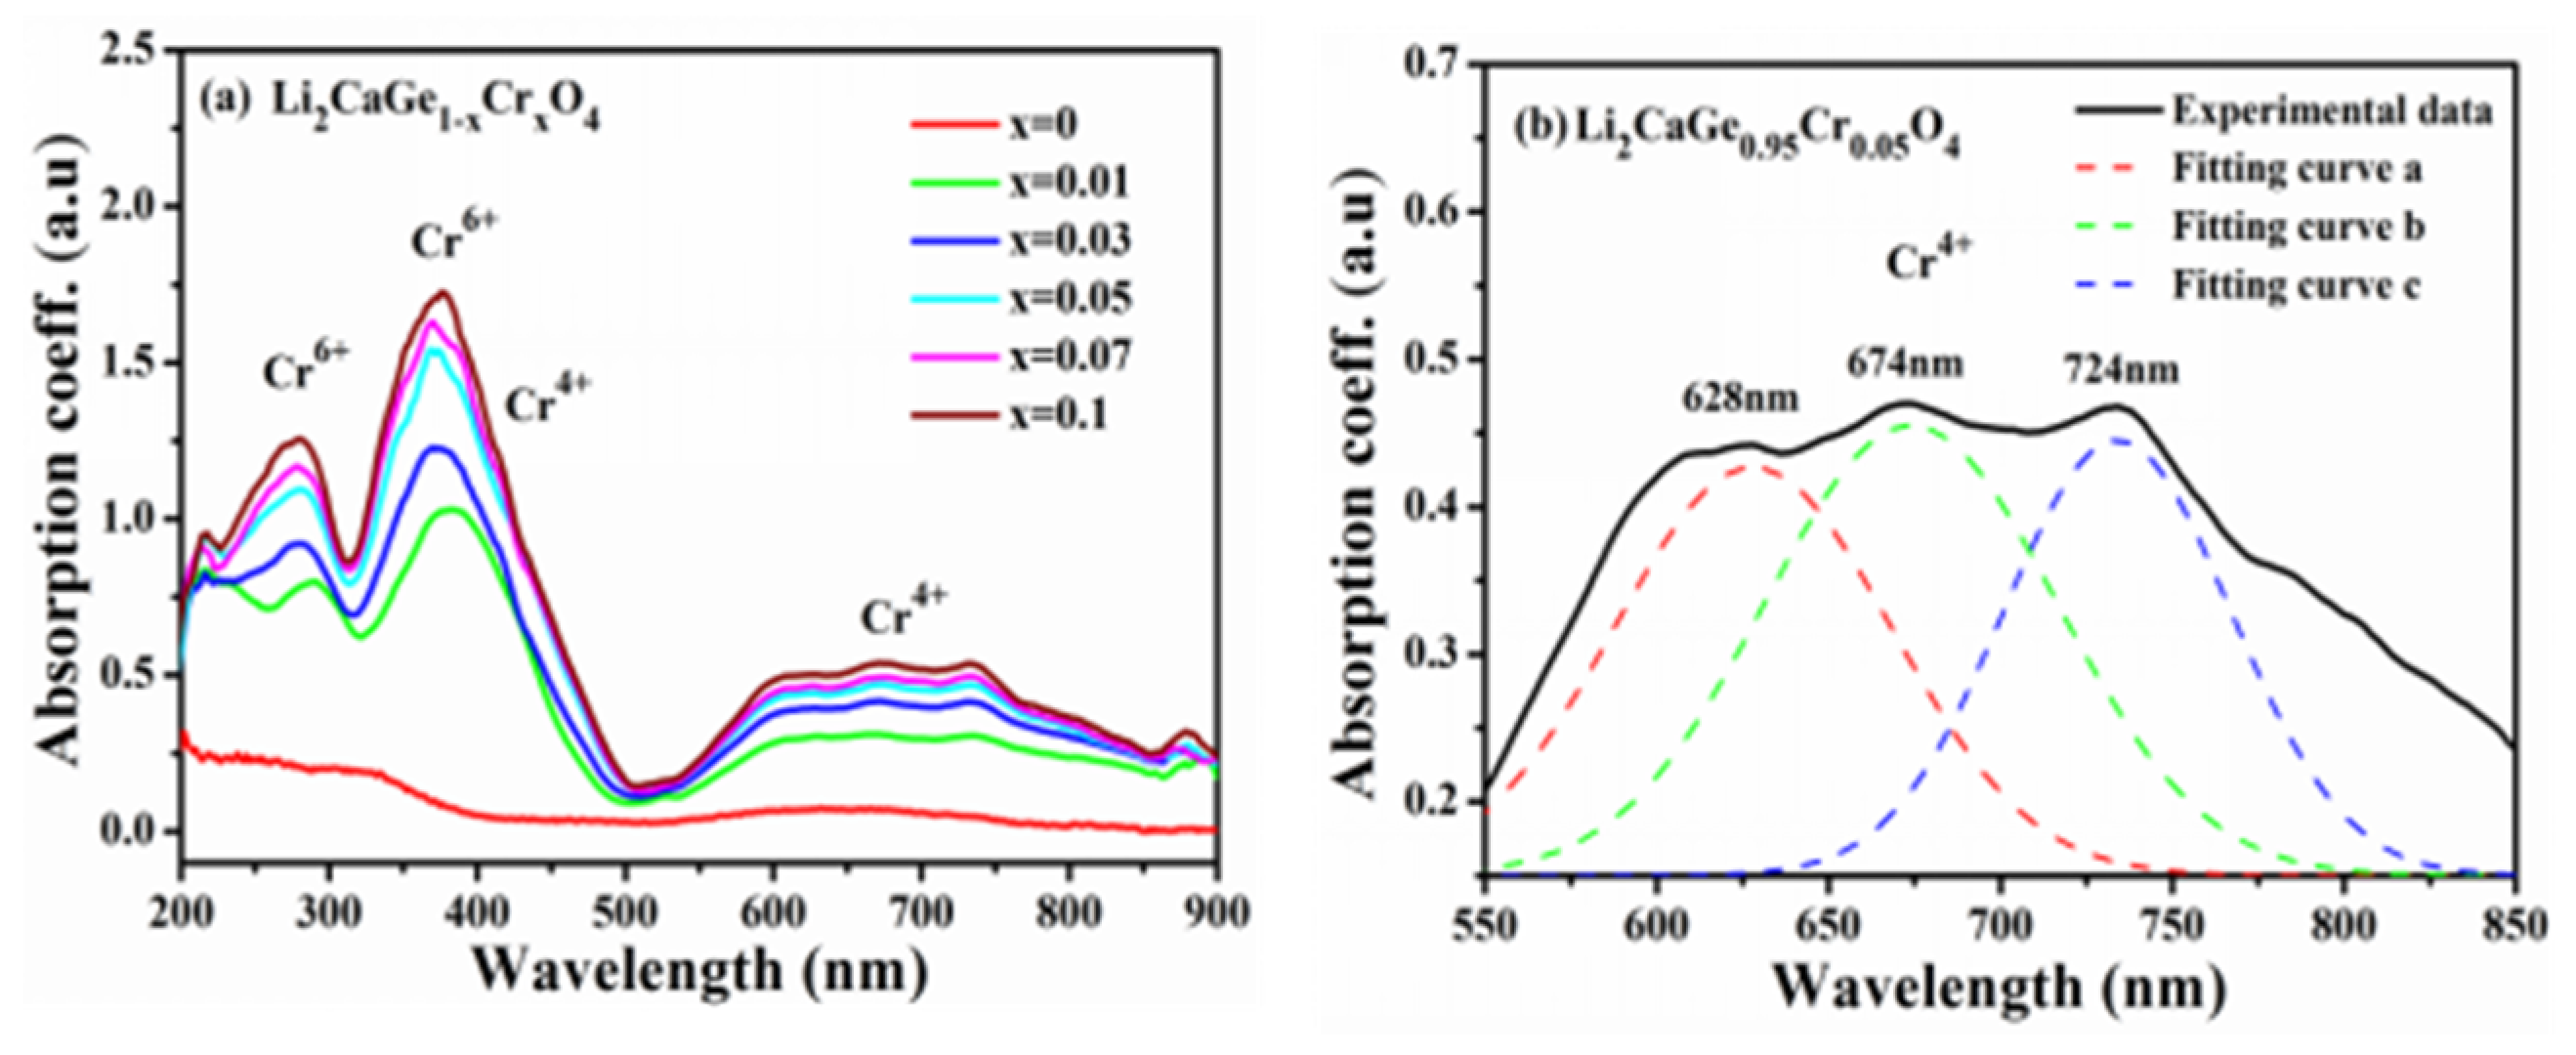
The crystal absorption spectra at room temperature, as shown in Figure 7a, of the Cr4+ doping concentration, crystals, and test range of 200–900 nm, in addition to the absorption peak intensity, rose as the Cr4+ ion doping concentration increased, and the location and shape of the absorption peaks did not change. Three main absorption peaks at 280, 370, and 420 nm and an absorption band in the range of 550–850 nm can be observed in the absorption spectra. The absorption peaks at 280 and 370 nm were caused by the charge transfer transition from oxygen to Cr6+, the absorption peak at 420 nm was caused by the 3A23T1 (3P) energy level of Cr4+, and the absorption band between 550 and 850 nm was caused by the 3A23T1 (3F) energy level of Cr4+ at the tetrahedral position. Between 550 and 850 nm in the absorption spectrum absorption band of the Gaussian fitting, the Gaussian curve, as shown in Figure 7b, can be seen from the diagram inside the absorption band to have three absorption peaks: 628, 674, and 724 nm. This is because the Cr4+ ions of the excited states 3T1 have three different transition tracks for 3A4, 3A5, and 3A6 respectively. The three absorption peaks in the absorption band correspond to three different electron-polarized transition orbitals from the ground-state energy level 3A2 of Cr4+ ions to the excited-state level 3T1. Besides these three main absorption peaks, the other weak absorption peaks were caused by the vibration side band transition of the zero phonon line. The absorption band in the range of 750–900 nm was caused by the transition from the Cr4+ ions’ ground-state level 3A2 to the excited-state level 3T2.
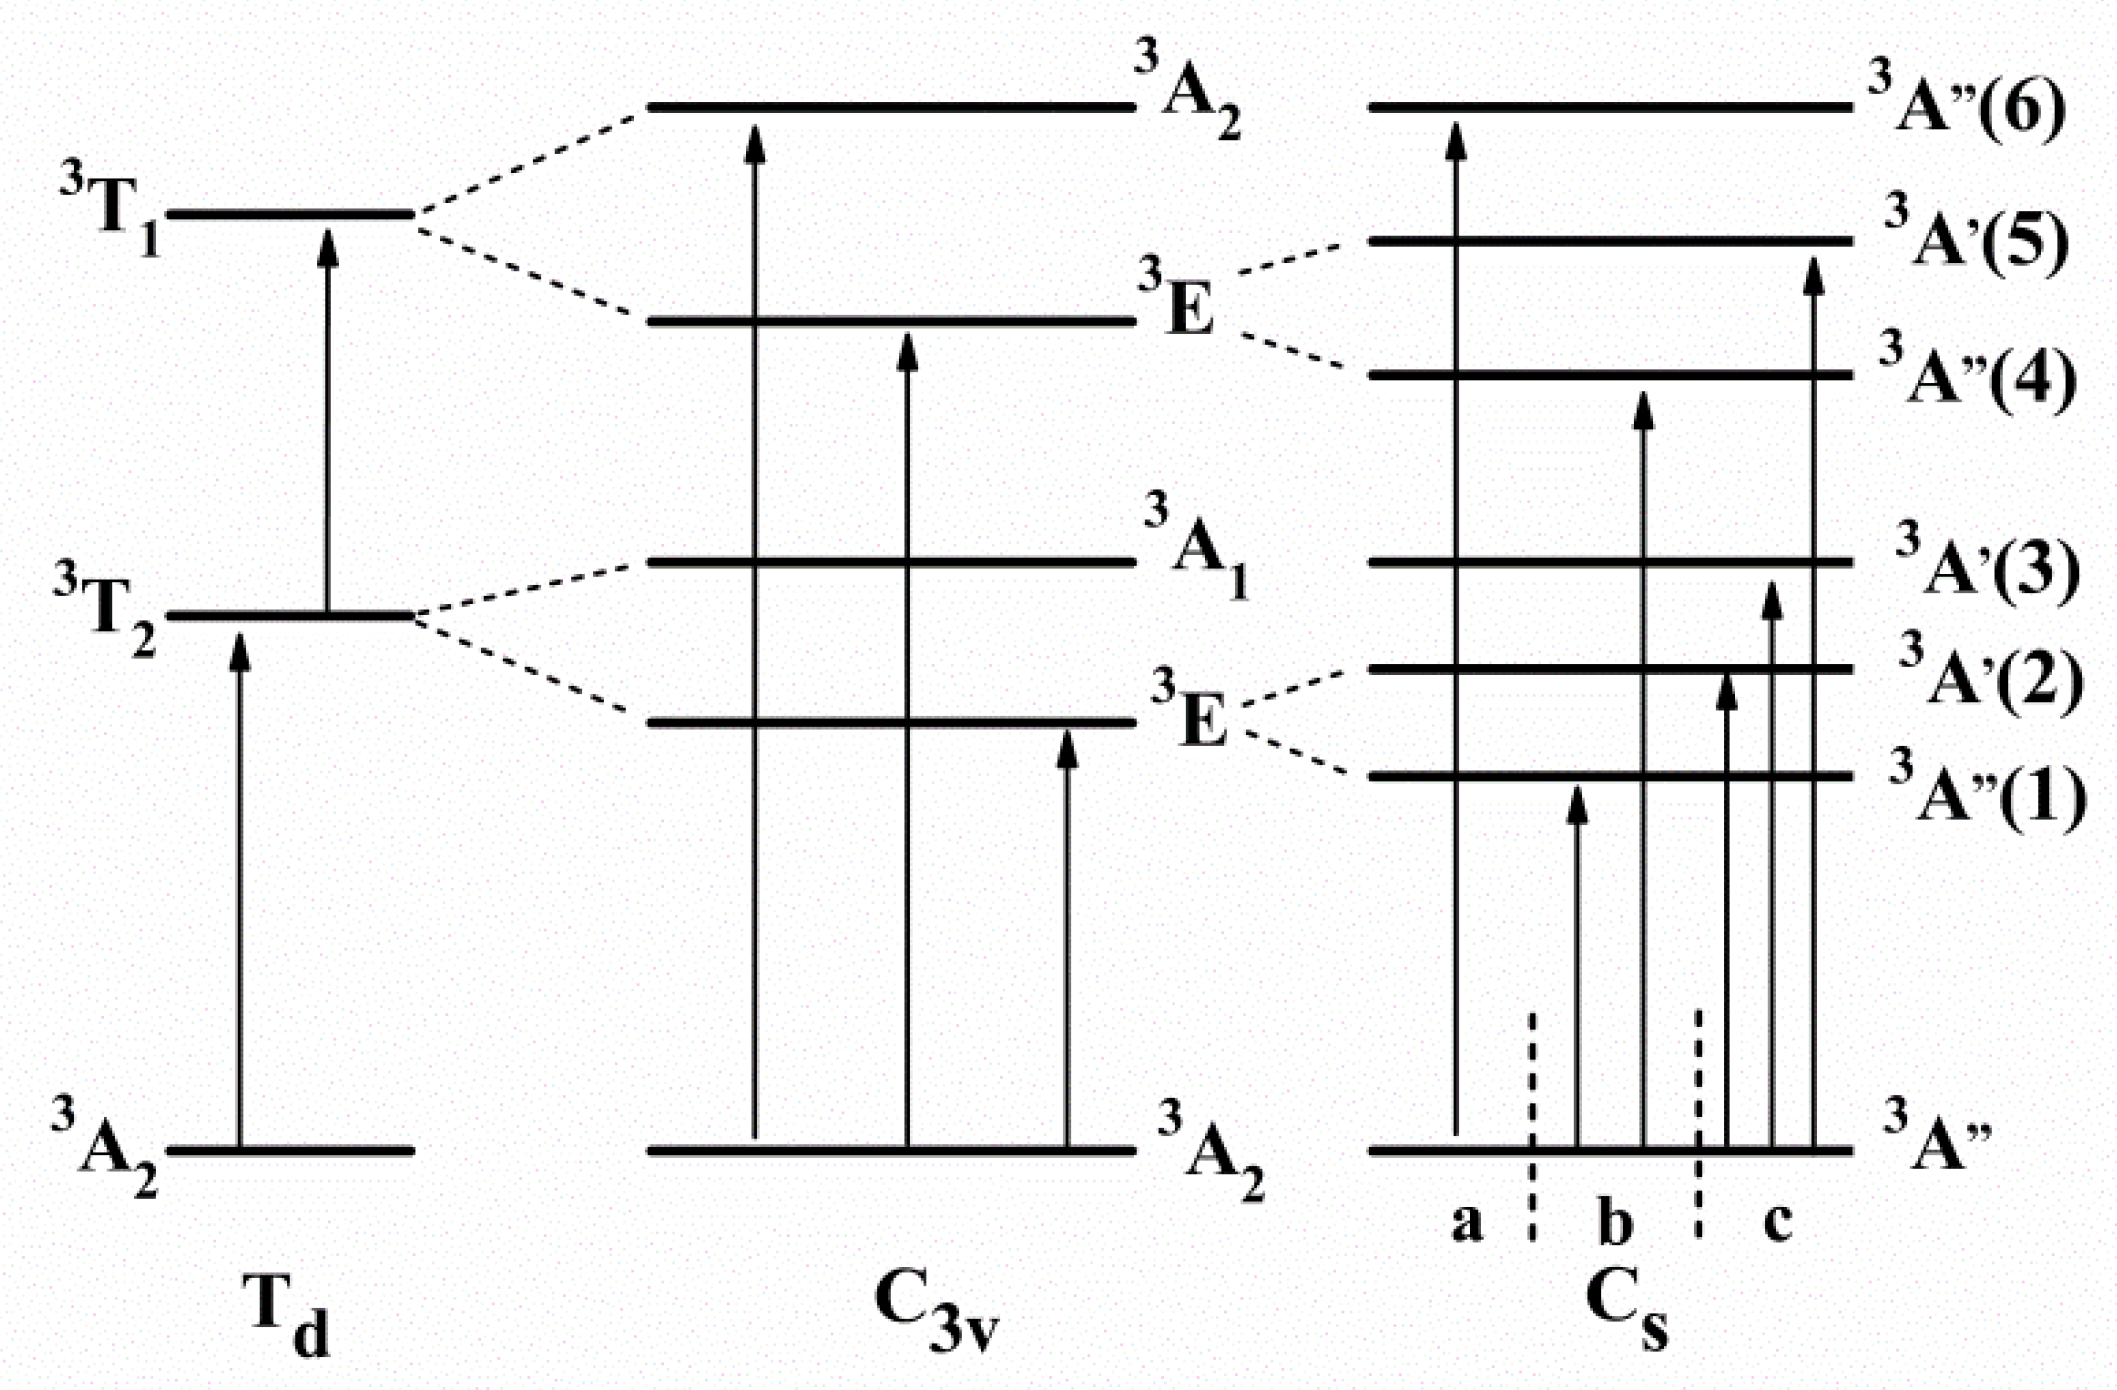
Figure 8 illustrates the energy level diagram of the Cr4+ ions for the two lowest high-spin terms, namely, 3T1 and 3T2. According to the Tanabe–Sugano diagram of the Cr4+ ions, in the ideal tetrahedral position of Td symmetry, the lowest free-ion level of the d2–Cr4+ ions is 3F. Due to the splitting of the crystal field, the free-ion level is split as follows: 3F→3A2 + 3T2 + 3T1. The energy order of these levels is as follows: 3T1 > 3T2 > 3A2. Generally, the 3A2 energy level can be considered to be a ground state and the 3A23T1 transition is an allowed electric dipole (spin-allowed), while 3A23T2 is an allowed magnetic dipole. Based on the structure of Li2CaGeO4, the local environmental symmetry is less than the Td symmetry, and the tetrahedron is distorted along the two axes, which splits the 3T1 and 3T2 bands into three components. The most probable chain of descent of symmetry is Td→C3v→Cs.
The dependence of the emission spectra on the Cr4+ doping concentration was investigated, and the results are shown in Figure 9. Here, the emission spectra of Li2CaGe1−xCrxO4 (x = 0.01, 0.03, 0.05, 0.07, and 0.1) with excitations of 980 nm at room temperature are characterized. When the Cr doping concentration increased from 1 to 5 mol%, the emission intensity monotonically also increased, reaching a maximum at x = 5 mol%. However, a further increase in the Cr4+ concentration (9 and 12 mol%) resulted in a reduction in emission intensity due to concentration quenching, which was caused by energy transfer between the Cr4+ ions. The experimental results indicate that the optimal Cr4+ ion concentration is 5 mol% in Cr4+–Li2CaGeO4. Generally, the energy transfer rate between luminescent centers increases with the number of active ions, and so does the energy transfer rate from the luminescent center to the traps nearby. The critical energy transfer distance (Rc) between the neighboring donors (activators) and acceptors (quenching site) can be expressed by Dexter’s theory [38] (Equation (2)):
R c = 2 × ( 3 V / 4 π X c N ) 1 / 3
where V is the unit cell volume of the host lattice, Xc is the critical concentration, and N is the number of sites available for the dopant in the unit cell. In the case of Li2CaGeO4, N = 2, V = 174.3 Å3 [39], and Xc was experimentally determined to be 0.05. As a result, the critical Rc value of the Cr4+ ions in Li2CaGeO4 was calculated to be approximately 14.93 Å. In general, nonradiated electron transfer from the excitation agent to the activator may be the result of exchange and multipolar electrical interactions. Here, the critical Rc value is 14.93 Å; the value of Rc is much larger than the typical distance (Rc < 5 Å) that is required for an exchange interaction, inferring that the concentration quenching mainly takes place via electric multipolar interactions between the Cr4+ ions. The type of multipolar energy transfer mechanism between the Cr4+ ions can be determined by the following formula (Equation (3)) [40]:
I x = K [ 1 + β ( x ) θ / 3 ] 1
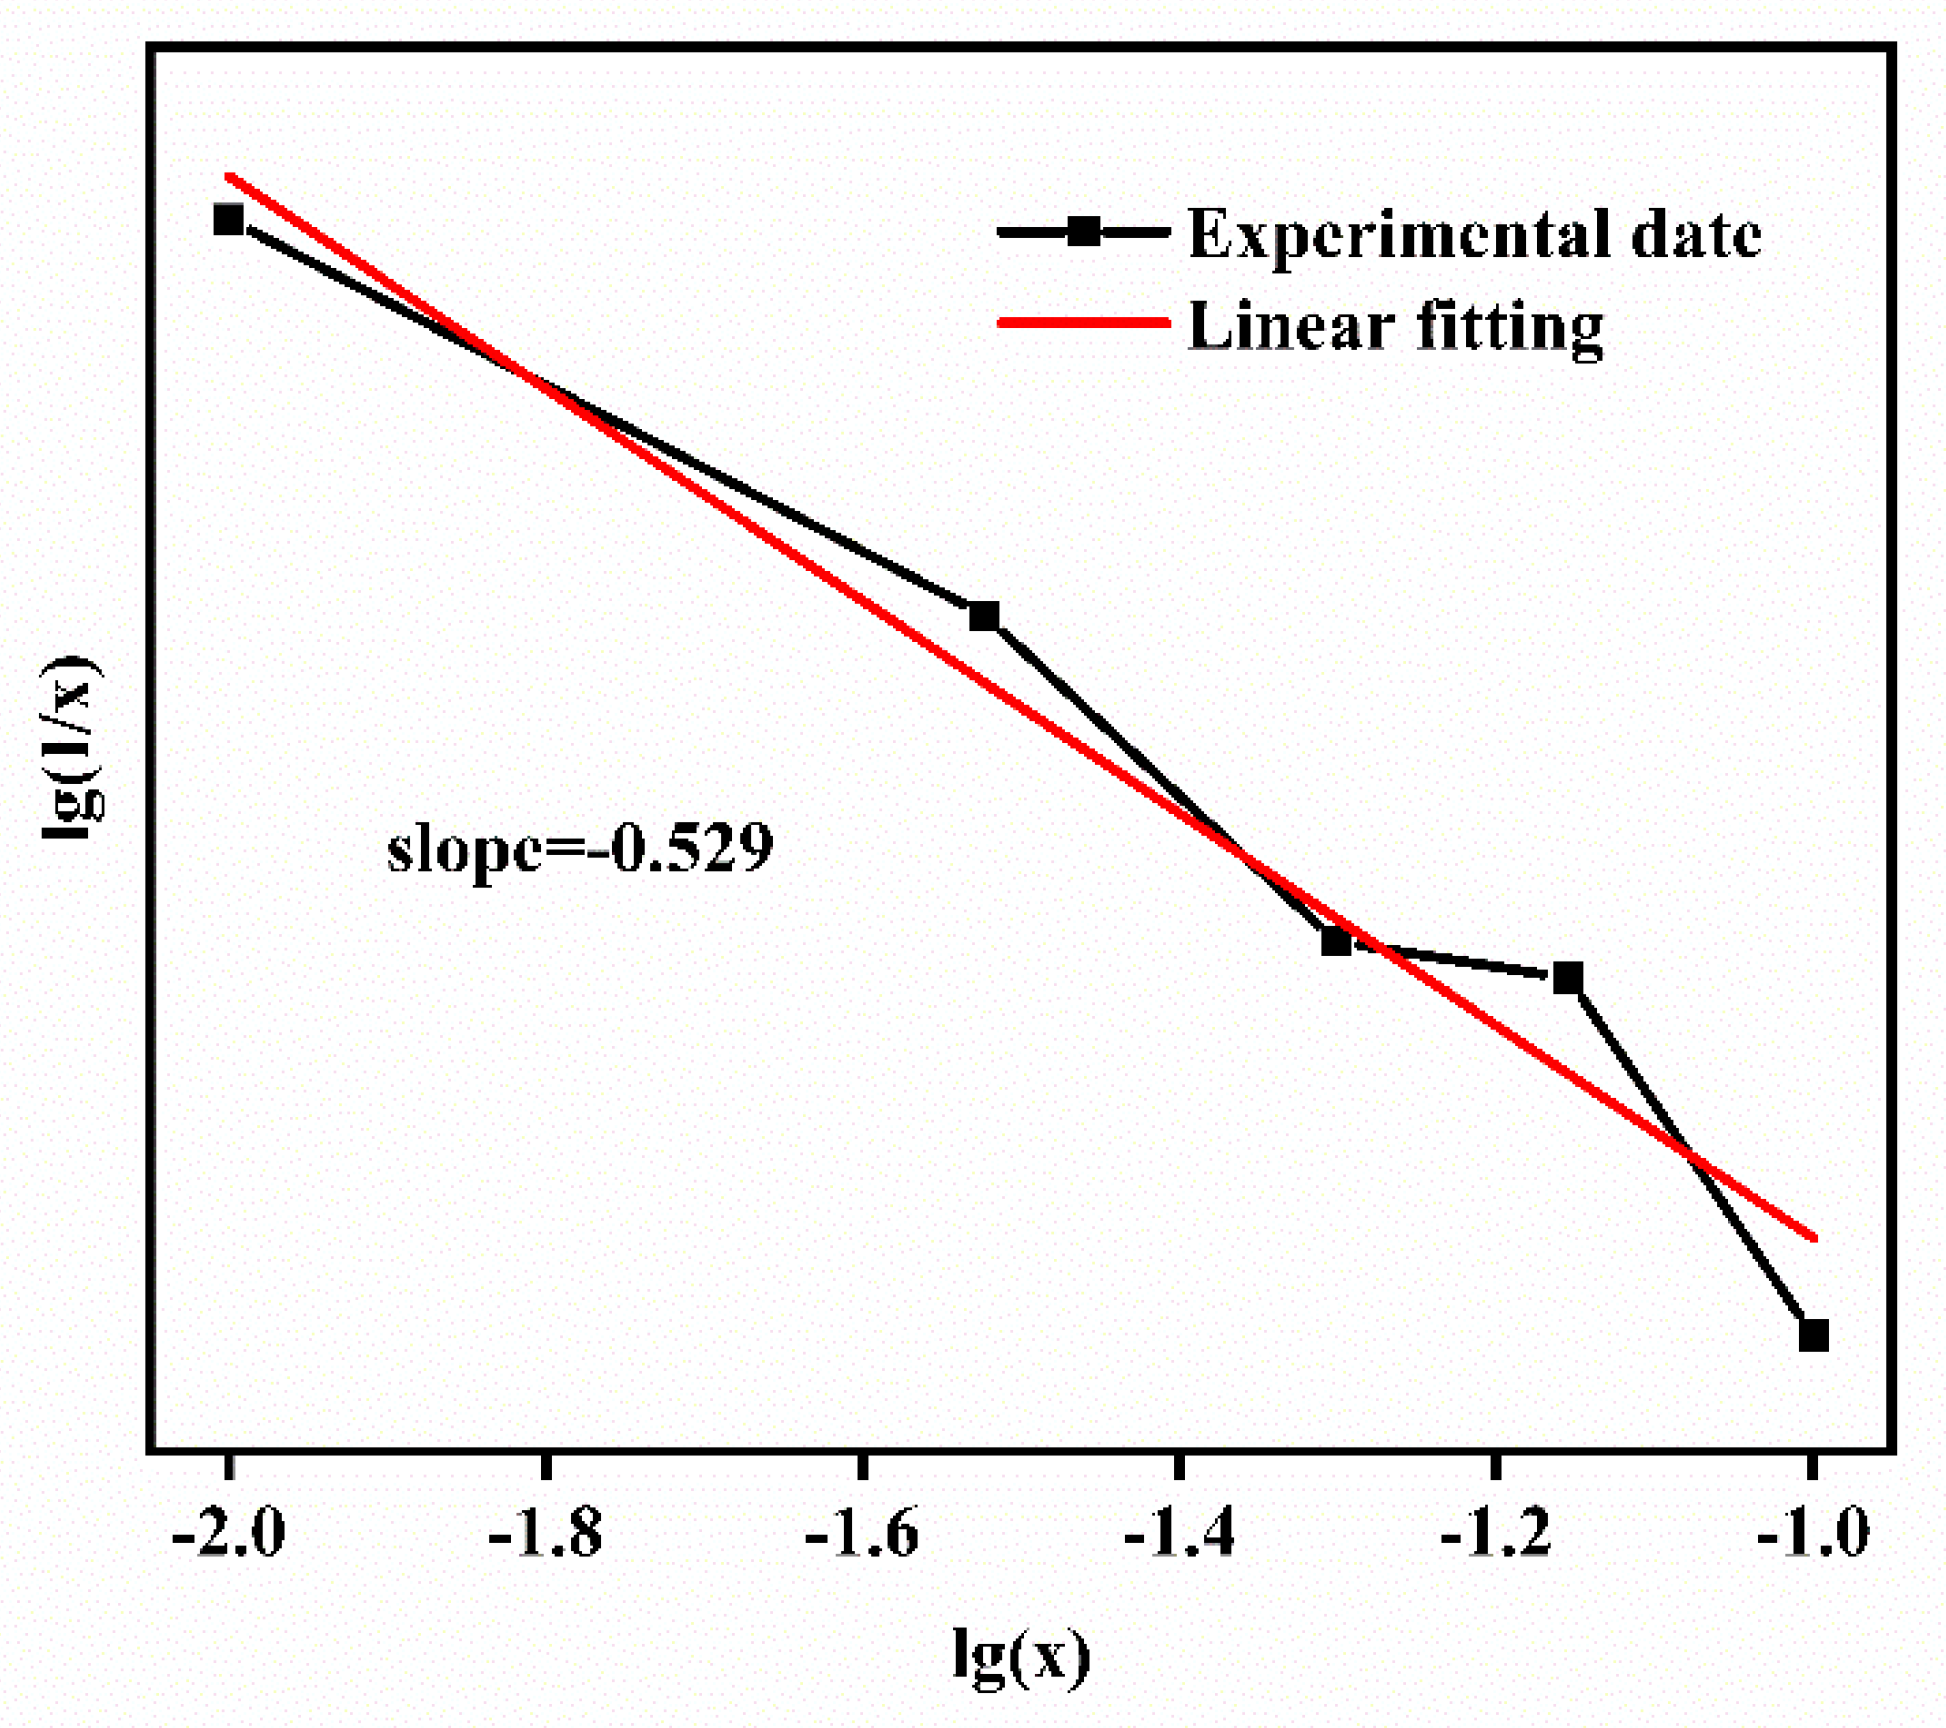
where I is the emission intensity at the concentration of the activator (x), K and β are the constants for each type of interaction in a specific host lattice, and the values of θ = 6, 8, and 10 correspond to the dipole–dipole (d–d), dipole–quadrupole (d–q), and quadrupole–quadrupole (q–q) interactions [41], respectively. According to Equation (3), the dependence of lg(I/x) on lg(x) is plotted in Figure 10. The fit result appears to be linear with a slope of –0.529; therefore, the calculated value is approximately 6, indicating that the d–d interaction mechanism acts as the leader in the excitation process of the Cr4+ center in the Li2CaGeO4 body.

3.6. Fluorescence Lifetime Analysis

The data are normalized, and Figure 11a shows the fluorescence decay curves of the Li2CaGe1–xCrxO4 crystals (x = 0.01, 0.03, 0.05, 0.07, and 0.1) by monitoring the 1200 nm emission with excitation at 980 nm. The decay curves measured for all samples can be fitted well by an exponential function expressed by the following equation [42]:
I = A exp ( t τ ) + I 0
where I and I0 are the luminescence intensities with time t and 0, respectively, A is a constant, t is time, and τ is the decay time for the exponential components. According to the above fitting equation, the decay time of Li2CaGe1–xCrxO4 (x = 0.01, 0.03, 0.05, 0.07, and 0.1) is 13.895, 12.672, 12.268, 11.961, and 11.828 ms, respectively. The function of the lifetime of the Cr4+ ions at 1200 nm (3T23A2) and the concentration in Li2CaGeO4 is shown in Figure 11b. As the Cr4+ ion doping concentration increased, the fluorescence lifetime of the samples gradually decreased. This may be due to the increase in the doping concentration of the Cr4+ ions itself, which leads to an increase in the cross-relaxation between two adjacent Cr4+ ions. Generally, there are a number of reasons that can cause decay kinetics behavior, including the number of luminescent centers, energy transfer, and defect types. If the Cr4+ ions occupy different positions in the host lattice, different luminescent centers will be generated, resulting in multi-exponential behavior [43]. However, the fluorescence decay curve in the Li2CaGeO4 host is consistent with a single exponential behavior. This indicates that the Cr4+ ions have only one luminescence center in Li2CaGeO4 with the Cr4+ ions only occupying the position of the Ge4+ ions.

3.7. XPS Analysis of the Li2CaGe0.95Cr0.05O4 Crystals

Figure 12 shows the XPS survey spectra of the Li2CaGe0.95Cr0.05O4 crystals, and Figure 10 shows that the signals of calcium (Ca), germanium (Ge), oxygen (O), and carbon (C) elements are clear. Simultaneously, relatively weak chromium (Cr) signals can also be observed. In the case where the carbon (C) element was not an intrinsic component in the crystals, the role of carbon was used to calibrate the binding energy. The peak banding energies of the elements in the Li2CaGe0.95Cr0.05O4 crystals are shown in Table 2.
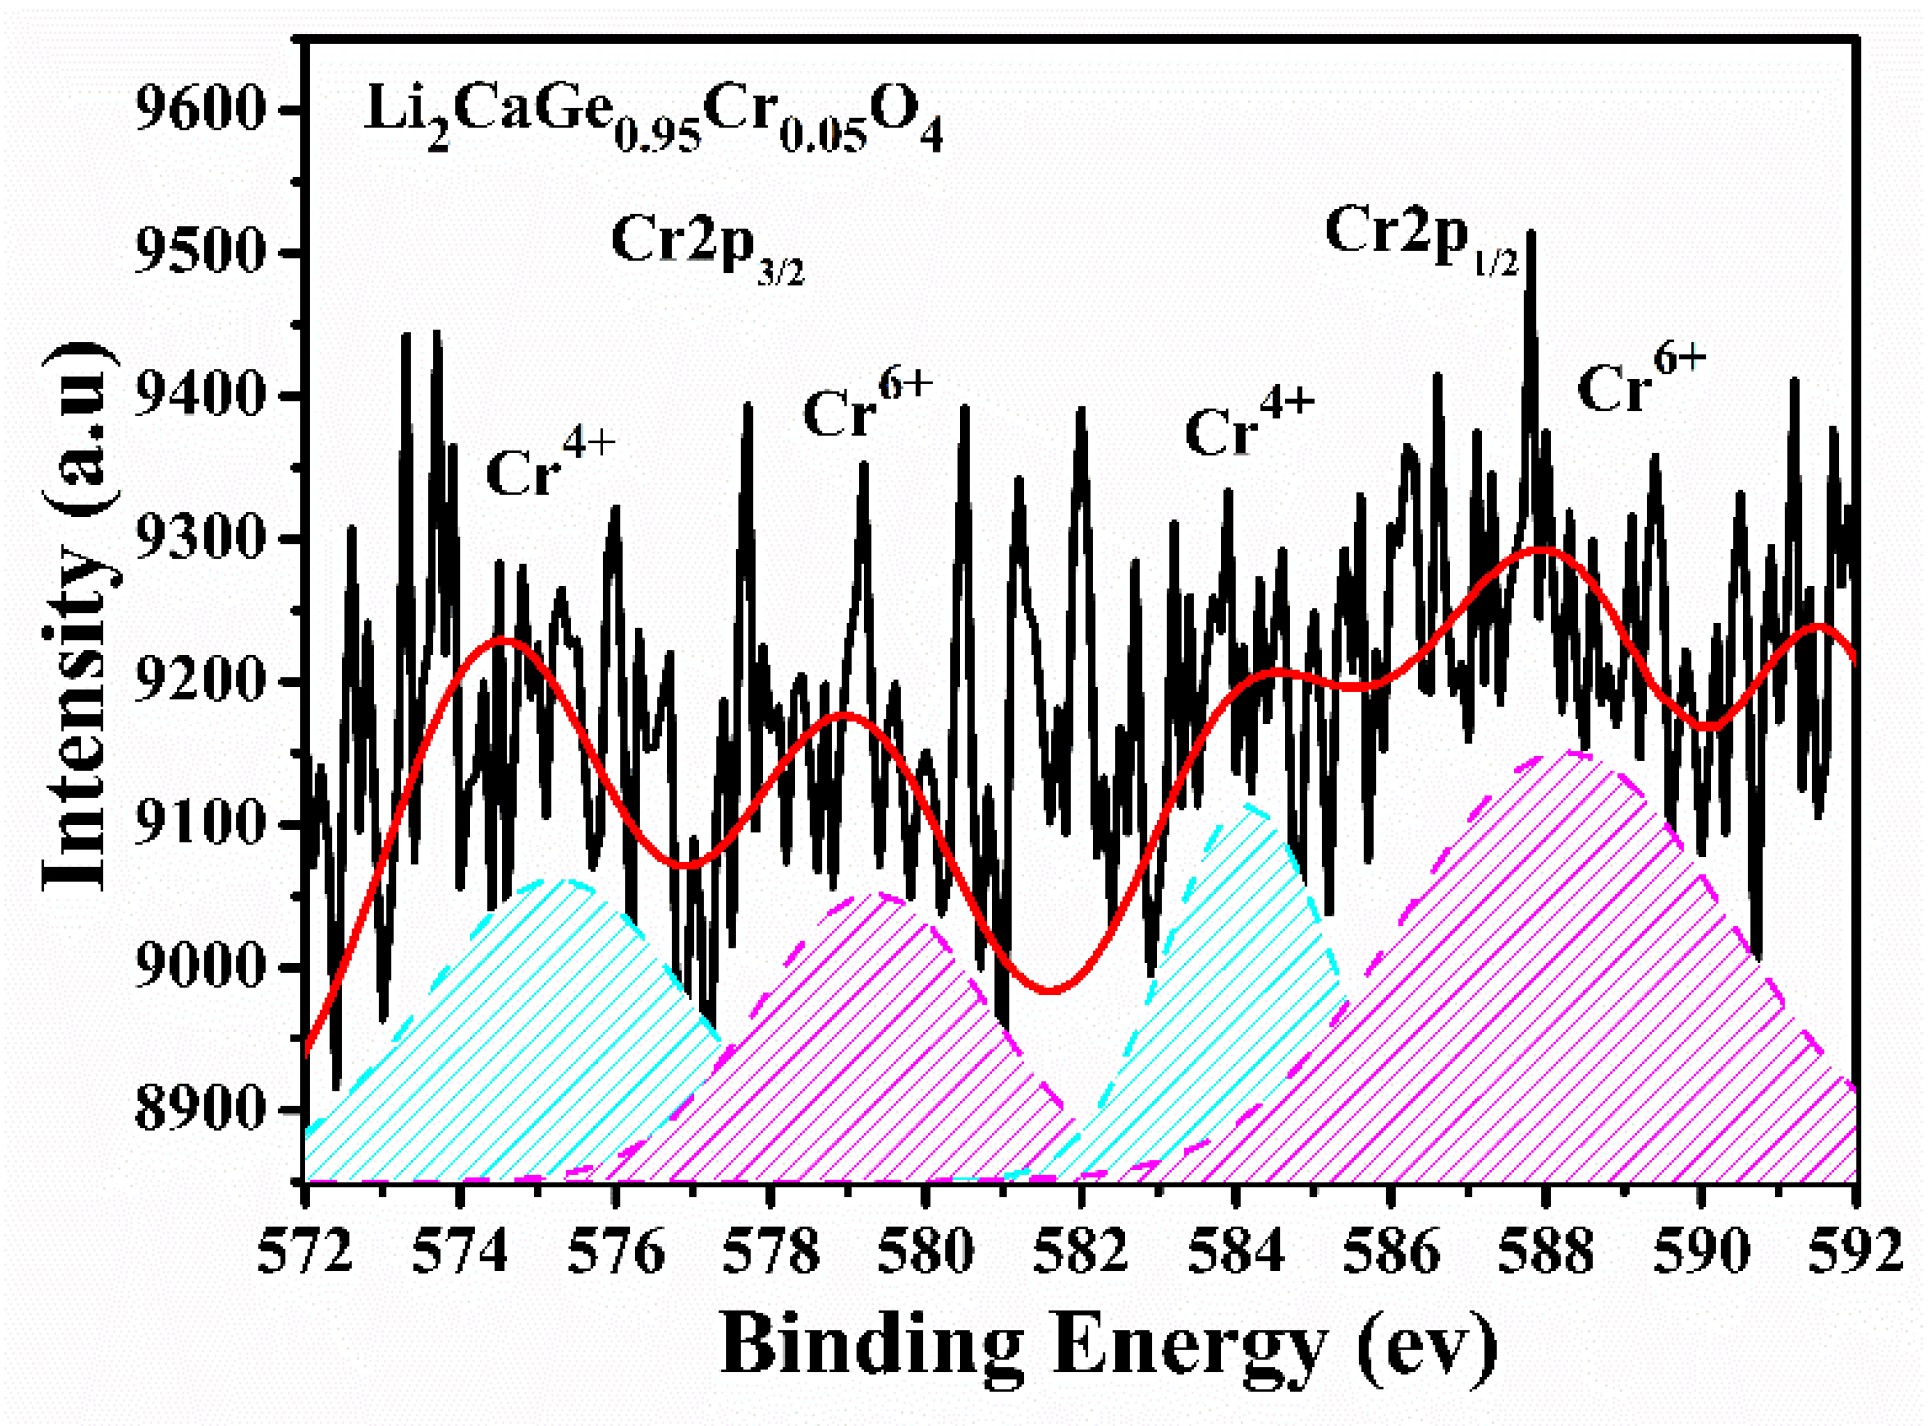
Figure 13 shows the narrow-scan XPS spectra of Cr2p3/2 and Cr2p1/2 for the Li2CaGe0.95Cr0.05O4 sample around the Cr2p core region. The narrow-scan spectra of XPS were fitted using Gaussian equations with two peaks centered at 575.6 and 584.4 eV due to Cr2p3/2 and Cr2p1/2, respectively, corresponding to the Cr4+ ions. In the Gaussian fitting curves, we did not find peaks of the Cr3+ ions, of which the two peaks centered at 577.0 and 586.7 eV were ascribed to Cr2p3/2 and Cr2p1/2 of the Cr3+ ions, respectively [44,45]. Therefore, the Li2CaGeO4 sample contained only Cr4+ ions without the presence of Cr3+ ions, which is consistent with the results of the fluorescence spectroscopy analysis. However, in the Gaussian fitting curve, we found two peaks centered at 579.5 and 588.9 eV from Cr2p3/2 and Cr2p1/2, respectively, corresponding to the Cr6+ ions [45]. This phenomenon occurred because Cr3+ ions can be oxidized not only into Cr4+ ions but also into Cr6+ ions at high temperatures, and Cr6+ ions exist in the form of CrO3 and are stable at room temperature.
In the synthesis of the Cr4+–Li2CaGeO4 polycrystalline material using the solid-phase method, the Cr4+ ions were received by oxidization of Cr3+ from the raw material of Cr2O3 in the oxygen atmosphere. This involved the conversion mechanism from Cr3+ to Cr4+. The XPS survey spectra and the fluorescence spectroscopy results indicate that the Cr4+–Li2CaGeO4 sample contains Cr4+ ions. At the same time, the results of the XPS analysis prove that the Cr4+–Li2CaGeO4 sample also contains Cr6+ ions. When synthesizing samples in an air atmosphere at high temperatures, Cr2O3 reacts with the oxygen in the air, converting Cr3+ to Cr4+ ions, and Cr4+ ions continue to react with oxygen at high temperatures to form Cr6+ ions [46].
Figure 14 shows the XPS narrow-scan spectra of the other elements in the Li2CaGe0.95Cr0.05O4 crystals, where Figure 14a is the narrow-scan spectrum of the Li1s peak, Figure 14b is the narrow-scan spectrum of the Ca2p peak, and Figure 14c is the narrow-scan spectrum of the Ge3d peak. Meanwhile, the narrow-scan spectrum of Figure 14d is that of the O1s peak. As can be seen from Figure 12, there is only one broad peak at 55.3 eV in the narrow-scan spectrum of the Li1s peak, corresponding to the (+1) valence of Li ions, which is mainly formed by the Li–O bonds in the crystals. As can be seen from Figure 14b, in the narrow-scan spectrum of the Ca2p peak, there are two main peaks, namely, 347.2 and 350.3 eV, which belong to the Ca ions Ca2p3/2 and Ca2p1/2, respectively, corresponding to the (+2) valence of Ca ions mainly formed by the Ca–O bonds. It can be seen from Figure 14c that in the narrow-scan spectrum of the Ge3d peak, only the peak at 33.4 eV exists in the crystals, which belongs to the GeO4 structure; meanwhile, no peak of GeO2 can be found in the crystals, and so it can be inferred that the Ge element only exists in the form of GeO4 in the crystals. Figure 14d shows the main three fitted peaks of the O1s peak, located at 531.7, 532.7, and 533.5 eV, which belong to the Li–O, Ca–O, and Ge–O bonds, respectively [47,48,49,50].

4. Conclusions

In conclusion, polycrystalline synthesis, crystal growth, and the structure and spectral properties of the Cr4+–Li2CaGeO4 crystals were described in this paper. The Cr4+–Li2CaGeO4 crystal was grown by the flux growth method from the flux of LiCl. The Li2CaGeO4 crystal structure was characterized, indicating the site occupancy preferences of the Cr4+ in Ge4+ sites. The Cr4+–Li2CaGeO4 crystals showed strongly NIR regional spectra typical for Cr4+ located in tetrahedral positions. The emission spectra presented in the range of 1000–1500 nm were excited by 980 nm, with the maximum peaks at 1200 nm at room temperature, caused by the transition of 3T23A2 in the Cr4+ ions. The optimal Cr4+ ion concentration was shown to be 5 mol% in Cr4+–Li2CaGeO4, beyond which the d–d interaction-based energy transfer between adjacent Cr4+ ions caused concentration quenching. The fluorescence spectroscopy and XPS analysis indicated that only Cr4+ ion substitution occurred in the Cr-doped Li2CaGeO4, and no Cr3+ ions were found in the samples. Therefore, the Cr4+–Li2CaGeO4 crystal has a great potential and future in optical applications.

Author Contributions

Writing—original draft, D.W. and X.Z.; methodology, X.W.; editing, Z.L.; data curation, Q.Y., W.J.; H.L., F.Z., C.L. and Z.S. All authors have read and agreed to the published version of the manuscript.

Funding

This work was supported by government-funded projects (61409220309, 6141B012822, and 6141B012823), the Jilin Provincial Department of Education (JJKH20200758KJ and JJKH20200761KJ), and the Changchun University of Science and Technology Innovation Fund (XJJLG-2018-12).

Conflicts of Interest

The authors declare no conflict of interest. The funders had no role in the design of the study; in the collection, analyses, or interpretation of data; in the writing of the manuscript, or in the decision to publish the results

References

  1. Angert, N.B.; Borodin, N.I.; Garmash, V.M.; Zhitnyuk, V.A.; Okhrimchuk, A.G.; Siyuchenko, O.G.; Shestakov, A.V. Lasing due to impurity color centers in yttrium aluminum garnet crystals at wavelengths in the range 1.35–1.45 μm. Sov. J. Quantum Electron. 1988, 18, 73–74. [Google Scholar] [CrossRef]
  2. Petričević, V.; Gayen, S.K.; Alfano, R.; Yamagishi, K.; Anzai, H.; Yamaguchi, Y. Laser action in chromium-doped forsterite. Appl. Phys. Lett. 1988, 52, 1040–1042. [Google Scholar] [CrossRef]
  3. Verdun, H.R.; Thomas, L.M.; Andrauskas, D.M.; Mccollum, T.; Pinto, A. Chromium-doped forsterite laser pumped with 1.06 μm radiation. Appl. Phys. Lett. 1988, 53, 2593–2595. [Google Scholar] [CrossRef]
  4. Spälter, S.; Böhm, M.; Burk, M.; Mikulla, B.; Fluck, R.; Jung, I.; Zhang, G.; Keller, U.; Sizmann, A.; Leuchs, G. Self-starting soliton-modelocked femtosecond Cr4+:YAG laser using an antiresonant Fabry-Pérot saturable absorber. Appl. Phys. A 1997, 65, 335–338. [Google Scholar] [CrossRef]
  5. Sennaroglu, A.; Carrig, T.J.; Pollock, C.R. Femtosecond pulse generation by using an additive-pulse mode-locked chromium-doped forsterite laser operated at 77 K. Opt. Lett. 1992, 17, 1216–1218. [Google Scholar] [CrossRef] [PubMed]
  6. Kück, S. Laser-related spectroscopy of ion-doped crystals for tunable solid-state lasers. Appl. Phys. A 2001, 72, 515–562. [Google Scholar] [CrossRef]
  7. Moncorge, R.; Manaa, H.; Boulon, G. Cr4+ and Mn5+ active centers for new solid state laser materials. Opt. Mater. 1994, 4, 139–151. [Google Scholar] [CrossRef]
  8. Kuo, Y.-K.; Huang, M.-F.; Birnbaum, M. Tunable Cr/sup 4+/:YSO Q-switched Cr:LiCAF laser. IEEE J. Quantum Electron. 1995, 31, 657–663. [Google Scholar] [CrossRef]
  9. Sennaroglu, A. Broadly tunable Cr4+-doped solid-state lasers in the near infrared and visible. Prog. Quantum Electron. 2002, 26, 287–352. [Google Scholar] [CrossRef]
  10. Mukhopadhyay, P.K.; Alsous, M.B.; Ranganathan, K.; Sharma, S.K.; Gupta, P.K.; George, J.; Nathan, T.P.S. Simultaneous Q-switching and mode-locking in an intracavity frequency doubled diode-pumped Nd:YVO4/KTP green laser with Cr4+:YAG. Opt. Commun. 2003, 222, 399–404. [Google Scholar] [CrossRef]
  11. Gilmore, D.A.; Cvijin, P.V.; Atkinson, G.H. Intracavity laser spectroscopy in the 1.38–1.55 gm spectral region using a multimode Cr4+:YAG laser. Opt. Commun. 1993, 103, 370–374. [Google Scholar] [CrossRef]
  12. Chai, Y.; Leburn, C.G.; Lagatsky, A.A.; Brown, C.T.A.; Penty, R.; White, I.; Sibbett, W. 1.36-Tb/s spectral slicing source based on a Cr/sup 4+/-YAG femtosecond laser. J. Light. Technol. 2005, 23, 1319–1324. [Google Scholar] [CrossRef]
  13. Soubbotin, K.; Smirnov, V.; Kovaliov, S.; Scheel, H.; Zharikov, E. Growth and spectroscopic investigation of new promising laser crystal chromium (IV) doped germanoeucryptite Cr4+:LiAlGeO4. Opt. Mater. 2000, 13, 405–410. [Google Scholar] [CrossRef]
  14. Deka, C.; Chai, B.H.T.; Shimony, Y.; Zhang, X.X.; Munin, E. Bass, Laser performance of Cr4+:Y2SiO5. Appl. Phys. Lett. 1992, 61, 2141–2143. [Google Scholar] [CrossRef] [Green Version]
  15. Merkie, L.D.; Allik, T.H.; Chai, H.T. Crystal growth and spectroscopic properties of Cr4+ in Ca2A12SiO7 and Ca2Ga2SiO7. Opt. Mater. 1992, 1, 91–100. [Google Scholar] [CrossRef]
  16. Heyns, A.M.; Harden, P.M. Evidence for the existence of Cr(IV) in chromium-doped malayaite Cr4+:CaSnOSiO4: A resonance Raman Study. J. Phys. Chem. Solids 1999, 60, 277–284. [Google Scholar] [CrossRef]
  17. Kück, S.; Hartung, S. Comparative study of the spectroscopic properties of Cr4+-doped LiAlO2 and LiGaO2. Chem. Phys. 1999, 240, 387–401. [Google Scholar] [CrossRef]
  18. Chen, W.; Spariosu, K.; Stultz, R.; Kuo, Y.K.; Birnbaum, M.; Shestakov, A. Cr4+: GSGG saturable absorber Q-switch for the ruby laser. Opt. Commun. 1993, 104, 71–74. [Google Scholar] [CrossRef]
  19. Petermann, K.; Pohlmann, U.; Huber, G.; Kück, S.; Schönhoff, U. Tunable room-temperature laser action of Cr4+-doped Y3ScxAl5−xO12. Appl. Phys. A 1994, 58, 153–156. [Google Scholar] [CrossRef]
  20. Hazenkamp, M.; Oetliker, U.; Gudel, H.; Kesper, U.; Reinen, D. Absorption and luminescence spectroscopy of Cr4+-doped Ca2GeO4. A potential near infrared laser material. Chem. Phys. Lett. 1995, 233, 466–470. [Google Scholar] [CrossRef]
  21. Moncorge, R.; Manaa, H.; Deghoul, F.; Guyot, Y.; Kalisky, Y.; Pollack, S.; Zharikov, E.; Kokta, M. Saturable and excited state absorption measurements in Cr4+:LuAG single crystals. Opt. Commun. 1996, 132, 279–284. [Google Scholar] [CrossRef]
  22. Pollock, C.; Barber, D.; Mass, J.; Markgraf, S. Cr/sup 4+/ lasers: Present performance and prospects for new host lattices. IEEE J. Sel. Top. Quantum Electron. 1995, 1, 62–66. [Google Scholar] [CrossRef]
  23. Okhrimchuk, A.; Shestakov, A. Performance of YAG: Cr4+ laser crystal. Opt. Mater. 1994, 3, 1–13. [Google Scholar] [CrossRef]
  24. Sharonov, M.Y.; Bykov, A.B.; Owen, S.; Petricevic, V.; Alfano, R.R. Crystal growth and optical properties of Cr4+:Li2TiGeO5. J. Appl. Phys. 2003, 93, 1044–1047. [Google Scholar] [CrossRef]
  25. Gard, J.; West, A.R. Preparation and crystal structure of Li2CaSiO4 and isostructural Li2CaGeO4. J. Solid State Chem. 1973, 7, 422–427. [Google Scholar] [CrossRef]
  26. Marychev, M.; Koseva, I.; Gencheva, G.; Stoyanova, R.; Kukeva, R.; Nikolov, V. Cr doped Ca2GeO4, Ca5Ge3O11 and Li2CaGeO4 single crystals grown by the flux method. J. Cryst. Growth 2017, 461, 46–52. [Google Scholar] [CrossRef]
  27. Shannon, R.D. Revised Effective Ionic Radii and Systematic Studies of Interatomie Distances in Halides and Chaleogenides. J. Acta Cryst. A 1976, 32, 751–767. [Google Scholar] [CrossRef]
  28. Zhang, C.; Jiang, Q.; Wang, X.; Liu, J.; Xiao, Y.; Li, C.; Lin, H.; Zeng, F.; Su, Z.-M. A novel scheme to acquire enhanced up-conversion emissions of Ho3+ and Yb3+ co-doped Sc2O3. Curr. Appl. Phys. 2020, 20, 82–88. [Google Scholar] [CrossRef]
  29. Mayerhöfer, T.; Dunken, H. Single-crystal IR spectroscopic investigation on fresnoite, Sr-fresnoite and Ge-fresnoite. Vib. Spectrosc. 2001, 25, 185–195. [Google Scholar] [CrossRef]
  30. Zhang, L.; Li, H.; Hu, L. Statistical structure analysis of GeO2 modified Yb3+: Phosphate glasses based on Raman and FTIR study. J. Alloys Compd. 2017, 698, 103–113. [Google Scholar] [CrossRef]
  31. Mguedla, R.; Kharrat, A.B.J.; Saadi, M.; Khirouni, K.; Chniba-Boudjada, N.; Boujelben, W.; Khirouni, K. Structural, electrical, dielectric and optical properties of PrCrO3 ortho-chromite. J. Alloys Compd. 2020, 812, 152130. [Google Scholar] [CrossRef]
  32. Zhang, X. Raman Spectrum Analysis on the Solid-Liquid Boundary Layer of BGO Crystal Growth. J. Chin. Phys. Lett. 2007, 24, 1898–1900. [Google Scholar]
  33. Sharonov, M.; Bykov, A.; Myint, T.; Petricevic, V.; Alfano, R. Spectroscopic study of chromium-doped transparent calcium germanate glass-ceramics. Opt. Commun. 2007, 275, 123–128. [Google Scholar] [CrossRef]
  34. Weinstock, N.; Schulze, H. Assignment of n2(E) and n4(F2) of tetrahedral species by the calculation of the relative Raman intensities: The vibrational spectra of V O 4 3 , Cr O 4 2 , MoO O 4 2 , W O 4 2 , Mn O 4 , Tc O 4 , Re O 4 , RuO4 and OsO4. J. Chem. Phys. 1973, 59, 5063–5067. [Google Scholar] [CrossRef]
  35. Michel, G.; Machiroux, R. Raman Spectroscopic Investigations of the CrO42-/Cr2O72- Equilibrium in Aqueous Solution. J. Raman Spectrosc. 1983, 14, 22–27. [Google Scholar] [CrossRef]
  36. Wu, X.; Huang, S.; Hömmerich, U.; Yen, W.; Aitken, B.; Newhouse, M. Spectroscopy of Cr4+ in MgCaBa aluminate glass. The coupling of 3T2 and 1E states. Chem. Phys. Lett. 1995, 233, 28–32. [Google Scholar] [CrossRef]
  37. Li, C.; Xu, J.; Liu, W.; Zheng, D.; Zhang, S.; Zhang, Y.; Lin, H.; Liu, L.; Liu, J.; Zeng, F. Synthesis and characterization of Cr4+-doped Ca2GeO4 tunable crystal. J. Alloys Compd. 2015, 636, 211–215. [Google Scholar] [CrossRef]
  38. Blasse, G. Energy transfer between inequivalent Eu2+ ions. J. Solid State Chem. 1986, 62, 207–211. [Google Scholar] [CrossRef]
  39. Jin, Y.; Hu, Y. Tunable blue–green color emission and energy transfer properties of Li2CaGeO4:Ce3+, Tb3+ phosphors for near-UV white-light LEDs. J. Alloys Compd. 2014, 610, 695–700. [Google Scholar] [CrossRef]
  40. Dexter, D.L.; Schulman, J.H. Theory of Concentration Quenching in Inorganic Phosphors. J. Chem. Phys. 1954, 22, 1063–1070. [Google Scholar] [CrossRef]
  41. Jin, Y.; Hu, Y.; Wu, H.; Duan, H.; Chen, L.; Fu, Y.; Ju, G.; Mu, Z.; He, M. A deep red phosphor Li2MgTiO4:Mn4+ exhibiting abnormal emission: Potential application as color converter for warm w-LEDs. Chem. Eng. J. 2016, 288, 596–607. [Google Scholar] [CrossRef]
  42. Wang, X.; Hou, Y.; Qu, J.; Ding, J.; Lin, H.; Liu, L.; Zhou, Y.; Zeng, F.; Li, C.; Su, Z.-M. Up-conversion photoluminescence properties and energy transfer process of Ho3+, Yb3+ Co-doped BaY2F8 fine fibers. J. Lumin. 2019, 212, 154–159. [Google Scholar] [CrossRef]
  43. Annadurai, G.; Kennedy, S.M.M.; Sivakumar, V. Photoluminescence properties of a novel orange-red emitting Ba2CaZn2Si6O17:Sm3+ phosphor. J. Rare Earths 2016, 34, 576–582. [Google Scholar] [CrossRef]
  44. Aquino, J.C.R.; Aragón, F.F.; Coaquira, J.; Gratens, X.; Chitta, V.A.; Gonzales, I.; Macedo, W.A.A.; Morais, P.C. Evidence of Cr3+ and Cr4+ Coexistence in Chromium-Doped SnO2 Nanoparticles: A Structural and Magnetic Study. J. Phys. Chem. C 2017, 121, 21670–21677. [Google Scholar] [CrossRef]
  45. Ikemoto, I.; Ishii, K.; Kinoshita, S.; Kuroda, H.; Franco, M.A.; Thomas, J. X-ray photoelectron spectroscopic studies of CrO2 and some related chromium compounds. J. Solid State Chem. 1976, 17, 425–430. [Google Scholar] [CrossRef]
  46. Fukaya, S.; Adachi, K.; Obara, M.; Kumagai, H. The growth of Cr4+: YAG and Cr4+:GGG thin films by pulsed laser deposition. Opt. Commun. 2001, 187, 373–377. [Google Scholar] [CrossRef]
  47. Li, J.-T.; Maurice, V.; Światowska, J.; Seyeux, A.; Zanna, S.; Klein, L.; Sun, S.-G.; Marcus, P. XPS, time-of-flight-SIMS and polarization modulation IRRAS study of Cr2O3 thin film materials as anode for lithium ion battery. Electrochim. Acta 2009, 54, 3700–3707. [Google Scholar] [CrossRef]
  48. Asuvathraman, R.; Gnanasekar, K.; Clinsha, P.; Ravindran, T.; Kutty, K.G. Investigations on the charge compensation on Ca and U substitution in CePO4 by using XPS, XRD and Raman spectroscopy. Ceram. Int. 2015, 41, 3731–3739. [Google Scholar] [CrossRef]
  49. Ramesh, B.; Dillip, G.; Reddy, G.R.; Raju, B.D.P.; Joo, S.; Sushma, N.J.; Rambabu, B. Luminescence properties of CaZn2(PO4)2:Sm3+ phosphor for lighting application. Optik 2018, 156, 906–913. [Google Scholar] [CrossRef]
  50. Lisboa-Filho, P.; Mastelaro, V.R.; Schreiner, W.; Messaddeq, S.; Li, M.S.; Messaddeq, Y.; Hammer, P.; Ribeiro, S.J.L.; Parent, P.; Laffon, C. Photo-induced effects in Ge25Ga10S65 glasses studied by XPS and XAS. Solid State Ion. 2005, 176, 1403–1409. [Google Scholar] [CrossRef]
Figure 1. Li2CaGaO4.
Crystals 10 01019 g001
Figure 2. Differential scanning calorimetry (DSC)/thermogravimetry (TG) curve of Li2CaGaO4.
Crystals 10 01019 g002
Figure 3. (a) X-ray powder diffraction (XRD) patterns of Li2CaGe1−xCrxO4 (x = 0.01, 0.03, 0.05, 0.07, and 0.1) and the standard data of the Li2CaGeO4 phase as a reference; (b) the magnified XRD curves in the range of 36°–38°.
Crystals 10 01019 g003
Figure 4. Fourier infrared spectra of Li2CaGe1−xCrxO4 (x = 0.01, 0.03, 0.05, 0.07, and 0.1): (a) FT-IR spectrum in the range of 4000–400 cm−1; (b) FT-IR spectrum in the range of 1000–400 cm−1.
Crystals 10 01019 g004
Figure 5. Raman spectra of Li2CaGe1−xCrxO4 (x = 0.01, 0.03, 0.05, 0.07, and 0.1).
Crystals 10 01019 g005
Figure 6. (a) Excitation spectra of Li2CaGe0.97Cr0.03O4em = 1200 nm); (b) emission spectra of Li2CaGe0.97Cr0.03O4ex = 980 nm); (c) Gaussian-fitted spectrum of the emission spectra of Li2CaGe0.97Cr0.03O4ex = 980 nm).
Crystals 10 01019 g006
Figure 7. Li2CaGe1–xCrxO4 crystal absorption spectra: (a) Absorption spectra of crystals with different doping concentrations (200–900 nm); (b) the Gaussian of Li2CaGe0.95Cr0.05O4 (550–850 nm).
Crystals 10 01019 g007
Figure 8. Energy level of the Cr4+ ions.
Crystals 10 01019 g008
Figure 9. The persistent luminescence spectra of the Li2CaGe1–xCrxO4 samples (x = 0.01, 0.03, 0.05, 0.07, and 0.1). Inset: Plot of the emission intensity vs. Cr-doping content.
Crystals 10 01019 g009
Figure 10. The dependence of lg(I/x) on lg(x) according to Equation (3).
Crystals 10 01019 g010
Figure 11. (a) Fluorescence lifetime curve of Li2CaGe1−xCrxO4 (x = 0.01, 0.03, 0.05, 0.07, and 0.1); (b) dependence of the decay time of Li2CaGe1−xCrxO4 on the Cr4+ doping concentration.
Crystals 10 01019 g011
Figure 12. X-ray photoelectron spectroscopy (XPS) survey spectra of the Li2CaGe0.95Cr0.05O4 crystal.
Crystals 10 01019 g012
Figure 13. Narrow scanning spectra of XPS for Cr2p.
Crystals 10 01019 g013
Figure 14. Narrow scanning spectra of XPS for the other elements: (a) Li1s, (b) Ca2p, (c) Ge3d, and (d) O1s.
Crystals 10 01019 g014
Table 1. The structural parameters of Li2CaGeO4 derived from X-ray diffraction data.
AtomWyckoff Positionx/ay/bz/cChemical Valence
Li4d01/21/41
Ca2b001/22
Ge2a0004
O8i0.1990.1990.149−2
Table 2. The peak banding energy of the elements of the Li2Ca0.95Cr0.05GeO4 crystals.
ElementPeak BE
C1s284
Cr2p579
Ca2p346
Ge3d31
Li1s54
O1s531
Publisher’s Note: MDPI stays neutral with regard to jurisdictional claims in published maps and institutional affiliations.