Article

Crack Propagation Behavior of a Ni-Based Single-Crystal Superalloy during In Situ SEM Tensile Test at 1000 °C

1
Institute of Microstructure and Property of Advanced Materials, Beijing University of Technology, Beijing 100124, China
2
Instrumental Analysis Center, Taiyuan University of Technology, Taiyuan 030024, China
3
School of Materials Science and Engineering, Zhejiang University, Hangzhou 310058, China
*
Author to whom correspondence should be addressed.
Crystals 2020, 10(11), 1047; https://doi.org/10.3390/cryst10111047
Submission received: 2 October 2020 / Revised: 5 November 2020 / Accepted: 7 November 2020 / Published: 17 November 2020
(This article belongs to the Special Issue Microstructural and Mechanical Characterization of Alloys Volume II)

Abstract

:
An in situ scanning electron microscope (SEM) tensile test for Ni-based single-crystal superalloy was carried out at 1000 °C. The stress displacement was obtained, and the yield strength and tensile strength of the superalloy were 699 MPa and 826 MPa, respectively. The crack propagation process, consisting of Model I crack and crystallographic shearing crack, was determined. More interestingly, the crack propagation path and rate affected by eutectics was directly observed and counted. Results show that the coalescence of the primary crack and second microcrack at the interface of a γ/γ′ matrix and eutectics would make the crack propagation rate increase from 0.3 μm/s to 0.4 μm/s. On the other hand, crack deflection decreased the rate to 0.05 μm/s. Moreover, movement of dislocations in front of the crack was also analyzed to explain the different crack propagation behavior in the superalloy.

1. Introduction

Nickel-based single-crystal superalloys have been widely studied for years and have been entering service in gas turbines as turbine blades and other hot-end components [1]. To improve an engine’s efficiency, the superalloys, consisting of γ′ precipitates with an L12 structure embedded in a matrix with a face-centered cubic structure [2], have been used at higher temperature. Therefore, studies [3,4,5,6,7,8] about mechanical properties of superalloys at elevated temperature are essential. In a low temperature region (below 500 °C), the yield stress of a Ni-based single-crystal superalloy is almost unaffected with temperature increase. In an intermediate temperature region, yield strength and tensile strength increase with increasing temperature due to the strength of γ′ precipitates increasing with temperature [4]; this is explained by a thermally activated cross slip of dislocations from {111} planes to {100} planes [9]. Once temperature progresses into a high temperature region (beyond 750 °C), both yield strength and tensile strength show a rapid decrease [10]. Moreover, tensile deformation and fracture occur when the stress exceeds the yield strength of the superalloy. However, the deformation process [11] or crack propagation behavior [5] of a Ni-based single-crystal superalloy is hard to observe, especially at temperatures close to the service temperature (above 1000 °C).
Moreover, superalloys are very sensitive to internal microstructural heterogeneities, including pores and eutectic precipitates, which usually cause stress concentration and even induce crack initiation [12,13]. To clearly illustrate the role of eutectics on mechanical behavior, room-temperature testing was done for the PWA 1480 superalloy, where a localized slip along {111} planes emanated from eutectics, then strain localization was caused [14]. At high temperature, the interface of the γ/γ′ matrix and eutectics easily became the initial position of secondary cracks, but the propagation of secondary crack was blocked, and the crack tip was also blunted due to eutectics [15]. Similar behavior of retarding crack growth was also explained from aspects including interfacial cracking [16], difference of mechanical properties in two phases [5,17], and dislocation pile-up at interface [18]. Nevertheless, all the above studies were carried out at ex situ or in situ low-temperature conditions; the effect of eutectics on crack propagation was mainly deduced from the final tensile fracture morphology.
In this study, an in situ scanning electron microscope (SEM) tensile test for a Ni-based single-crystal superalloy was carried out at 1000 °C. The stress displacement was obtained, and the yield strength and tensile strength of the superalloy were 699 MPa and 826 MPa, respectively. The crack propagation process, consisting of Model I crack and crystallographic shearing crack, was determined. Moreover, the crack propagation path and rate affected by eutectics was directly observed. Results show that the coalescence of the primary crack and second microcrack at the interface of the γ/γ′ matrix and eutectics would make the crack propagation rate increase from 0.3 μm/s to 0.4 μm/s. On the other hand, crack deflection decreased the rate to 0.05 μm/s. Moreover, movement of dislocations in front of the crack was also analyzed to explain the cracking behavior in the superalloy.

2. Experiment and Materials

2.1. Materials

The in situ tensile specimen was manufactured from a nickel-based single-crystal superalloy bar (170 mm in length; 15 mm in diameter) along the [1] direction and perpendicular to the [10] direction by using wire electric discharge machining techniques. To determine an accurate secondary crystallographic orientation, electron backscattering diffraction (EBSD) analysis was conducted on the surface. The three Euler angles are (214.7°, 11.3°, 53.6°), indicating there was a little deviation with the orientation of {001} crystal plane. However, discussions of the slip systems in a single-crystal superalloy will not be affected by such a tiny deviation. The geometrical shape of the specimen is close to a fat doge-bone tensile specimen with a gauge section of length 1.5 mm, width 2 mm, and thickness 0.75 mm. Details of the dimensions have been reported in a previous study [19]. Moreover, a micro-notch (an inverted arch shape with dimensions of ~220 μm in width or diameter and ~320 μm in depth) was additionally machined in the center of the specimen to easily capture cracks. The chemical composition of the Ni-based single-crystal superalloy is presented in Table 1. The as-cast nickel-based single-crystal superalloy bar received a heat treatment as follows: 1290 °C × 1 h + 1300 °C × 2 h + 1318 °C × 6 h air cooling + 1130 °C × 4 h air cooling + 870 °C × 32 h air cooling; the heat treatment cycle is shown in Figure 1. No additional heat treatment was applied for the tensile specimen. It was mechanically ground and polished up to a mirror using sandpaper; a solution made of 7% perchloric acid and 93% alcohol was used for electrochemical treatment for 10 s with a constant direct current of 0.01 A at a temperature of about 0 °C.
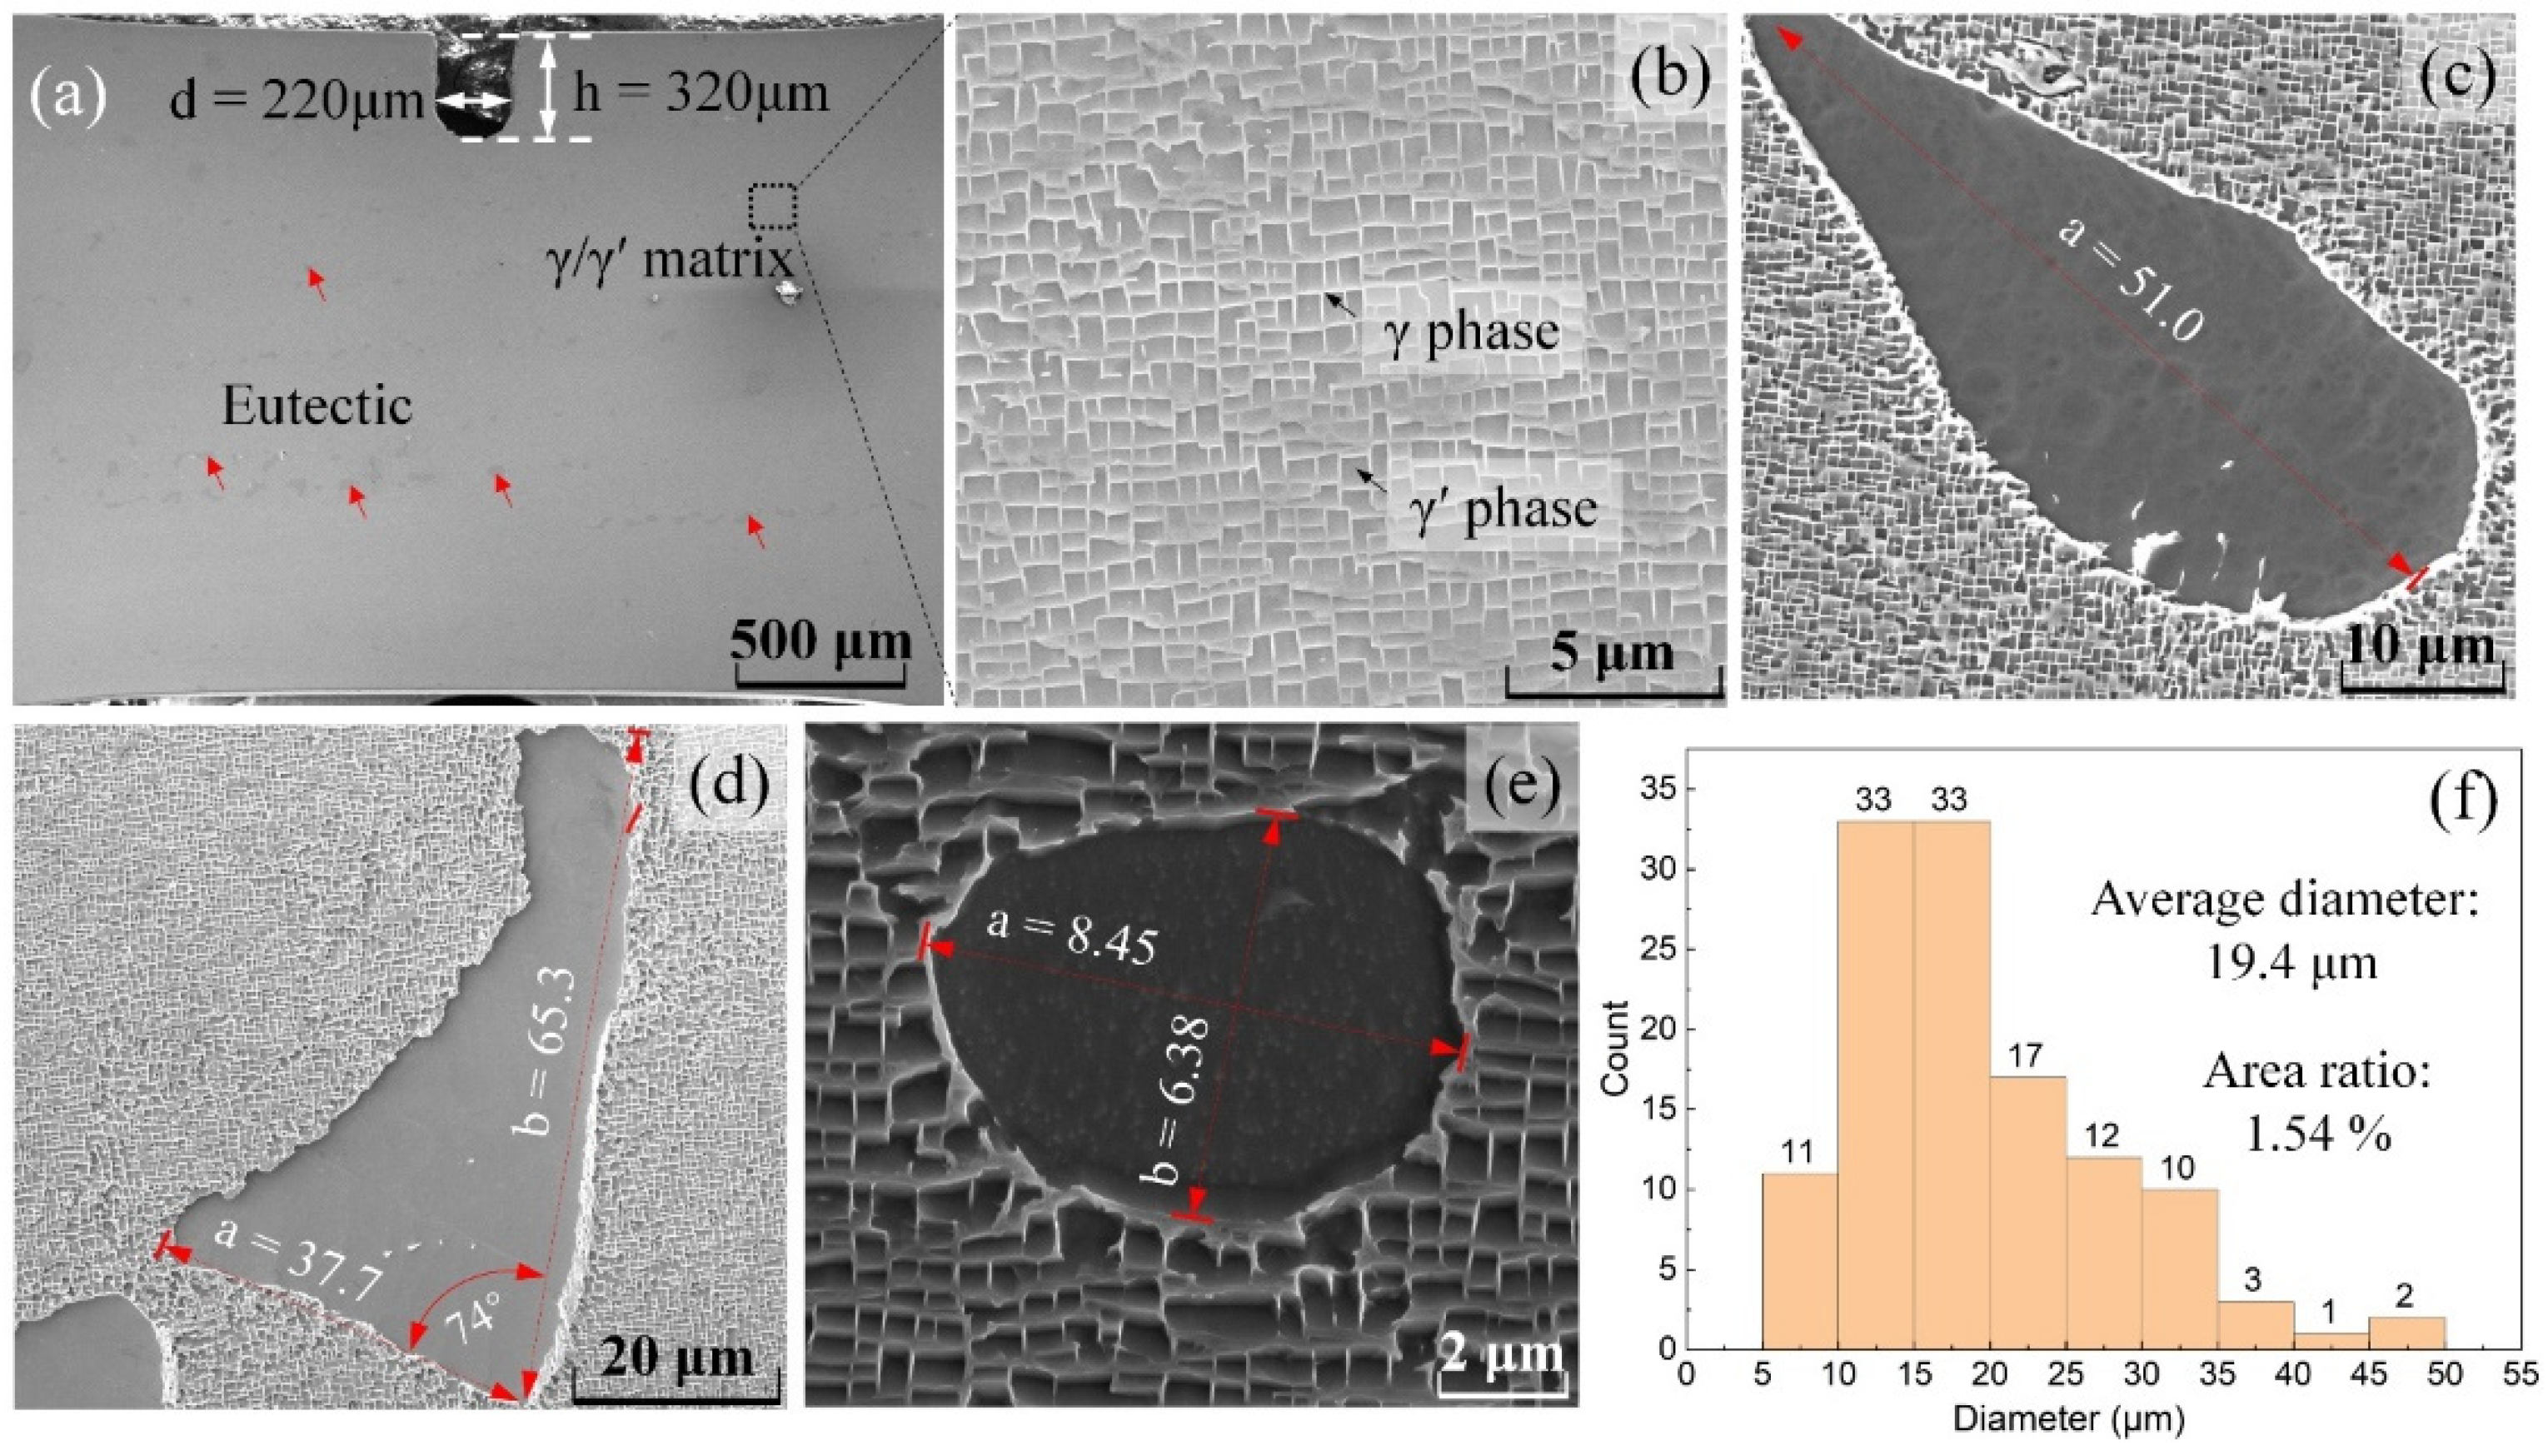
The microstructure of the specimen before in situ tensile test could be observed in Figure 2a–e, including the γ/γ′ matrix consisting of the uniform γ phase and the cubic γ′ phase is shown in Figure 2b, and eutectics with straight chain-like arrangement along the [1] direction are marked as red arrows in Figure 2a. It should be noted that what is called the eutectics in this paper is in fact the residual eutectics structure after heat treatment. The original eutectics structure consists of two phases (γ and γ’ phase); however, the residual eutectics, called eutectics in our paper, was only made up of a single phase. Typical eutectics was also labeled as shown as Figure 2c,e, and could be divided into three categories: Subtriangular shape, elliptic shape, and spherical shape. The number and size of the eutectics was examined in the whole view of Figure 2a along the (100) plane, and statistical results are shown in Figure 2f. The average diameter of the eutectics is 19.4 μm and the total area of the eutectics accounts for 1.45% of all the microstructure in Figure 2a.

2.2. Experimental Procedure

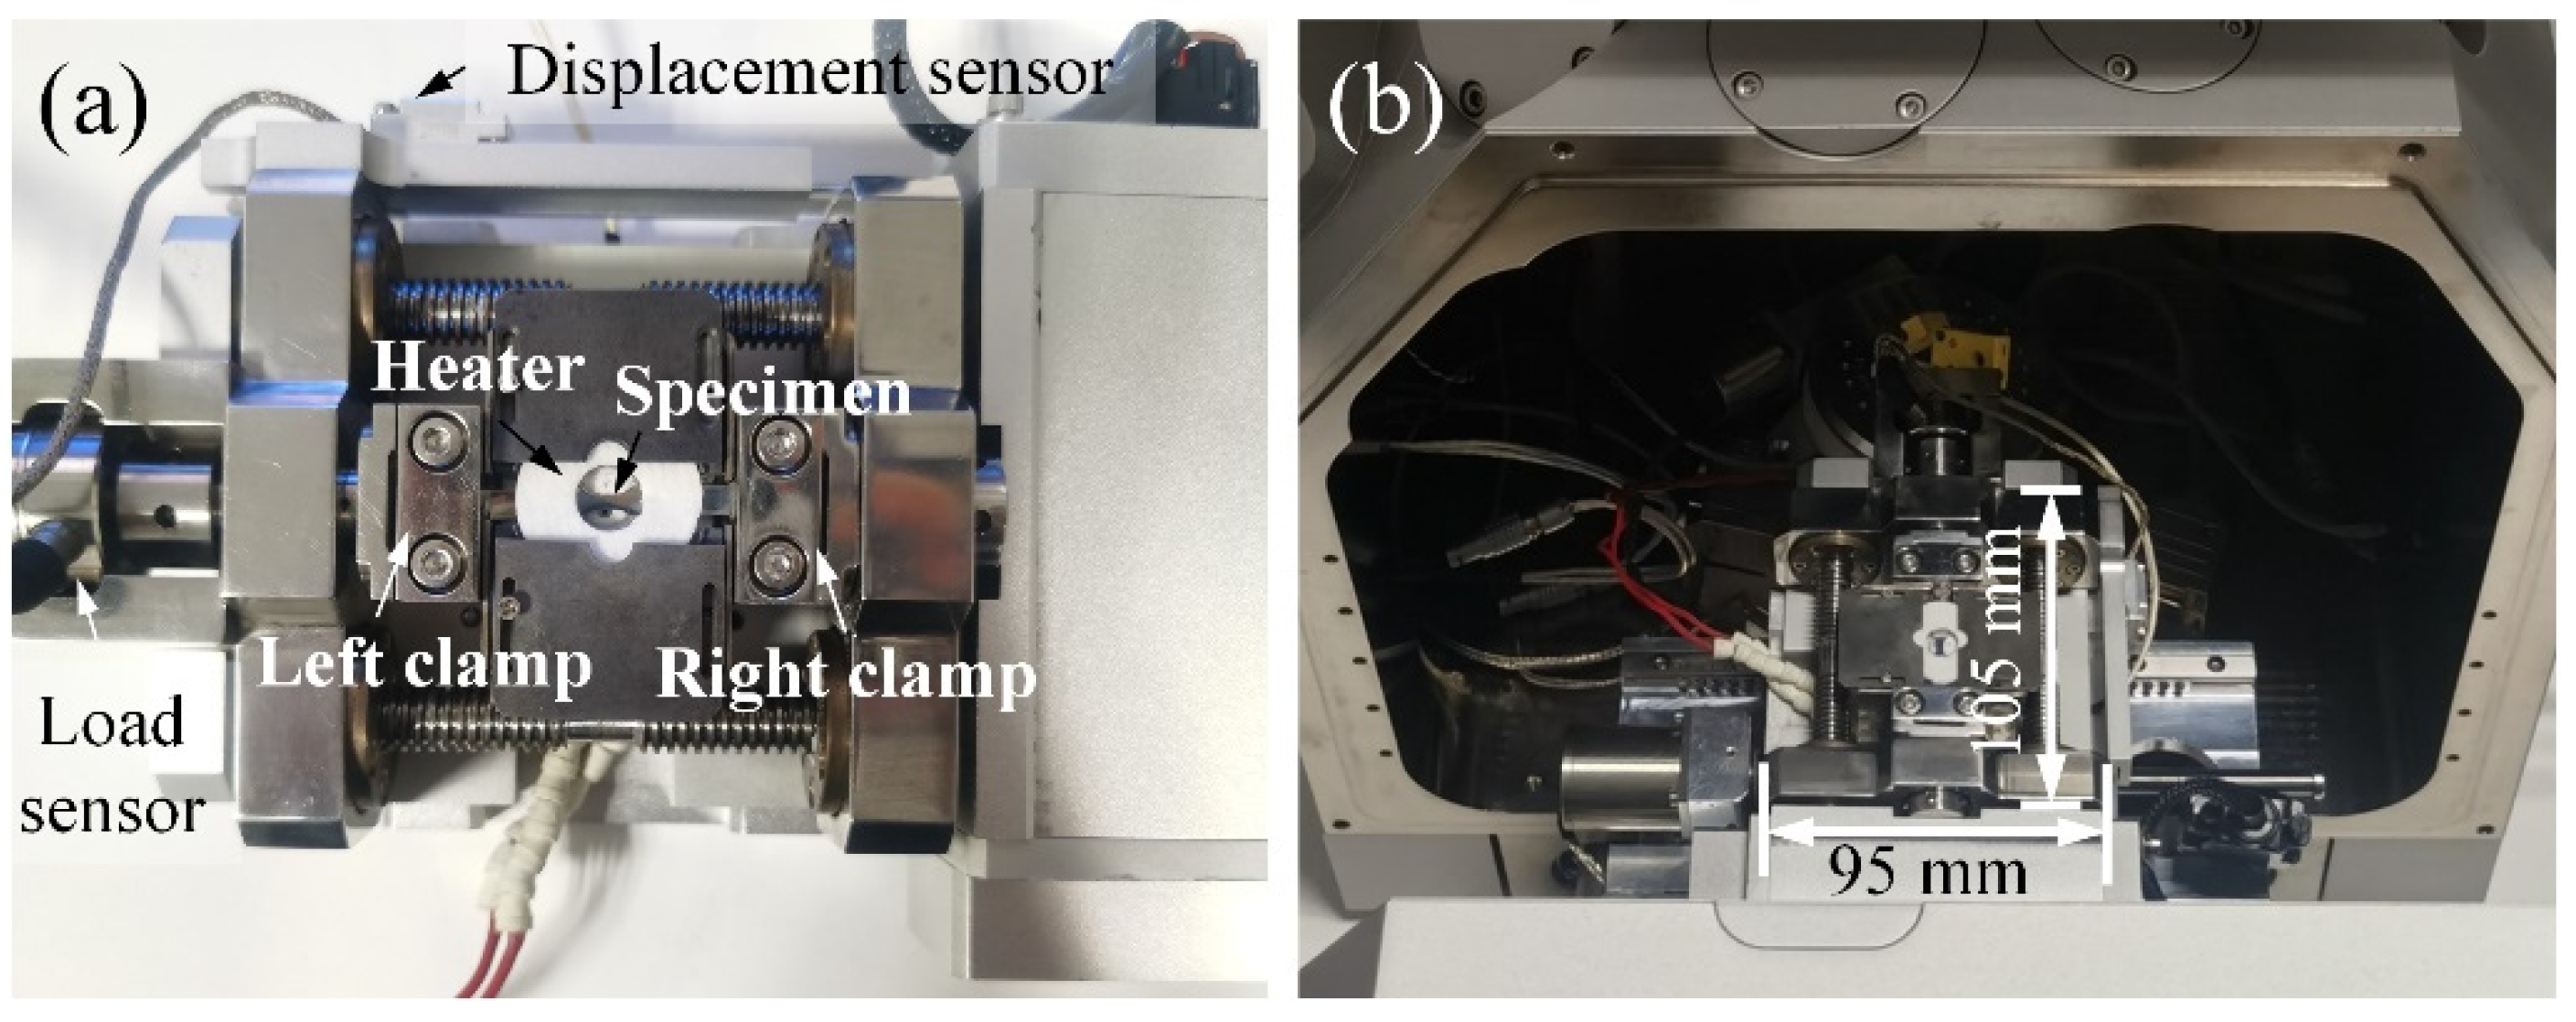
The in situ observation of crack initiation and propagation was realized using hot-tensile test equipment installed in a scanning electron microscope (SEM) (S8000, TESCAN, Czech Republic). The in situ tensile test equipment can be seen in Figure 3a; it consists of three parts: Tensile test stage, heating device under the specimen, and controller. A micro-weighting sensor was used to measure the accurate magnitude value of the load. The displacement change of the tensile stage during the tensile test was detected by a displacement sensor. More detailed information about the tensile test equipment was introduced in our previous study [20]. Figure 3b shows the tensile test equipment assembled into SEM. During the tensile test, a tensile rate of 0.5 μm/s was used. However, it should be noted that, when the crack morphology needs to be observed, the tensile process is stopped and keeps to a displacement holding state. Element distribution around eutectics was characterized in an TEM (Titan G2, FEI, Hillsboro, America) by OXFORD X-Max energy dispersive spectrum (EDS); samples were extracted using an FEI Helios NanoLab FIB from the specimen; (electron backscattered diffraction) EBSD technology (using SEM TESCAN S8000) was also used to further analyze the deformation behavior around the eutectics after fracture.

3. Results

3.1. Loading-Displacement Curve and Fracture Behavior

Figure 4a shows the displacement-load curve during tensile test at 1000 °C. Point A represents the yield strength of the superalloy; the value is 699 MPa. Point B is the tensile strength with a value of 826 MPa. Figure 4b displays the final fracture shape of the superalloy, which consists of Model Ⅰ crack path [21] (point C~F stage in Figure 4b) and crystallographic shearing crack path (point F~fracture stage). When the stress reached tensile strength, a crack was initiated from the right side of the primary crack, shown as B position in Figure 4b. To avoid a rapid fracture, which would make the crack hard to capture, the stretching was stopped. The feature of the initial crack tip is shown in Figure 4c; crack turning is observed at the red arrow positions where the region of the γ phase is. Moreover, the crack preferring propagation in the γ phase (or, more accurately, the γ/γ′ phase interface) was observed in the initial crack growth and in the C~F stage of the primary crack, which can be seen in a supplementary file (video). Figure 4d shows the interfacial debonding between eutectics and the γ/γ′ matrix. That process corresponds to position D in Figure 4b. Moreover, position E in Figure 4b corresponds to another situation where the primary crack is located on the right side of the eutectics but makes no interfacial crack. A further effect of eutectics on the crack path is discussed in Section 3.2. When the crack propagates to position F, microcracks caused by slip bands and debonding between the eutectics and the matrix around the crack tip can be seen in Figure 4e.
Tensile fracture morphology is shown in Figure 5. Macroscopically, it includes three regions: Region Ⅰ shows ductile features; a high-magnification SEM image reveals the fracture mostly occurred in the narrow γ phase, and the cubic γ′ phase was left and exposed as a sharp cubic corner (Figure 5b). Region Ⅱ indicates typical ductile features, where there are many dimples. The fracture surface in region III is much smoother than others, indicating brittleness, or more accurately a crystallographic fracture. Some torn edges are still observed in the crystallographic fracture (Figure 5c), which are caused by the ductile γ phase being pulled out and the necks made into a sharp shape. Smoother features are seen on left-side area of Figure 5c, indicating dislocations cut straight through both the γ phase and the γ′ phase. That behavior can be seen in Figure 4e, where slip bands cut into the γ phase and the γ′ phase.

3.2. Effect of Eutectics on Crack Propagation Path

The effect of two types of eutectics on the crack propagation path was observed during the tensile test at 1000 °C. The difference between them is the relative position of the eutectics and the crack tip. Type Ⅰ (Figure 6a–c) represents the situation where a eutectic is located directly in front of the path of an incoming crack. When the primary crack reached the interface of the eutectic and the γ/γ′ matrix phase, the second microcrack (marked as debonding in Figure 6a) nucleated on the right side of the eutectic, indicating the stress concentration occurred not only at the crack tip but also the interface. Coalescence of two cracks happened subsequently, as shown in Figure 6b. Then, the crack propagated along part of the right interface and extended to the γ/γ′ matrix phase. This means that the stress concentration at the front of the crack tip is dominant instead of that on the interface. Type Ⅱ (Figure 6d–f) is representative of the situation where a eutectic is located on the right side of the path of an incoming crack with a distance of about 10 μm. Different from type Ⅰ, the crack propagates in the γ/γ′ matrix phase perpendicular to the loading direction and seems not to be influenced by the eutectic, indicating the stress on the interface is not sufficient to cause an interfacial crack even concerning plastic deformation.
More notably, slip bands cutting across the eutectics and in the γ/γ′ matrix were observed in both types. For the FCC structure single crystal, possible slip traces of the <110> {111} slip systems on the (110) plane are presented in Figure 6g. For (111) and (−111) slip planes, the angle between the projected slip trace and the [1] direction is 135° on the (100) plane. For (11-1) and (1-11) slip planes, the angle is 45°. Based on the angle, accurate slip planes could be confirmed. However, the slip direction is hardly deduced from the projected slip trace on the (100) plane. In Figure 6c, the red line of the marked angle is along the [1] direction (loading direction) identified by the distribution of the γ phase. An angle of 142.5° between the slip trace and the loading direction, which is close to 135°, indicated dislocation glide on (111) or (−111) plane inside the eutectic. Remarkably, the slip behavior happened before the crack initiation; this indicated that local deformation easily occurred in eutectics due to stress concentration. Further reason for stress concentration is the difference in mechanical properties between the eutectic and the γ/γ′ matrix at 1000 ℃. Therefore, during the propagation of the crack in the type Ⅰ situation, plastic deformation happened on the interface of the eutectic and the γ/γ′ matrix. For type Ⅱ crack propagation, slip bands of 1# and 2# marked in Figure 6d were activated by stress in front of the crack tip. According to the angle between slip band 1# and the [1] loading direction, the angle is 130.7°, close to 135°, showing that those slip bands glide on the (−111) or the (1-11) plane. Besides, the angles 42.3° and 47.2° in Figure 6f approach 45°, indicated dislocation glide on the (11-1) or the (1-11) plane.
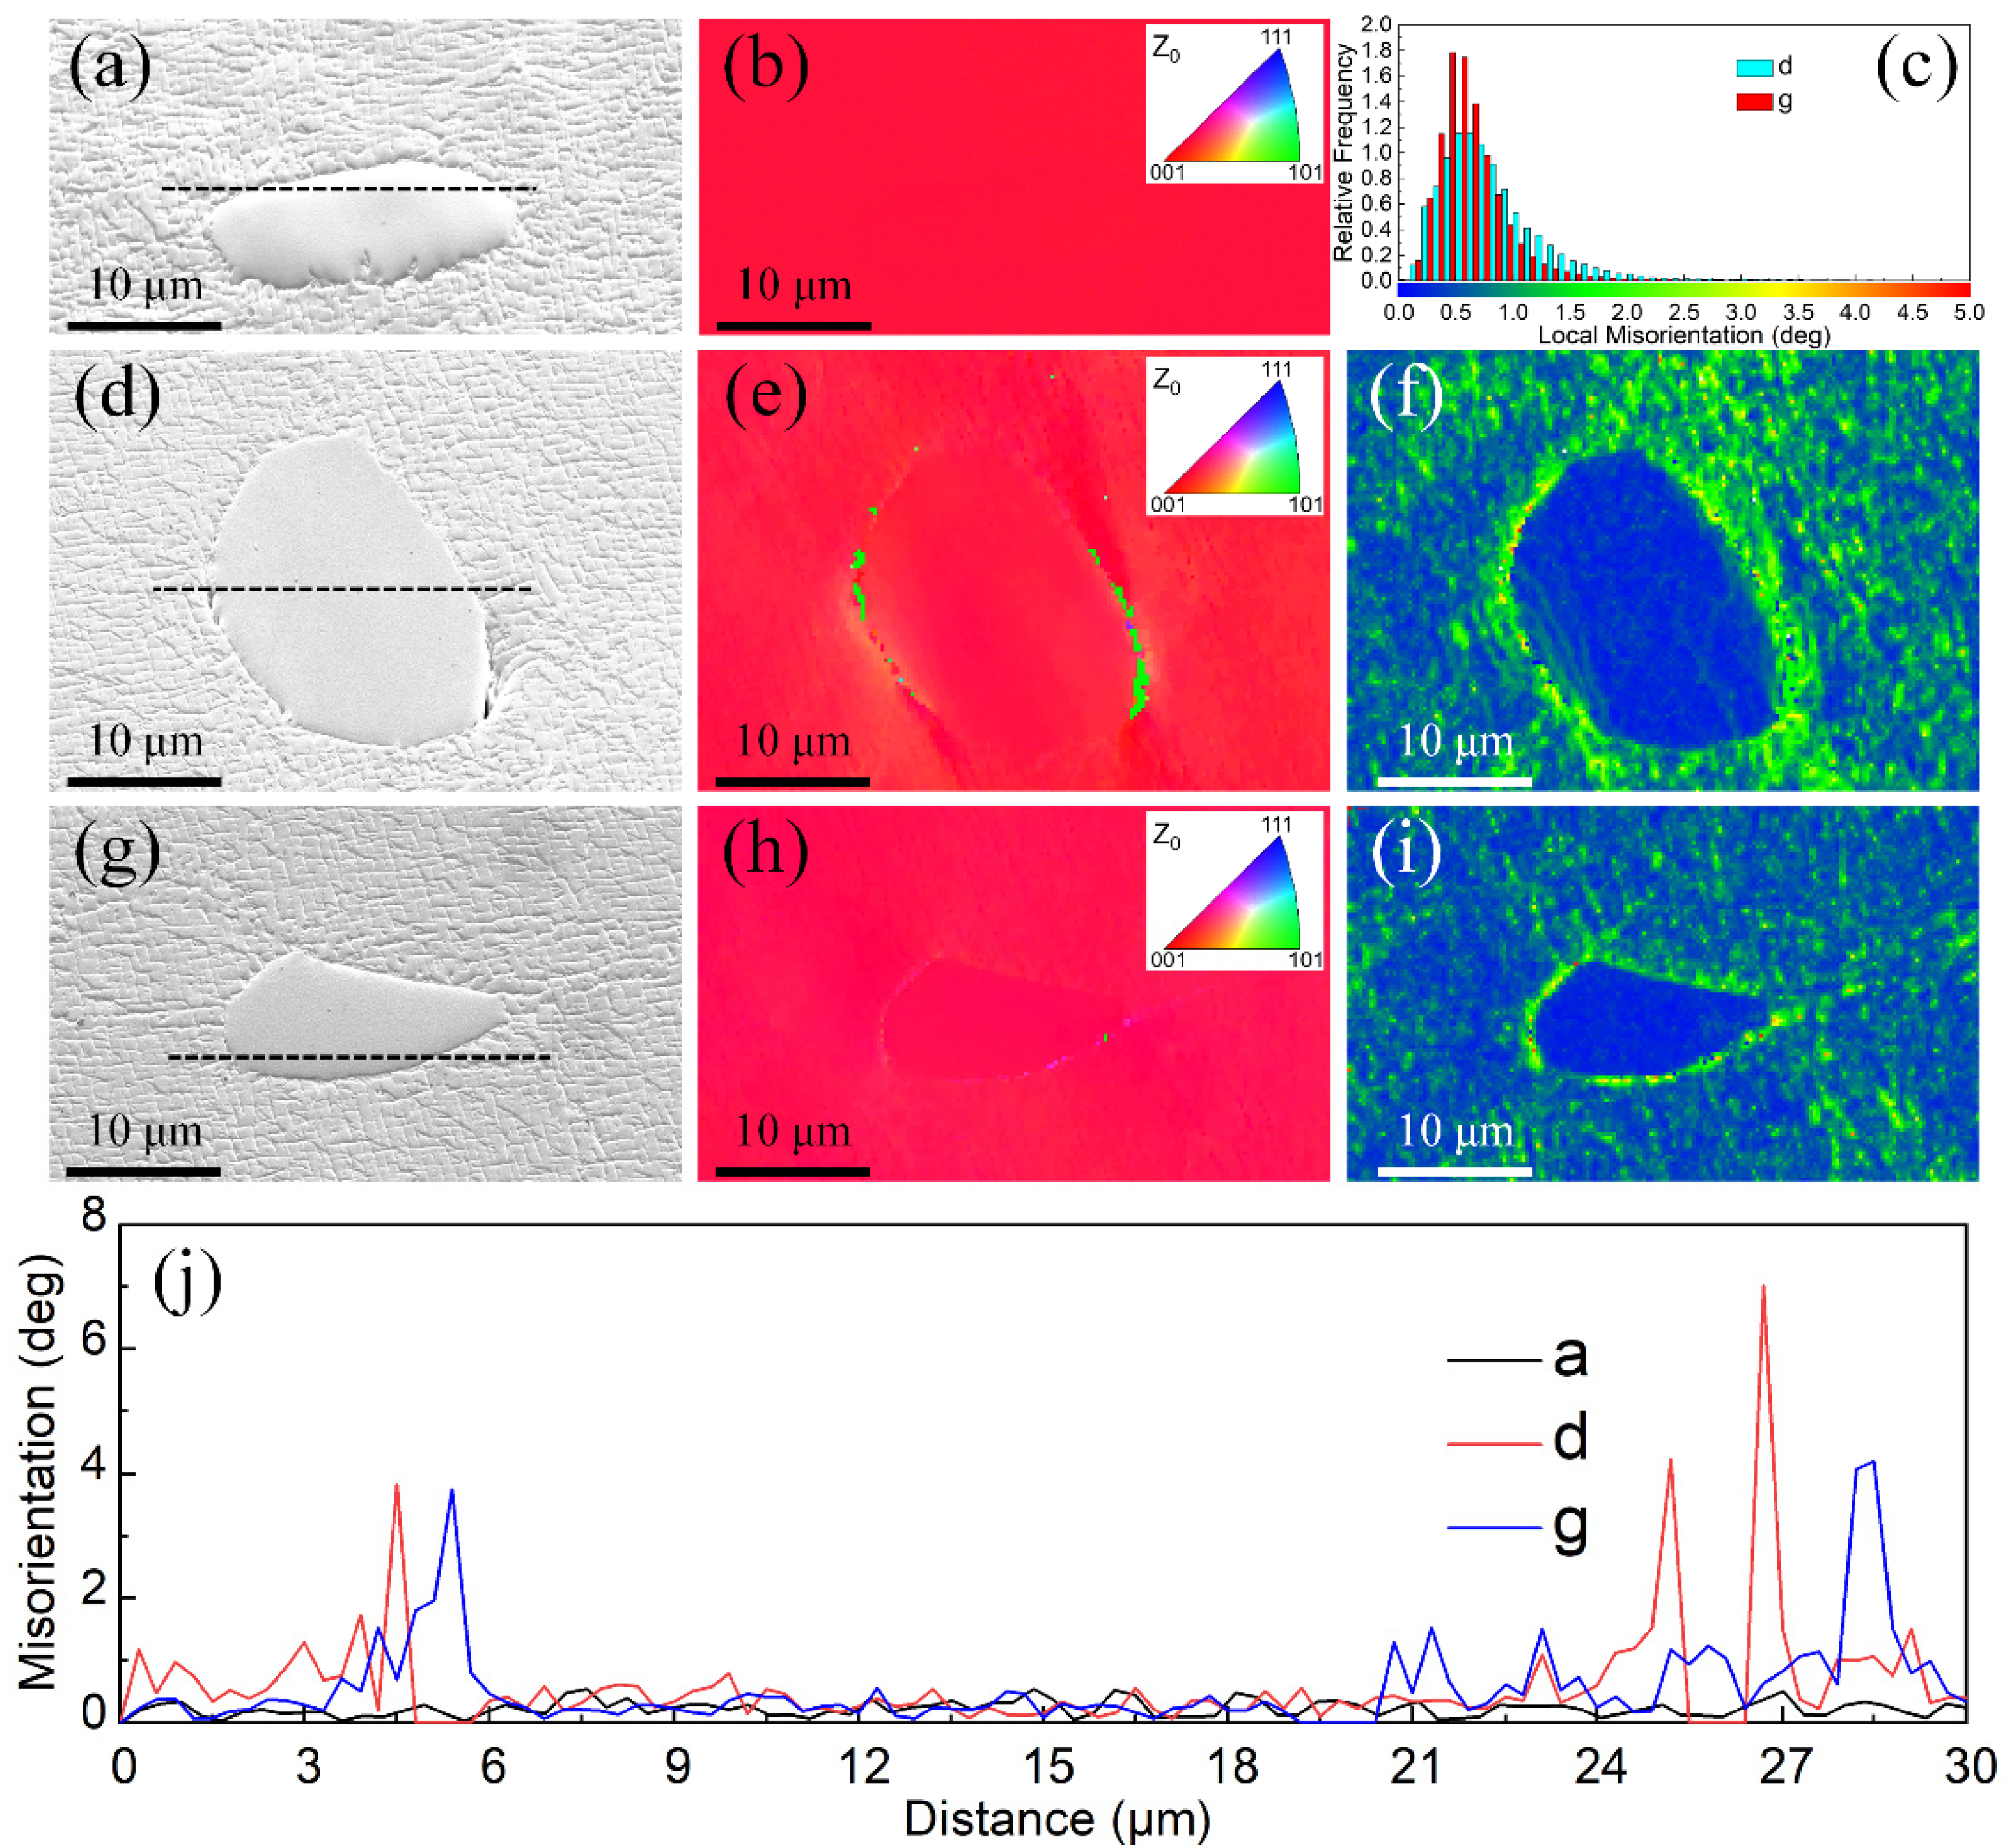
Figure 7a represents the microstructure around eutectics far away from the tensile fracture; Figure 7b is the corresponding (inverse pole figure) IPF map indicating the orientation perpendicular to the surface of the sample or the (100) plane. In Figure 7b, it can be observed that the orientation shows a single {001} orientation. However, in Figure 7e,h, near the fracture, an obvious change of orientation happened in the matrix/eutectic interface. This change is more obvious in Figure 7j, shown as the red and blue line; the value of misorientation in the interface is 4~6.5°, which is higher than that in the position far away from the fracture. Figure 7f,i shows (kernel average misorientation) KAM maps, which are used to characterize changes in local misorientation caused by geometrically necessary dislocations. The presence of high KAM locations in the matrix/eutectics interface is indicative of increased dislocation density and formation of dislocation pileup.

3.3. Effect of Eutectics on Crack Propagation Rate

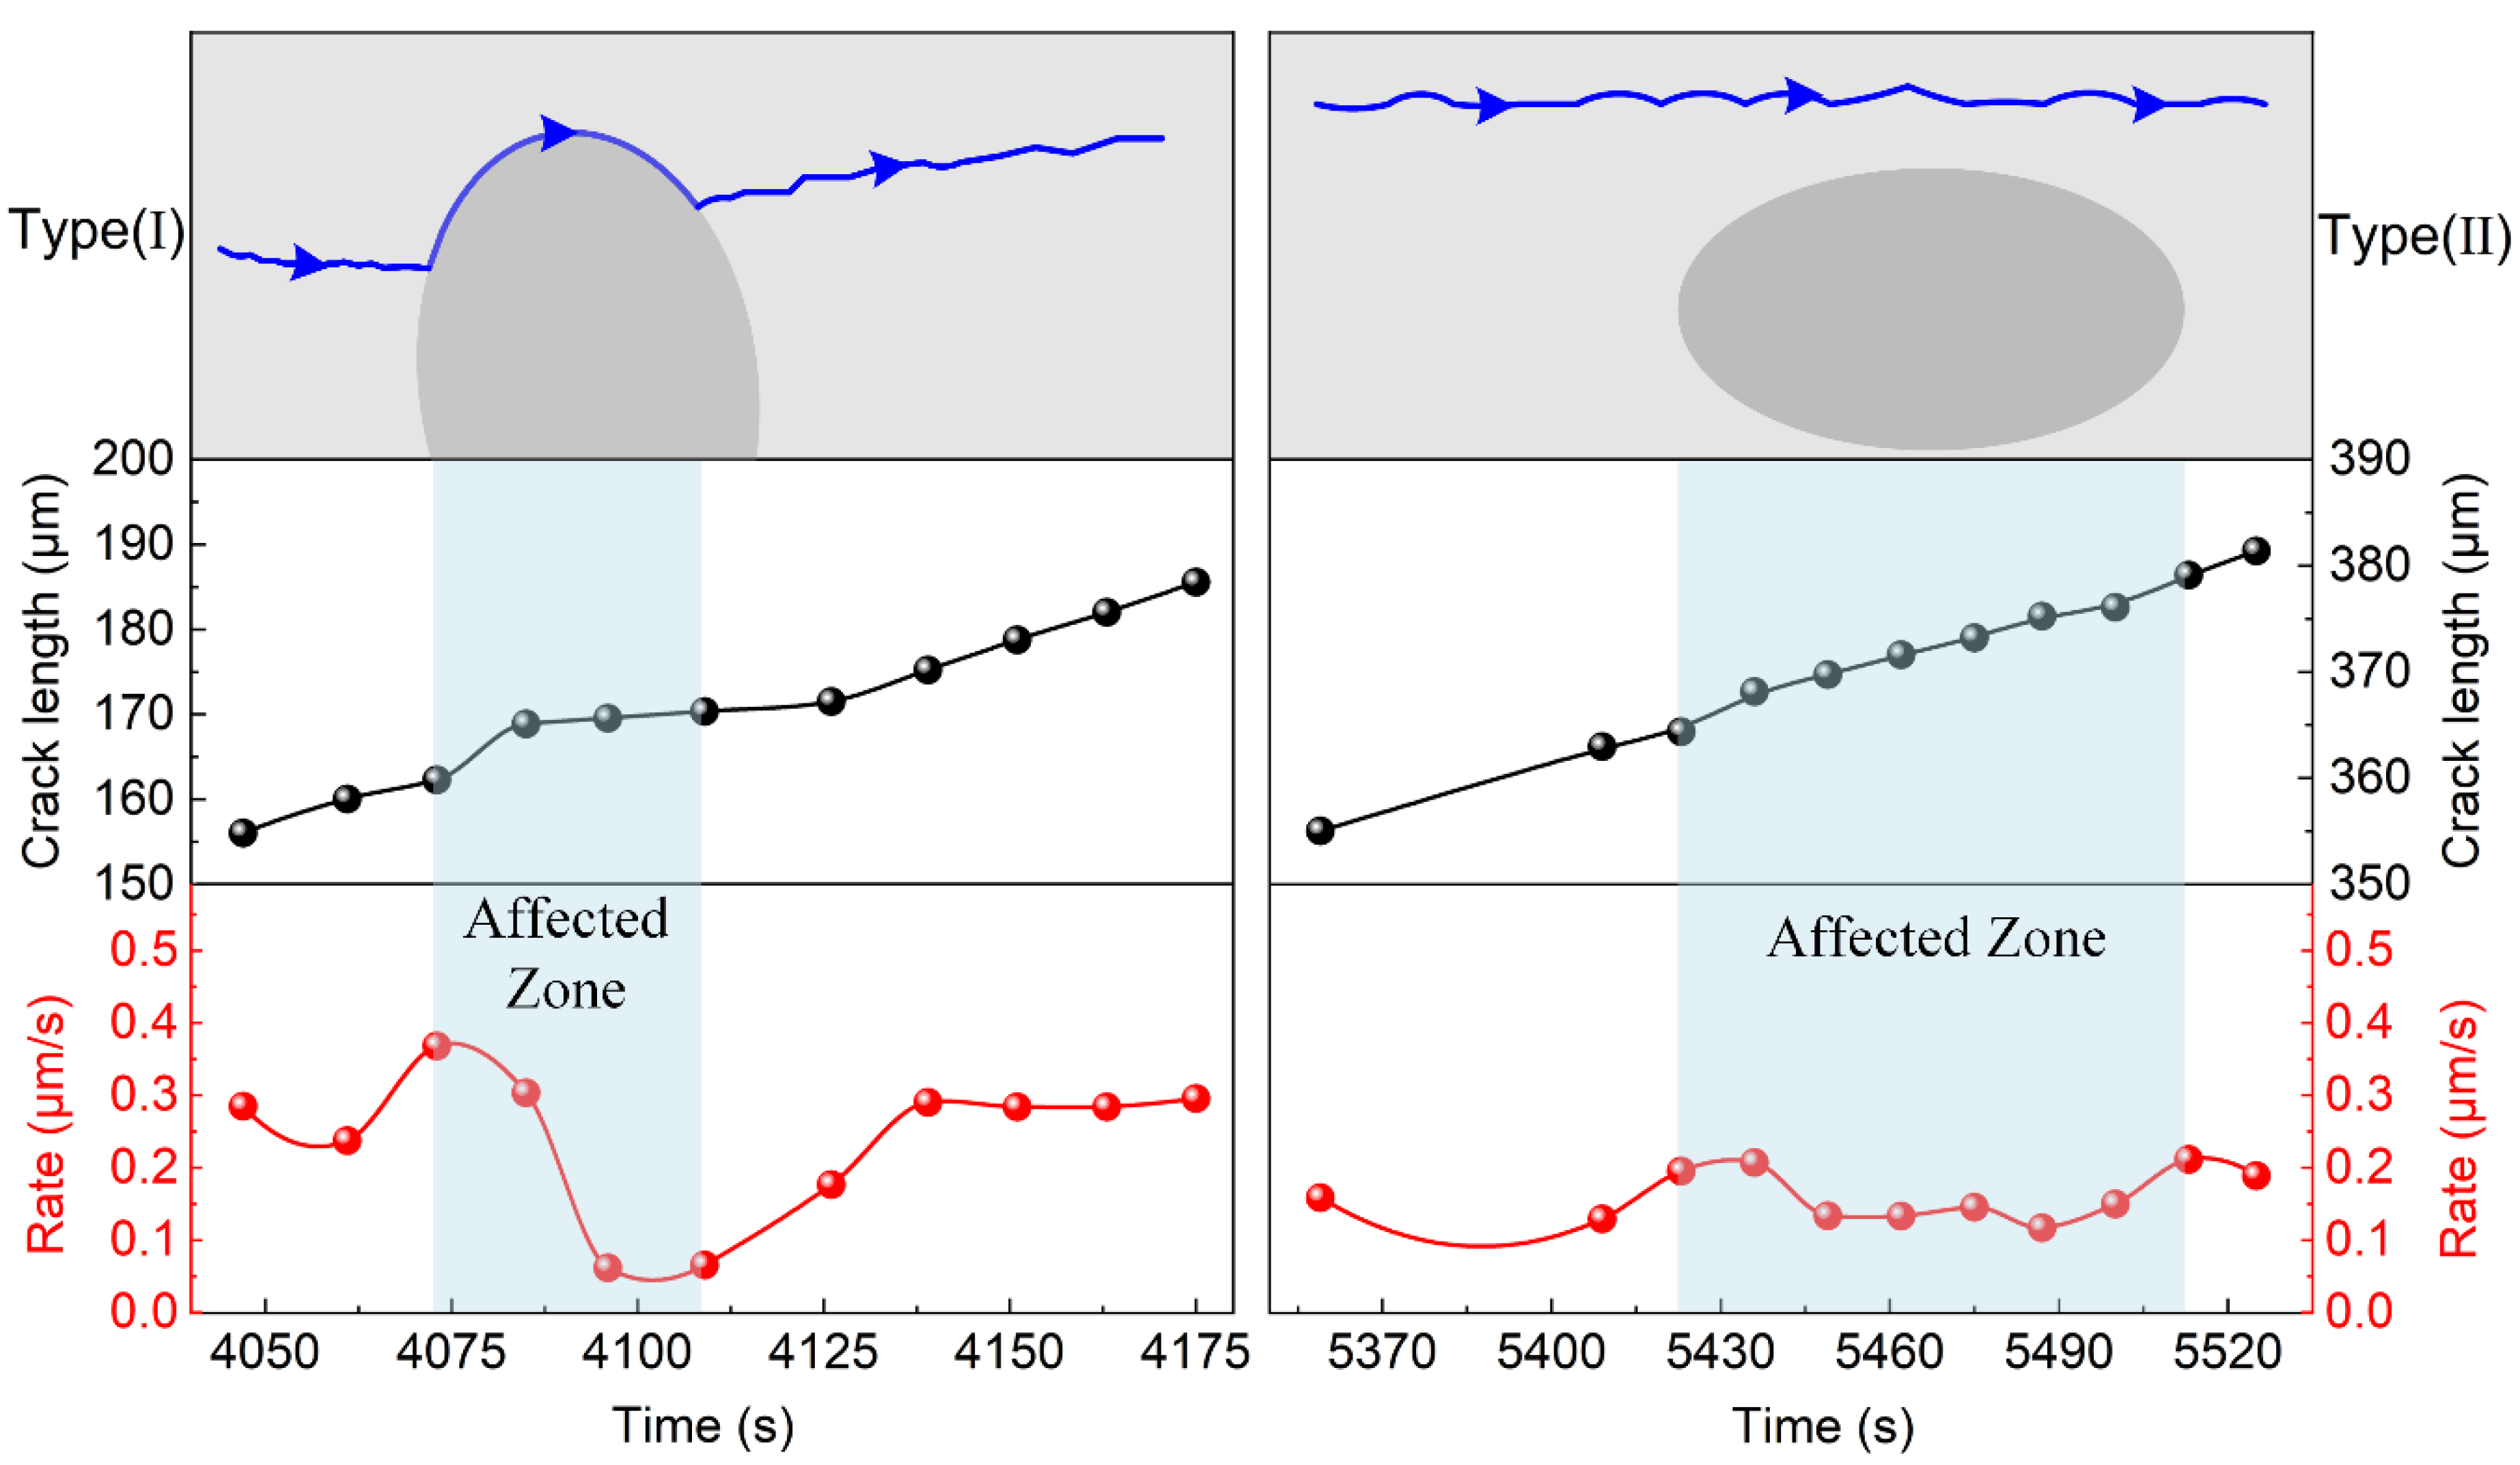
The crack length and growth rate are plotted in Figure 8 for both types. The affected zone of eutectics concerning the crack propagation rate is marked as the shadow zone. It should be noted that the crack length was measured from the bottom of the notch in SEM. The corresponding time was counted from the appearance of the crack below the notch of the specimen. The crack propagation rate was calculated by taking the derivative of crack length with respect to time.
In type I, the crack length followed a similar trend out of the affected zone; however, a mutation occurred at 4085 s, which arose from the coalescence of the primary crack and the second crack, as described in Section 3.2. Thereafter, the crack increased smoothly in the interaction zone. This phenomenon can also be clearly observed from the decrease of the crack propagation rate in Figure 8. Outside of the affected zone, the crack growth rate kept to about 0.3 μm/s. However, it could reach 0.4 μm/s due to the coalescence and subsequently decrease to 0.05 μm/s because of crack deflection in the affected zone. In type II, while the decrease of the crack propagation rate was not appreciable, the value was about 0.2 μm/s outside of the affected zone and 0.1 μm/s in the zone. The decline of crack propagation rate in type II was probably caused by strain energy being consumed on the interface of the eutectic and the γ/γ′ matrix.

3.4. Microstructure and Element Distribution around the Eutectic

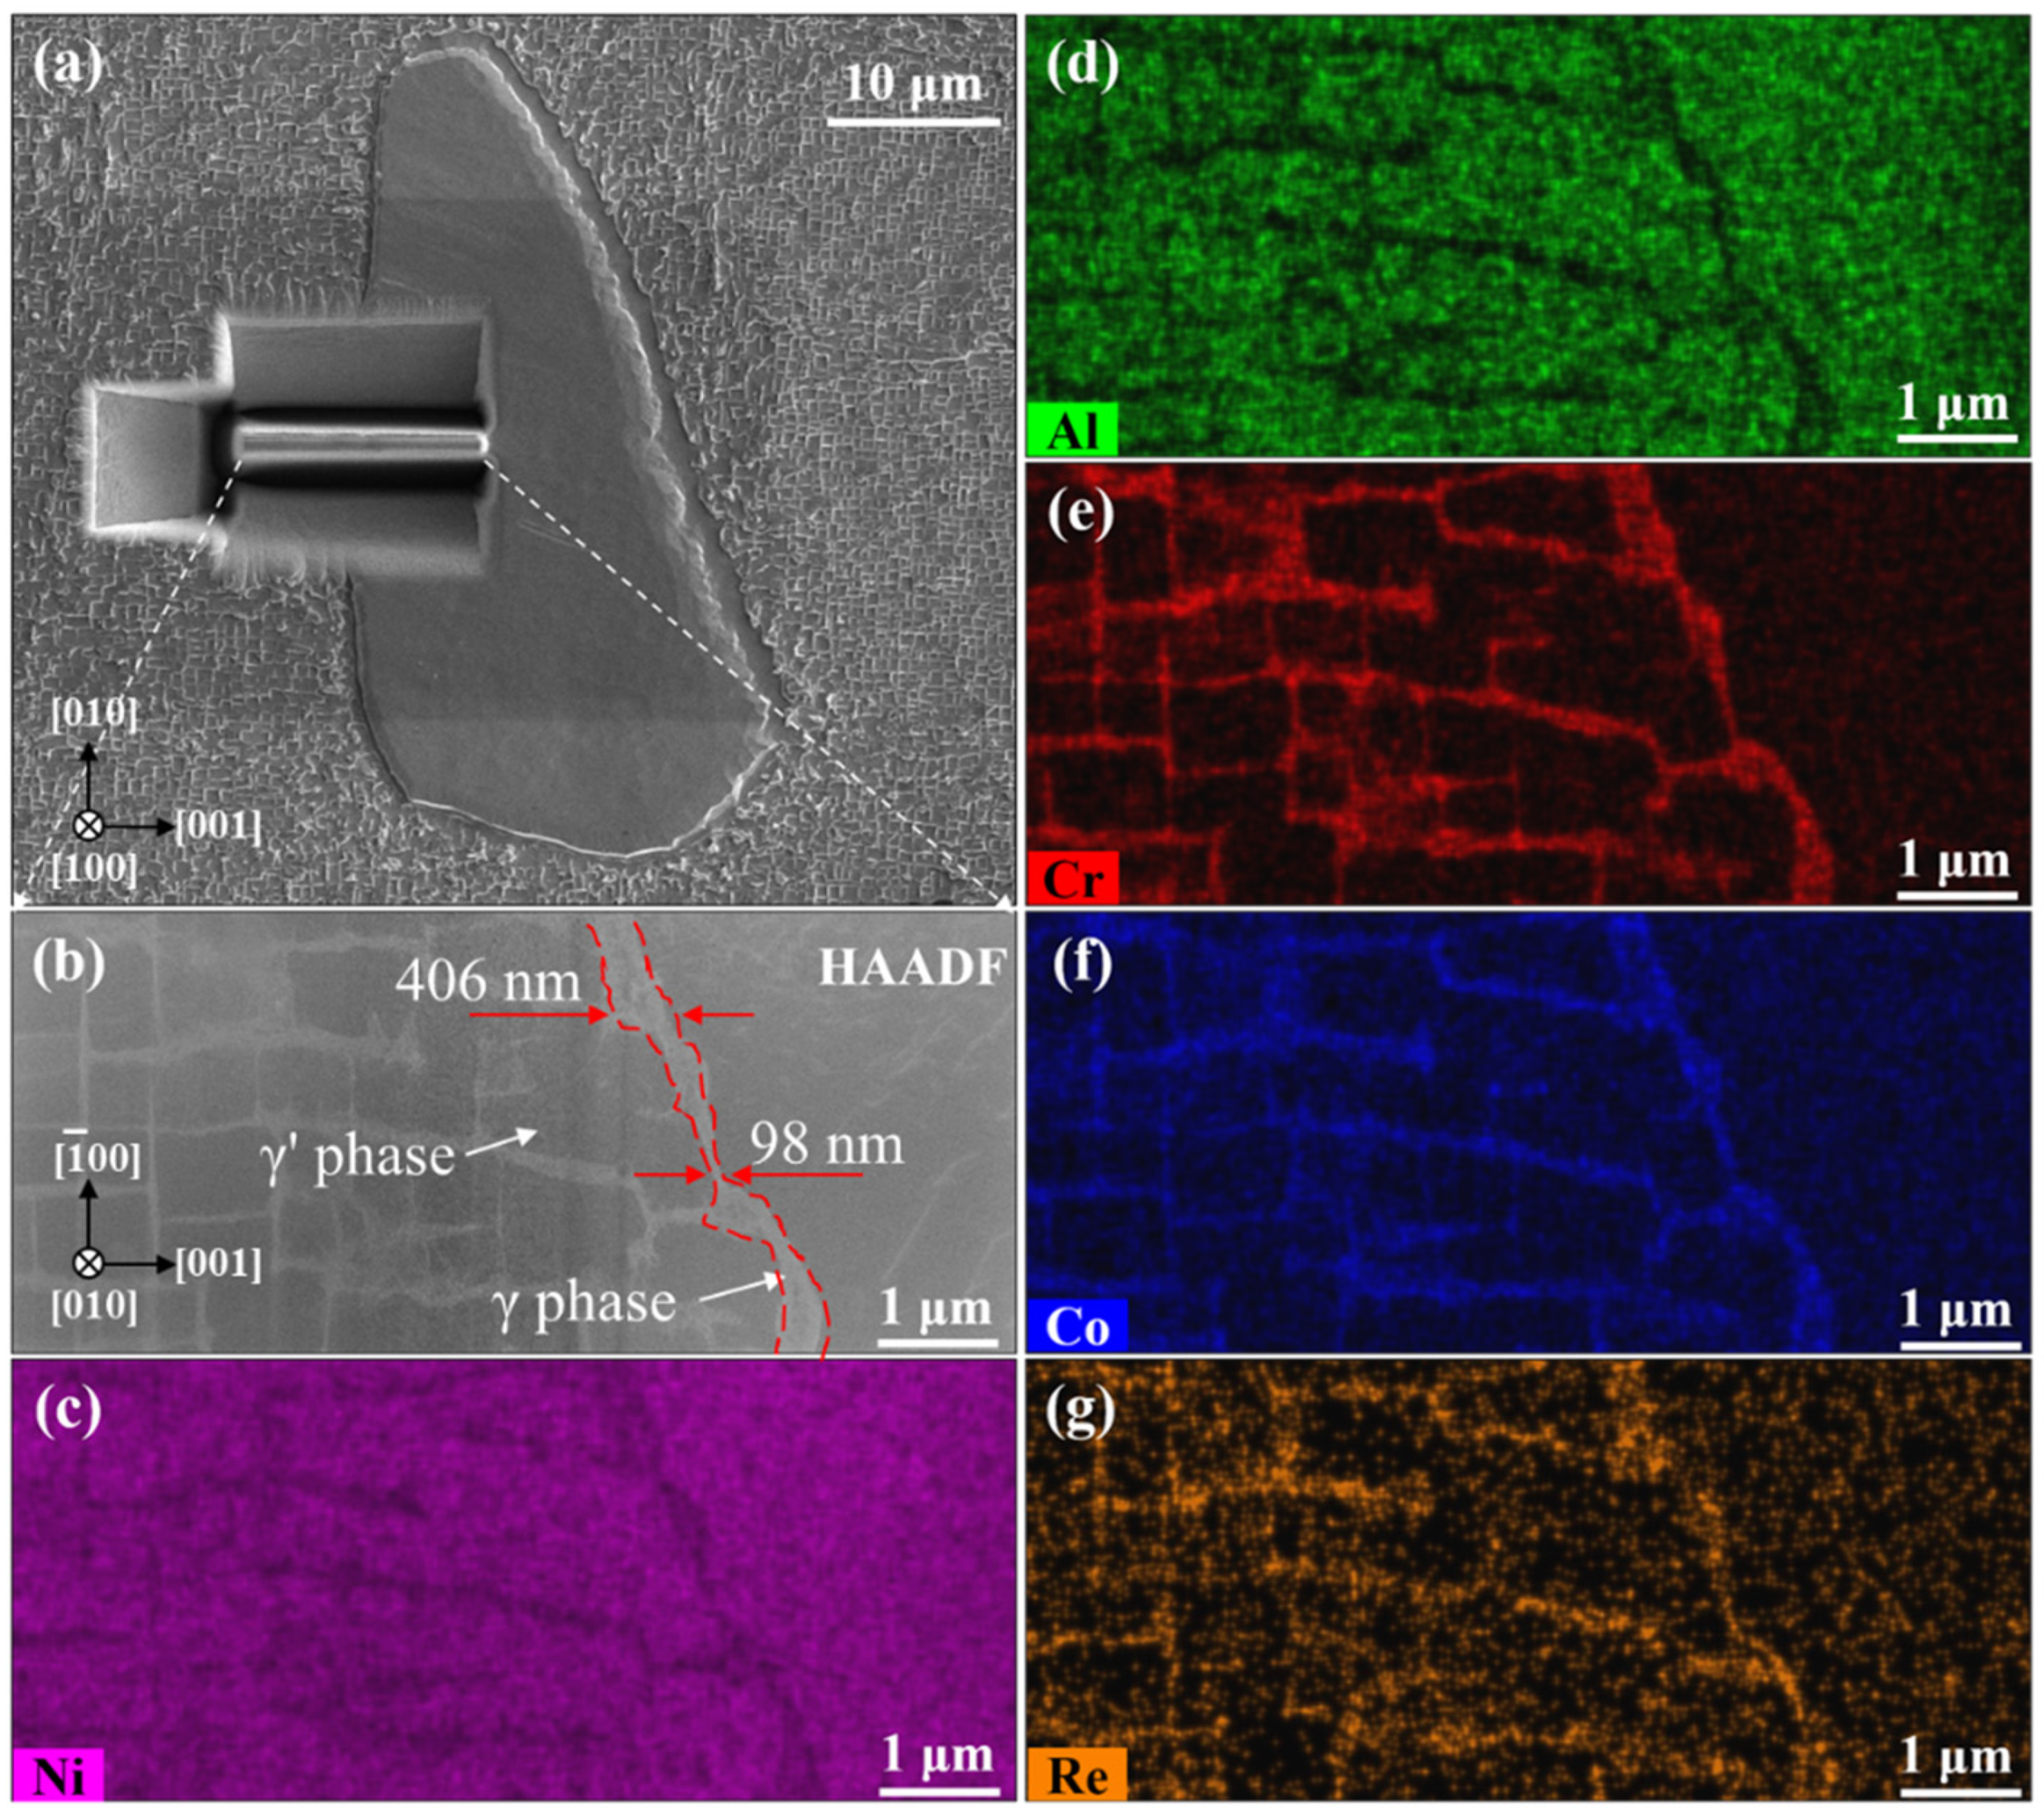
To further analyze the inhibition behavior of crack propagation at the interface, elemental distribution and microstructure in and around the eutectic was detected through TEM. An FIB foil containing both the γ/γ′ matrix and the eutectic was cut along the (100) crystal plane of the alloy, as shown in Figure 9a. A high contrast of the microstructure was observed in the HAADF-STEM image (Figure 9b); the eutectic showed almost the same contrast with the γ′ phase, which means the elements in the eutectic and the γ′ phase are almost the same. This could also be deduced from the elemental distribution shown in Figure 9c,g. Remarkably, the coarse γ phase and the irregular cubic γ′ phase gathered around the eutectic; the heterogeneous region was about 3.5 μm in width and was caused by an inadequate heat-treatment process [22]. The width of the coarse γ phase was 100 nm to 400 nm, shown as red arrows in Figure 9b, which is much wider than that of the regular γ phase with a value of about 70 nm. The heterogeneous coarse γ phase gathering around the eutectics was also caused by the inadequate heat treatment. Refractory elements including Cr, Co and Re were primarily partitioned into matrix channels and the coarse γ phase around the eutectic can be observed in Figure 9e,g. Other elements, including Hf, Nb, Mo, Ta, and W, were relatively homogeneous in both the γ/γ′ regions and the eutectic.

4. Discussion

The eutectic in a single-crystal superalloy is almost the same with the γ′ phase in composition; a study gave evidence that eutectics consist mostly of the γ′ phase [5]. Therefore, the mechanical properties are similar, and are predominantly controlled by Ni3Al with an LI2 structure. At high temperature, both tensile strength and yield strength of the eutectic are higher than those of the γ/γ′ matrix [4,23]. Thus, the eutectic presents a hardening precipitate performance. The stress concentration on the interface was caused by the difference or mismatch of mechanical properties of the γ/γ′ matrix and the eutectic. With the increase of global stress, stress concentration is more obvious on the interface and further leads to deformation even concerning cracks on the interface. That interfacial crack behavior is similar to carbides/matrix interfacial debonding [16].
In a single crystal superalloy with a high content of Re (about 2.9%) [24], dislocation initially tends to slip in γ channels along the <110> direction and accumulates on the γ/γ′ interface, which finally causes interfacial fracture features. The feature was also observed in our study during the cracking propagation period (C~F stage in Figure 4b). Dislocation climbing is more likely to happen than directly cutting of a γ′ precipitate due to thermal activation [25], slow tensile rate, and low stress. Figure 10a shows the situation corresponding to the interfacial crack feature during the C-F stage; dislocations generate in γ channels and glide on {111} planes, then deposit in the γ/γ′ interface and climb around γ′ cuboids because of the stopped displacement, which is similar to a high-temperature and low-stress creep process [26]. Finally, a microcrack initiates from the interface of the γ/γ′ phase due to the stress concentration happening in the position of the dislocation pipe-up [27]. For crystallographic cracks (F-fracture stage in Figure 4b), the dislocations gliding on {111} planes prefer cutting directly through γ′ cuboids due to high stress in front of the crack tip (Figure 10b), which is caused by the reduction of the cross section.
For the heterogeneous microstructure around the eutectic, especially the coarse γ phase, when the crack propagates in the γ/γ′ matrix and gets near the eutectic, the dislocation is easily generated and easily slips into the coarse γ phase but cuts through eutectics with difficulty due to the large size of the eutectic and the difference in the mechanical properties of the eutectic and the matrix; analogous resistance was also reported in a rafted γ′ structure [18]. Dislocation depositing in the γ/γ′ matrix and the eutectic interface is characterized in Figure 7f,g and illustrated in Figure 10c. The process is similar to the crack in the γ/γ′ interface. However, when the crack is far away from eutectics, as shown as Figure 10d, though an interfacial crack is not observed, the effect of the eutectic on the crack propagation rate cannot be ignored. The retardation effect is possibly caused by the coarse γ phase around the eutectic; dislocation glides in such a coarse γ phase would consume more strain energy compared with in normal γ channels. Besides, dislocations that climb or pass by the eutectic also consume more strain energy compared with the cubic γ′ precipitate due to the large size of the eutectic.

5. Conclusions

An in situ SEM tensile test was carried out for a single crystal superalloy at 1000 °C. The stress displacement was obtained, and the yield strength and tensile strength of the superalloy were 699 MPa and 826 MPa, respectively. During the tensile fracture process, the Model I crack path occurred from the crack initiation and propagation stages, followed by a crystallographic shearing crack until total fracture.
In type I, both the crack propagation path and rate were affected by the eutectic. The crack propagation rate would increase to 0.4 μm/s due to the coalescence of the primary crack and the second microcrack, then decrease to 0.05 μm/s because of crack deflection in the affected zone. In type II, only the crack propagation rate was affected by the eutectic. The rate was about 0.2 μm/s outside of affected zone and 0.1 μm/s in the zone.
The coarse γ phase with width from 100 nm to 400 nm around the eutectic and the larger size of the eutectic structure compared with thecubic γ′ precipitate was determined to have retardation concerning crack propagation.

Supplementary Materials

The following are available online at https://www.mdpi.com/2073-4352/10/11/1047/s1, Video S1: Crack Propagation Process.

Author Contributions

Conceptualization, Y.Z. and Z.Z.; Methodology, J.Z. (Jinghao Zhao), J.Z. (Jianli Zhou), W.Z., and J.M.; Data curation, X.R.; Writing—original draft and Writing—review & editing, W.J. All authors have read and agreed to the published version of the manuscript.

Funding

This work was supported by the NSFC-DFG joint project (No. 51761135129), the Great Wall Scholarship Project (No. CIT and TCD20170306), and Basic Science Center Program for Multiphase Media Evolution in Hypergravity of the National Natural Science Foundation of China (No. 51988101).

Conflicts of Interest

The authors declare no conflict of interest.

References

  1. Joyce, M.; Wu, X.; Reed, P. The effect of environment and orientation on fatigue crack growth behaviour of CMSX-4 nickel base single crystal at 650 °C. Mater. Lett. 2004, 58, 99–103. [Google Scholar] [CrossRef]
  2. Reed, R.C. Superalloys: Fundamentals and Applications; Cambridge University Press: Cambridge, UK, 2006; pp. 40–49. [Google Scholar]
  3. Wang, J.; Guo, W.-G.; Li, P.; Zhou, P.; Wang, Z. Dynamic tensile properties of a single crystal Nickel-base superalloy at high temperatures measured with an improved SHTB technique. Mater. Sci. Eng. A 2016, 670, 1–8. [Google Scholar] [CrossRef]
  4. Xiong, X.; Quan, D.; Dai, P.; Wang, Z.; Zhang, Q.; Yue, Z. Tensile behavior of nickel-base single-crystal superalloy DD6. Mater. Sci. Eng. A 2015, 636, 608–612. [Google Scholar] [CrossRef]
  5. Li, Z.; Wen, Z.; Gu, S.; Pei, H.; Gao, H.; Mao, Q. In-situ observation of crack initiation and propagation in Ni-based superalloy with film cooling holes during tensile test. J. Alloys Compd. 2019, 793, 65–76. [Google Scholar] [CrossRef]
  6. Ci, S.; Liang, J.; Li, J.; Zhou, Y.; Sun, X. Microstructure and tensile properties of DD32 single crystal ni-base superalloy repaired by laser metal forming. J. Mater. Sci. Technol. 2020, 45, 23–34. [Google Scholar] [CrossRef]
  7. Wang, X.; Liu, J.; Jin, T.; Sun, X. Tensile behaviors and deformation mechanisms of a nickel-base single crystal superalloy at different temperatures. Mater. Sci. Eng. A 2014, 598, 154–161. [Google Scholar] [CrossRef]
  8. Shang, Z.; Wei, X.; Song, D.; Zou, J.; Liang, S.; Liu, G.; Nie, L.; Gong, X. Microstructure and mechanical properties of a new nickel-based single crystal superalloy. J. Mater. Sci. Technol. 2020, 9, 11641–11649. [Google Scholar] [CrossRef]
  9. Thorton, P.; Davies, R.; Johnston, T. The temperature dependence of the flow stress of the γ′ phase based upon Ni3Al. Metall. Trans. 1970, 1, 207–218. [Google Scholar]
  10. Nembach, E.; Pesicka, J.; Langmaack, E. The high-temperature decrease of the yield strength of the γ′-strengthened superalloys NIMONIC PE16 and NIMONIC 105. Mater. Sci. Eng. A 2003, 362, 264–273. [Google Scholar] [CrossRef]
  11. Gasko, K.; Janowski, G.; Pletka, B. The influence of γ-γ′ eutectic on the mechanical properties of conventionally cast MAR-M247. Mater. Sci. Eng. A 1988, 104, 1–8. [Google Scholar] [CrossRef]
  12. Miao, J.; Pollock, T.M.; Jones, J.W. Crystallographic fatigue crack initiation in nickel-based superalloy René 88DT at elevated temperature. Acta Mater. 2009, 57, 5964–5974. [Google Scholar] [CrossRef]
  13. Steuer, S.; Villechaise, P.; Pollock, T.M.; Cormier, J. Benefits of high gradient solidification for creep and low cycle fatigue of AM1 single crystal superalloy. Mater. Sci. Eng. A 2015, 645, 109–115. [Google Scholar] [CrossRef]
  14. Walston, W.; Bernstein, I.; Thompson, A. The Role of the γ/γ′ eutectic and porosity on the tensile behavior of a single-crystal nickel-base superalloy. Metall. Trans. A 1991, 22, 1443–1451. [Google Scholar] [CrossRef]
  15. Zheng, L.; Zhang, G.; Lee, T.L.; Gorley, M.J.; Wang, Y.; Xiao, C.; Li, Z. The effects of Ta on the stress rupture properties and microstructural stability of a novel Ni-base superalloy for land-based high temperature applications. Mater. Des. 2014, 61, 61–69. [Google Scholar] [CrossRef]
  16. Rai, R.; Sahu, J.; Jena, P.; Das, S.K.; Paulose, N.; Fernando, C. High temperature tensile deformation of a directionally solidified nickel base superalloy: Role of micro constituents. Mater. Sci. Eng. A 2017, 705, 189–195. [Google Scholar] [CrossRef]
  17. Ponnusami, S.A.; Turteltaub, S.; van der Zwaag, S. Cohesive-zone modelling of crack nucleation and propagation in particulate composites. Eng. Fract. Mech. 2015, 149, 170–190. [Google Scholar] [CrossRef]
  18. Zhang, J.; Harada, H.; Ro, Y.; Koizumi, Y. Superior thermo-mechanical fatigue property of a superalloy due to its heterogeneous microstructure. Scr. Mater. 2006, 55, 731–734. [Google Scholar] [CrossRef]
  19. Ma, J.; Jiang, W.; Wang, J.; Zhang, Y.; Zhang, Z. Initial oxidation behavior of a single crystal superalloy during stress at 1150 °C. Sci. Rep. 2020, 10, 1–9. [Google Scholar] [CrossRef] [Green Version]
  20. Ma, J.; Lu, J.; Tang, L.; Wang, J.; Sang, L.; Zhang, Y.; Zhang, Z. A novel instrument for investigating the dynamic microstructure evolution of high temperature service materials up to 1150 °C in scanning electron microscope. Rev. Sci. Instrum. 2020, 91, 043704. [Google Scholar] [CrossRef]
  21. Chen, X.; Sakaguchi, M. Transition behavior from Mode I cracking to crystallographic cracking in a Ni-base single crystal superalloy. Int. J. Fatigue 2020, 132, 105400. [Google Scholar] [CrossRef]
  22. Paraschiv, A.; Matache, G.; Puscasu, C. The effect of heat treatment on the homogenization of CMSX-4 Single-Crystal Ni-Based Superalloy. Transp. Res. Procedia 2018, 29, 303–311. [Google Scholar] [CrossRef]
  23. Stoloff, N. Physical and mechanical metallurgy of Ni3Al and its alloys. Int. Mater. Rev. 1989, 34, 153–184. [Google Scholar] [CrossRef]
  24. Ding, Q.; Li, S.; Chen, L.-Q.; Han, X.; Zhang, Z.; Yu, Q.; Li, J. Re segregation at interfacial dislocation network in a nickel-based superalloy. Acta Mater. 2018, 154, 137–146. [Google Scholar] [CrossRef]
  25. Wang, G.; Liu, J.; Liu, J.; Wang, X.; Zhou, Y.; Sun, X.; Zhang, H.; Jin, T. Temperature dependence of tensile behavior and deformation microstructure of a Re-containing Ni-base single crystal superalloy. Mater. Des. 2017, 130, 131–139. [Google Scholar] [CrossRef]
  26. Barba, D.; Alabort, E.; Pedrazzini, S.; Collins, D.; Wilkinson, A.; Bagot, P.; Moody, M.; Atkinson, C.; Jérusalem, A.; Reed, R. On the microtwinning mechanism in a single crystal superalloy. Acta Mater. 2017, 135, 314–329. [Google Scholar] [CrossRef]
  27. Lang, Y.; Zhou, G.; Hou, L.; Zhang, J.; Zhuang, L. Significantly enhanced the ductility of the fine-grained Al–Zn–Mg–Cu alloy by strain-induced precipitation. Mater. Des. 2015, 88, 625–631. [Google Scholar] [CrossRef]
Figure 1. Schematic diagram of heat treatment cycle used for superalloy.
Crystals 10 01047 g001
Figure 2. Microstructure of nickel-based single-crystal superalloy; (a) low magnification SEM image of tensile specimen, (b) γ/γ′ matrix microstructure, (ce) typical eutectics, (f) distribution of eutectics.
Crystals 10 01047 g002
Figure 3. (a) Tensile test equipment. (b) Tensile test stage assembled into SEM.
Crystals 10 01047 g003
Figure 4. (a) Displacement-load curve of the superalloy. (b) Final fracture morphology; (ce) different crack propagation stages.
Crystals 10 01047 g004
Figure 5. (a) Tensile fracture morphology at 1000 °C. (b,c) Typical position in fracture surface.
Crystals 10 01047 g005
Figure 6. SEM photos of crack propagation and corresponding stress distribution for type Ⅰ: (ac). Type Ⅱ: (df). (g) Possible slip trace of the <110>{111} system on the (110) plane.
Crystals 10 01047 g006
Figure 7. Electron backscattering diffraction (EBSD) dataset obtained after tensile fracture of the single-crystal superalloy: (a) Microstructure around eutectics far away from the fracture. (d,g) microstructure around eutectics near the fracture; (b,e,h) corresponding IPF maps; (f,i) corresponding kernel average misorientation (KAM) maps; (c) relative frequency distribution at different local misorientation of (d,g); (j) misorientation in and out of the eutectics marked by black dotted line in (a,d,g).
Crystals 10 01047 g007
Figure 8. Crack length and propagation rates in two types. Type (I) Interface cracking. Type (II) Matrix cracking.
Crystals 10 01047 g008
Figure 9. Microstructure and main elements distribution in and around the eutectic. (a) Selected location of the FIB foil. (b) HAADF-STEM image of the γ phase, the γ′ phase, and the eutectic microstructure. (cg) EDS mapping of Ni, Al, Cr, Co, and Re, respectively.
Crystals 10 01047 g009
Figure 10. Schematic of movement of dislocations in superalloys. (a) Dislocation depositing in γ/γ′ interface and climbing around γ′ cuboids. (b) Dislocation cutting through γ′ cuboids. (c,d) dislocation depositing in γ/γ′ matrix and eutectic interface.
Crystals 10 01047 g010
Table 1. Chemical compositions (wt%) of Ni-based single-crystal superalloy.
CrCoWAlTaReMoHfNbNi
4.39.185.262.51.50.10.5REST
Publisher’s Note: MDPI stays neutral with regard to jurisdictional claims in published maps and institutional affiliations.