Article

Experimental and Modeling Analysis of Holey Graphene Electrodes for High-Power-Density Li-Ion Batteries

1
Department of Applied Science, R.O.C. Naval Academy, Zuoying, Kaohsiung 813, Taiwan
2
Department of Chemistry, National Sun Yat-Sen University, Kaohsiung 804, Taiwan
3
Department of Electrical Engineering, Yuan Ze University, Zhongli, Taoyuan 320, Taiwan
4
School of Defense Science, Chung Cheng Institute of Technology, National Defense University, Dasi, Taoyuan 335, Taiwan
5
Department of Chemical & Materials Engineering, Chung Cheng Institute of Technology, National Defense University, Dasi, Taoyuan 335, Taiwan
6
Department of Mechanical Engineering, Ming Chi University of Technology, Taishan, New Taipei City 243, Taiwan
*
Authors to whom correspondence should be addressed.
Crystals 2020, 10(11), 1063; https://doi.org/10.3390/cryst10111063
Submission received: 28 October 2020 / Revised: 19 November 2020 / Accepted: 20 November 2020 / Published: 22 November 2020

Abstract

:
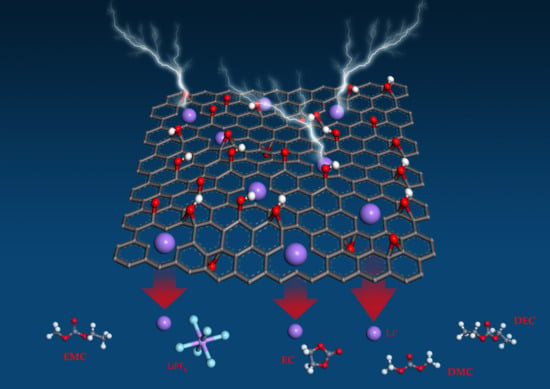
The performances of lithium-ion batteries (LIBs) using holey graphene (HGNS) as the anode material are compared with those using non-holey graphene (GNS). The effects of graphene holes on ion transport are analyzed with a combined experiment/modeling approach involving molecular dynamics (MD) simulations. The large aspect ratio of GNS leads to long transport paths for Li ions, and hence a poor rate capability. We demonstrate by both experiments and simulations that the holey structure can effectively improve the rate capability of LIBs by providing shortcuts for Li ion diffusion through the holes in fast charge/discharge processes. The HGNS anode exhibits a high specific capacity of 745 mAh/g at 0.1 A/g (after 80 cycles) and 141 mAh/g at a large current density of 10 A/g, which are higher than the capacity values of the GNS counterpart by 75% and 130%, respectively. MD simulations also reveal the difference in lithium ion transport between GNS and HGNS anodes. The calculations indicate that the HGNS system has a higher diffusion coefficient for lithium ions than the GNS system. In addition, it shows that the holey structure can improve the uniformity and quality of the solid electrolyte interphase (SEI) layer, which is important for Li ion conduction across this layer to access the electrode surface. Moreover, quantum chemistry (QC) computations show that ethylene carbonate (EC), a cyclic carbonate electrolyte with five-membered-ring molecules, has the lowest electron binding energy of 1.32 eV and is the most favorable for lithium-ion transport through the SEI layer. A holey structure facilitates uniform dispersion of EC on graphene sheets and thus enhances the Li ion transport kinetics.

Graphical Abstract

1. Introduction

The ever-growing markets of electric vehicles and portable electronic devices have created great demands for novel rechargeable battery technologies. In addition, long-term storage units for surplus energy have become an essential part of integrated renewable energy systems. Owing to their long operation life and high energy storage capacity, lithium-ion batteries (LIBs) are often regarded as the first choice for most energy storage applications. However, there is an urgent need to upgrade the commercial LIBs in order to cope with the increasing requirements on the performance of energy storage devices and systems. For example, further progress on the performances of high-rate charging and discharging in LIBs is keenly demanded in many applications.
One key method to improve LIB performances is to replace the graphite anode (i.e., negative electrode) with advanced materials [1]. Graphene has been considered by many a possibility to address this issue [2,3]. Using graphene as the anode material not only doubles the theoretical specific capacity of LIBs by storing Li on both faces of each graphene sheet but also improves Li-ion diffusion and the high-rate charge/discharge capability. Although graphene offers higher chemical diffusivity for Li ions (10−7–10−6 cm2/s) [4,5] than graphite, its two-dimensional (2-D) structure leads to the problem of easy restacking, which can significantly reduce the Li-ion diffusion rate [6,7,8]. Therefore, several ways of creating anti-restacking 3-dimensional (3-D) graphene structures [9,10,11,12,13,14,15] have been proposed. Even if restacking of graphene is avoided, its large 2-D geometry and excellent impermeability render it an undesirable diffusion barrier for Li ions and solvent molecules. To overcome this obstacle, researchers have proposed and demonstrated ways to create holes on graphene sheets, and these holes have proven useful in improving the ionic transport of graphene electrodes [16,17,18,19,20].
In addition to the research works where graphene has been studied in half-cells, there have also been several studies which investigated the performance of full Li-ion cells where graphene anodes are used in combination with cathodes such as LiNi0.5Mn1.5O4 [21] and LiFePO4 [22,23,24]. Such studies can better reflect the reality of graphene in LIBs.
The LIB electrolyte usually consists of a common organic solution with a mixture of linear and cyclic carbonates as solvents. Another essential component that dictates the charge/discharge dynamics in a LIB is the thin layer formed spontaneously at the interface between the electrode and the electrolyte, as Li ions need to pass through it in order to reach or escape the electrode surface during the charge/discharge cycle [1,25,26]. This passivation layer, which is called the solid electrolyte interphase (SEI) [27,28,29], is formed during the first few cycles when the electrolyte solvents decompose reductively on the anode and the decomposed products cover the electrode surface. Once formed, the SEI should be ion-conducting to facilitate the transport of lithium ions during intercalation and deintercalation, but nonconducting for electrons to avoid further decomposition of the electrolyte. It must also have good chemical stability and low solubility in the electrolyte. Additionally, it is very important that the SEI layer exhibits good uniformity in morphology and chemical composition in order to ensure the good performance of an LIB.
Herein, we report a study of the benefits of holey graphene on the performances of LIBs using both theoretical and experimental methods. The theoretical calculation methods employed were molecular dynamics (MD) simulation and quantum chemistry (QC). The holey graphene nanosheets not only increase the specific surface area and hence the battery capacity, but also improve the accessibility and diffusivity of lithium ions. Additionally, our molecular dynamics simulation shows that the unique holey morphology can greatly facilitate the formation of a more uniform SEI on the carbonaceous anode, which will result in favorable electrochemical performance of the LIB.

2. Experimental Details

2.1. Preparation of Pristine and Holey Graphene Samples

The high-purity graphite powder (purity > 99.9995%; 200 mesh) used to prepare GO was purchased from Alfa Aesar. It was first oxidized to obtain graphene oxide (GO) using the Staudenmaier method. An amount of 5 g of natural graphite powder was added into a mixture of sulfuric acid (87.5 mL, 95%) and nitric acid (45 mL, 65%). Potassium chlorate (5.5 g) was next added slowly into the solution, which was cooled with an ice bath to avoid a temperature rise, and then stirred for over 96 h. After that, the mixture was added with a 5% solution of HCl (Sigma-Aldrich, 37%) and then centrifuged until the sulfate ions were removed from the solution. The solution was then repetitively diluted with deionized water and centrifuged until its pH values became 7.0. The neutral solution was filtered with 0.5-μm-pore-size filter paper and then dried by baking at 80 °C for 24 h. After baking, the filtered GO was ground into powder. To prepare exfoliated pristine graphene (GNS) samples, an appropriate amount of graphene oxide powder was inserted in an Ar-filled quartz tube furnace, which was then heated from room temperature to 1100 °C at a rate of 10 °C/min and held at that temperature for 1 h. As for the production of holey graphene (HGNS), a modified approach called ultra-rapid heating [16] was used. The Ar-filled quartz tube furnace was preheated to 1100 °C. To maximize the heating rate for GO, we quickly opened a hinged-type flange on one end of the quartz tube and then inserted a long-handled stainless-steel tool containing GO powder rapidly into the center of the quartz tube to dump the powder onto the heated inner wall of the tube. To maintain the inert atmosphere, the Ar flow rate was raised throughout this process, and then the furnace was immediately sealed again afterwards. Since the GO powder was in direct thermal contact with the hot quartz tube, the heat transfer was very fast, and the instantaneous heating rate for the dumped GO can be as high as 300 °C/s or 18,000 °C/min, resulting in severe hole-punching, instead of mere exfoliation, of graphene sheets due to violent CO2 gas generation. The HGNS was kept in the furnace at 1100 °C for 1 h to remove the oxygen functional groups.

2.2. Characterizations

The microstructures and morphologies of the GNS and HGNS samples were characterized by X-ray diffractometry (XRD, Rigaku, Tokyo, Japan, D/Max 2200) and scanning electron microscopy (SEM, JEOL, Tokyo, Japan, JSM-6500), respectively. The specific surface area values for GNS and HGNS were determined from the N2 physisorption isotherms obtained with a Micromeritics (Norcross, GA, USA) ASAP 2020 Surface Area and Porosity Analyzer by the Brunauer–Emmett–Teller (BET) method. The Raman spectra of the samples were obtained with a Renishaw (Wotton-under-Edge, UK) inVia Raman microscope using a 514.5 nm laser excitation wavelength. The elemental compositions of the GO, GNS, and HGNS samples were determined by elemental analysis (EA, Thermo Scientific, Waltham, MA, USA, FlashEA 2000 CHNS-O Analyser).

2.3. Electrochemical Measurements

The CR2032 type coin cell structure was adopted for electrochemical measurements. To fabricate the working electrode, 80 wt.% of GNS (or HGNS) and 20 wt.% of polyvinylidene difluoride (PVDF) were mixed well in NMP and spread onto a circular copper foil. The layer thickness was set at 3 μm, and the masses of the GNS and HGNS electrodes were 0.7 and 0.5 mg, respectively. The mass loading of the electrodes was 0.45 and 0.32 mg/cm2 for GNS and HGNS, respectively. The electrolyte was 1 M LiPF6 dissolved in the mixture of ethylene carbonate (EC), dimethyl carbonate (DMC), ethyl methyl carbonate (EMC), and Diethyl carbonate (DEC), and the separator used was a Celgard® 2400 polypropylene membrane. The counter electrode was a pure lithium foil. The galvanostatic charge–discharge measurements were recorded with a battery auto-test system (AcuTech, New Taipei, Taiwan, BAT-750B) in a voltage range from 0.01 to 3 V (vs. Li/Li+) at various current densities.

3. Simulations

3.1. Simulated Systems

Molecular dynamics (MD) simulation was carried out to study the morphologies and physical properties of graphene/electrolyte composites. The lithium salt, LiPF6, and graphene molecules were mixed with a solution containing various organic components. Given in Table 1 are the structures and physical properties of these organic molecules: EC, DMC, EMC, and DEC [27].
The compositions of the simulated systems are given in Table 2. Two systems containing graphene sheets (GNS, C284H14O28) and holey graphene sheets (HGNS, C275H14O28), separately, were simulated for comparison. The HGNS molecule constructed according to Schniepp et al. [30] is shown in Figure 1. The red and white colors represent O and H atoms, respectively. Each GNS or HGNS contains 14 epoxy and 14 hydroxyl groups, randomly distributed on the graphene plane. The ratio of C atoms replaced with epoxy and hydroxyl groups in GNS and HGNS was set to about 10%. The dimensions of the GNS and HGNS sheets in the simulation are 26.41 Å × 27.68 Å [31,32]. The holes are distributed in a random way to fit the actual material state as shown in Figure 1.

3.2. Simulation Method

All simulation runs were performed in (N,V,T) condition with Nóse–Hoover thermostat at 298 K using the BIOVIA (San Diego, CA, USA) Materials Studio 6 package. The UNIVERSAL force field was chosen for the simulations [33]. The trajectories were integrated via the Verlet leapfrog algorithm and the time step of integration was set to 1.0 femtosecond. A gradually-reducing-box (GRB) method was adopted in order to construct reasonable GNS/electrolyte and HGNS/electrolyte composite systems. To begin with, the GNS, or HGNS, the ions of electrolyte, and all of the solvent molecules were randomly arranged into a large box. The initial box size of each system was set to 0.1 g/cm3 so that molecules were well separated in distance and the inter-molecular interactions were very weak. MD simulation was executed until the system reached thermal equilibrium. Next, the box size was compressed slightly (say, 1% in each dimension) so that the molecules were slightly closer to each other; MD simulation was then performed again to thermally equilibrate the compressed box. The procedure was repeated until the density of the simulated system reached its experimental density.
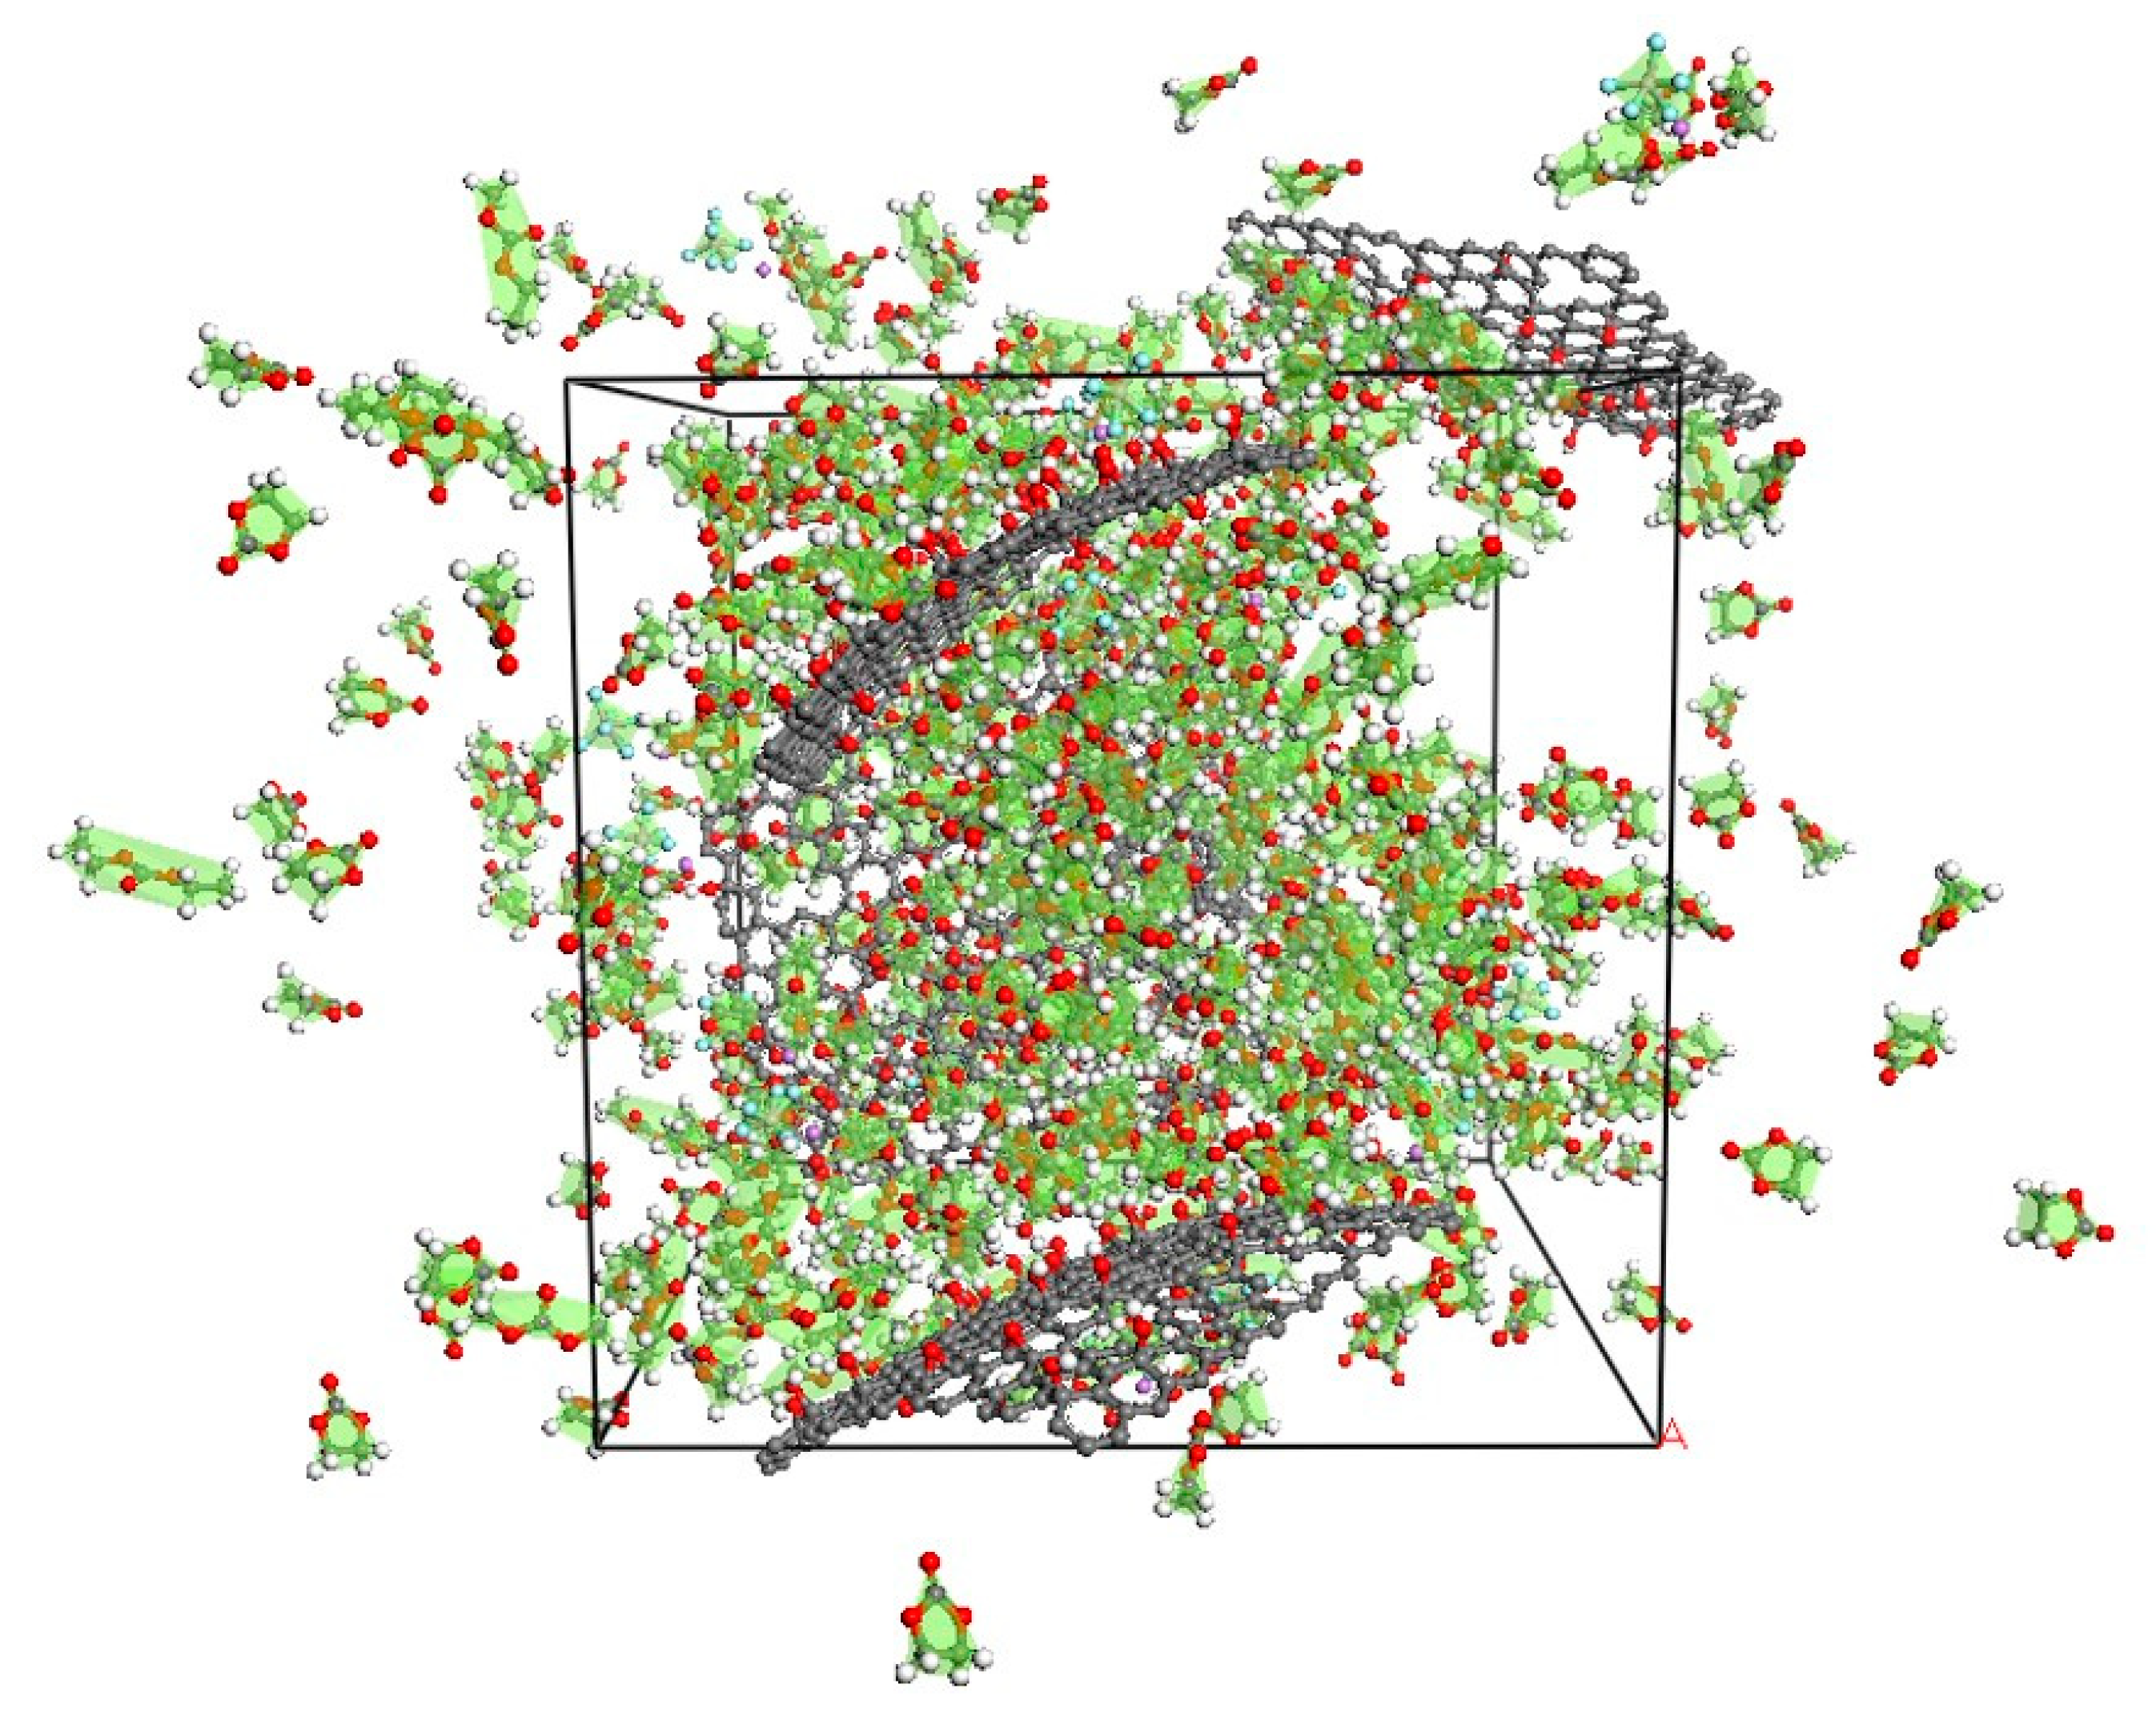
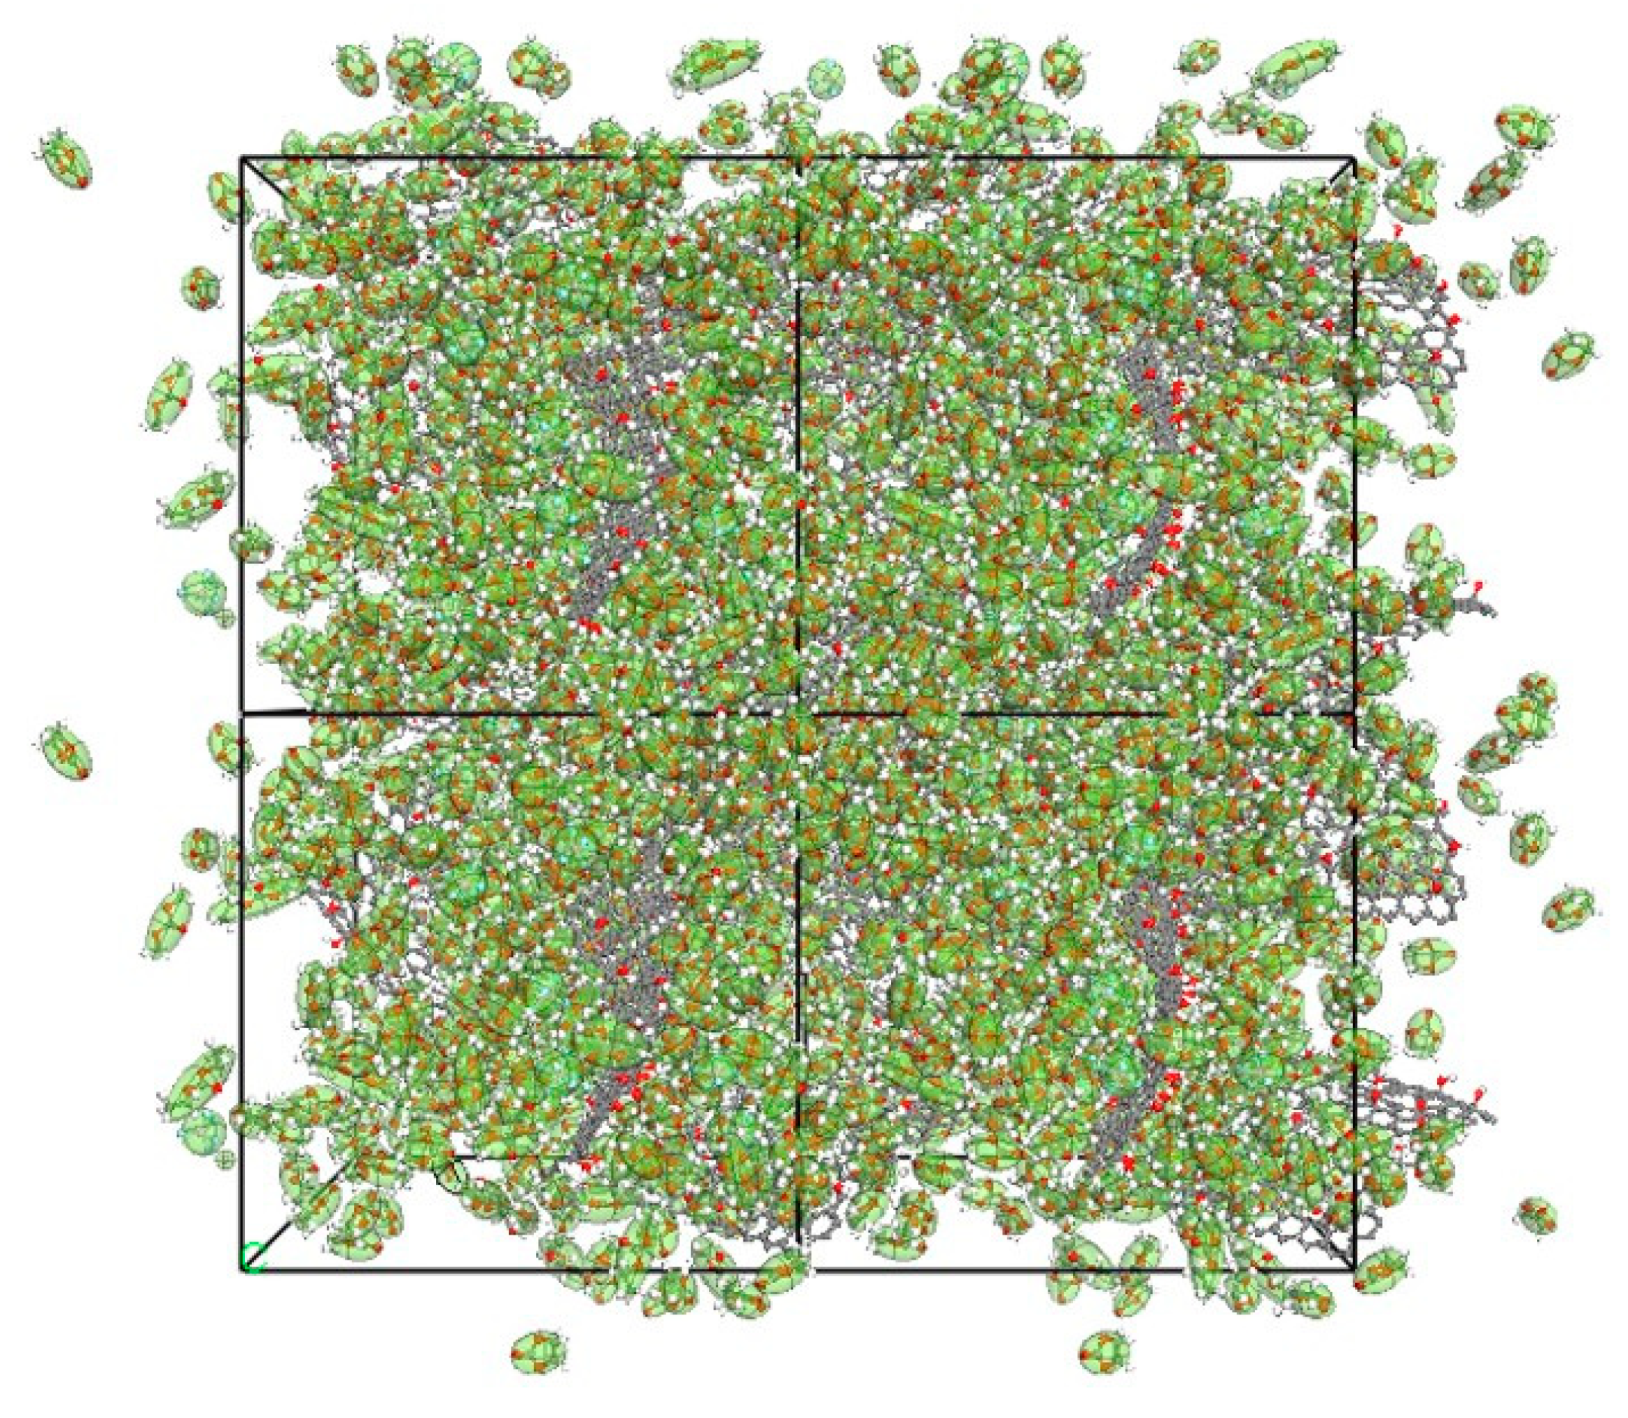
The final box sizes of the two simulated systems were 45 Å × 45 Å × 45 Å. Figure 2 displays a snapshot of the simulation box (system 2) in the initial stage of the repetitive compression procedure. Clearly, the HGNS sheets and the electrolyte molecules were randomly distributed. After the final box size was reached, an additional MD run of 1000 ps was carried out to further relax the system. Finally, the trajectories were recorded every 20 steps for a total time period of 50 ns. Figure 3 is a snapshot of our HGNS/electrolyte system for the final-size box.

4. Results and Discussion

4.1. Experimental Results

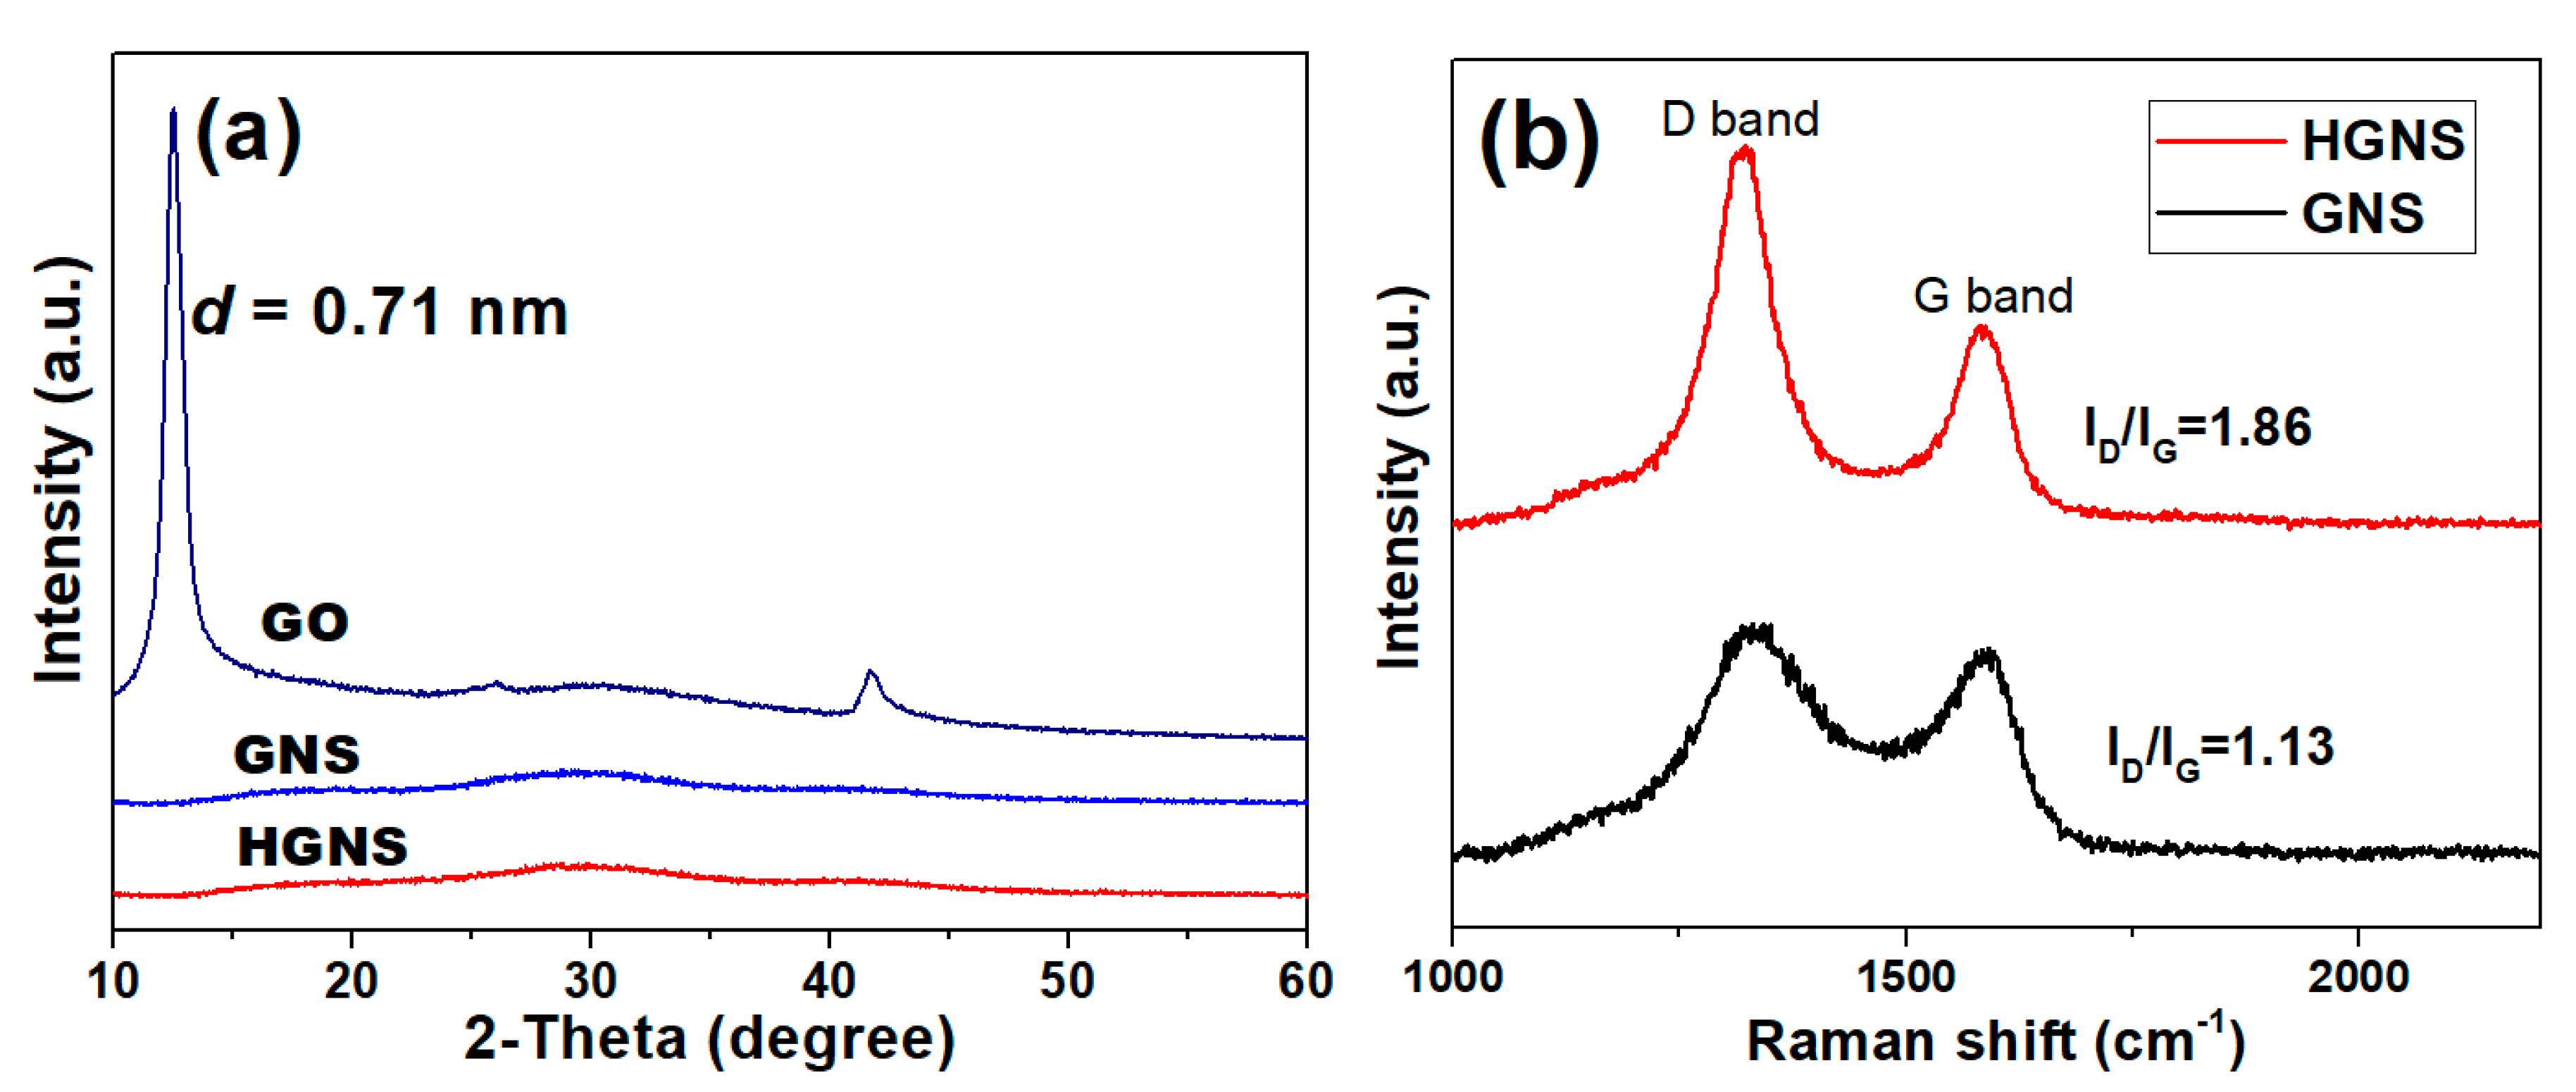
The microstructures of GO, GNS, and HGNS were characterized by XRD (see Figure 4a). For GO, the (002) peak shifted from 26.3° (for graphite) to 12.5°, because the interlayer spacing increased from 0.34 nm to 0.71 nm as a result of oxidation and intercalation. By contrast, the XRD patterns for GNS and HGNS show no diffraction peak, which indicates that the pristine and holey graphene samples both have a high degree of exfoliation. The difference in structural defects between GNS and HGNS can be revealed by Raman spectra. The peak at 1585/cm is the G-band, which corresponds to the stretching of the ordered sp2 carbon atoms, whereas the peak at 1335/cm is the D-band, which is related to disordered carbon and defects. The intensity ratio ID/IG is routinely used as an indicator for the quality of carbon materials. In Figure 4b, HGNS has a significantly higher D-band intensity than GNS. It confirmed that the structure of graphene is severely damaged by the gas punching the sheets during the ultra-rapid heating process for HGNS preparation. Table 3 shows the elemental composition, which was determined by EA, and the C/O ratio for GO, GNS and HGNS samples. The oxygen content in GO is as high as 38% due to the severe oxidation process. The significantly increased C/O ratios for GNS and HGNS after thermal reduction confirm the obtaining of high-purity graphene samples as a result of the removal of oxygen functional groups at 1100 °C.
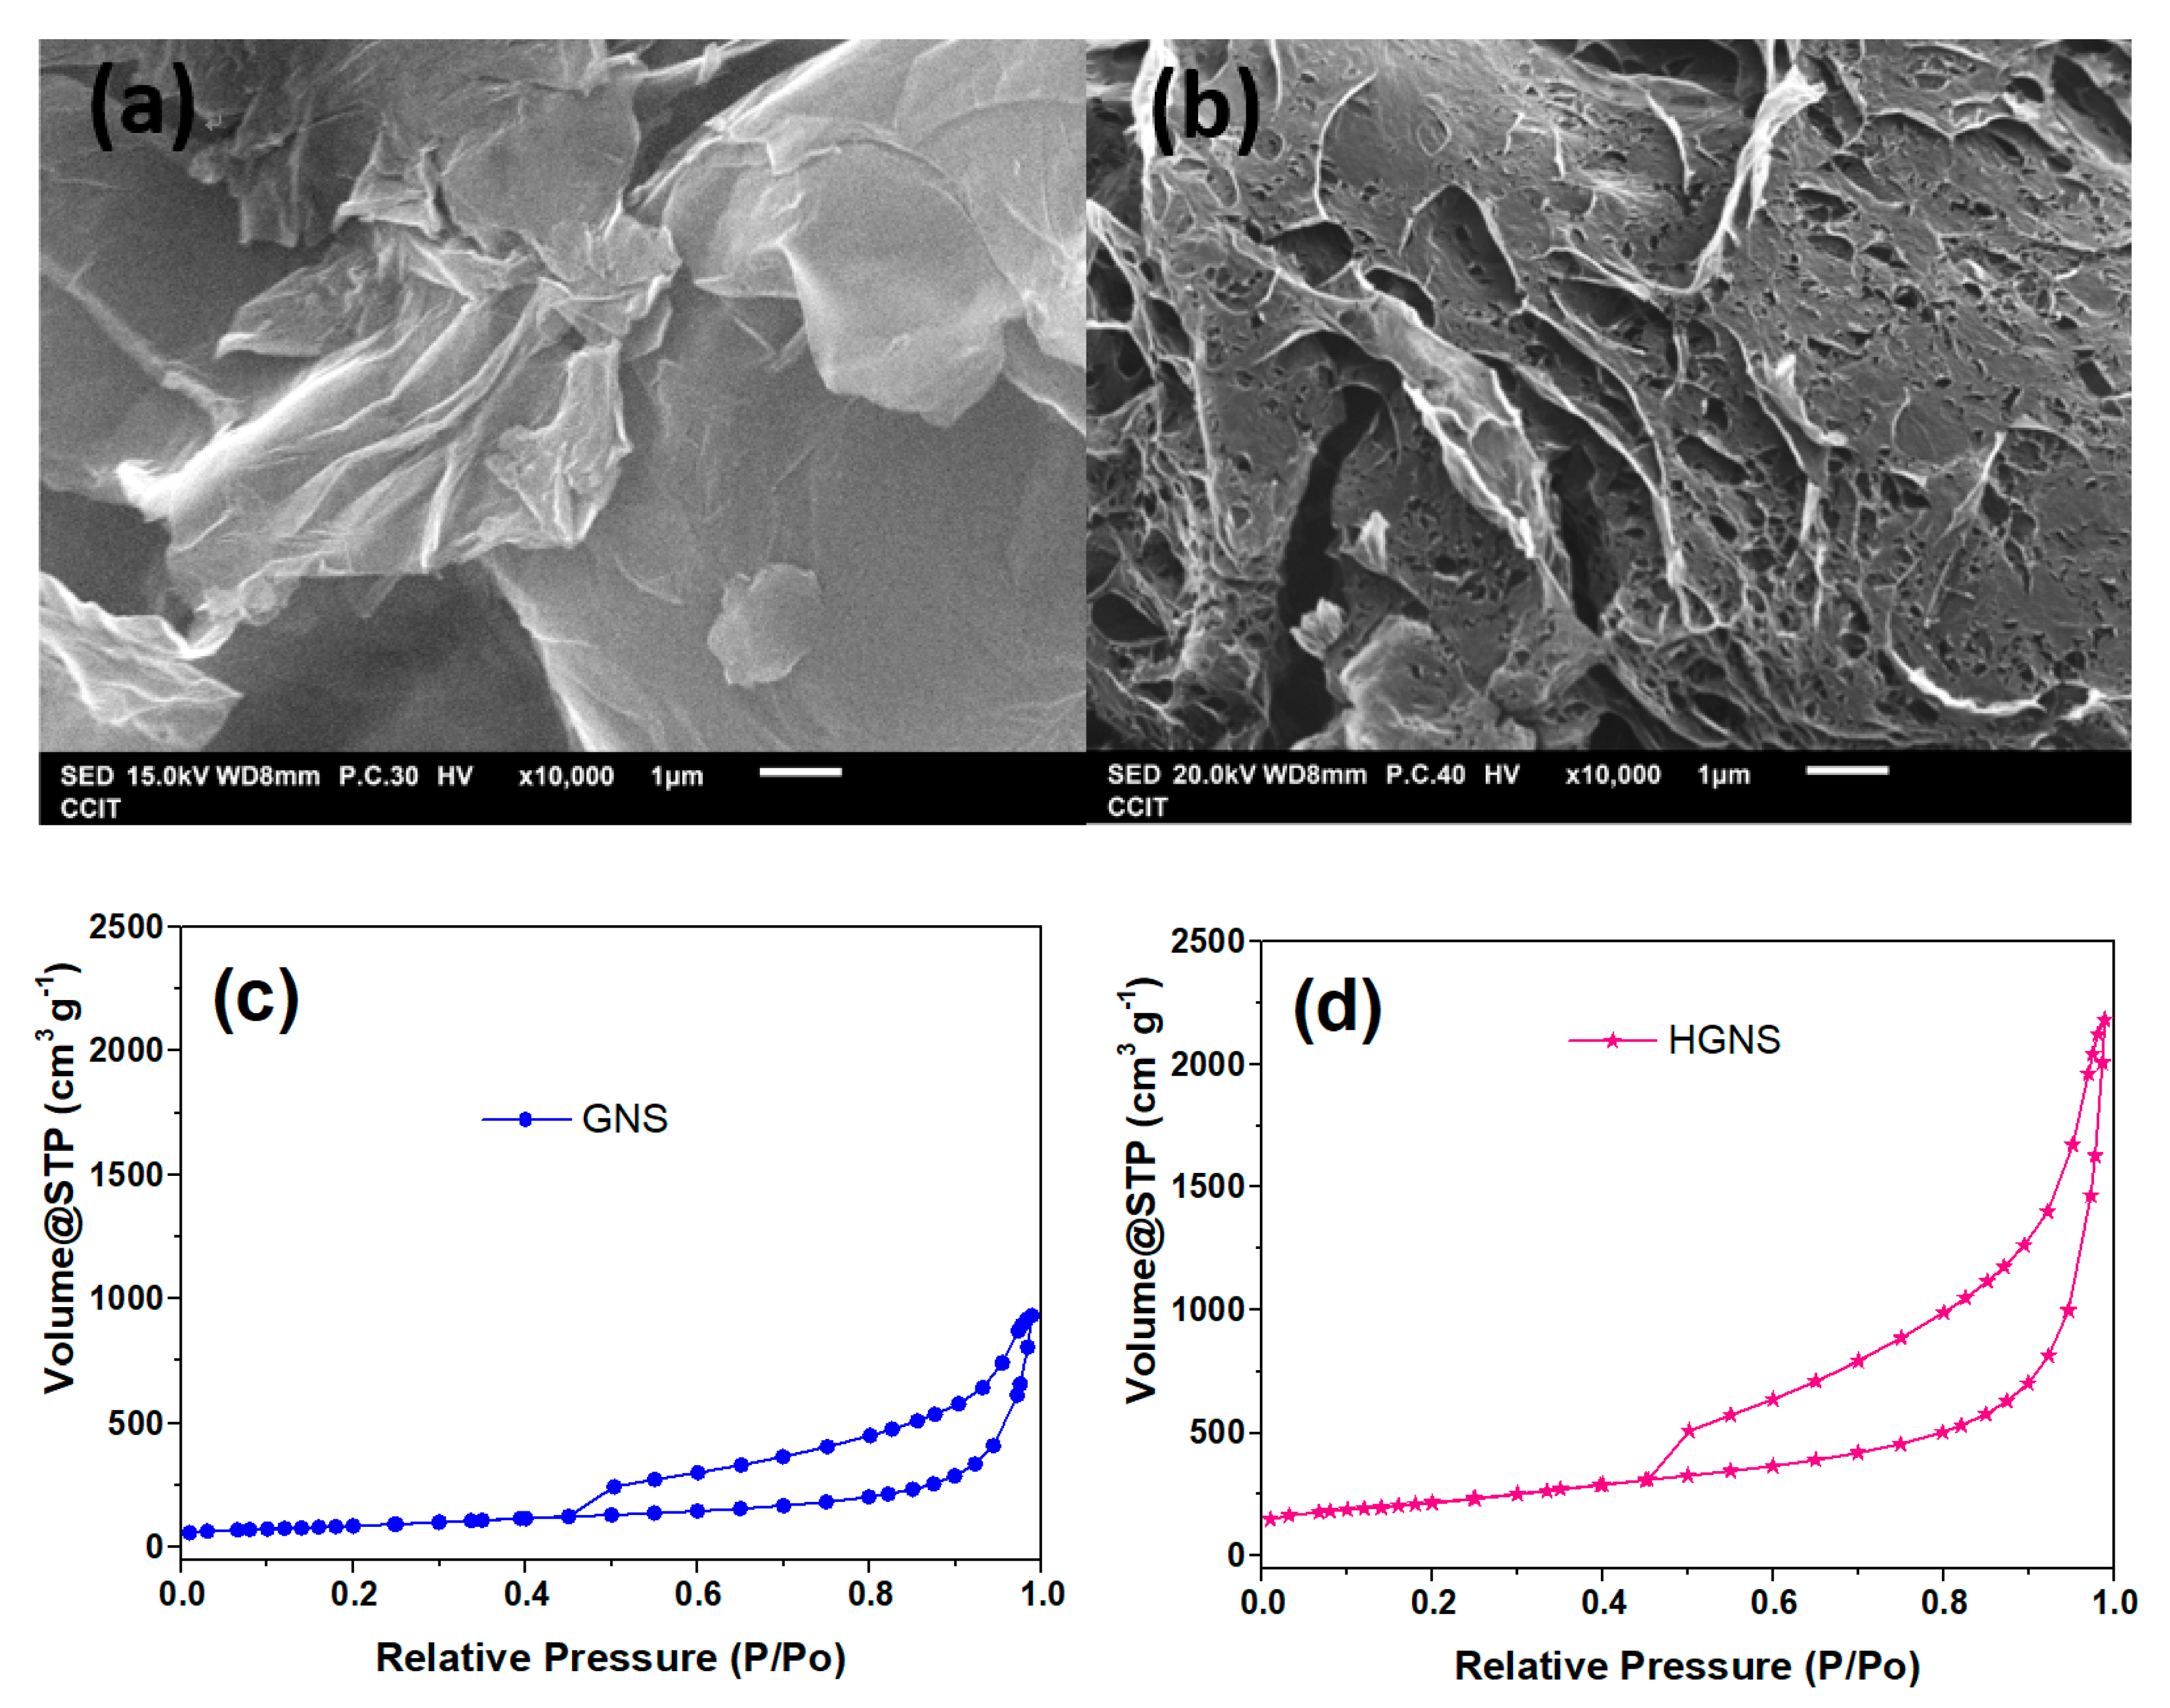
Figure 5a,b display the SEM images of GNS and HGNS, respectively, revealing the difference in their morphology. In Figure 5a, GNS, which was produced by thermal reduction/exfoliation of GO at a heating rate of 10 °C/min, exhibits a relatively flat morphology except for a few wrinkles, a typical feature of Staudenmaier GNS. As we reduced GO at an extremely high-temperature ramp rate (HGNS), a high density of holes with sizes ranging from ~5 to 300 nm appeared (see Figure 5b) and the surface significantly roughened. The mechanism for the creation of holey morphology is as follows. On GO sheets, there exist many severely oxidized regions which are mechanically weaker than other areas. When GO was heated up ultra-rapidly (about 18,000 K/min), the gas produced from the reduction reactions built up an enormous pressure, which punched the weaker spots and created a large number of through-holes.
Figure 5c,d show the nitrogen adsorption–desorption isotherm curves of GNS and HGNS, respectively. According to the IUPAC definition, both curves are type IV isotherms. In the low relative pressure range (less than 0.1), nitrogen adsorption capacity is very low, indicating a small number of micropores in both samples. At higher relative pressure (larger than 0.4), there is a clear hysteresis loop displaying the presence of abundant mesopores. These results are in agreement with those previously reported in the literature [34,35]. The values of specific surface area for holey and non-holey graphene samples calculated with the BET method were drastically different: 310 m2/g for GNS vs. 780 m2/g for HGNS. This indicates that the specific surface area of graphene is highly dependent on the heating rate, and the large number of holes created by ultra-rapid heating results in a significant increase in surface area. The measured pore volumes for GNS and HGNS were 1.4 and 3.4 cm3/g, respectively.
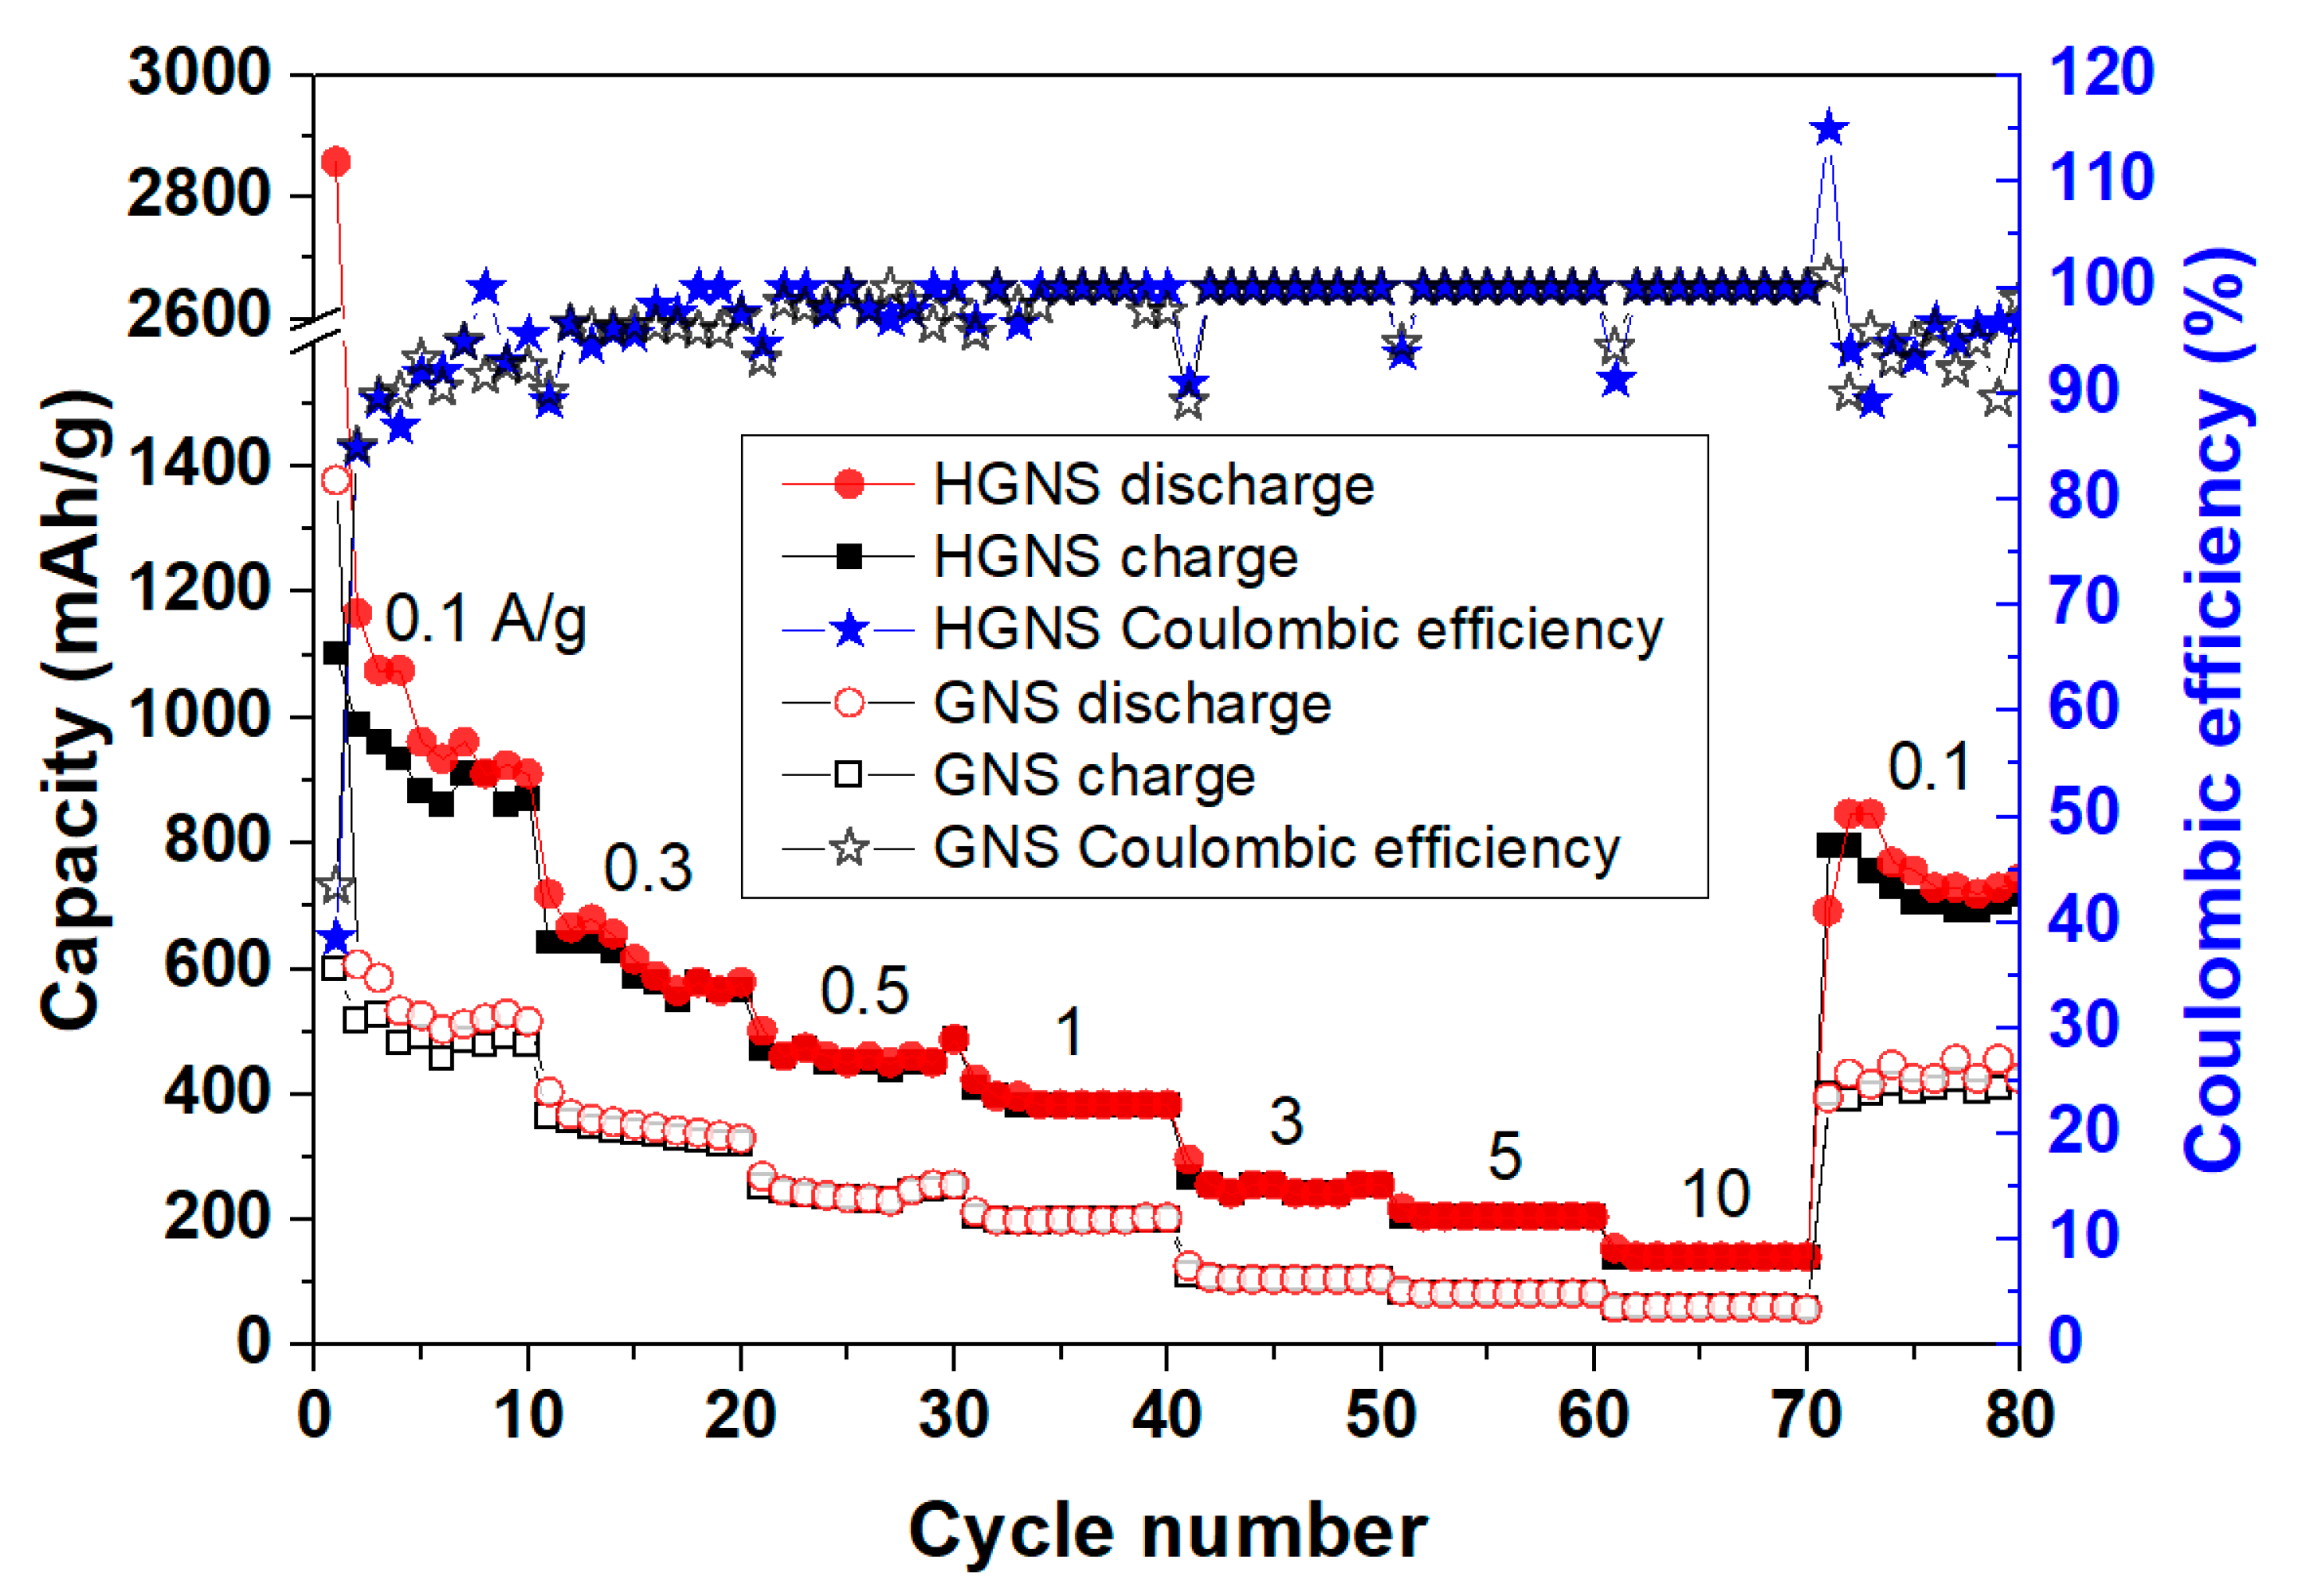
To compare the performance of the two different LIB anodes made separately of GNS and HGNS, we carried out 80 cycles of galvanostatic charge/discharge measurements at various current densities, and the measured capacity vs. cycle number curves for the two LIBs are displayed in Figure 6. The Coulombic efficiency for both samples is also shown. Both samples were first charged/discharged at a low current density of 0.1 A/g, and then every 10 cycles the current density was elevated stepwise to 0.3, 0.5, 1, 3, 5, and 10 A/g. For the last 10 cycles, the current density was brought back down to 0.1 A/g. Evidently, the results demonstrated the advantages of HGNS over GNS not only in specific capacity but also in rate capability. At any current density, the HGNS anode always shows higher capacity than the GNS counterpart. Specifically, HGNS exhibits a high capacity of 745 mAh/g at 0.1 A/g (after 80 cycles) and 141 mAh/g at a high current density of 10 A/g, which are higher than the corresponding capacity values of GNS by 75% and 130%, respectively.
The fast decay of capacity in the first cycle can be ascribed to the irreversible process of SEI formation. HGNS suffered larger capacity loss and showed slightly lower Coulombic efficiency in the 1st cycle than GNS because of its larger specific surface area, which leads to higher irreversible capacity because more SEI would form at the interface between the electrolyte and the active material [17]. Even so, HGNS still surpassed GNS considerably in all test conditions, indicating that a holey structure definitely can improve the specific capacity and the rate capability of a graphene-based LIB anode. The comparison of our electrochemical results with those previously reported for other graphene nanosheets (2-D and 3-D) is shown in Table 4. Clearly, our results here are comparable to, or in some cases even better than, these reported works.

4.2. Simulation Results

In the electrochemical measurements, clearly, the presence of holes on graphene sheets can increase the performance of rapid charge/discharge and enhance the power density, suggesting that the holes provide shortcuts for the transport of Li+ and solvent molecules. To better understand the effects of graphene’s holes on the dynamical behaviors of the ions and molecules in LIBs, MD simulation was carried out for the two aforementioned systems.
The atomic diffusion constant, D, can be obtained theoretically from the slope of the linear region on the curve of mean square displacement (MSD) versus time t:
D ~ l i m t 1 6 t | R ( t ) R   ( 0 ) | 2
where R is the atomic position, and the angle brackets denote the ensemble average. Plotted in Figure 7 are the calculated curves of MSD vs. t for lithium ions in the two systems: HGNS/electrolyte and GNS/electrolyte. The corresponding diffusion constants of Li+ obtained from the linear-region slopes of the curves are 9.98 × 10⁻⁷ and 8.62 × 10⁻⁷ cm2/s for HGNS and GNS systems, respectively. This simulation confirms that the diffusivity of lithium ions is affected by the holes in graphene.
In the HGNS system, the holey structure allows faster transport of Li ions across the planar graphene by taking the shortcuts through holes; in the GNS system, without a holey structure, the 2-D graphene sheet leads to long and winding transport paths of Li ions as well as a lower diffusion coefficient. Note that, due to the limit of our calculation capability, the lateral dimensions of both the graphene sheets and the holes in our miniature simulation systems are 2 to 3 orders of magnitude smaller than reality. Even in such a small cell, the effect of holes on Li+ diffusion is clearly demonstrated. Thus a significantly larger difference is expected in real LIBs.
Table 5 displays the diffusion coefficients for Li+ and each constituent molecule (EC, DMC, EMC, and DEC) in both the GNS and the HGNS systems. For all organic solvent molecules, the diffusion coefficients in the HGNS system are higher than those in the GNS system. In the same system, the magnitudes of diffusion constants for different solvent molecules are quite close. This indicates that the solvent molecules were mixed homogeneously in the solution. Additionally, the diffusion constants of Li ion (with much smaller size) are very similar to those of the solvents. This indicates that Li ions moved together with solvent molecules.
Furthermore, to analyze the intermolecular distance, various radial distribution functions (RDFs) were calculated. The RDFs between two kinds of atoms, i and j, are calculated as follows:
g i j ( r ) = V ( Δ N i j ( r r + Δ r ) ) 4 π r 2 Δ r N i N j
where Δ N i j ( r r + Δ r ) is the ensemble-averaged number of j around i within a spherical shell with the radius between r and r + Δr, Ni and Nj are the numbers of i and j, respectively, and V is the system volume. The lithium ions and electrolyte molecules in the radial distribution between which the intermolecular distance is small will form a compound more easily.
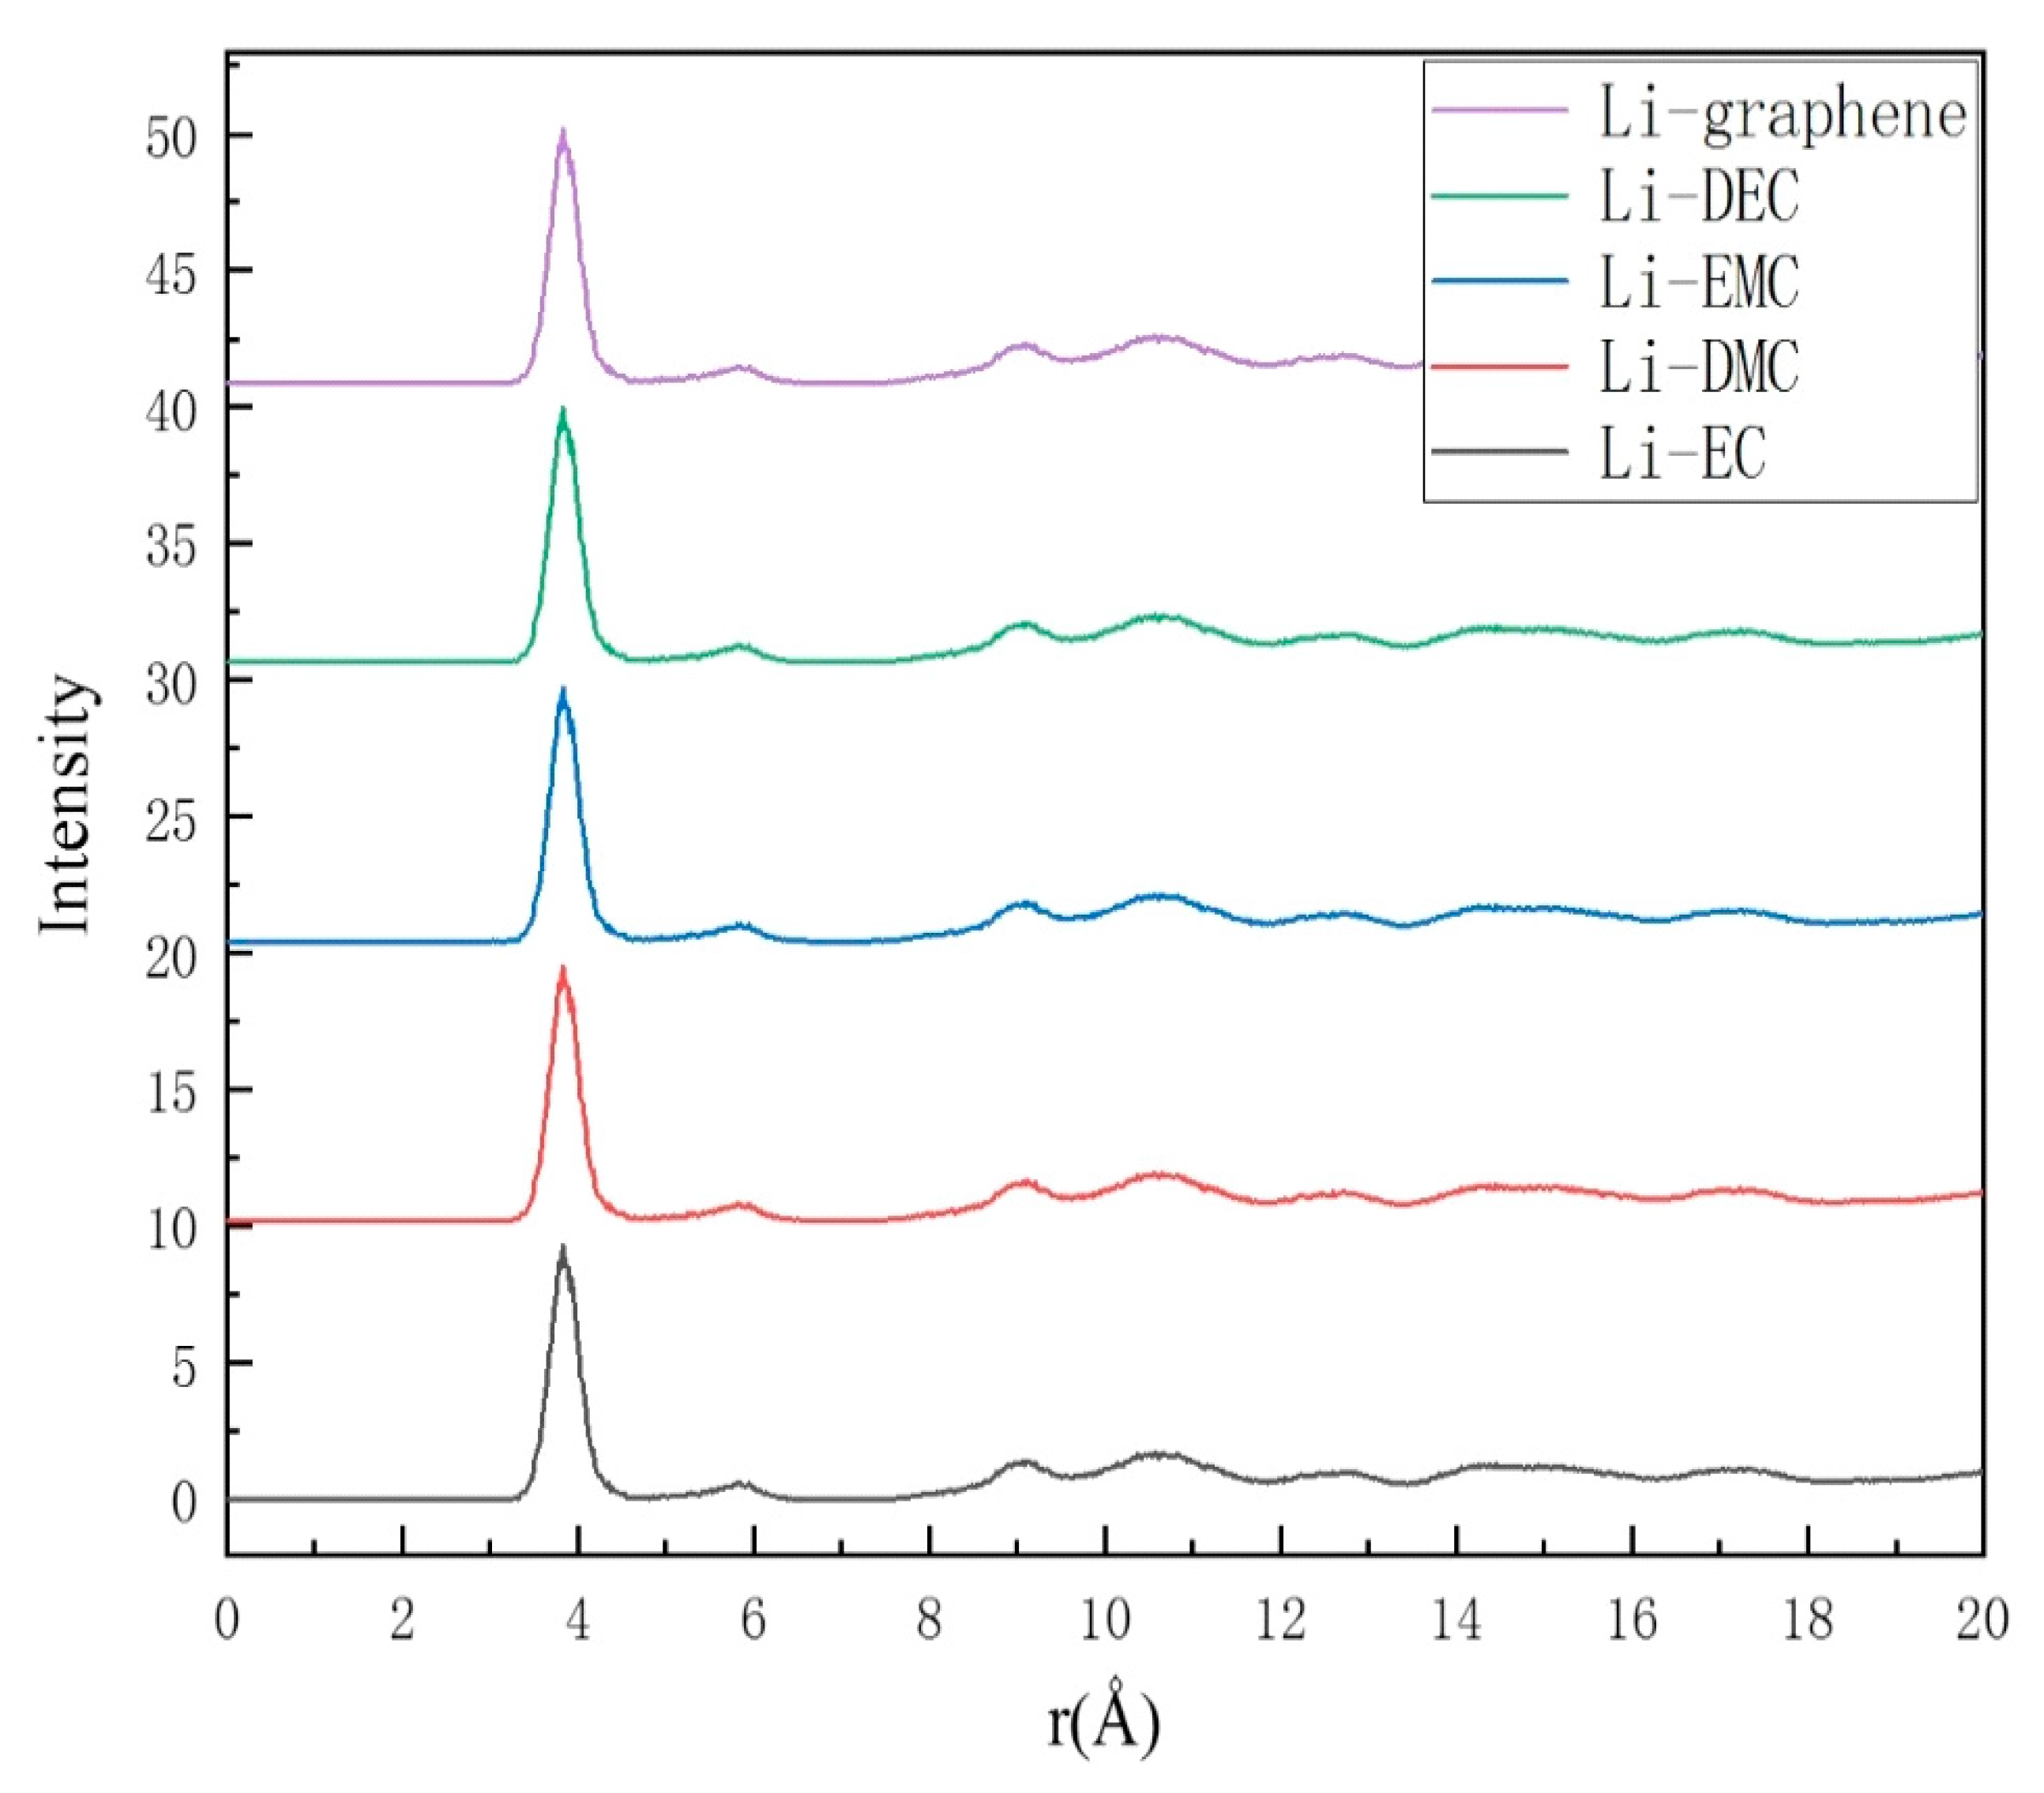
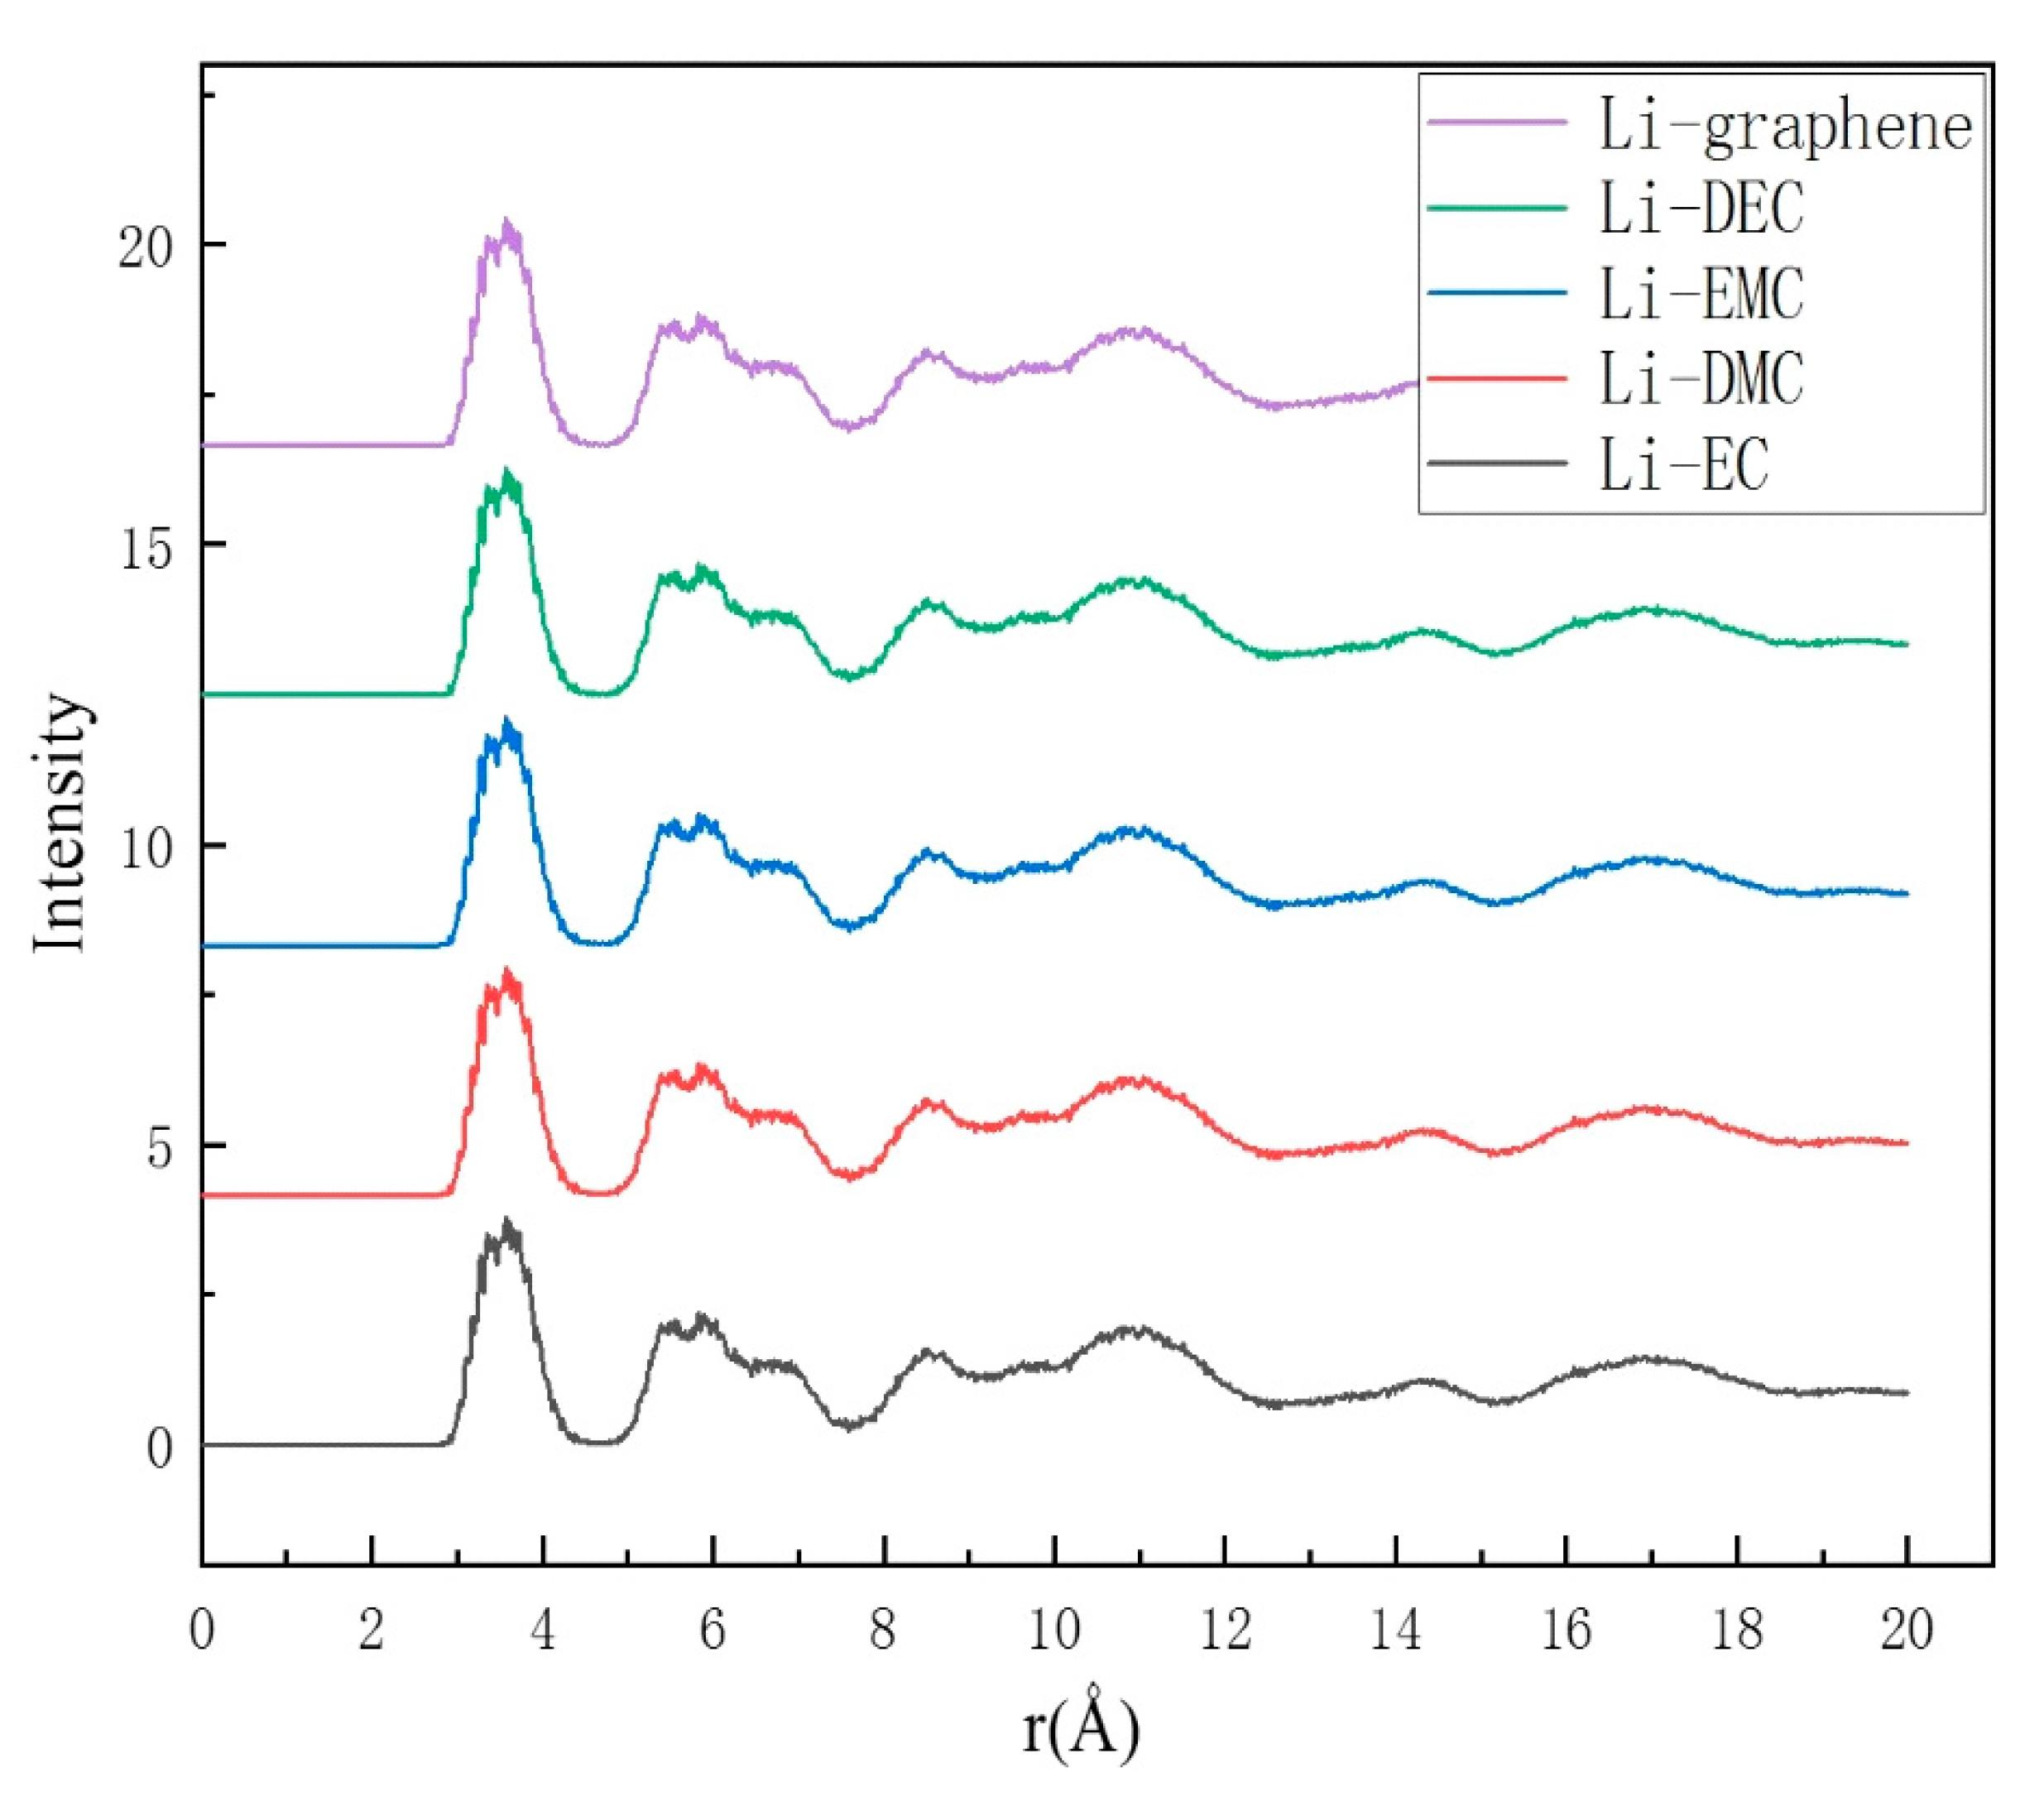
The plots of RDFs for Li-graphene and for Li/solvents in GNS and HGNS systems are shown in Figure 8 and Figure 9, respectively. There is a striking contrast between the two diagrams. In Figure 8, all RDFs exhibit a single predominant peak, located at r ~ 4 Å. However, in Figure 9, in addition to the major peak at around 3–4 Å, there are many non-negligible secondary peaks. The major peaks of RDF in the GNS systems had very narrow distributions and their intensities are about three times as high as those in the HGNS system. By contrast, the HGNS system has significantly wider RDFs.
In the GNS system, the single narrow peak indicates that these ions/molecules tend to gather at the graphene edges, rather than distribute uniformly on graphene’s surface. On the other hand, the multiple peaks and relatively broader distributions of RDF in the HGNS system suggest that the Li ions and the carbonate electrolytes are quite uniformly dispersed on the holey graphene sheets.
After some complicated redox reactions between Li ions and carbonate electrolytes, the SEI film forms on the surface of the anode [39]. In our simulations, the different distribution patterns of lithium ions and carbonate electrolytes on the HGNS and GNS suggest that a more uniform SEI film might form on the surface of HGNS. A dense and uniform SEI can inhibit the tunneling of electrons and thus avoid further reduction of the electrolyte, which is important for the stability of LIBs [40].
SEI is a multiple-component passivation layer on the anode. For Li-ion batteries, SEI is formed at the anode because the electrolytes decompose there at the operating potential during charging and form a solid layer on the surface of the active material. SEI conducts Li ions but not electrons, and is almost impenetrable to electrolyte molecules. So once an initial SEI layer has formed, its further growth is suppressed due to the impenetrability of electrolyte molecules [41,42]. The lithium-ion transportability in LIB was dependent upon the spontaneous chemical and electrochemical reactions of the SEI. However, MD simulations showed that the unimpaired structure of GNS leads to the non-ideal formation of SEI films, because Li ions and organic electrolytes tend to gather at the edge of graphene rather than disperse uniformly on the surface. A less uniform SEI film is unfavorable for Li+ conduction.
The MD simulations suggested that Li+ moved along with solvent molecules. This indicates that complexes were formed between lithium and solvent molecules. Therefore, we employed quantum chemistry (QC) calculations to evaluate the stability of forming complexes of Li+ and different solvent molecules. In QC calculations, density functional theory (DFT) was employed [43]. We adopted Becke’s three-parameter hybrid functional combined with the Lee–Yang–Parr correlation functional method (B3LYP) [44].
Figure 10 displays the optimized geometries and the corresponding electron binding energy obtained from QC calculations for the Li+(electrolyte) complexes—Li+(EC), Li+(DMC), Li+(EMC), and Li+(DEC). The binding energy is in the order EC < EMC < DEC < DMC and the values are 1.32, 1.34, 2.23, and 3.26 eV, respectively. Electron transfer to the Li+(EC) complex, which has the minimum binding energy, yields the most stable complexes. Our simulation result agrees with the experimental findings reported earlier [45,46,47].
The molecular structure of EC is a five-membered ring, but those of DMC, EMC and DEC are linear. It has been pointed out that linear carbonates have the advantages of low melting points and low viscosity, while EC provides a much higher dielectric constant. They can form homogeneous mixtures, which can possess the benefits of high dielectric constant, low viscosity (i.e., higher ion conductivity), and the melting-temperature suppression of EC [48]. In the aspect of reduction potential, the trend revealed by our QC calculation is consistent with the conclusions of Wang et al. [27], that is, the cyclic carbonate, EC, has a higher electron affinity than linear carbonates (DMC, DEC, EMC). Owing to this favorable electron transfer property of EC, in the formulae for LIB electrolyte, generally, EC is the key constituent.

5. Conclusions

The holey structure on 2-D graphene nanosheets results in shorter Li-ion transport paths in the charge/discharge processes, which significantly improves the rate capabilities of LIBs. These holes also enhance the specific capacity of LIBs because the hole edges can provide additional active sites for Li-ion storage. The HGNS anode boasts a high capacity of 745 mAh/g at 0.1 A/g (after 80 cycles) and 141 mAh/g at a high current density of 10 A/g, whereas the GNS counterpart offers only 425 and 61 mAh/g by contrast.
To reveal the mechanism for the enhancement of specific capacity and high-rate performance in the HGNS-based anodes, MD simulations were carried out to examine the lithium-ion transport in HGNS/electrolyte and GNS/electrolyte systems. The simulation confirmed that HGNS offers higher diffusion coefficients for Li ions and electrolyte molecules than GNS, which is consistent with the experimental results. Additionally, Li ions and the carbonate electrolytes are more uniformly dispersed on HGNS than on GNS. This might lead to a great difference in the formation and the uniformity of SEI films in the two systems. Additionally, QC calculations showed that Li+-EC has the lowest binding energy, which would promote the formation of a favorable SEI layer.
We have demonstrated that appropriate MD simulations can be used in combination with experiments to investigate the advantages of HGNS anodes in LIBs and to provide further insight into the ion transport and electrochemical properties.

Author Contributions

Formal analysis: Y.-R.H.; Investigation: C.-L.C., C.-H.W., N.-W.P.; Methodology: Y.-M.L.; Data curation: Y.-H.C., M.-J.Y.; Project administration: M.-D.G., N.-W.P., Y.-R.H.; Resources: M.-D.G., C.-L.C., N.-W.P., M.-J.Y.; Validation: Y.-M.L., M.-J.Y.; Writing—original draft: Y.-R.H.; N.-W.P.; Supervision: C.-L.C., M.-D.G., N.-W.P. Writing—review & editing: N.-W.P., Y.-R.H.; Conceptualization: C.-L.C.; Funding acquisition: M.-D.G., Y.-R.H, N.-W.P. All authors have read and agreed to the published version of the manuscript.

Funding

This research was funded by the Ministry of Science and Technology (MOST), Taiwan, grant numbers 107-2113-M-012-001-MY2 and 109-2221-E-155-014.

Conflicts of Interest

The authors declare no coflict of interest.

References

  1. Kaskhedikar, N.A.; Maier, J. Lithium Storage in Carbon Nanostructures. Adv. Mater. 2009, 21, 2664–2680. [Google Scholar] [CrossRef]
  2. Geim, A.K.; Novoselov, K.S. The rise of graphene. Nat. Mater. 2007, 6, 183–191. [Google Scholar] [CrossRef] [PubMed]
  3. Yoo, J.K.E.; Hosono, E.; Zhou, H.; Kudo, T.; Honma, I. Large Reversible Li Storage of Graphene Nanosheet Families for Use in Rechargeable Lithium Ion Batteries. Nano Lett. 2008, 8, 2277–2282. [Google Scholar] [CrossRef] [PubMed]
  4. Uthaisar, C.; Barone, V. Edge effects on the characteristics of Li diffusion in graphene. Nano Lett. 2010, 10, 2838–2842. [Google Scholar] [CrossRef] [PubMed]
  5. Persson, K.; Sethuraman, V.A.; Hardwick, L.J.; Hinuma, Y.; Meng, Y.S.; van der Ven, A.; Srinivasan, V.; Kostecki, R.; Ceder, G. Lithium Diffusion in Graphitic Carbon. Phys. Chem. Lett. 2010, 1, 1176–1180. [Google Scholar] [CrossRef] [Green Version]
  6. Wang, C.; Li, D.; Too, C.O.; Wallace, G.G. Electrochemical Properties of Graphene Paper Electrodes Used in Lithium Batteries. Chem. Mater. 2009, 21, 2604–2606. [Google Scholar] [CrossRef]
  7. Stoller, M.D.; Park, S.; Zhu, Y.; An, J.; Ruoff, R.S. Graphene-Based Ultracapacitors. Nano Lett. 2008, 8, 3498–3502. [Google Scholar] [CrossRef]
  8. Abouimrane, A.; Compton, O.C.; Amine, K.; Nguyen, S.T. Non-Annealed Graphene Paper as a Binder-Free Anode for Lithium-Ion Batteries. J. Phys. Chem. C 2010, 114, 12800–12804. [Google Scholar] [CrossRef]
  9. Xi, K.; Kidambi, P.R.; Chen, R.; Gao, C.; Peng, X.; Ducati, C.; Hofmann, S.; Kumar, R.V. Binder free three-dimensional sulphur/few-layer graphene foam cathode with enhanced high-rate capability for rechargeable lithium sulphur batteries. Nanoscale 2014, 6, 5746–5753. [Google Scholar] [CrossRef] [Green Version]
  10. Luo, J.; Zhao, X.; Wu, J.; Jang, H.D.; Kung, H.H.; Huang, J. Crumpled Graphene-Encapsulated Si Nanoparticles for Lithium Ion Battery Anodes. J. Phys. Chem. Lett. 2012, 3, 1824–1829. [Google Scholar] [CrossRef]
  11. Luo, J.; Jang, H.D.; Huang, J. Effect of Sheet Morphology on the Scalability of Graphene-Based Ultracapacitors. ACS Nano 2013, 7, 1464–1471. [Google Scholar] [CrossRef] [PubMed]
  12. Mao, S.; Wen, Z.; Kim, H.; Lu, G.; Hurley, P.; Chen, J. A general approach to one-pot fabrication of crumpled graphene-based nanohybrids for energy applications. ACS Nano 2012, 6, 7505–7513. [Google Scholar] [CrossRef] [PubMed]
  13. Zhang, H.; Yu, X.; Braun, P.V. Three-dimensional bicontinuous ultrafast-charge and -discharge bulk battery electrodes. Nat. Nanotechnol. 2011, 6, 277–281. [Google Scholar] [CrossRef] [PubMed]
  14. Wu, C.-H.; Pu, N.-W.; Wu, P.-J.; Peng, Y.-Y.; Shih, C.-N.; Chen, C.-Y.; Liu, Y.-M.; Ger, M.-D. Performance improvement of lithium ion batteries using magnetite–graphene nanocomposite anode materials synthesized by a microwave-assisted method. Microelectron. Eng. 2015, 138, 47–51. [Google Scholar] [CrossRef]
  15. Fan, L.; Li, X.; Yan, B.; Li, X.; Xiong, D.; Li, D.; Xu, H.; Zhang, X.; Sun, X. Amorphous SnO2/graphene aerogel nanocomposites harvesting superior anode performance for lithium energy storage. Appl. Energy 2016, 175, 529–535. [Google Scholar] [CrossRef]
  16. Peng, Y.-Y.; Liu, Y.-M.; Chang, J.-K.; Wu, C.-H.; Ger, M.-D.; Pu, N.-W.; Chang, C.-L. A facile approach to produce holey graphene and its application in supercapacitors. Carbon 2015, 81, 347–356. [Google Scholar] [CrossRef]
  17. Wu, C.-H.; Pu, N.-W.; Liu, Y.-M.; Chen, C.-Y.; Peng, Y.-Y.; Cheng, T.-Y.; Lin, M.-H.; Ger, M.-D. Improving rate capability of lithium-ion batteries using holey graphene as the anode material. J. Taiwan Inst. Chem. Eng. 2017, 80, 511–517. [Google Scholar] [CrossRef]
  18. Xu, Y.; Chen, C.Y.; Zhao, Z.; Lin, Z.; Lee, C.; Xu, X.; Wang, C.; Huang, Y.; Shakir, M.I.; Duan, X. Solution Processable Holey Graphene Oxide and Its Derived Macrostructures for High-Performance Supercapacitors. Nano Lett. 2015, 15, 4605–4610. [Google Scholar] [CrossRef]
  19. Ding, B.; Yuan, C.; Shen, L.; Xu, G.; Nie, P.; Lai, Q.; Zhang, X. Chemically tailoring the nanostructure of graphenenanosheets to confine sulfur for high-performance lithium-sulfur batteries. J. Mater. Chem. A 2013, 1, 1096–1101. [Google Scholar] [CrossRef]
  20. Sui, Z.-Y.; Meng, Q.-H.; Li, J.-T.; Zhu, J.-H.; Cui, Y.; Han, B.-H. High surface area porous carbons produced by steam activation of graphene aerogels. J. Mater. Chem. A 2014, 2, 9891–9898. [Google Scholar] [CrossRef]
  21. Vargas, O.; Caballero, A.; Morales, J.; Elia, G.A.; Scrosati, B.; Hassoun, J. Electrochemical performance of a graphene nanosheets anode in a high voltage lithium-ion cell. Phys.Chem. Chem. Phys. 2013, 15, 20444–20446. [Google Scholar] [CrossRef] [PubMed]
  22. Vargas, O.; Caballero, A.; Morales, J.; Rodríguez-Castellón, E. Contribution to the Understanding of Capacity Fading in Graphene Nanosheets Acting as an Anode in Full Li-Ion Batteries. ACS Appl. Mater. Interfaces 2014, 6, 3290–3298. [Google Scholar] [CrossRef] [PubMed]
  23. Hassoun, J.; Bonaccorso, F.; Agostini, M.; Angelucci, M.; Betti, M.G.; Cingolani, R.; Gemmi, M.; Mariani, C.; Panero, S.; Pellegrini, V.; et al. An advanced lithium-ion battery based on a graphene anode and a lithium iron phosphate cathode. Nano Lett. 2014, 14, 4901–4906. [Google Scholar] [CrossRef] [PubMed] [Green Version]
  24. Vargas, O.; Caballero, A.; Morales, J. Deficiencies of Chemically Reduced Graphene as Electrode in Full Li-Ion Cells. Electrochim. Acta 2015, 165, 365–371. [Google Scholar] [CrossRef]
  25. Aurbach, D. Review of selected electrode–solution interactions which determine the performance of Li and Li ion batteries. Power Sources 2000, 89, 206–218. [Google Scholar] [CrossRef]
  26. Tarascon, J.M.; Armand, M. Issues and challenges facing rechargeable lithium batteries. Nature 2001, 414, 359–367. [Google Scholar] [CrossRef]
  27. Wang, Y.; Balbuena, P.B. Theoretical studies on cosolvation of Li ion and solvent reductive decomposition in binary mixtures of aliphatic carbonates. Int. J. Quantum Chem. 2005, 102, 724–733. [Google Scholar] [CrossRef]
  28. Winter, M. The Solid Electrolyte Interphase—The Most Important and the Least Understood Solid Electrolyte in Rechargeable Li Batteries. Phys.Chem. 2009, 223, 1395–1406. [Google Scholar] [CrossRef]
  29. Verma, P.M.P.; Novák, P. A review of the features and analyses of the solid electrolyte interphase in Li-ion batteries Electrochim. Acta 2010, 55, 6332–6341. [Google Scholar]
  30. Schniepp, H.C.; Li, J.-L.; McAllister, M.J.; Sai, H.; Herrera-Alonso, M.; Adamson, D.H.; Prud’homme, R.K.; Car, R.; Saville, D.A.; Aksay, I.A. Functionalized Single Graphene Sheets Derived from Splitting Graphite Oxide. Phys. Chem. B 2006, 110, 8535–8538. [Google Scholar] [CrossRef] [Green Version]
  31. Huang, Y.R.; Chen, C.L.; Tseng, Y.H.; Chien, C.T.C.; Liu, C.W.; Tai, C.C.; Liu, M.H. Graphene Wrinkles affect electronic transport in nanocomposites: Insight from molecular dynamics simulations. J. Mol. Graph. Model. 2019, 92, 236–242. [Google Scholar] [CrossRef] [PubMed]
  32. Huang, Y.-R.; Chuang, P.-H.; Chen, C.-L. Molecular-dynamics calculation of the thermal conduction in phase change materials of graphene paraffin nanocomposites. Int. J. Heat Mass Transf. 2015, 91, 45–51. [Google Scholar] [CrossRef]
  33. Rappi, A.K.; Casewit, C.J.; Colwell, K.S.; Goddard, W.A.; Skiff, W.M. UFF, a Full Periodic Table Force Field for Molecular Mechanics and Molecular Dynamics Simulations. Am. Chem. Soc. 1992, 114, 10024–10035. [Google Scholar] [CrossRef]
  34. Ma, L.-P.; Wu, Z.-S.; Li, J.; Wu, E.-D.; Ren, W.-C.; Cheng, H.-M. Hydrogen adsorption behavior of graphene above critical temperature. Int. J. Hydrog. Energy 2009, 34, 2329–2332. [Google Scholar] [CrossRef]
  35. Huang, C.C.; Pu, N.W.; Wang, C.A.; Huang, J.; Sung, Y.; Ger, M.D. Hydrogen storage in graphene decorated with Pd and Pt nano-particles using an electroless deposition technique. Sep. Purif. Technol. 2011, 82, 210–215. [Google Scholar] [CrossRef]
  36. Tao, H.-C.; Fan, L.-Z.; Yang, X.; Qu, X. In situ synthesis of TiO2-graphene nanosheets composites as anode materials for high-power lithium ion batteries. Electrochim. Acta 2012, 69, 328–333. [Google Scholar] [CrossRef]
  37. Xiang, H.F.; Li, Z.D.; Xie, K.; Jiang, J.Z.; Chen, J.J.; Lian, P.C.; Wu, J.S.; Wang, H.H. Graphene sheets as anode materials for Li-ion batteries: Preparation, structure, electrochemical properties and mechanism for lithium storage. RSC Adv. 2012, 2, 6792–6799. [Google Scholar] [CrossRef]
  38. Pan, D.; Wang, S.; Zhao, B.; Wu, M.; Zhang, H.; Wang, Y.; Jiao, Z. Li storage properties of disordered graphene nanosheets. Chem. Mater. 2009, 21, 3136–3142. [Google Scholar] [CrossRef]
  39. Cheng, X.-B.; Yan, C.; Zhang, X.-Q.; Liu, H.; Zhang, Q. Electronic and Ionic Channels in Working Interfaces of Lithium Metal Anodes. ACS Energy Lett. 2018, 3, 1564–1570. [Google Scholar] [CrossRef]
  40. Wang, A.; Kadam, S.; Li, H.; Shi, S.; Qi, Y. Review on modeling of the anode solid electrolyte interphase (SEI) for lithium-ion batteries. Npj Comput. Mater. 2018, 4, 1–26. [Google Scholar] [CrossRef] [Green Version]
  41. Cheng, X.-B.; Zhao, C.-Z.; Yao, Y.-X.; Liu, H.; Zhang, Q. Recent Advances in Energy Chemistry between Solid-State Electrolyte and Safe Lithium-Metal Anodes. Chem 2019, 5, 74–96. [Google Scholar] [CrossRef] [Green Version]
  42. Single, B.H.F.; Latza, A. Revealing SEI Morphology: In-Depth Analysis of a Modeling Approach. J. Electrochem. Soc. 2017, 164, E3132–E3145. [Google Scholar] [CrossRef] [Green Version]
  43. Parr, R.G. Density Functional Theory. Annu. Rev. Phys. Chem. 1983, 34, 631–656. [Google Scholar] [CrossRef]
  44. Peter, M.W.; Gill, B.G.J. The performance of the Becke-Lee-Yang-Parr (B-LYP) density functional theory with various basis sets. Chem. Phys. Lett. 1992, 197, 499–505. [Google Scholar]
  45. Jeong, S.-K.; Inaba, M.; Iriyama, Y.; Abe, T.; Ogumi, Z. Surface film formation on a graphite negative electrode in lithium-ion batteries: AFM study on the effects of co-solvents in ethylene carbonate-based solutions. Electrochim. Acta 2002, 47, 1975–1982. [Google Scholar] [CrossRef]
  46. Borodin, O.; Ren, X.; Vatamanu, J.; von Wald Cresce, A.; Knap, J.; Xu, K. Modeling Insight into Battery Electrolyte Electrochemical Stability and Interfacial Structure. Acc. Chem. Res. 2017, 50, 2886–2894. [Google Scholar] [CrossRef]
  47. Gomes-Ballesteros, J.J.; Balbuena, P.B. Reduction of Electrolyte Components on a Coated Si Anode of Lithium-Ion Batteries. Phys. Chem. Lett. 2017, 8, 3404–3408. [Google Scholar] [CrossRef]
  48. Xu, K. Nonaqueous Liquid Electrolytes for Lithium-Based Rechargeable Batteries. Chem. Rev. 2004, 104, 4303–4417. [Google Scholar] [CrossRef]
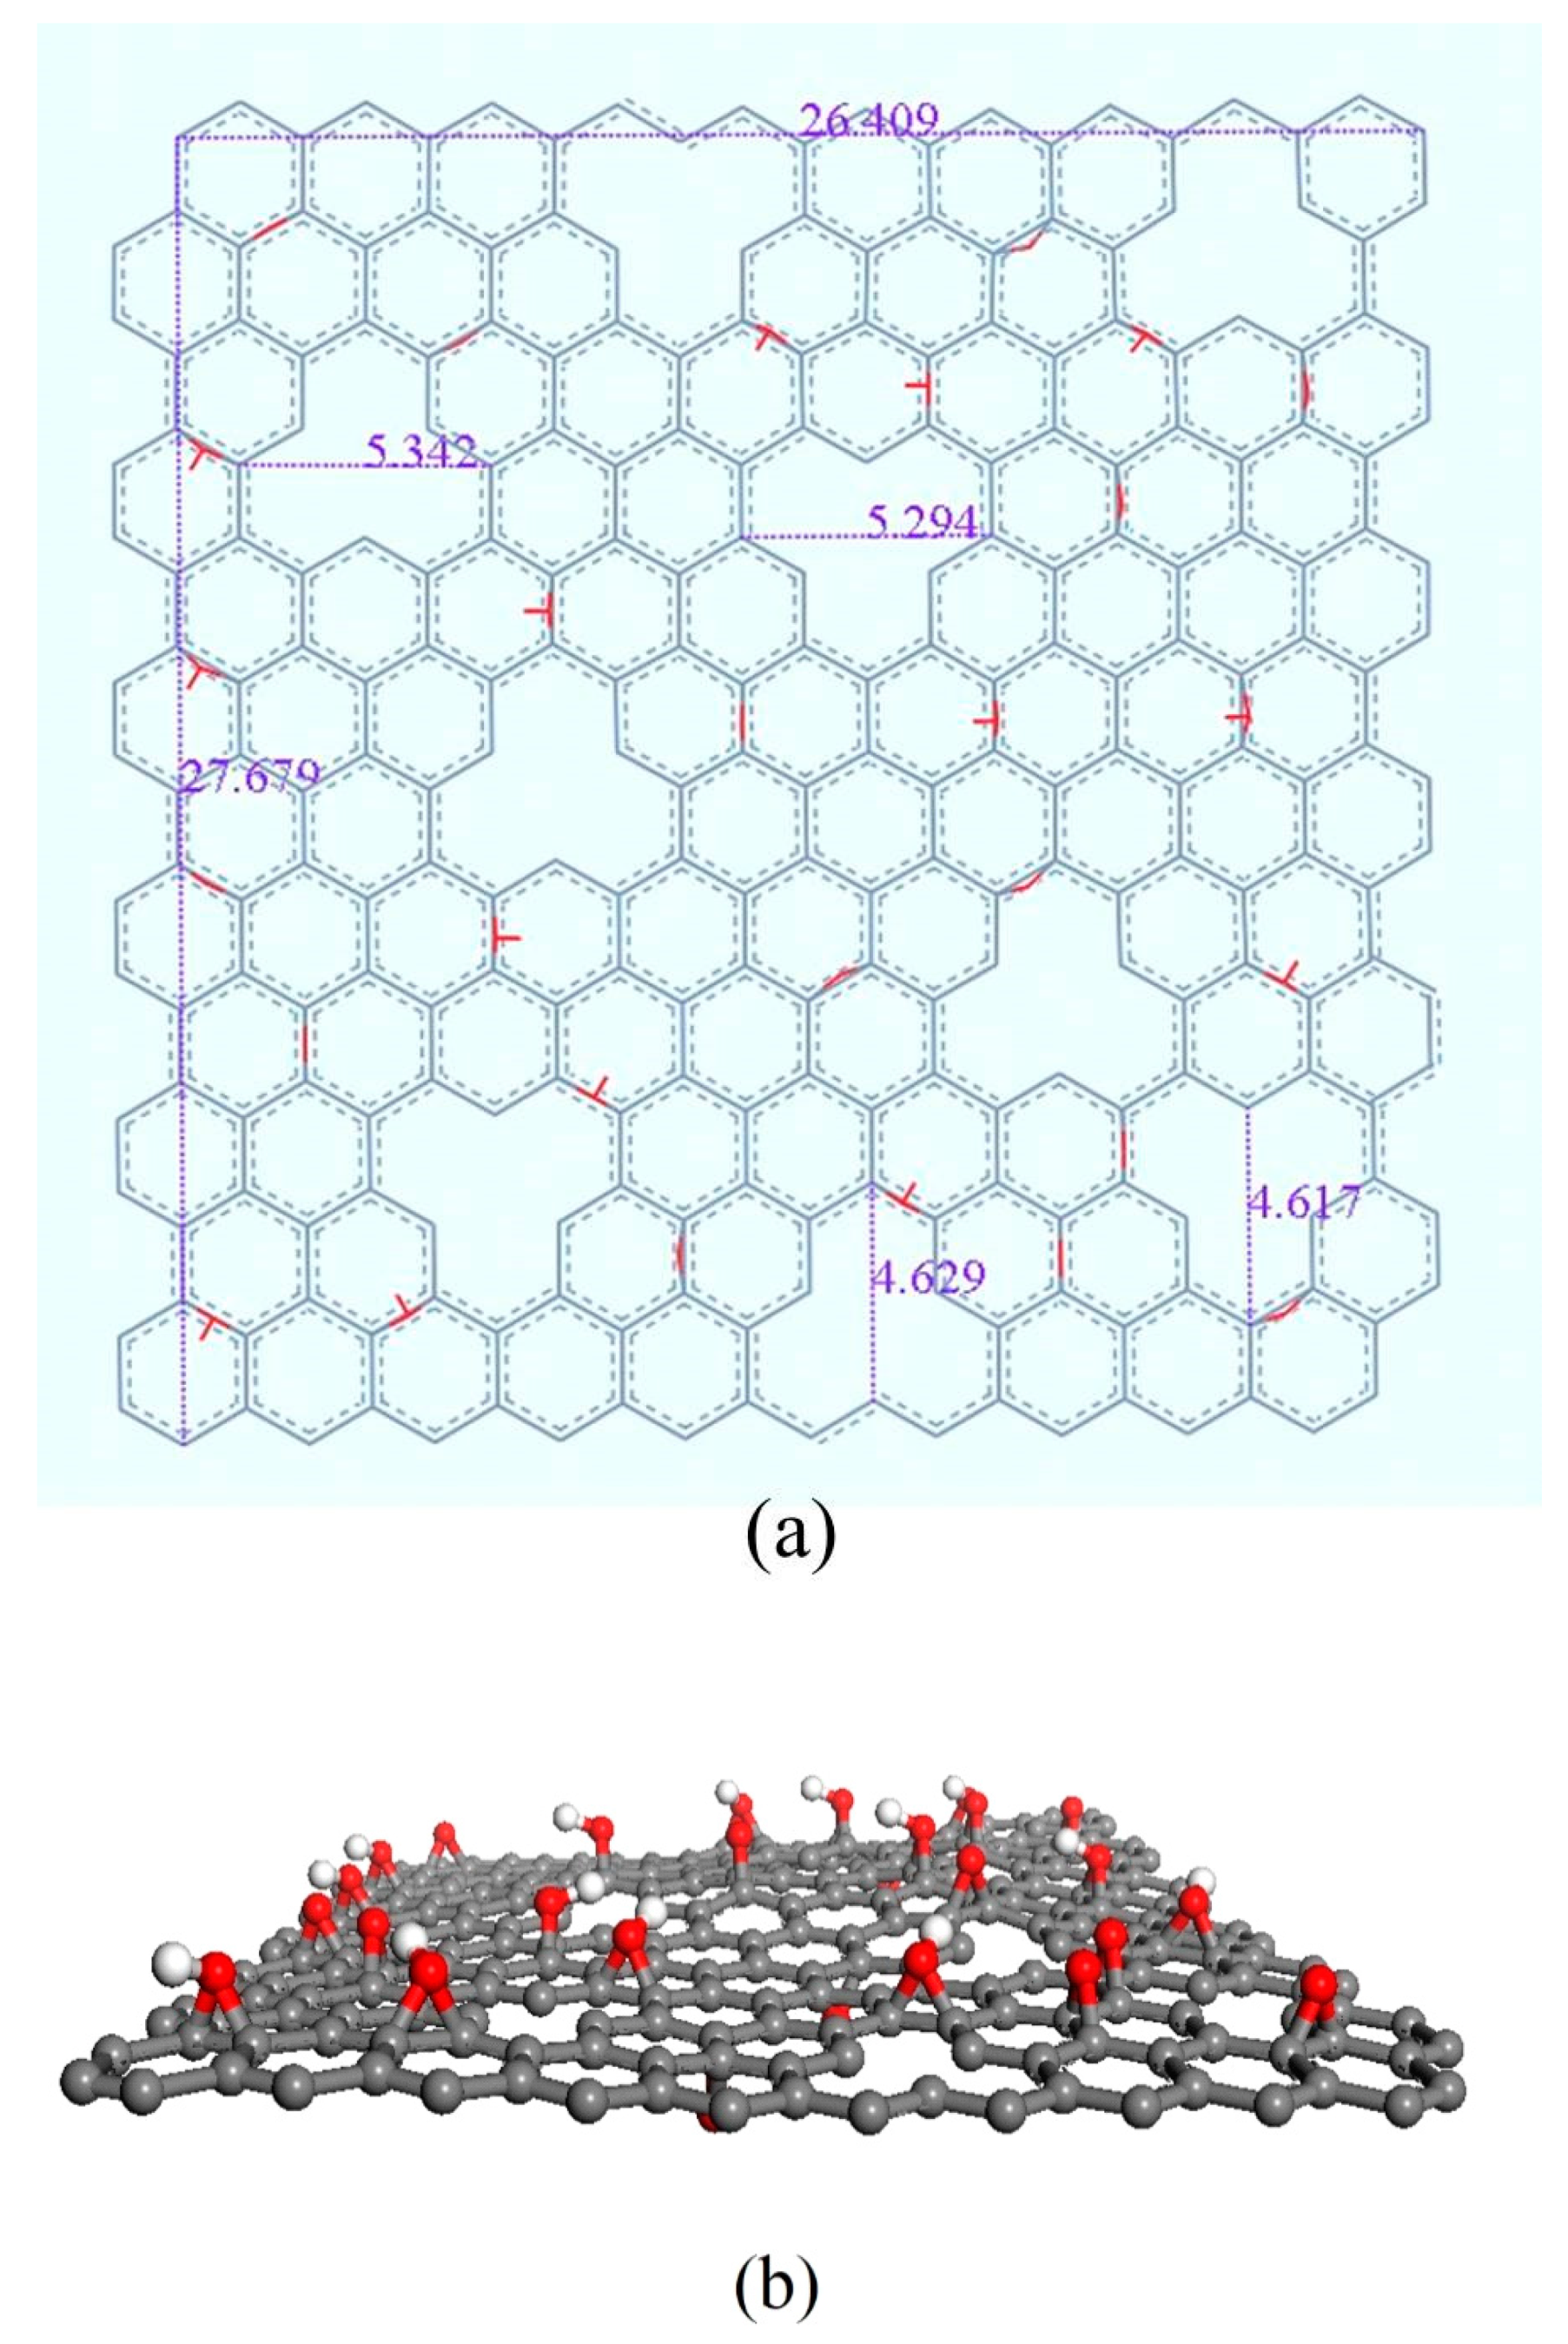
Figure 1. (a) Dimensions (in Å) of the constructed holey graphene (HGNS). (b) Tilted view of HGNS revealing the epoxy and hydroxyl groups. The red and white colors are for O and H atoms, respectively.
Crystals 10 01063 g001
Figure 2. Snapshot of the initial simulation box for the HGNS/electrolyte system.
Crystals 10 01063 g002
Figure 3. Snapshot of the HGNS/electrolyte system for the final-size box in thermal equilibrium.
Crystals 10 01063 g003
Figure 4. (a) X-ray diffractometry (XRD) results for graphene oxide (GO), non-holey graphene (GNS) and HGNS. (b) Raman spectra for GNS and HGNS.
Crystals 10 01063 g004
Figure 5. SEM images of (a) GNS and (b) HGNS; and nitrogen adsorption–desorption isotherm curves of (c) GNS and (d) HGNS.
Crystals 10 01063 g005
Figure 6. Rate capability, Coulombic efficiency, and cycle performance of GNS and HGNS at various current densities from 0.1 to 10 A/g.
Crystals 10 01063 g006
Figure 7. Mean square displacement (MSD) vs. t for lithium ions in the two different systems.
Crystals 10 01063 g007
Figure 8. Radial distribution functions (RDFs) of Li ions and carbonate electrolytes in the GNS system.
Crystals 10 01063 g008
Figure 9. RDFs of Li ions and carbonate electrolytes in the HGNS system.
Crystals 10 01063 g009
Figure 10. Optimized geometries of the neutral and reduced Li+-solvent complexes from B3LYP QC calculations. The binding energy of Li+ with (a) ethylene carbonate (EC), (b) dimethyl carbonate (DMC), (c) ethyl methyl carbonate (EMC), and (d) Diethyl carbonate (DEC) are given vs. Li/Li+.
Crystals 10 01063 g010
Table 1. Chemical structures and properties of the cyclic and linear carbonate solvents.
EC
Ethylene Carbonate
DMC
Dimethyl Carbonate
EMC
Ethyl methyl Carbonate
DEC
Diethyl Carbonate
Molecular formulaC3H4O3C3H6O3C4H8O3C5H10O3
Structural formula Crystals 10 01063 i001 Crystals 10 01063 i002 Crystals 10 01063 i003 Crystals 10 01063 i004
Molecular weight88.0690.08104.11118.13
Density1.32 g/cm31.069 g/cm31.012 g/cm30.975 g/cm3
Viscosity1.85 cP0.585 cP0.65 cP0.748 cP
Boiling point243 °C90.5 °C107.5 °C126 °C
Melting point38 °C3 °C−14 °C−43 °C
Table 2. Simulation conditions of the two systems.
ComponentSystem 1System 2
GNS50
HGNS05
LiPF62020
EC360360
DMC4848
EMC4040
DEC132132
Table 3. EA anlysis of GO, GNS and HGNS samples.
SampleC (at.%)O (at.%)C/O (at.%)
GO62381.6
GNS98.31.758
HGNS99.10.9110
Table 4. Comparison of graphene anodes in lithium ion batteries.
MaterialsSignificant Findings ObservedRefs.
Holey graphene (HGNS); pristine graphene (GNS)The HGNS anode exhibits a high specific capacity of 745 mAh/g at 0.1 A/g (after 80 cycles) and 141 mAh/g at a large current of 10 A/g (after 70 cycles), which are higher than the capacity values of the GNS counterpart by 75% and 130%, respectively.This work
TiO2/GNS composite; GNSThe TiO2/GNS composite anode exhibits a specific capacity of ~170 mAh/g at 0.1 A/g (after 100 cycles) and ~70 mAh/g at a large current of 5 A/g (after 100 cycles).
The GNS anode exhibits a specific capacity of ~78 mAh/g at 0.1 A/g (after 100 cycles) and ~20 mAh/g at a large current of 5 A/g (after 100 cycles).
[36]
GNS reduced from high-grade GO at 1050 °C;
GNS reduced from medium-grade GO 1050 °C
The GNS reduced from high-grade GO has a specific surface area of 493 m2/g, and exhibits a reversible specific capacity of 835 mA/g at 0.05 A/g (1st cycle), which drops to ~700 mAh/g after 15 cycles.
The GNS reduced from medium-grade GO has a specific surface area of 121m2/g, and exhibits a reversible specific capacity of 438 mAh/g at 0.05 A/g (1st cycle), which drops to ~320 mAh/g after 15 cycles.
[37]
Hydrazine reduced GNS; Electron-beam reduced GNSThe hydrazine reduced GNS anode exhibits a reversible capacity of ~330 mAh/g at 0.05 A/g (1st cycle).
The e-beam reduce GNS anode exhibits reversible capacity of ~1054 mAh/g at 0.05 A/g (1st cycle), which drops to 784 mAh/g after 15 cycles.
[38]
GNS;
GNS+CNT;
GNS+C60
The reversible capacity at a current density of 0.05 A/g is 540, 730, and 784 mAh/g for GNS, GNS+CNT, and GNS+C60, respectively. However, the reversible capacity after 20 cycles decays to 290,480, and 600 mAh/g for GNS, GNS+CNT, and GNS+ C60, respectively.[3]
a-SnO2/graphene aerogelThe a-SnO2/graphene aerogel delivers a capacity of 700 mAh/g in 80th cycle at a current density of 0.1 A/g. At a larger current density of 1.6 A/g, it drops to 269 mAh/g (50th cycle).[15]
AGN/S composite (3D porous network of activated graphene confining sulfur)At rates of 0.5 C and 1 C, the composite electrode delivered high specific capacities of 1143 mAh/g and 927 mAh/g, respectively. After 100 cycles, the capacity decays to 766 and 686 mAh/g, respectively.[19]
Table 5. Diffusion coefficients (in cm2/s) of Li+ and solvent molecules in the two systems.
Li+ECDMCEMCDEC
GNS8.62 × 10−78.61 × 10−78.62 × 10−78.41 × 10−78.33 × 10−7
HGNS9.98 × 10−79.96 × 10−79.93 × 10−79.96 × 10−79.96 × 10−7
Publisher’s Note: MDPI stays neutral with regard to jurisdictional claims in published maps and institutional affiliations.