Article

Synthesis and Visualization of a Novel Fluorescent-Tagged Polymeric Antiscalant during Gypsum Crystallization in Combination with Bisphosphonate Fluorophore

1
JSC “Fine Chemicals R&D Centre”, Krasnobogatyrskaya, str. 42, b 1, 107258 Moscow, Russia
2
Department of Chemistry and Technology of Biomedical Pharmaceuticals, Mendeleev University of Chemical Technology of Russia, Miusskaya sq. 9, 125047 Moscow, Russia
3
Department of Water Supply and Sanitation, Moscow State University of Civil Engineering, Yaroslavskoe shosse, 26, 129337 Moscow, Russia
4
Prokhorov General Physics Institute of the Russian Academy of Sciences, Vavilov str., 38, 119991 Moscow, Russia
*
Authors to whom correspondence should be addressed.
Crystals 2020, 10(11), 992; https://doi.org/10.3390/cryst10110992
Submission received: 12 September 2020 / Revised: 19 October 2020 / Accepted: 28 October 2020 / Published: 1 November 2020
(This article belongs to the Section Industrial Crystallization)

Abstract

:
An attempt to reveal the mechanisms of scale inhibition with the use of two different fluorescent-tagged antiscalants at once is undertaken. To reach the goal, a novel 1,8-naphthalimide-tagged polyacrylate (PAA-F2) is synthesized and tested separately and jointly with 1,8-naphthalimide-tagged bisphosphonate (HEDP-F) as a gypsum scale inhibitor within the frames of NACE Standard TM0374-2007. Here, it is found that at a dosage of 10 mg·dm−3 it provides a much higher inhibition efficiency (96%) than HEDP-F (32%). A PAA-F2 and HEDP-F blend (1:1 mass) has an intermediate efficacy (66%) and exhibits no synergism relative to its individual components. The visualization of PAA-F2 revealed a paradoxical effect: an antiscalant causes modification of the CaSO4·2H2O crystals habit, but does not interact with them, forming particles of its own solid complex [Ca-PAA-F2]. This paradox is interpreted in terms of the “nano/microdust” concept, prioritizing the bulk heterogeneous nucleation step, while an ability of the scale inhibitor to block the nucleus growth at the next steps is proven to be of secondary importance. At the same time, HEDP-F does not change the gypsum crystals morphology, although this antiscalant is completely located on the surface of the scale phase. The PAA-F2 and HEDP-F blend revealed an accumulation of both antiscalants in their own [Ca-PAA-F2/Ca-HEDP-F] phase with some traces of HEDP-F and PAA-F2 on the CaSO4·2H2O crystals surface. Thus, the visualization of two different antiscalants separately and jointly applied to gypsum deposition demonstrates differences in phosphonic and polymeric inhibitors location, and a lack of causal relationship between antiscalant efficiency and scale particle habit modification. Finally, it is shown that the confocal microscopy of several fluorescent antiscalant blends is capable of providing unique information on their interrelationships during scale deposition.

Graphical Abstract

1. Introduction

A broad spectrum of antiscalants has recently been applied in power plants, boilers, cooling water facilities, evaporation plants, oilfields, reverse osmosis (RO) desalination plants, and other water treatment installations in order to mitigate scale deposition [1,2,3,4]. Among these, such threshold agents as phosphates, phosphonates, and polycarboxylates are the most efficient. An addition of less than stoichiometric quantities of certain antiscalants to supersaturated solutions of sparingly soluble salts (calcite, CaCO3; gypsum, CaSO4·2H2O; barite, BaSO4, etc.), postpones their precipitation for substantial periods of time. This retardation of scaling appears to be highly beneficial economically for numerous industrial applications. Some recent publications report on the synergism of some antiscalant blends [5,6,7,8]. Notably, such a synergism is found rather for phosphonate/polyacrylate mixtures, but not for combinations of different phosphonates or different polyacrylates. However, none of the known inhibition mechanisms explain this effect, and the studies of different blends are recently performed on the empirical level.
Meanwhile, the recent reports on the fluorescent-tagged antiscalants [9,10,11,12] exhibit clearly a unique ability of these reagents to put light onto the mechanisms of scale inhibition. Indeed, already the first results of fluorescent antiscalants visualization during gypsum scale formation exceeded all expectations. Our group managed to localize the antiscalant, and demonstrated, that both in static and dynamic experiments it is found far from the expected positions. Thus, a nonconventional mechanism of scale inhibition was proposed [9,10,12]. In this relevance, it was reasonable to try the same approach operating a blend of two different fluorescent antiscalants.
However, both fluorescent antiscalants available to us (HEDP-F and PAA-F1), as shown in Figure 1a,b, are bearing the same fluorophore fragment. Therefore, they provide fluorescence in the same spectral range and appear to be indistinguishable. Thus, to reach the goal, a new fluorescent-tagged polyacrylate was synthesized and characterized: (E)-5-allyl-9-(4-(dimethylamino)styryl)-8,8- dimethylbenzo[de]pyrrolo [2,3-g]isoquinoline-4,6(5H,8H)-dione (PAA-F2) (Figure 1c).
The gypsum scale was taken as a model of a sparingly soluble salt due to (i) its importance for the RO and other water treatment technologies [13,14]; (ii) absence of pH dependencies; (iii) its easily detectable crystal shapes; and (iv) the nucleation of gypsum having been investigated extensively [15,16,17,18,19]. HEDP-F was deliberately chosen for blending with PAA-F2 for two reasons: (i) It represents a different class of antiscalants (phosphonates); and (ii) its visualization during gypsum crystals growth was already studied [9,10,12]. As far as we know, this is the first attempt worldwide to visualize both components of antiscalants blend within the scale formation process.

2. Materials and Methods

2.1. Reagents

Reagents, such as allylamine, acrylic acid (AA), 4-chlorine-1,8-naphtalic acid anhydride, ammonium persulfate, ethanol, and acetone of AR grade were obtained from Sigma-Aldrich (Darmstadt, Germany) and EKOS-1 (Moscow, Russia). Distilled water was used for the PAA-F2 synthesis. HEDP-F was synthesized as described elsewhere [9]. For brine preparations, the analytical grade chemicals were used. Stock solutions of calcium chloride and disodium sulfate were prepared from the respective crystalline solids (Sigma-Aldrich, Darmstadt, Germany, EKOS-1, Moscow, Russia) and deionized water, filtered through a 0.2 µM hydrophilic polytetrafluorethylene (PTFE) Millipore Millex-LG membrane (Merck, Darmstadt, Germany).

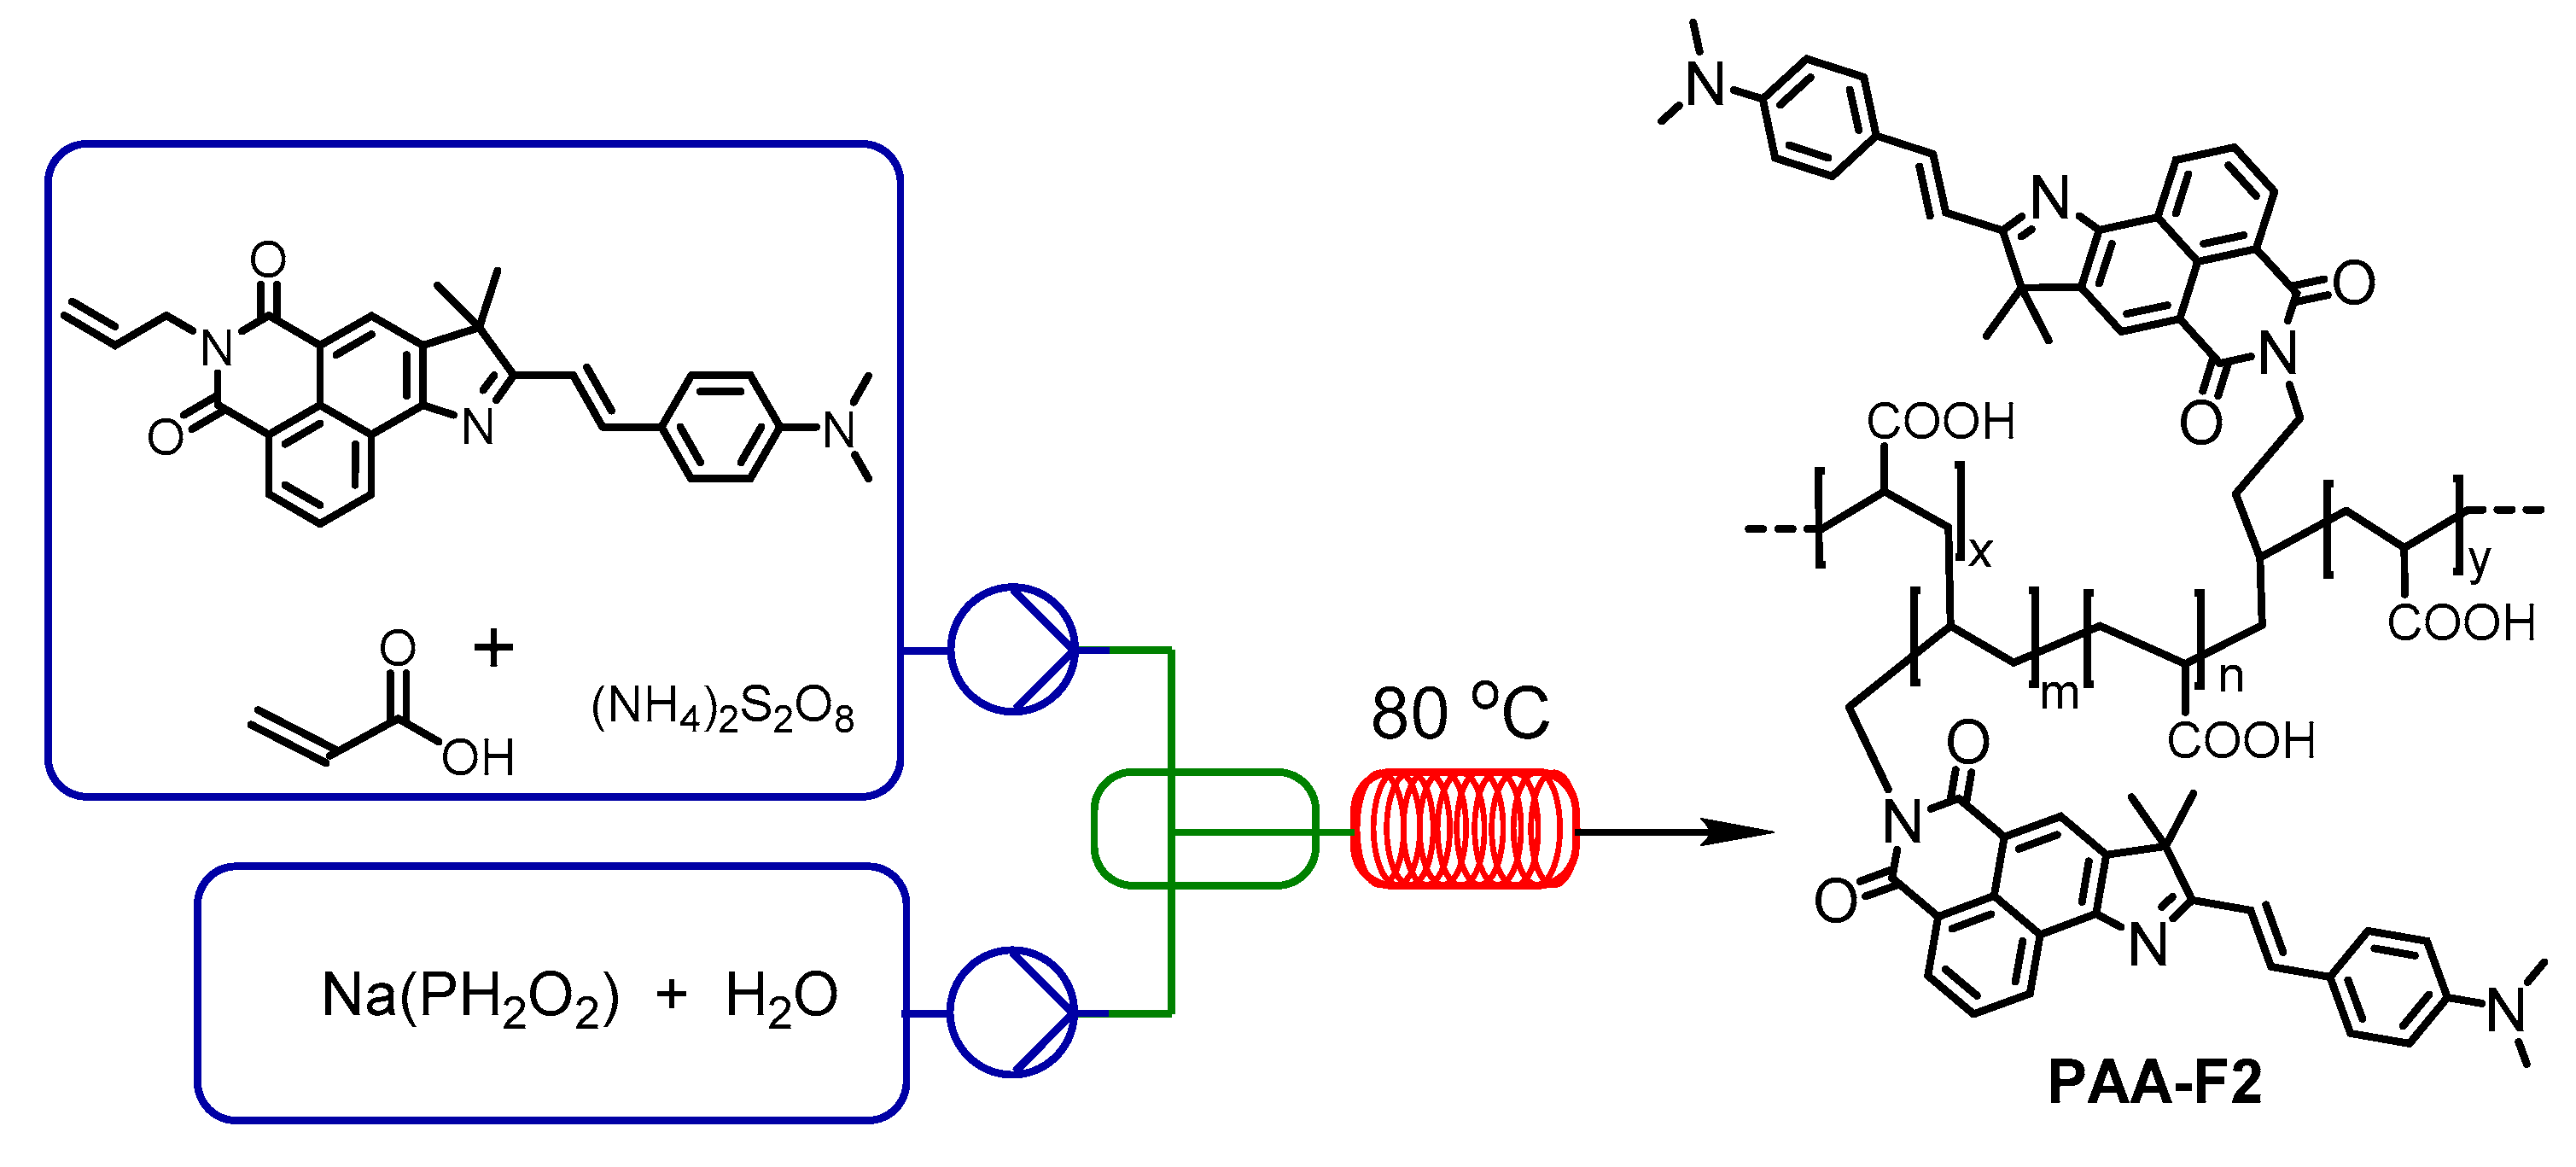
2.2. PAA-F2 Synthesis

Preparation of 2-allyl-6-hydrazinyl-1H-benzo[de]isoquinoline-1,3(2H)-dione(2)
The mixture of 2-allyl-6-chloro-1H-benzo[de]isoquinoline-1,3(2H)-dione (1) (5 g; 0.0184 mol) was dissolved in 50 mL of ethylene glycol monomethyl ether at 80 °C with stirring. After that, 7.4 mL of hydrazine hydrate, dissolved in 60 mL of ethylene glycol monomethyl ether, was added dropwise. The reaction mixture was stirred at 124 °C for 3 h. The product was then filtered out and dried, yield 75% (3.7 g). The melting point of the product was 234–239 °C (literature m.p. value 242–245 °C [20]). 1H NMR (DMSO-d6, 400.13 MHz, t = 19.1 °C), d (ppm): 4.63–4.69 (d, J = 5.1 Hz, 2H), 4.69 (s, 1H), 5.08–5.12 (m, 2H), 5.88–5.99 (m, 1H), 7.25–7.28 (d, J = 8.7 Hz, 1H), 7.62–7.68 (m, 1H), 8.29–8.32 (d, J = 8.7 Hz, 1H), 8.41–8.44 (d, J = 7.3 Hz, 1H), 8.62–8.64 (d, J = 8.4 Hz, 1H), 9.15 (s, 1H). 13C NMR (DMSO-d6, 100.61 MHz, t = 19.3 °C) d (ppm): 43.46, 105.51, 108.04, 117.28, 125.34, 126.34, 128.37, 129.47, 131.76, 131.91, 132.05, 134.15, 134.37, 134.60, 135.31.
Preparation of 5-allyl-8,8,9-trimethylbenzo[de]pyrrolo[2,3-g]isoquinoline-4,6(5H,8H)-dione(3)
The mixture of 2-allyl-6-hydrazinyl-1H-benzo[de]isoquinoline-1,3(2H)-dione (2) (1.6 g; 5.98 mmol) and of 0.645 mL 3-methyl-2-butanone in 35 mL toluene was refluxed for 2 h in the presence of a trace amount of TsOH·H2O (p-Toluenesulfonic acid) in a round bottomed flask equipped with the Dean-Stark apparatus to remove water. Then, the solution of 1.7 g TsOH·H2O in 18 mL of toluene was added dropwise. The mixture was refluxed for two more hours in a round bottomed flask equipped with the Dean-Stark apparatus. After cooling, the mixture was washed with 5% NaOH, 5% HCl, and then with a saturated NaCl aqueous solution. Then, the solvent was removed under a vacuum and the resulting oil was heated in the presence of 100 mL of hexane [21]. The hexane layer was separated and removed under a vacuum to give a yellow solid, yield 36% (0.690 g). The melting point of the product was 170–177 °C. 1H NMR (DMSO-d6, 400.13 MHz, t = 19.1 °C), d (ppm): 1.52 (s, 1H), 2.56 (s, 1H), 4.89–4.91 (d, J = 5.67 Hz, 2H), 5.25–5.42 (m, 2H), 6.01–6.14 (m, 1H), 7.85–7.91 (m, 1H), 8.66 (s, 1H), 8.69–8.71 (d, J = 7.25 Hz, 1H), 8.96 (d, J = 8.29 Hz, 1H). 13C NMR (DMSO-d6, 100.61 MHz, t = 19.3 °C) d (ppm): 18.2, 24.3, 24.4, 44.0, 57.1, 112.6, 118.2, 119.4, 120.9, 125.7, 126.3, 127.5, 128.3, 130.7, 131.9, 132.8, 153.3, 161.8, 162.7, 194.2.
Preparation of (E)-5-allyl-9-(4-(dimethylamino)styryl)-8,8-dimethylbenzo[de]pyrrolo[2,3-g]isoquinoline-4,6(5H,8H)-dione(4)
The mixture of 5-allyl-8,8,9-trimethylbenzo[de]pyrrolo[2,3-g]isoquinoline-4,6(5H,8H)-dione (3) (0.510 g; 1.6 mmol) was dissolved in 30 mL of ethanol. The reaction mixture was stirred at reflux and then 4-(dimethylamino)benzaldehyde (DMAB) (0.199 g; 1.3 mmol) and 0.179 g NaOH in 5 mL ethanol were added. The mixture was stirred at 85 °C for 6 h [22]. The product was then filtered out and dried to give a red solid, yield 20% (0.118 g).1H NMR (DMSO-d6, 400.13 MHz, t = 19.1 °C), d (ppm): 1.33 (s, 3H), 1.64 (s, 3H), 1.75 (s, 3H), 1.83 (s, 3H), 4.88–4.91 (m, 2H), 5.25–5.30 (m, 1H), 5.35–5.42 (m, 1H), 6.00–6.14 (m, 1H), 6.84–6.89 (d, J = 2.00 Hz, 1H), 6.90–6.91 (d, J = 2.93 Hz, 1H), 7.19–7.24 (d, J = 15.92 Hz, 1H), 7.54–7.62 (m, 2H), 7.73–7.79 (d, J = 15.48 Hz, 1H), 8.51–8.55 (m, 1H), 8.57–8.70 (m, 1H), 8.74 (s, 1H). 13C NMR (CDCl3-d6, 100.61 MHz, t = 19.3 °C) d (ppm): 13.61, 23.35, 25.84, 29.99, 31.56, 42.39, 44.08, 57.46, 102.02, 112.84, 118.02, 118.38, 125.44, 126.39, 126.73, 127.12, 131.35, 131.82, 132.74, 133.05, 133.18, 133.67, 143.75, 144.71, 149.30, 151.57, 163.77, 164.62, 185.69.
Preparation of 5-allyl-9-(4-(dimethylamino)styryl)-8,8-dimethylbenzo[de]pyrrolo[2,3-g]isoquinoline-4,6(5H,8H)-dione copolymer with acrylic acid (PAA-F2)
The target (PAA-F2) was synthesized using a continuous flow microreactor Qmix, provided by CETONI, with a steel-made T-shaped mixer and 850 mm long coil pipe at the last step. The synthesis technique was adapted from [23]. Two solutions have been prepared and injected by syringe pumps into a microfluidic reactor (3 mL volume). The first one (solution 1) is an aqueous mixture of acrylic acid, of compound 4 and of ammonium persulfate, while the second one (solution 2) is an aqueous solution of sodium hypophosphite. Both solutions are injected with an equal velocity of 0.25 mL/min at 80 °C, and the total contact time in the reactor constitutes 12 min. After that, the reaction mass is collected in the flask. The resultant polyacrylic acid solution was neutralized by 40% NaOH up to pH = 7, and then dried at 140 °C in a drying oven. After that, each solid sample was studied for molecular mass and antiscaling activity.

2.3. Gypsum Scale Formation Procedure and Antiscalant Efficacy Testing

Inhibition tests were run following the NACE Standard TM0374-200724 [24]. Two synthetic brines were prepared with deionized water: the calcium-containing brine (11.10 g⋅dm−3 CaCl2⋅2H2O and 7.50 g⋅dm−3 NaCl) and a sulfate-containing brine (10.66 g⋅dm−3 Na2SO4 and 7.50 g⋅dm−3 NaCl). Both brines passed filtration (220 nm membrane) before use. Being mixed at a 1:1 volume ratio, these brines produce a supersaturated calcium sulfate solution with pH ranging from 6 to 7: 0.038 mol⋅dm−3 CaCl2⋅2H2O, 0.038 mol⋅dm−3 Na2SO4, and 0.128 mol⋅dm−3 NaCl. By the end of the precipitation process, the ionic strength of this solution was around 0.2 mol⋅dm−3, provided mostly by NaCl, and with activity coefficients γ ± = 0.77125 [25]. According to Raju and Atkinson [26], the solubility of gypsum in 0.2 mol⋅dm−3 NaCl at 25 °C corresponds to 0.025 mol⋅dm−3. Thus, the supersaturation SI in our case constitutes SI = 1.5, where SI is denoted as SI = (gypsum initial concentration, mol⋅dm−3)/(gypsum solubility, mol⋅dm−3).
Following the NACE Standard TM0374-200724 [24], a supersaturated solution of calcium sulfate with a calculated amount of inhibitor (10 mg⋅dm−3) was then kept for 24 h at 71 °C (160 °F), cooled, and analyzed for residual calcium content by EDTA titration. In all cases, the antiscalants were added to the sulfate brine and equilibrated there for 1 h before it gets mixed with calcium brine. All the experiments were run in duplicate. The performance of the tested compounds as calcium sulfate was calculated as an inhibition percent (I, %):
Percent inhibition (I, %)= 100 × ([Ca]exp − [Ca]final)/([Ca]init − [Ca]final),
where [Ca]exp denotes the concentration of calcium in the filtrate in the presence of an inhibitor after 24 h treatment, [Ca]final corresponds to the concentration of calcium in the filtrate in the absence of an inhibitor after 24 h treatment, and [Ca]init is the concentration of calcium at the beginning of the experiment. At the end of the experiments, the solid samples of precipitates were collected for characterization by a powder X-ray diffraction (XRD). In addition, the liquid phase with suspended solid particles was analyzed by confocal fluorescent microscopy on the next day after heating was finished.
Three samples of antiscalants have been tested: 10 mg·dm−3 of HEDP-F; 10 mg·dm−3 of PAA-F2, and a blend of HEDP-F and PAA-F2 (5 mg·dm−3 of HEDP-F + 5 mg·dm−3 of PAA-F2). In addition, a blank sample of calcium brine in the presence of 10 mg⋅dm−3 of PAA-F2 was also heated for 24 h, cooled, and analyzed by confocal fluorescent microscopy. Notably, the concentration of antiscalants (10 mg·dm−3) was negligible relative to the initial total calcium content (5.5 g⋅dm−3 CaCl2⋅2H2O): 550:1 mass ratio. The [Ca]/[antiscalant] mole ratio constitutes 1950 (HEDP-F) and 271 (PAA-F2; for the CH2CHCOOH fragment). Therefore, the corresponding calcium-antiscalant complexes formation as well as the formation of Ca-HEDP-F and Ca-PAA-F2 solids does not change the gypsum supersaturation degree, and this effect would not be considered further.

2.4. Methods

The molecular structures of all synthesized compounds were studied by ultra-high resolution Qq-Time-Of-Flight mass spectrometry (Bruker ESI-Q-TOF micrOTOF-Q, maXis impact, Bruker Daltonik GmbH, Bremen, Germany,) and 1H, 13C NMR spectroscopy (Bruker AVANCE II 400 spectrometer, 400.13 MHz, Bruker Corporation, Bremen, Germany) at an ambient temperature for reagent aqueous solutions in the 5 mm diameter sample tubes. The external standard solution of TMS (1H, 13C) was used in a 1 mm inner coaxial tube.
Electronic absorption spectra were recorded with the UNICO UV-Vis 2804 spectrophotometer (UNICO, Suite E Dayton, NJ, USA). Fluorescence measurements were carried with the luminescence spectrometer Shimadzu RF-6000 operating with a xenon lamp as a light source (Shimadzu Corporation, Kyoto 604-8511, Japan). All spectral measurements were carried out in a quartz sample cell (pathlength ℓ = 1 cm) at 20 ± 1 °C in air-saturated solutions. The wavelengths of fluorescence excitation were matched to values of its absorption maxima for all samples.
The fluorescence quantum yield Φf measurements were performed using the UNICO UV-Vis 2804 spectrophotometer (UNICO, Suite E Dayton, NJ, USA) and Shimadzu RF-6000 spectrofluorimeter (Shimadzu Corporation, Kyoto 604-8511, Japa). All measured fluorescence spectra were corrected for the nonuniformity of detector spectral sensitivity.
Confocal microscopy measurements have been run with a laser scanning confocal microscope LSM-710-NLO (Carl Zeiss Microscopy, Jena, Germany), ×20 Plan-Apochromat objective (NA = 0.8). The liquid samples were placed onto the Petri dish with a glass bottom 0.16 mm thick. The fluorescence of the HEDP-F (blue color in images) was recorded in the wavelength range of 370–450 nm, when excited with the femtosecond pulse laser (Chameleon Ultra II, Coherent Inc, Wilsonville, OR, USA) with a wavelength of 740 nm for 2P absorption. The fluorescence of the PAA-F2 (green color in images) was recorded in the wavelength range of 500–670 nm, when excited by a laser with a wavelength of 488 nm. As a result, the overlay of images from tree channels: HEDP-F, PAA-F2, and the transmitted 488 nm laser light image (grey color) was obtained. Where appropriate, the separate signals of HEDP-F and PAA-F2 from the images have been extracted.
For segregation of mixed fluorescent signals of HEDP-F (blue color) and PAA-F2 (green color) and in order to resolve the spatial contribution of each fluorophore more clearly, the spectral-resolved fluorescent imaging coupled with an image analysis using linear unmixing was employed. The spectral-resolved fluorescence emission was detected by the 32 channel GaAsP detector (Carl Zeiss Microscopy, Jena, Germany) in VIS spectral range 400–700 nm when excited with the femtosecond pulse laser (Chameleon Ultra II, Coherent Inc, Wilsonville, OR, USA) with a wavelength of 740 nm for 2P absorption.
The 3D fluorescence images, obtained using the spectral signal linear unmixing technique, were recorded with a step 1 μm along the Z axis.
The precipitate that was triply rinsed with deionized water and air dried at 50 °C, was characterized by powder X-ray diffraction (XRD, Bruker D8 Advance diffractometer; Cu Kα; Ni-filter; LYNXEYE detector, Bruker Corporation, Bremen, Germany). The XRD phase identification was done with a JCPDS data base. The dominating precipitated phases in all cases are identified by XRD as gypsum.

3. Results and Discussion

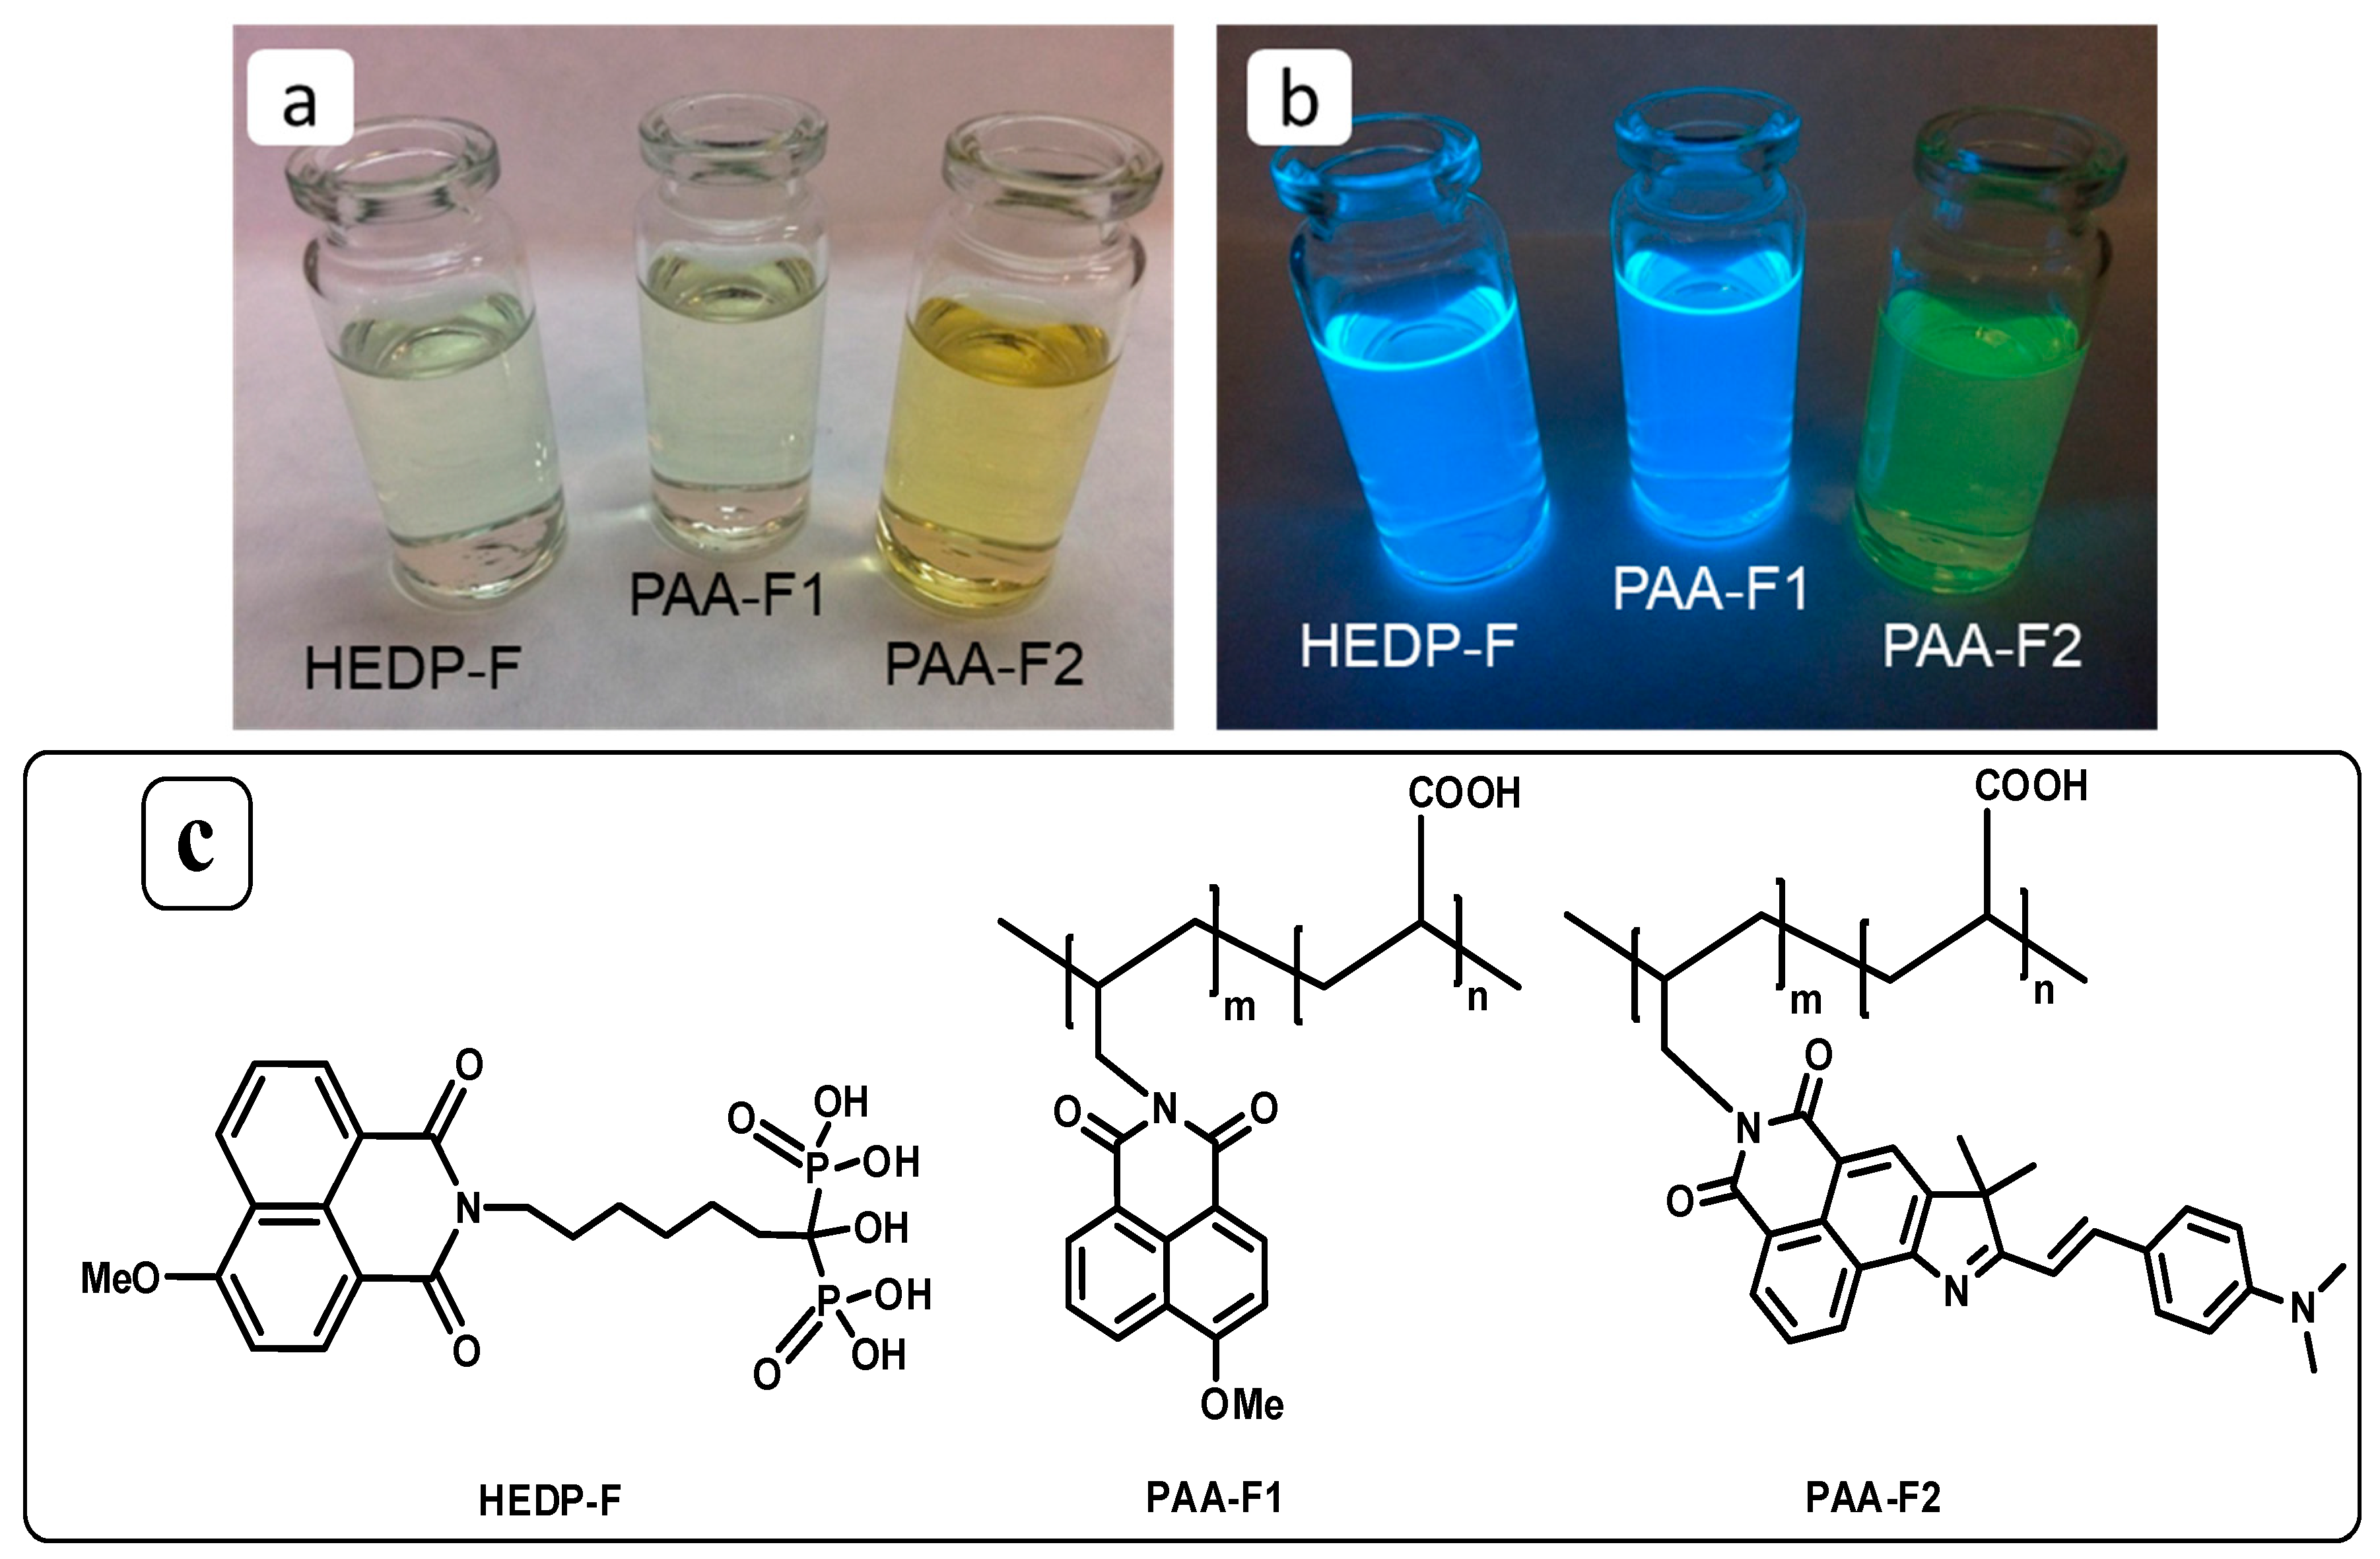
3.1. Synthesis of the PAA-F2

The target 5-allyl-9-(4-(dimethylamino)styryl)-8,8-dimethylbenzo[de]pyrrolo[2,3-g]isoquino -line-4,6(5H,8H)-dione copolymer with acrylic acid (PAA-F2) was synthesized in four steps (Figure 2 and Figure 3) using a continuous flow microreactor Qmix, provided by CETONI, with a steel-made T-shaped mixer and 850 mm long coil pipe at the last step.
The synthetic procedure can be divided into two parts: on the first step the fluorescent monomer 4 is obtained, and on the second stage it is copolymerized with polyacrylate giving the final product PAA-F2. The first compound in the chain is 2-allyl-6-hydrazinyl-1H-benzo[de]isoquinoline-1,3(2H)-dione (2), which was synthesized from 2-allyl-6-chloro-1H-benzo[de]isoquinoline-1,3(2H)-dione (1) upon a substitution reaction, replacing chlorine atom with hydrazine. Product 2 was introduced in the reaction with 3-methyl-2-butanone in a toluene producing heterocyclic product 3. The isoquinoline fragment contains three methyl groups. The one closest to the nitrogen atom, is much more preferable to react with aldehyde. On the last step of the first synthetic procedure, product 3 undergoes transformation upon the addition of 4-(dimethylamino)benzaldehyde giving olefin 4. The product has two stereoisomeric forms: Z and E. The latter is preferable under normal conditions, but it can transform into Z under UV light. Finally, the PAA-F2 molecular mass was found to be about 4000 Da, with a flurophore content around 0.5 mass%.
The use of the microflow technology for the PAA-F2 synthesis provides several advantages: a narrower molecular mass distribution and the ability to obtain the polymer with a desirable molecular mass. An isolated PAA-F2 was studied for its light absorption/emission and gypsum scale inhibition properties.

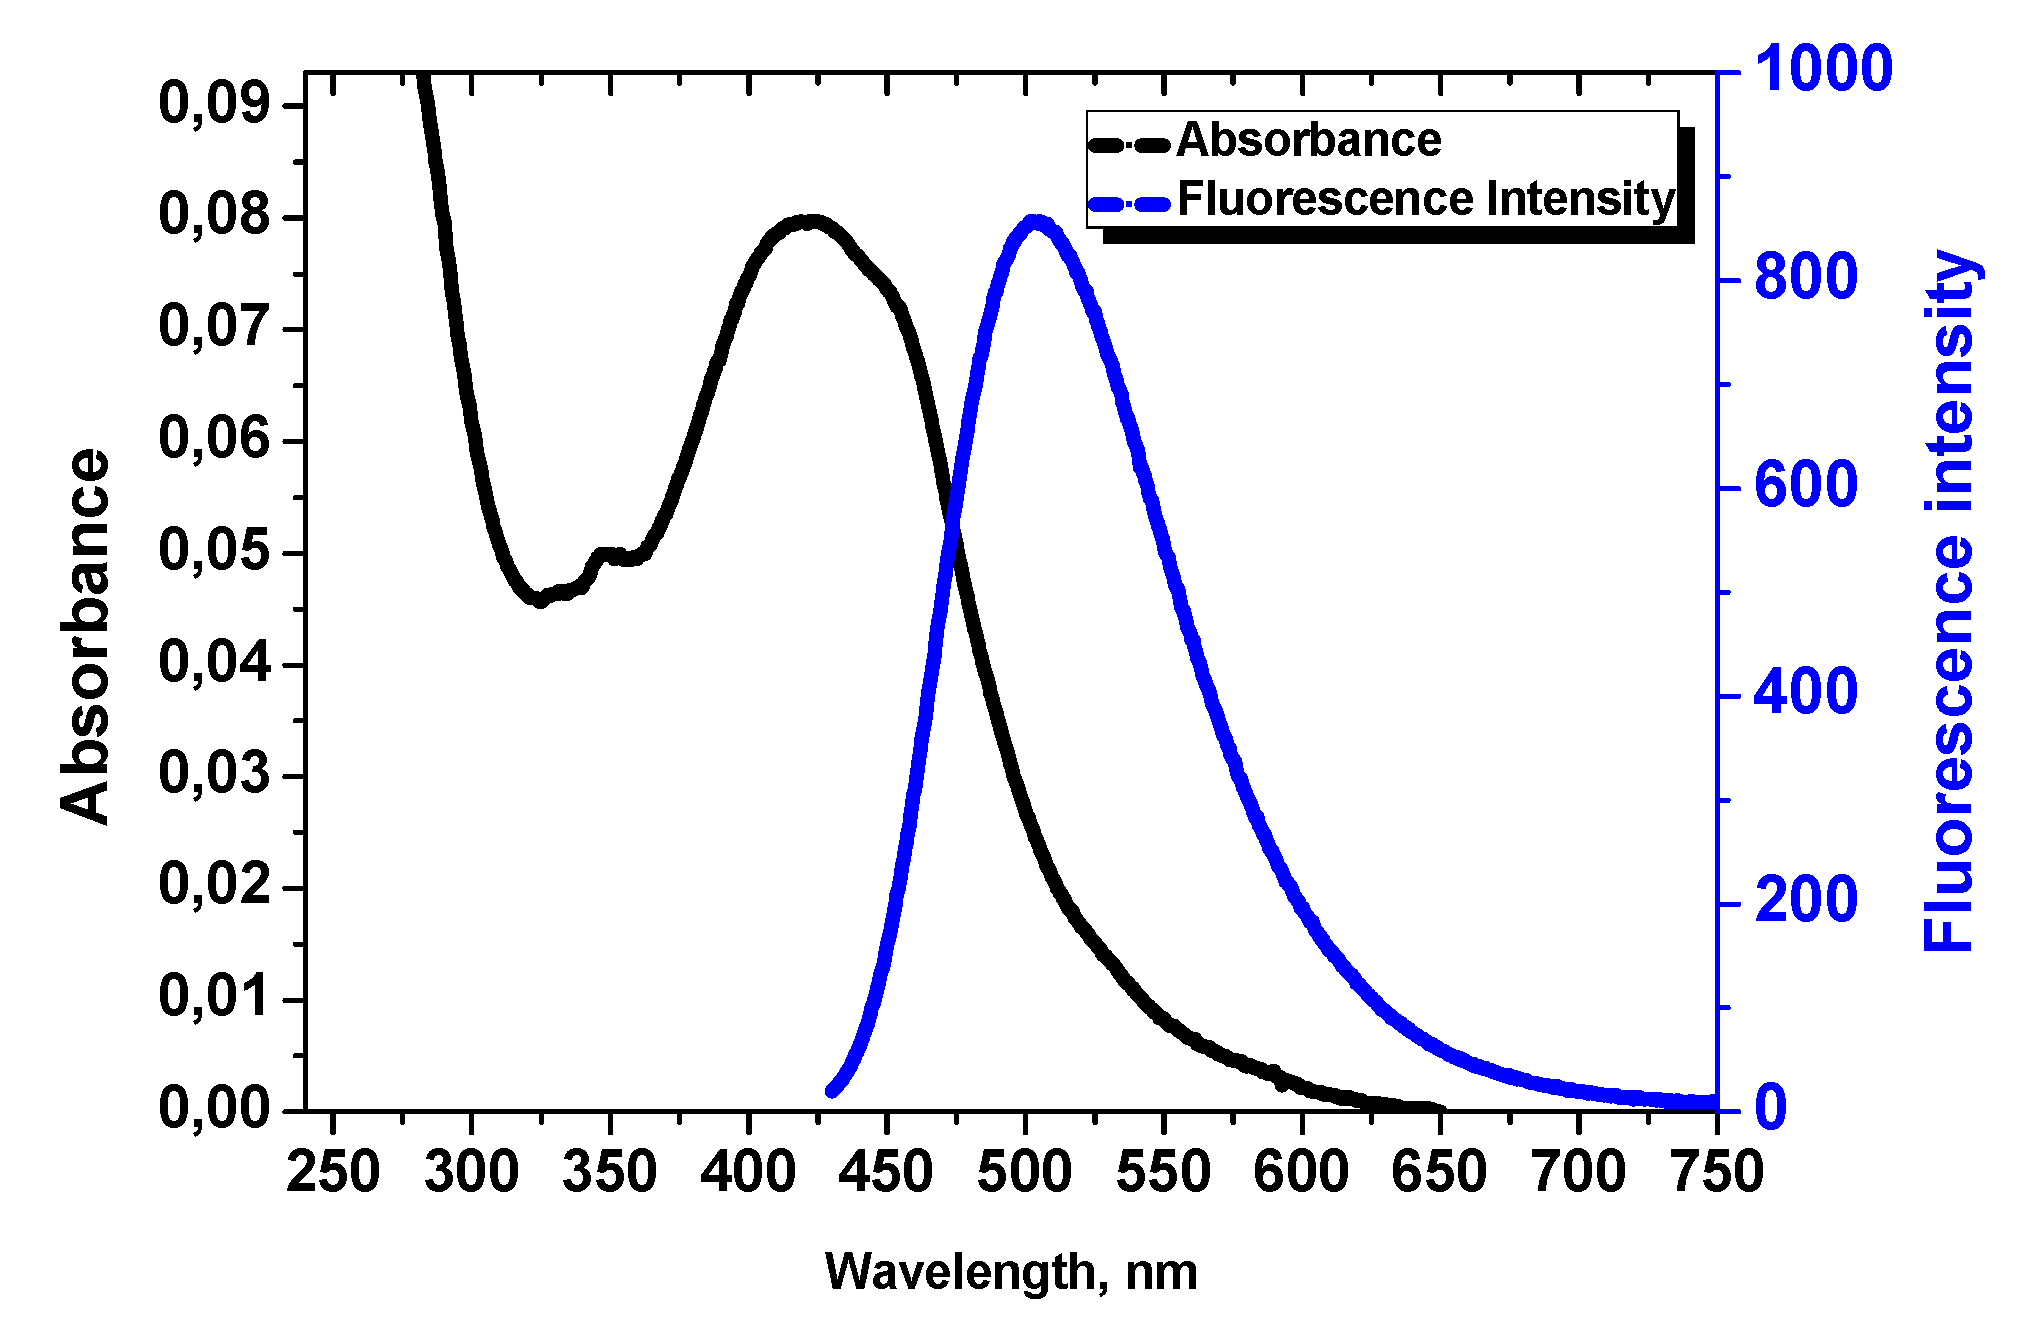
3.2. Excitation and Emission Properties of PAA-F2

The excitation and emission of PAA-F2 are represented in Figure 4 and in Table 1 along with the corresponding values for PAA-F1 and HEDP-F. It can be seen that the excitation (λabs) and emission (λfl) wavelengths of PAA-F2 are 422 and 505 nm, respectively, and reveal a good mirror symmetry relation. Both are red-shifted relative to the corresponding bands of HEDP-F. This provides a suitable differentiation between PAA-F2 and HEDP-F in sediments. However, the quantum yield (Φfl) of PAA-F2 is not as high as of HEDP-F (Table 1). In addition, the abundance of fluorescent moiety in a mass unit of antiscalant is c.a. 100-fold less for PAA-F2 relative to HEDP-F. Nevertheless, a detection limit of PAA-F2 (2 mg·dm−3) is found to be high enough to provide its meaningful visualization in the scale formation process at the dosages, common for antiscalants, e.g., from 1 to 10 mg·dm−3.

3.3. Scale Inhibition Performance of PAA-F2, HEDP-F, and of a PAA-F2/HEDP-F Blend

The inhibition performance of PAA-F2 on CaSO4·2H2O deposition was compared with those of HEDP-F and of PAA-F2/HEDP-F blend (1:1 mass) (Table 2). PAA-F2 exhibits a much better scale inhibition efficacy than HEDP-F. This result is in a good agreement with our previous study [28] of relative performance of the corresponding non-fluorescent analogues HEDP and PAA, as well as with data, presented by Amjad [6]: PAA >> HEDP. A PAA-F2/HEDP-F blend demonstrates exactly the mean efficacy between the ones for PAA-F2 and HEDP-F (Table 2). Thus, unfortunately no synergism takes place in our particular case: PAA-F2 > PAA-F2/HEDP-F blend > HEDP-F. However, it was still interesting to monitor the behavior of each inhibitor in their blend during the gypsum scale formation.

3.4. Visualization of PAA-F2 in Calcium Brine

In our previous communications on PAA-F1 and HEDP-F visualization [9,10,12], it was noticed that a side reaction of both antiscalants with an excess of calcium ions usually takes place at the moment when calcium and sulfate brines get mixed. Both scale inhibitors interacted with calcium, and formed their own solid phases [Ca-PAA-F1] and [Ca-HEDP-F] along with the gypsum phase. Thus, for a better interpretation of the processes in an antiscalant/gypsum system, an auxiliary blank experiment on a possible [Ca-PAA-F2] solid phase formation is needed. To reach this goal, the calcium-containing brine (11.10 g·dm−3 CaCl2·2H2O and 7.50 g·dm−3 NaCl ) was mixed with an equal volume of PAA-F2 aqueous solution (in order to provide finally 10 mg·dm−3 of antiscalant in the resultant solution). Then, this solution was heated for 24 h according to the NACE Standard, cooled, and one day later it was analyzed by confocal fluorescent microscopy. The result is presented in Figure 5.
Evidently, PAA-F2 forms solid complexes [Ca-PAA-F2] with calcium ions. These look as sparse granular particles with the sizes ranging from 10 to 30 µm. Notably, the very similar aggregates are registered for PAA-F1 [12] and for HEDP-F [9].

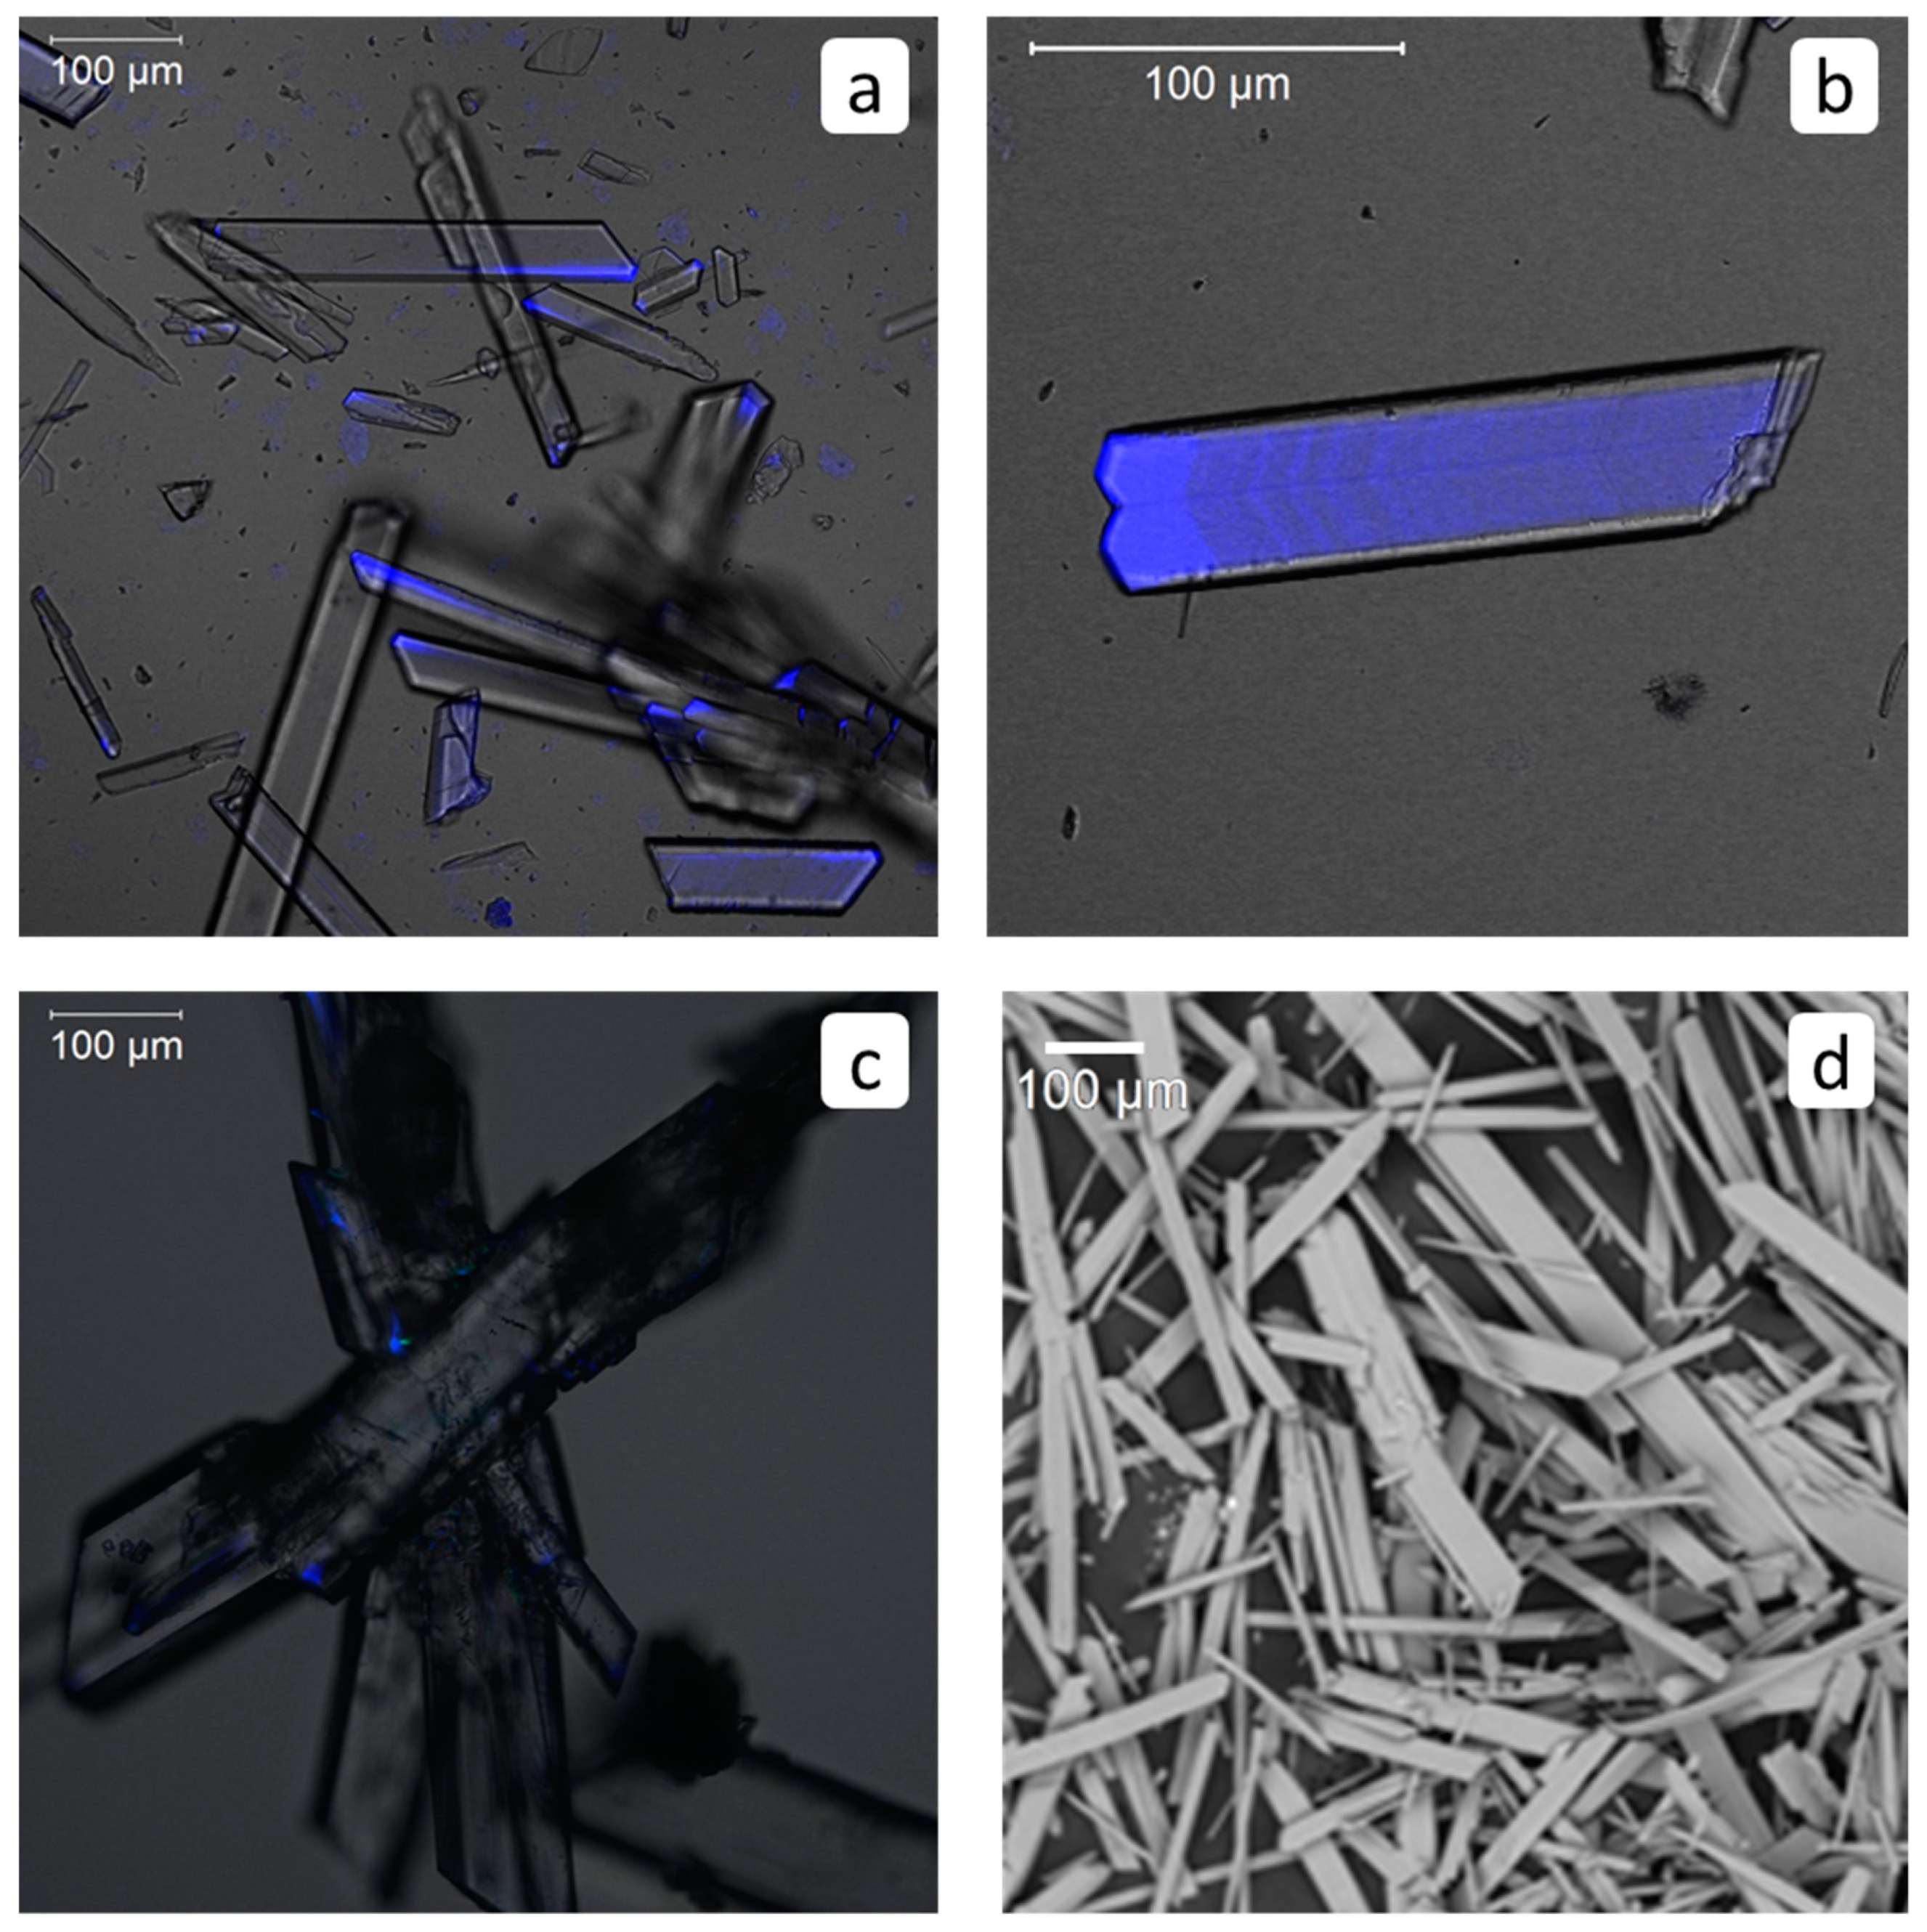
3.5. Visualization of HEDP-F in a Binary Gypsum-HEDP-F System

SEM and fluorescent images of gypsum crystals are presented in Figure 6. A blank experiment, run without an antiscalant, reveals a tabular habit reflecting the monoclinic crystal structure elongated on the [001] direction (Figure 6d) in a good agreement with our previous report [28]. However, the fluorescent images (Figure 6a–c) exhibit significant differences relative to the same binary gypsum-HEDP-F system, as studied by us earlier and following the NACE Standard for 25 mg·dm−3 dosage of antiscalant [9]. Here, we have tested a lower content of scale inhibitor (10 mg·dm−3) (Figure 6). Unlike the case reported in [9], Figure 6 indicates that in addition to some smaller elongation, there is no significant gypsum crystals morphology modification: the mean length/width ratio changes from 14 ± 2 (Figure 6d, blank experiment) to 5 ± 2 (Figure 6a–c).
The fluorescent images exhibit typical elongated crystals of CaSO4·2H2O, covered in some places by the blue inclusions of HEDP-F. Moreover, there are also numerous gypsum crystals that exhibit no traces of the HEDP-F presence neither on their surface nor inside. It seems that these ones are formed and then grow without any influence of the scale inhibitor. Most of the HEDP-F is found on the end of the smaller crystals, notably, only on one of the edges. At the same time, the concentration of the antiscalant is steadily decreasing along the crystal 001 face (Figure 6a,b). Particularly, the fluorescence profile shows a decrease from 6000 to 2000 relative intensity units (Figure 6b).
Such a nonuniform distribution can be seen especially clearly in Figure 6b. Tentatively, there was an initial aggregation of several hundreds of [CaSO4] species on a “nanodust” particle with the formation of the primary CaSO4·2H2O crystal. This one has adsorbed some parallel forming [Ca-HEDP-F] nanoparticles or HEDP-F species (left bright blue end of gypsum micro-crystal). Then, the gypsum primary crystal proceeded to grow in the 001 direction. The growing face of the crystallite captured new portions of [Ca-HEDP-F], as indicated by a well visible fine structure of blue [Ca-HEDP-F] layers, that increasingly shine weak as a single crystal grew, and the bulk solution contained less and less quantities of HEDF-F species. However, the observed low concentration of HEDP-F and its location on gypsum crystals surfaces, as shown in Figure 6a–c, cannot explain the inhibiting effect of HEDP-F due to the lack of the CaSO4·2H2O crystal growth centers by antiscalant molecules [4].
On the other hand, an explanation, based on a “nano/microdust” concept [9] looks more reasonable. Indeed, the situation becomes clear if one assumes that gypsum nucleation in supersaturated solutions is promoted by templates, represented by foreign “nano/microdust” solid particles (always present in brines in amounts of 105 to ≥108 units in one dm−3) [29]. HEDP-F competes with sulfate and calcium ions for nano/microdust nucleation templates, blocks spontaneously the surface of a significant part of such particles, making them less suitable for gypsum nucleation. Therefore, the step of nucleation is inhibited. Those “nano/microdust” particles that got initially occupied by the gypsum components nucleus then grow and produce CaSO4·2H2O crystals without any inclusions of HEDP-F.
It is worthwhile to note that the gypsym/antiscalant relationship depends on temperature and antiscalant concentration. Unlike the present observations, for a higher dosage of HEDP-F (25 mg·dm−3) CaSO4·2H2O crystals change their morphology [9], and a significant inclusion of the antiscalant into the gypsum crystal lattice was observed after heating/cooling operations, performed within the NACE Standard treatment. Meanwhile, the same process at an ambient temperature [9] revealed no traces of HEDP-F on this sparingly soluble salt at all, no change of gypsum morphology, and a separate Ca-HEDP-F phase formation. Thus, an extrapolation of laboratory tests to particular industrial conditions requires an extreme caution.

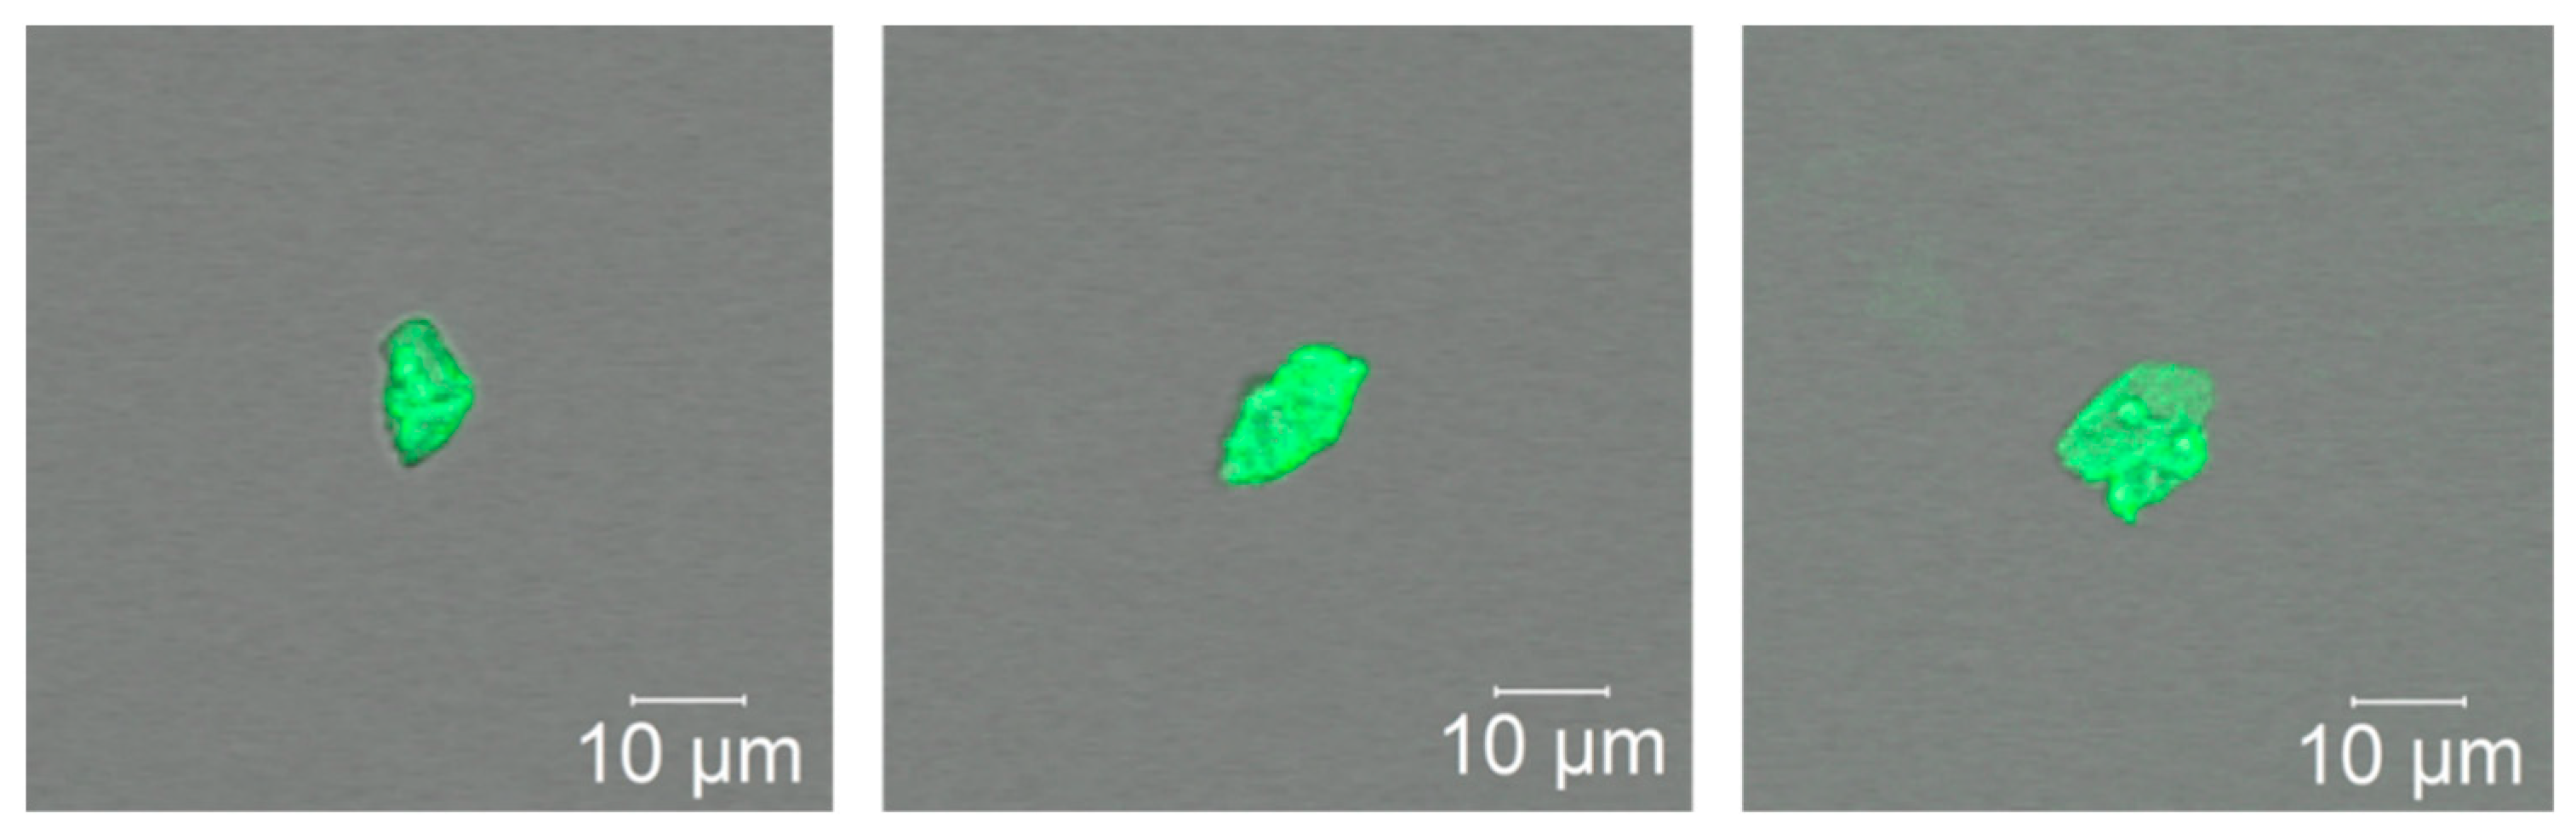
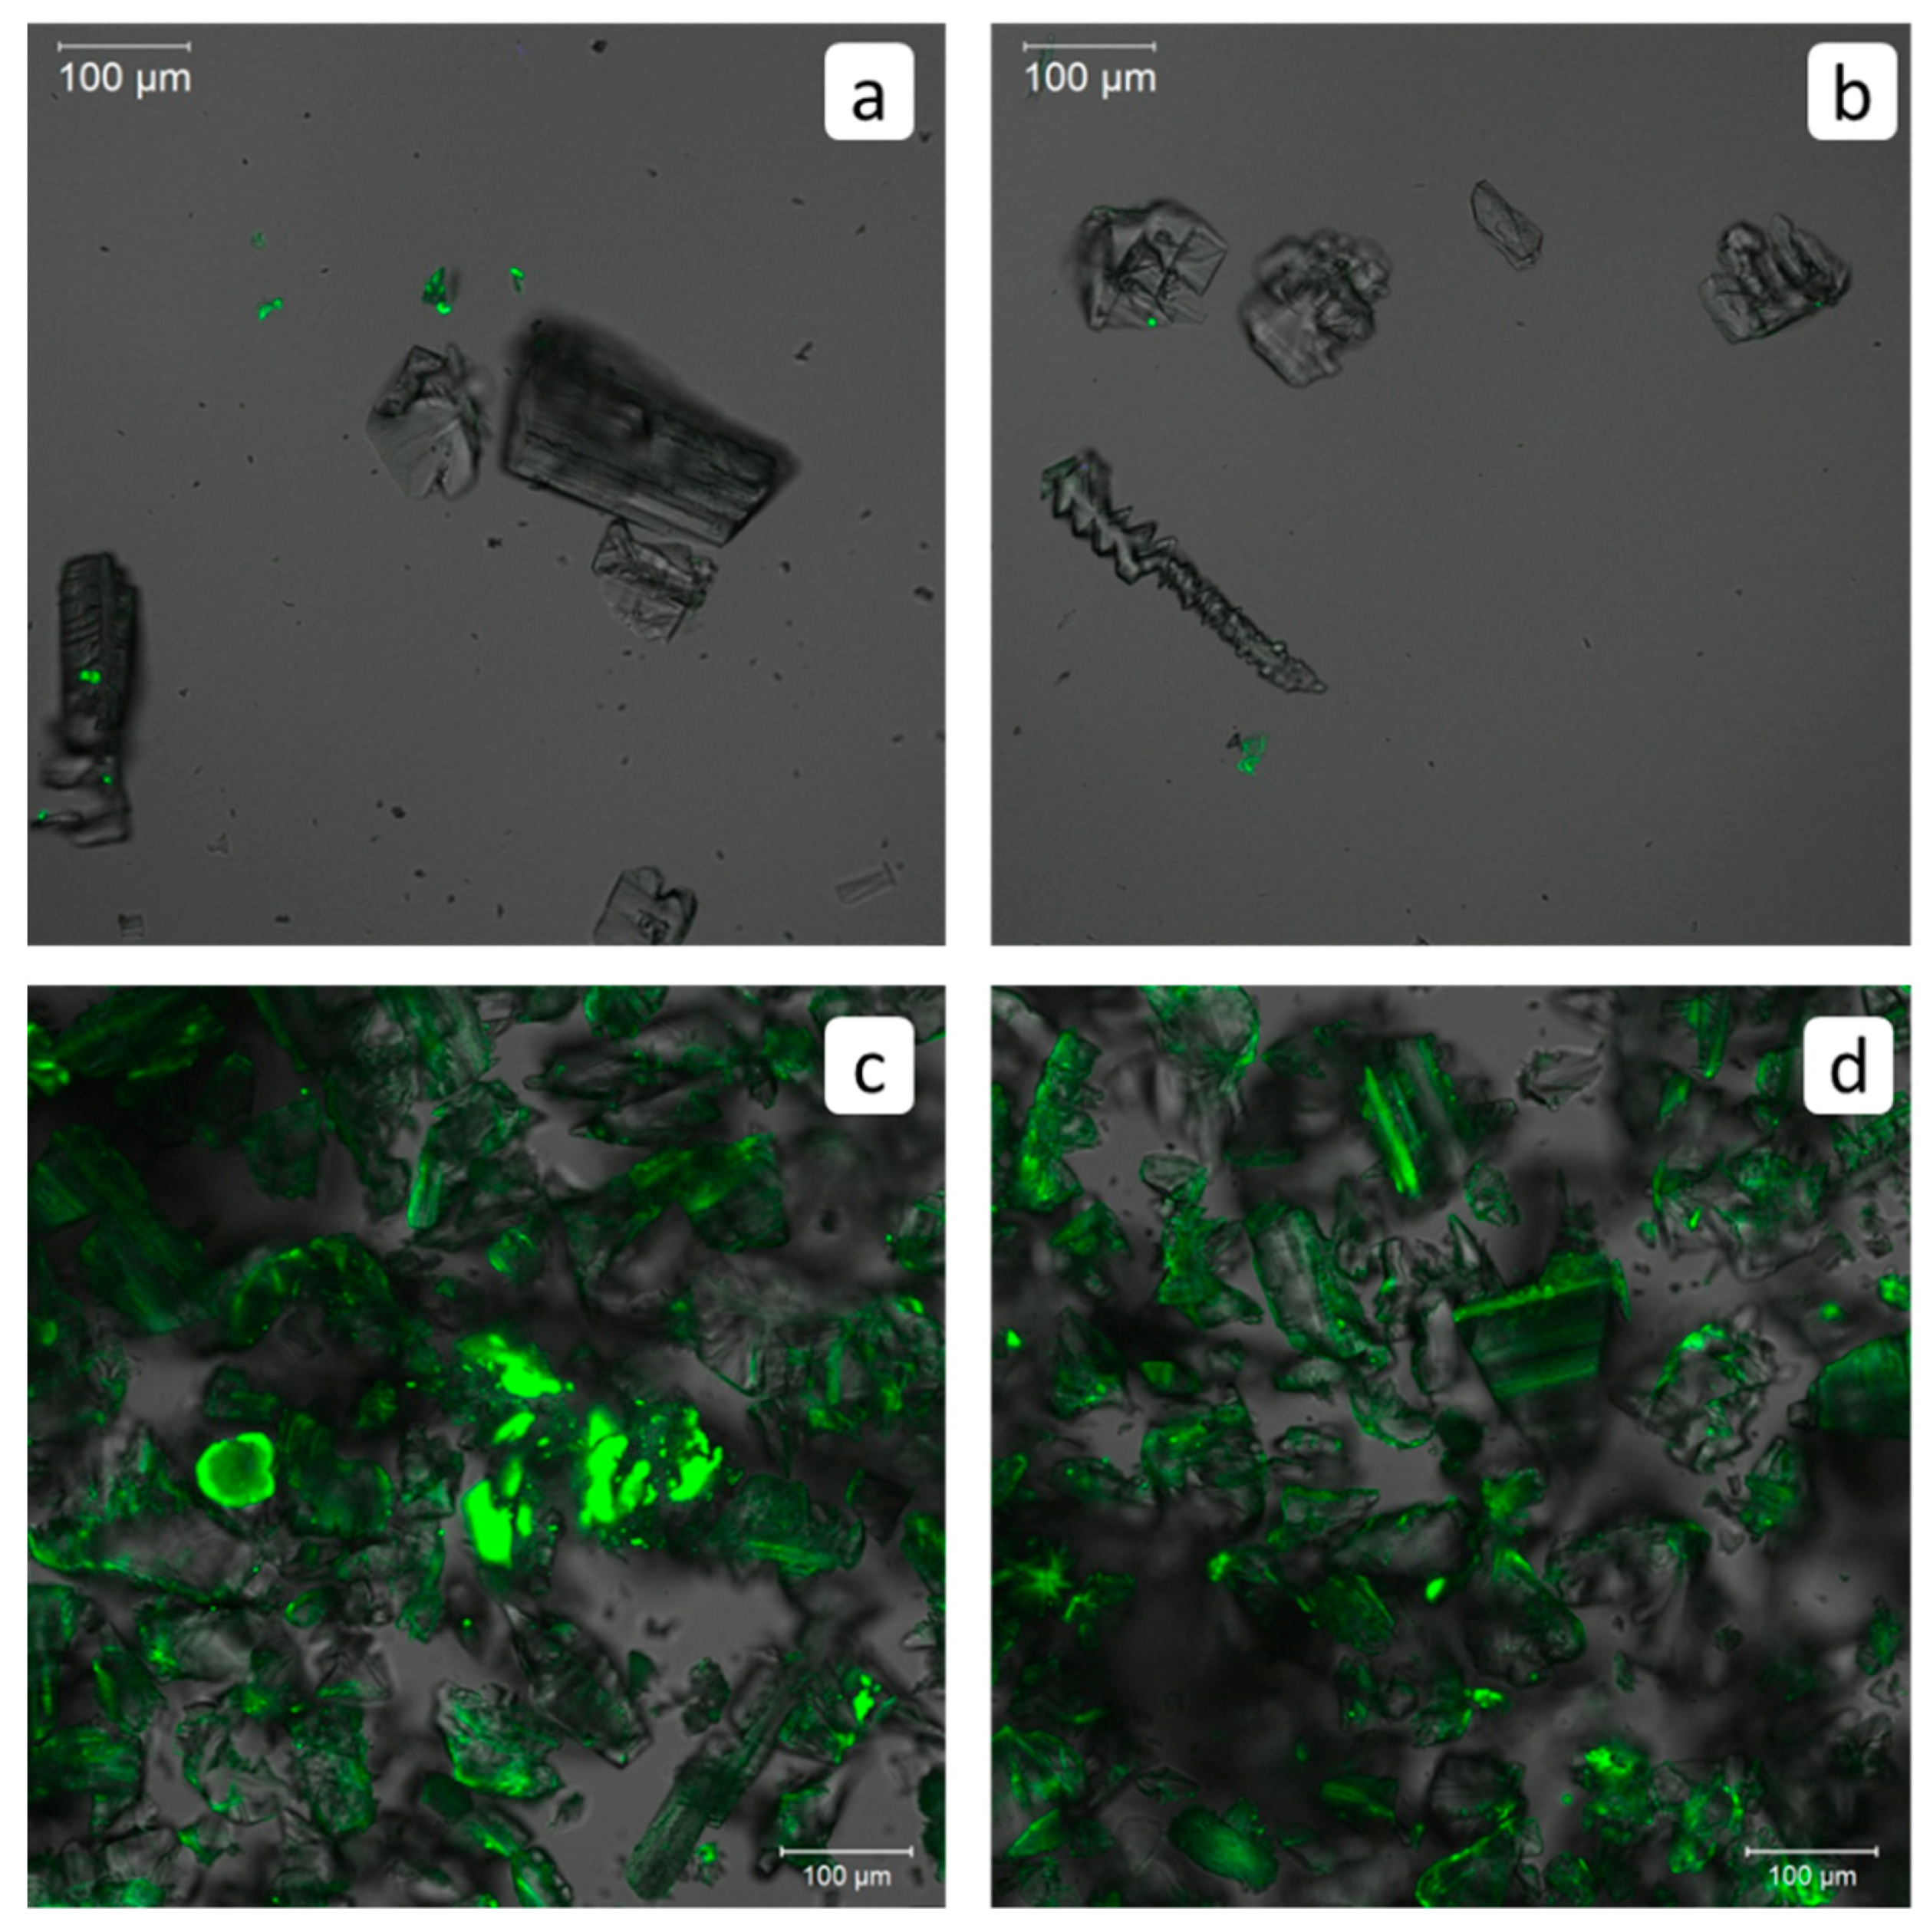
3.6. Visualization of PAA-F2 in a Binary Gypsum-PAA-F2 System

The visualization of PAA-F2 in a binary “gypsum-PAA-F2” system reveals a situation, as shown in Figure 7, that is very different from the one for HEDP-F (Figure 6). The number of formed gypsum crystals is small and their habit is highly modified in this case. Indeed, of the two possible gypsum morphologies (needles and platelets [30]), the second seems to become the dominant one (Figure 7c,d). The elongated crystals have the mean length/width ratio around 2. At the same time, due to a high antiscaling efficacy of PAA-F2 (96%), the number of gypsum crystals that formed on the next day after the NACE test (Figure 7a,b) was significantly smaller relative to the HEDP-F case (Figure 6a–c): within the image from a laser scanning microscope with a size of 707.8 × 707.8 μm (501,963 μm2) in the presence of HEDP-F the gypsum crystals are observed occupying an area: 158,000 ± 6000 μm2 (30%), while in the presence of PAA-F2 they occupy only 50,000 ± 20,000 μm2 (10%). The difference is even more drastic as in the former case the numerous overlapping images of individual crystals take place, while in the latter one such superposition is missing. Notably, the CaSO4·2H2O crystals reveal no presence of PAA-F2 on their surface or inside. Meanwhile, there are a lot of tiny green aggregates typical for [Ca-PAA-F2] complexes (Figure 5), located separately from the gypsum crystals.
However, the situation changes drastically 10 days later (Figure 7c,d). The platelet morphology has not changed, but became more pronounced. At the same time, the CaSO4·2H2O crystals became much larger and more numerous. In addition, the inclusions of PAA-F2 inside and on the surface of gypsum crystals appear, and become the dominating form of the antiscalant’s presence. However, the location of PAA-F2 on the gypsum surface seems to be of secondary importance in scale formation inhibition as a post gypsum phase formation event. Notably, a very similar observation is reported by Quan-Liang Chen et al. [11] for another fluorescent-tagged antiscalant, 8-allyloxy-1,3,6-pyrene trisulfonic acid trisodium salt, and gypsum. A first glance at Figure 6 and Figure 7c,d, as well as the data presented in [11], provide a perfect illustration of conventional scale inhibition theory: the more efficient antiscalant PAA-F2 gets absorbed onto the crystal’s growth centers, causes their morphology modification, slows the crystal growth rate down, and provides 96% inhibition, while the less efficient antiscalant HEDP-F causes no crystal habit modification, and exhibits only 32% inhibition. However, this is far from the case.
Indeed, the images presented in Figure 7a,b contradict the conventional concept. These are taken at the moment when most of the gypsum mass is held in a supersaturated state in an aqueous phase. Those few CaSO4·2H2O crystals that manage to form at this time do not bear any traces of interaction with PAA-F2. Meanwhile, PAA-F2 forms its own characteristic phase [Ca-PAA-F2] (Figure 5 and Figure 7a,b). Thus, the formation of the first gypsum crystals during the active inhibition phase has no evident relevance to the blockage of their active growth centers by PAA-F2. The nature and reasons of the observed gypsum crystals habit modification is a matter for future studies.
At present, we are able to provide a reasonable explanation for the differences in indirect antiscalant/gypsum interactions on the base of the nano/microdust concept. In our opinion, the efficient antiscalant PAA-F2 is a better blocker of nano/microdust impurities that serve as templates for gypsum crystals formation, relative to the less efficient blocker HEDP-F. At the same time, we do not question the ability of both antiscalants to get adsorbed on the gypsum microcrystal surface and to inhibit somehow their growth at the final steps of scale formation. However, in our opinion this kind of inhibition has a secondary importance, while the nucleation step is the major one.
Indeed, if the change of a crystal morphology is recognized as an indisputable evidence (or as a proof) of scale formation process inhibition via crystal growth centers blockage by antiscalant molecules, then it is reasonable to expect that the most effective reagents would cause the major change of crystal habit, while the least effective–the minor one, if any. Otherwise it is not a proof. Meanwhile, there are some cases registered, exhibiting the lack of a causal relationship between the antiscalant efficacy and scale crystals distortion degree. In our study of a set of antiscalants in gypsum scaling [28], the following efficacy sequence was found: MA-AA ~ ATMP > PESA (400–1500 Da) > PASP (1000–5000 Da) > PA (3000–5000 Da) ~ HEDP~PBTC. However, the scanning electron microscopy (SEM) of corresponding sediments indicated clearly, that the gypsum crystal morphology is changed not by the most effective antiscalants (ATMP, PESA, MA-AA, PASP), but by the least effective PBTC [28]. A similar effect was observed by Ang, Muryanto, and Hoang [31]. It was demonstrated that the ability of antiscalants to retard gypsum deposition is decreasing: ATMP > HEDP >> EDTA > NTA ~ citric acid. However, EDTA and citric acid with insufficient antiscaling efficacy exhibited the most gypsum crystals habit modification, while ATMP with the highest efficacy revealed no noticeable changes in crystal morphology. Recently, a similar conclusion concerning CaCO3 deposition in the presence of PBTC was reported: the scale inhibition effect of PBTC under cathodic polarization has no obvious relationship on the crystal habit modification, caused by PBTC [32].

3.7. Visualization of PAA-F2/HEDP-F Blend after Gypsum Scale Formation in a Triple System

The results of the PAA-F2/HEDP-F blend visualization in a triple system appeared to be the most unexpected ones (Figure 8, Figure 9 and Figure 10). However, in the first approximation provided by a superposition of three channels of detection modes they look rather clear (Figure 8). The gypsum crystals morphology has changed in the same way as in the case of a binary PAA-F2/gypsum system, and bear some blue inclusions of HEDP-F, in the same way as for the HEDP-F/gypsum case. However, some elongated gypsum crystals, typical for a binary HEDP-F/gypsum case are also present (Figure 10). Meanwhile, PAA-F2 seems to be mostly concentrated in the separate semispherical species, colored green, and treated initially as [Ca-PAA-F2] particles. Although this green color is a bit different from that one, as observed in Figure 5 and Figure 7.
At the same time, the single channel detection modes (Figure 9) provide an important refinement of images, as presented in Figure 8. It turns out that the spherical green species in Figure 8 represent a superposition of blue color of HEDP-F and green color of PAA-F2. Thus, these spherical species are ascribed by us to the particles that are composed by a mixture of [Ca-PAA-F2] and [Ca-HEDP-F] species. Meanwhile, some sparse traces of PAA-F2 on the gypsum surface also become visible. In this case, a legitimate question arises, how 66% of inhibition is provided if both antiscalants are mostly self-contained?
A reasonable answer, taking into account the available experiment evidence, can be provided via the “nano/microdust” concept of the bulk heterogeneous nucleation. Both antiscalants compete with calcium, sulfate, and [CaSO4]-complex species for the nucleation centers represented by nano/microdust impurities, and disable them from the natural gypsum crystallization process.
Notably, an application of spectral separation of partially overlapping fluorescent signals from HEDP-F and PAA-F2 provides a clearer identification of the spatial contribution of each fluorophore. We have managed to find some CaSO4·2H2O crystals that offer a possibility to observe the sequence of thin antiscalant layers formation on the surface of gypsum (Figure 10).
A single channel of HEDP-F fluorescence (Figure 10a) indicates the presence of HEDP-F on the gypsum crystal surface, while a single channel of PAA-F2 fluorescence reveals that PAA-F2 occupies more space than HEDP-F (Figure 10b). A superposition of HEDP-F and PAA-F2 channels demonstrates evidently that the primary sorption is realized by PAA-F2, while HEDP-F forms its layer over that one of PAA-F2. As a result, the images listed above reveal the unique research potential of fluorescent-tagged antiscalants for a better understanding of scale inhibition mechanisms.

4. Conclusions

A novel 1,8-naphthalimide-tagged polyacrylate (PAA-F2) is synthesized and tested separately and joint with 1,8-naphthalimide-tagged bisphosphonate (HEDP-F) as a gypsum scale inhibitor within the frames of the NACE Standard TM0374-2007. It is found that at a dosage of 10 mg·dm−3 it provides a much higher inhibition efficacy (96%) than HEDP-F (32%). A PAA-F2 and HEDP-F blend (1:1 mass) has an intermediate efficacy (66%) and exhibits no synergism relative to its individual components.
The visualization of PAA-F2 revealed a paradoxical effect: an antiscalant causes modification of the CaSO4·2H2O crystals habit, but does not interact with them, forming particles of its own solid complexes [Ca-PAA-F2]. This paradox is interpreted in terms of the “nano/microdust” concept, prioritizing the bulk heterogeneous nucleation step, while an ability of the scale inhibitor to block the gypsum nucleus growth at the next steps is proved to be of secondary importance.
As opposed to PAA-F2, HEDP-F does not change the gypsum crystals morphology, although this antiscalant is completely located on the surface of the scale phase.
The PAA-F2 and HEDP-F blend reveals an accumulation of both antiscalants mostly in their own [Ca-PAA-F2/Ca-HEDP-F] phase with some traces of HEDP-F and PAA-F2 on the CaSO4·2H2O crystals surface. Notably, the primary sorption is realized by PAA-F2, while HEDP-F forms its layer over that one of PAA-F2. However, the blended antiscalant also causes modification of the CaSO4·2H2O crystals habit.
Although PAA-F2 and HEDP-F demonstrate different locations relative to the gypsum matrix, an antiscaling activity of both reagents can be explained by their competition with the calcium and sulfate species for heterogeneous nucleation centers—“nano/microdust”.
The visualization of two different antiscalants separately and jointly applied to gypsum deposition demonstrates a lack of causal relationship between antiscalant efficiency and scale particle habit modification. Finally, it is shown that the confocal microscopy of several fluorescent antiscalants blend is capable of providing unique information on their interrelationships during scale deposition.

Author Contributions

Conceptualization, M.O. and K.P.; methodology, A.R. and V.G.; software, S.F. and G.R.; validation, S.F., G.R.; formal analysis, S.T. and S.K.; investigation, S.F. (synthesis, SEM), G.R. (NACE Studies), A.R. (confocal microscopy), V.G. (NACE Studies, ICP-analysis, mass spectrometry), S.T. (Synthesis, Fluorescence, Optics) and S.K. (synthesis, NMR; X-Ray analysis); data curation, A.R. and V.G.; writing—original draft preparation, S.T. and K.P.; writing—review and editing, M.O. and K.P.; visualization, A.R.; supervision, K.P. and G.R.; project administration, M.O.; funding acquisition, M.O. All authors have read and agreed to the published version of the manuscript.

Funding

This research was funded by Russian Science Foundation, project no. 19-79-10220.

Acknowledgments

The authors would like to thank the Center for collective use no. 74834 “Technological and diagnostic center for the production, research and certification of micro and nanostructures” in GPI RAS for possibility to use its equipment.

Conflicts of Interest

The authors declare no conflict of interest.

References

  1. Li, X.; Shemer, H.; Hasson, D.; Semiat, R. Characterization of the effectiveness of anti-scalants in suppressing scale deposition on a heated surface. Desalination 2016, 397, 38–42. [Google Scholar] [CrossRef]
  2. Matin, A.; Rahman, F.; Shafi, H.Z.; Zubair, S.M. Scaling of reverse osmosis membranes used in water desalination: Phenomena, impact, and control; future directions. Desalination 2019, 455, 135–157. [Google Scholar] [CrossRef]
  3. Mady, M.F.; Fevang, S.; Kelland, M.A. Study of Novel Aromatic Aminomethylenephosphonates as Oilfield Scale Inhibitors. Energy Fuels 2018, 33, 228–237. [Google Scholar] [CrossRef]
  4. Hoang, T.A. Mechanisms of Scale Formation and Inhibition. Mineral Scales and Deposits, Scientific and Technological Approaches, 1st ed.; Elsevier: Amsterdam, The Netherlands, 2015; pp. 47–83. [Google Scholar]
  5. Amjad, Z. Scale inhibitor blends for industrial water systems. Mater. Perform. 2019, 58, 38–41. [Google Scholar]
  6. Amjad, Z.; Landgraf, R.; Penn, J. Calcium sulfate dihydrate (gypsum) scale inhibition by PAA, PAPEMP, and PAA/PAPEMP blend. Int. J. Corros. Scale Inhib. 2014, 3, 35–47. [Google Scholar] [CrossRef]
  7. Shaw, S.S.; Sorbie, K. Synergistic Properties of Phosphonate and Polymeric Scale-Inhibitor Blends for Barium Sulfate Scale Inhibition. SPE Prod. Oper. 2015, 30, 16–25. [Google Scholar] [CrossRef]
  8. Ou, H.-H.; Hsieh, L.-H.C. A synergistic effect of sodium gluconate and 2-phosphonobutane-1,2,4-tricarboxylic acid on the inhibition of CaCO 3 scaling formation. Powder Technol. 2016, 302, 160–167. [Google Scholar] [CrossRef]
  9. Oshchepkov, M.; Kamagurov, S.; Tkachenko, S.; Popov, K.; Ryabova, A. An Insight into the Mechanisms of the Scale Inhibition. A Case Study of a Novel Task-specific Fluorescent-tagged Scale Inhibitor Location on Gypsum Crystals. ChemNanoMat 2019, 5, 586–592. [Google Scholar] [CrossRef]
  10. Oshchepkov, M.; Golovesov, V.; Ryabova, A.; Tkachenko, S.; Redchuk, A.; Rönkkömäki, H.; Rudakova, G.; Pervov, A.; Popov, K. Visualization of a Novel Fluorescent-tagged Bisphosphonate in Reverse Osmosis Facility During Gypsum Brine Desalination. Sep. Sci. Technol. 2020, 255, 117382. [Google Scholar]
  11. Zhang, Z.; Lu, M.; Liu, J.; Chen, H.; Chen, Q.; Wang, B. Fluorescent-tagged hyper-branched polyester for inhibition of CaSO4 scale and the scale inhibition mechanism. Mater. Today Commun. 2020, 25, 101359. [Google Scholar] [CrossRef]
  12. Oshchepkov, M.; Golovesov, V.; Ryabova, A.; Redchuk, A.; Tkachenko, S.; Pervov, A.; Popov, K. Gypsum Crystallization during Reverse Osmosis Desalination of Water with High Sulfate Content in Presence of a Novel Fluorescent-Tagged Polyacrylate. Crystals 2020, 10, 309. [Google Scholar] [CrossRef] [Green Version]
  13. Asraf-Snir, M.; Gilron, J.; Oren, Y. Scaling of cation exchange membranes by gypsum during Donnan exchange and electrodialysis. J. Membr. Sci. 2018, 567, 28–38. [Google Scholar] [CrossRef]
  14. Rahman, F. Calcium sulfate precipitation studies with scale inhibitors for reverse osmosis desalination. Desalination 2013, 319, 79–84. [Google Scholar] [CrossRef]
  15. Akyol, E.; Oner, M.; Barouda, E.; Demadis, K.D. Systematic Structural Determinants of the Effects of Tetraphosphonates on Gypsum Crystallization. Cryst. Growth Des. 2009, 9, 5145–5154. [Google Scholar] [CrossRef]
  16. Benecke, J.; Rozova, J.; Ernst, M. Anti-scale effects of select organic macromolecules on gypsum bulk and surface crystallization during reverse osmosis desalination. Sep. Purif. Technol. 2018, 198, 68–78. [Google Scholar] [CrossRef]
  17. Van Driessche, A.; Stawski, T.; Kellermeier, M. Calcium sulfate precipitation pathways in natural and engineered environments. Chem. Geol. 2019, 530, 119274. [Google Scholar] [CrossRef]
  18. Prisciandaro, M.; Lancia, A.; Musmarra, D. Gypsum nucleation into sodium chloride solutions. AIChE J. 2001, 47, 929–934. [Google Scholar] [CrossRef]
  19. Rabizadeh, T.; Peacock, C.L.; Benning, L.G. Investigating the Effectiveness of Phosphonate Additives in Hindering the Calcium Sulfate Dihydrate Scale Formation. Ind. Eng. Chem. Res. 2020, 59, 14970–14980. [Google Scholar] [CrossRef]
  20. Konstantinova, T.N.; Miladinova, P.M. Synthesis and properties of some fluorescent 1,8-naphthalimide derivatives and their copolymers with methyl methacrylate. J. Appl. Polym. Sci. 2009, 111, 1991–1998. [Google Scholar] [CrossRef]
  21. Murakami, Y.; Yokoyama, Y.; Miura, T.; Hirasawa, H.; Kamimura, Y.; Izaki, M. p-Toluenesulfonic acid and cation exchange resin in aprotic Solvent: Valuable catalysts for fischer indolization. Heterocycles 1984, 22, 5. [Google Scholar] [CrossRef]
  22. Chen, H.; Tang, Y.; Shang, H.; Kong, X.; Guo, R.; Lin, W. Development of a Unique Family of Two-photon Full-colortunable Fluorescent Materials for Imaging in Live Subcellular Organelles, Cells, and Tissues. J. Mater. Chem. B 2017, 5, 2436–2444. [Google Scholar] [CrossRef] [PubMed]
  23. Oshchepkov, M.; Solovieva, I.; Menkov, A.; Tkachenko, S.; Udovenko, V.; Popov, K. Continuous flow microfluidic implementation of a fluorescent marker into a polyacrylate moiety. J. Flow Chem. 2020, 10, 545–550. [Google Scholar] [CrossRef]
  24. NACE TM0374-HD2001-SG, Laboratory Screening Tests to Determine the Ability of Scale Inhibitors to Prevent the Precipitation of Calcium Sulfate and Calcium Carbonate From Solution (For Oil And Gas Production Systems). Available online: https://www.onepetro.org/standard/NACE-TM0374-2015 (accessed on 1 November 2020).
  25. Raju, K.U.G.; Atkinson, G. The thermodynamics of “scale” mineral solubilities. 3. Calcium sulfate in aqueous sodium chloride. J. Chem. Eng. Data 1990, 35, 361–367. [Google Scholar] [CrossRef]
  26. Pettit, L.D. Ionic Strength Corrections for Stability Constants using Specific Interaction Theory (SIT) for Windows 9x, NT, 2000, and xp, Academic Software; IUPAC: Zürich, Switzerland, 2003. [Google Scholar]
  27. Popov, K.I.; Oshchepkov, M.S.; Kamagurov, S.; Tkachenko, S.; Dikareva, J.; Rudakova, G. Synthesis and properties of novel fluorescent-tagged polyacrylate-based scale inhibitors. J. Appl. Polym. Sci. 2017, 134, 159. [Google Scholar] [CrossRef]
  28. Popov, K.I.; Rudakova, G.; Larchenko, V.; Tusheva, M.; Kamagurov, S.; Dikareva, J.; Kovaleva, N. A Comparative Performance Evaluation of Some Novel “Green” and Traditional Antiscalants in Calcium Sulfate Scaling. Adv. Mater. Sci. Eng. 2016, 2016, 1–10. [Google Scholar] [CrossRef] [Green Version]
  29. Popov, K.; Oshchepkov, M.; Kovalenko, A.; Redchuk, A.; Dikareva, J.; Pochitalkina, I. The Scale Nucleation Natural Precursors: A Case Study of “Micro/Nanodust” Impurities Nature in Laboratory Water Samples, obtained from Moscow TAP Water. Int. J. Corros. Scale Inhib. 2020, 9, 1097–1112. [Google Scholar]
  30. Antony, A.; Low, J.H.; Gray, S.; Childress, A.E.; Le-Clech, P.; Leslie, G. Scale formation and control in high pressure membrane water treatment systems: A review. J. Membr. Sci. 2011, 383, 1–16. [Google Scholar] [CrossRef]
  31. Ang, H.M.; Muryanto, S.; Hoang, T. Gypsum Scale Formation Control in Pipe Flow Systems: A Systematic Study on the Effects of Process Parameters and Additives. In Gypsum: Properties, Production and Applications; Sampson, D.H., Ed.; Nova Science Publishers, Inc.: Hauppauge, NY, USA, 2011; pp. 1–33. [Google Scholar]
  32. Sheng, K.; Ge, H.; Huang, X.; Zhang, Y.; Song, Y.; Ge, F.; Zhao, Y.; Meng, X. Formation and inhibition of calcium carbonate crystals under cathodic polarization conditions. Crystals 2020, 10, 275. [Google Scholar] [CrossRef] [Green Version]
Figure 1. Photographs of aqueous solutions of the scale inhibitor’s HEDP-F, PAA-F-1, and PAA-F2 with a concentration of 5 mg/L under visible (a) and UV light (b), and chemical structures (c) of antiscalants (fluorescent fragment constitutes 1% mass of PAAF1 and PAA-F2).
Crystals 10 00992 g001
Figure 2. General scheme of 5-allyl-9-(4-(dimethylamino)styryl)-8,8-dimethylbenzo[de]pyrrolo [2,3-g]isoquinoline-4,6(5H,8H)-dione (4) synthesis.
Crystals 10 00992 g002
Figure 3. Scheme of the microflow 1,8-naphthalimide-tagged polyacrylate (PAA-F2) synthesis.
Crystals 10 00992 g003
Figure 4. Excitation and emission spectra of PAA-F2 in H2O (0.39 mg·mL−1) at 25 °C.
Crystals 10 00992 g004
Figure 5. Fluorescent images of the liquid phase of 0.038 mol·dm−3 CaCl2 solution with 10 mg·dm−3 PAA-F2 after 24 h thermal treatment. Scale marker corresponds to 10 µm.
Crystals 10 00992 g005
Figure 6. Fluorescent images of the liquid phase of a gypsum solution with 10 mg·dm−3 HEDP-F after 24 h thermal treatment by the NACE Standard (ac) and SEM image of CaSO4·2H2O crystals, isolated within the blank experiment in the absence of antiscalant (d). Scale marker corresponds to 100 µm.
Crystals 10 00992 g006
Figure 7. Fluorescent images of the liquid phase of a gypsum solution with 10 mg⋅dm−3 PAA-F2 obtained within the NACE Standard treatment, and taken 1 day (a,b) and 10 days (c,d) after the experiment. Scale marker corresponds to 100 µm.
Crystals 10 00992 g007
Figure 8. Fluorescent images of the liquid phase of a gypsum solution with 10 mg·dm−3 PAA-F2/HEDP-F blend (1:1 mass) after 24 h thermal treatment (NACE Standard), obtained by a superposition of three channels detection modes (HEDP-F—blue, PAA-F2—green, and transmitted laser light—grey) taken at different points (ad). Scale marker corresponds to 100 µm.
Crystals 10 00992 g008
Figure 9. A typical fluorescent image of the liquid phase of a gypsum solution with 10 mg·dm−3 PAA-F2/HEDP-F blend (1:1 mass) taken at two points (1 and 2) after 24 h thermal treatment (NACE Standard), obtained by a superposition of three channels detection modes (a1, a2) and with channels decomposition: blue (b1, b2), green (c1, c2) and in transmitted laser light—grey (d1, d2). Scale marker corresponds to 100 µm.
Crystals 10 00992 g009
Figure 10. Fluorescent 3D image of the liquid phase of a gypsum solution with 10 mg·dm−3 PAA-F2/HEDP-F blend (1:1 mass) after 24 h thermal treatment (NACE Standard), obtained by the spectral-resolved fluorescent recording coupled with a linear unmixing of fluorescent signal: a HEDP-F spectral signal (blue, a); a PAA-F2 spectral signal (green, b); and a superposition of both channels (c). Scale marker corresponds to 50 µm.
Crystals 10 00992 g010
Table 1. Fluorescent efficiency of antiscalants.
Antiscalantλmaxabs, nmλmaxfl, nmΦflRef
HEDP-F3754600.86[9]
PAA-F13754650.69[27]
PAA-F24225050.47Present work
Table 2. Gypsum scale formation inhibition efficacy of fluorescent-tagged antiscalants tested by the NACE Standard.
AntiscalantDosage, mg·dm−3Gypsum Scale Inhibition, %Ref.
HEDP-F2578 ± 9[9]
1032 ± 8Present work
PAA-F21096 ± 4Present work
PAA-F2/HEDP-F Blend1066 ± 5Present work
HEDP-F5
PAA-F25
Publisher’s Note: MDPI stays neutral with regard to jurisdictional claims in published maps and institutional affiliations.

