Article

Mathematical Modeling of Plastic Deformation of a Tube from Dispersion-Hardened Aluminum Alloy in an Inhomogeneous Temperature Field

by
Oleg Matvienko
1,2,*,
Olga Daneyko
1,2 and
Tatiana Kovalevskaya
1,2
1
Tomsk State University of Architecture and Building, 634003 Tomsk, Russia
2
National Research Tomsk State University, 634050 Tomsk, Russia
*
Author to whom correspondence should be addressed.
Crystals 2020, 10(12), 1103; https://doi.org/10.3390/cryst10121103
Submission received: 20 October 2020 / Revised: 29 November 2020 / Accepted: 30 November 2020 / Published: 2 December 2020
(This article belongs to the Special Issue Crystal Plasticity)

Abstract

:
The effect of temperature distribution on a stress–strain state tube made of disperse-hardened aluminum alloy subjected to internal pressure was investigated. The mathematical model is based on equations of physical plasticity theory and principles of mechanics of deformable solids. The results of this investigation demonstrate that varying the outer wall temperature in the range of 200 K at a fixed temperature of the inner wall leads to a significant change in the plastic resistance limit (for the considered tube sizes, this change is approximately 15%). An increase of the tube wall temperature reduces the resistance to plastic deformation. For the same absolute temperature difference between the outer and inner walls, the plastic resistance limit is less for the higher temperature of the inner wall of the tube. A decrease of the distances between the hardening particles at the same volume fraction of second phase leads to a significant increase in the pressure required to achieve plastic deformation of the tube walls. An increase in tube wall temperature reduces the resistance to plastic deformation. For the same absolute temperature difference between the outer and inner walls, the plastic resistance limit is lower for the higher temperature of the inner tube wall. The decrease of the distance between the hardening particles at the same volume fraction of the second phase leads to a significant increase in the pressure required to achieve plastic deformation of the tube walls.

1. Introduction

A heat exchanger is a device designed to transfer heat from one medium to another in the most efficient way [1]. Heat exchangers, consisting of tube bundles, are widely used in various industries. Heat exchangers are extensively used in power engineering, automotive industry, aviation and space industry and also in household applications (air condition, space heating and refrigeration) [2].
In [3], the mechanical properties of a heat exchange tube made of hardening materials have been comprehensively investigated. In [4,5] von Mises yield criteria and Hencky deformation theory were applied to determine the stress state of the heat exchange tube. In order to simplify the dependence on the stresses from strains, in [5] a bilinear model has been proposed. The simplified bilinear model of the stress–strain curve consists of two straight lines with different slopes. The slope of the first line characterizes the elastic modulus of the material. The slope of the second line reflects the hardening properties of the material.
Numerous studies on the elastic–plastic behavior of pipes subjected to internal pressure have led to development of theories for predicting the tubes’ burst failure [6,7,8].
Comparison of the stress state of the steel pipe under the action of constant pressure applied (separately and simultaneously) to the outer and inner tube walls was performed in [9]. The action of pressure on the outer cylindrical surface of the pipe leads to maximum stress of material. The outer and inner layers of the pipe material are subjected to 85% compression strain when two loads are simultaneously applied.
The authors of [10] presented two stress–strain models based on the theory of shells to describe the stress–strain relationship in the cross-section of a coiled tube. Membrane theory of shells of revolution applied to an elliptic torus has been proven to be a good approach for the axial strain description but inaccurate with regard to circumferential strain. In order to assess the bending effect and correct circumferential strains, a semi-empiric method has been proposed to determine an empiric law relating to the ellipse focal distance with pipe inner pressure.
Zhu and Leis investigated the plastic flow and the elastic–plastic deformation of tubes, which is based on the maximum shear stresses principle [11,12].
In [13], the authors presented evaluation of the stress–strain state and areas of stress concentration accounting for detection of different loads. The finite element model is presented to determine the pipeline sections in the pre-emergency state. Strength analysis of the pipeline showed that buckling or sagging of its sections leads to unallowable stresses. Large pipeline sagging induces plastic deformation.
In [14], plastic deformation induced by unsteady pressure gradients in fluid-filled pipes was investigated. The general expression for waves induced by plastic deformation is derived.
The effect of internal pressure on radial strain of a steel pipe, subjected to monotonic and cyclic loading, was analyzed in [15]. The behavior of circular long tubes subjected to external pressure and axial load under plane strain in conjunction with the constitutive equation taking into account corner formation on the yield surface and the Bauschinger effect are analyzed in [16].
It should also be noted that the main trends of engineering development are use of new materials that significantly increase the specific power of units. Mechanical properties of materials may be improved by dispersion hardening [17,18]. Dispersion-hardened alloys contain fine, submicron and nanoscale particles of another material distributed in the matrix. In such alloys, the matrix assumes most of the load. Due to the large number of insoluble particles in the matrix, a structure resistant to plastic deformation is formed [19].
The dispersed hardening particles of the strengthening phase resist dislocation motion during material loading. Consequently, the strength of material depends on the dislocation structure that forms during plastic deformation. The basic principles of physical theory of plasticity and strain hardening were formulated by Orowan [20], Ashby [21,22], Hirsch [23,24,25] and Humphreys [26,27,28]. In [29,30,31], based on physical plasticity theory, a mathematical model was developed, and investigations of elastoplastic deformation of the tube made from disperse-hardened alloys were carried out.
The effect of internal and external pressure applied to the tube from dispersion-hardened aluminum alloy was investigated in [32,33,34]. The results of the investigation demonstrate that hardening of the alloy by nanoparticles significantly improves the strength characteristics of the material.
Understanding the heat transfer condition effect on the stress–strain state of the heat exchanger walls is important because the strength properties are dependent on temperature. Thus, it is necessary to evaluate the effect of the temperature field on the stress–strain state of heat exchangers to improve their efficiency and reliability.
The present work is devoted to modeling of plastic deformation of a tube subjected to uniform internal pressure in the inhomogeneous temperature field. It is assumed that the tube is made of an Al-based alloy with incoherent spherical nondeformable nanoparticles.
The mathematical model is based on equations of the balance of the defect structure [35,36,37] and principles of mechanics of deformable solids [38,39,40]. In this paper, to study the stress state of the tube made from aluminum alloy strengthened by nanoparticles, numerical simulation was used. This is because the investigated problem is nonlinear as the tensile strength, yield strength and Young’s modulus depend on temperature.

2. Methods

2.1. Mathematical Model of Plastic Deformations

The strength and plasticity of composite materials are highly dependent on the structural condition of the materials. Therefore, to predict mechanical properties of materials it is necessary to take into account evolution of the defect structure of materials, namely, generation of defects during plastic deformation, their mutual transformation and annihilation. Kovalevskaya et al. proposed a mathematical model describing plastic deformation of dispersion-strengthened metals [41]. This model is based on concepts of hardening and rest. Physical mechanisms underlying the mathematical model of plastic deformation of disperse-hardened alloys with incoherent particles are described in [42,43].
Presence of a disperse-hardening phase in the material makes the modeling object much more complex than single-phase materials. In the process of plastic deformation, interaction of dislocations with particles leads to formation of new elements of the dislocation structure, which leads to hardening of the material [43,44].
The following types of defects are formed during plastic deformation in FCC alloys with incoherent nanoparticles: shear-forming dislocations with density ( ρ m ), prismatic dislocation loops of vacancy ( ρ p v ) and interstitial types ( ρ p i ), dislocation dipoles of vacancy ( ρ d v ) and interstitial types ( ρ d i ), interstitial atoms with concentration ( c i ), monovacancies ( c v ) and bivacancies ( c 2 v ). The start of formation of dipole structures is determined by the achievement of a critical dislocation density [43], the value of which depends on the scale characteristics of the hardening phase [42,43].
The mathematical model includes balance equations for deformation due to line and point defects with regard to generation and annihilation of all types of defects. Generation and annihilation of prismatic dislocation loops occur near incoherent strengthening particles. The model takes into account the deposition of point defects on dislocations, which can lead to both annihilation of dislocations of various types and an increase in their density. The possibility of transition of dislocations in prismatic loops and in dipole configurations to shear dislocations is also taken into account.
The model assumes that the matrix material of the dispersion-hardened alloy is pure aluminum, particles of the hardening phase are nondeformable, and the distance between them does not change during plastic deformation at all temperatures.
The mathematical model uses the following balance equations of the defect dislocation structure [36,45]:
d ρ m d a   =   ( 1     ω s P a s ) F D b     2 b a ˙ ( 1     ω s ) ρ m 2 min ( r a ,   ρ m 1 / 2 ) ( c 2 v Q 2 v   +   c 1 v Q 1 v   +   c i Q i )   + +   2 b a ˙ α ρ ( ρ p v ( c 1 v Q 1 v   + c 2 v Q 2 v )   +   ρ p i c i Q i )   +   2 b a ˙ r a ( ρ d i c i Q i   +   ρ d v ( c 1 v Q 1 v   +   c 2 v Q 2 v ) ) ,
d ρ p i d a   =   < χ > δ 2 Λ p 2 b     2 α a ˙ ρ ρ p i b ( 2 c 2 v Q 2 v   +   c i Q i   +   2 c 1 v Q 1 v ) ,
d ρ p v d a   =   < χ > δ 2 Λ p 2 b     2 α a ˙ ρ ρ p v b ( c 2 v Q 2 v   +   2 c i Q i   +   c 1 v Q 1 v ) ,
d ρ d v d a   =   1 Λ p b     2 b a ˙ r a ρ d v ( c 2 v Q 2 v   +   c i Q i   +   c 1 v Q 1 v )
d ρ d i d a   =   1 Λ p b     2 b a ˙ r a ρ d i ( c 2 v Q 2 v   +   c i Q i   +   c 1 v Q 1 v ) ,
d c i d a   =   q τ dyn G     c i a ˙ [ ( ( 1     ω s ) ρ m   +   ρ p   +   ρ d ) b 2 Q i   +   Q 1 v c 1 v   +   Q 2 v c 2 v   + Q i ( c 1 v   +   c 2 v ) ] ,
d c 1 v d a   =   q τ dyn 6 G     1 a ˙ [ ( ( ( 1     ω s ) ρ m   +   ρ p   +   ρ d ) b 2   + c i   +   c 1 v )   Q 1 v c 1 v   +   + Q i c i c 1 v     ( Q 2 v   +   Q i ) c i   c 2 v ] ,
d c 2 v d a   =   5 q τ dyn 6 G     1 a ˙ [ ( ( ( 1     ω s ) ρ m     +   ρ p + ρ d ) b 2   + c i   )   Q 2 v c 2 v   +   Q i c i c 2 v     Q 1 v c 1 v 2 ] ,
a ˙   =   8 π   τ 3 ( ( ( 1     β r ) ρ m   +   ρ p   +   ρ d ) ( τ     τ a ) ) 1 / 3 G 4 / 3 b 1 / 3 ( τ 2     G 2 b 2 ξ β r ρ m ) ρ m 1 / 2 × × v D B β r 1 / 2 ξ 1 / 6 F ( 1     β r ) exp [     0.2 G b 3     ( τ     τ a ) Λ b 2 k T ] .
Here, a is the shear deformation; a ˙ is the strain rate; b is the Burgers vector module; F is a dimensionless geometric parameter which characterizes the shape of the shear zone and connects its diameter, perimeter and area; D is the diameter of the shear zone; P a s is the probable annihilation of screw dislocations; τ dyn is the excess stress over static resistance to the dislocation movement; Q j = Z j ν D exp ( U j ( m ) / k T ) is the kinetic coefficient; U j ( m ) is the activation energy of the j-th type point defect migration; Zj is the number of places for the j-th type point defect jump (j = i, v); νD is the Debye frequency; k is the Boltzmann constant; T is the temperature of deformation; ω s is the fraction of screw dislocations; <χ> is the ratio of the average length of dislocations accumulated on the particles to the particle size; Λ p is the distance between hardening particles; δ is the particle diameter; q is the intensity of point defect generation; G is the shear modulus; ρ is the dislocations density; α is the coefficient of the interaction between dislocations; ξ is the forest dislocation fraction; ρ p = ρ p i + ρ p v is the density of prismatic dislocation loops; ρ d = ρ d i + ρ d v is the dislocation density in dipole configurations; β r is the reacting dislocation fraction; Λ is the average length of free dislocation segment and r a is the effective capture radius:
r a = G b 4 π τ f ( 2 ν ) ( 1 ν )
Here, τ f is the friction stress; ν is the Poisson’s ratio.
The athermal resistance ( τ a ) to the dislocation movement in the disperse-hardened alloy with incoherent particles is the sum of the friction stress, τ f , the interaction between forest dislocations, τd, and the stress of particle bypass, τ O r , i.e., τ a = τ f + τ d + τ O r .
The intensity of the processes of annihilation of linear defects is determined by the strain rate, which is related to the applied stress and dislocation density by relation, Equation (9). The investigation was conducted for deformation with a constant strain rate. Therefore, Equation (9) is not differential. This is a transcendental equation that allows us to find the value of the applied stress.
It is necessary to set the initial values of the point defect concentrations and dislocation densities for solution of the system of ordinary differential equations that describe the balance of linear and point deformation defects. The former corresponds to a concentration of thermodynamically balanced point defects at a given temperature, whereas the latter corresponds to the unstrained state of the crystal. Under the condition a = 0 , it is assumed that there are no dislocation prismatic loops and dipole configurations in the crystal, i.e., c i ( 0 ) = exp U i f / k T , c v ( 0 ) = exp U v f / k T , c 2 v ( 0 ) =   exp U 2 v f / k T , ρ m ( 0 ) = 10 12 m−2 and ρ p ( 0 ) = ρ d ( 0 ) = 0 .
The calculations are carried out at the following parameter values for disperse-hardened Al-based alloys [43,45]: F = 4, <χ> = 4, α = 0.5, β r = 0.14, ξ = 0.5, ω s = 0.3, τ f = 10 MPa, U v f = 1.26 eV, U 2 v f = 2.16 eV, U i f = 3.28 eV, U v m = 0.88 eV, U 2 v m = 0.69 eV, U i m = 0.117 eV and b = 2.5·10−10 m.

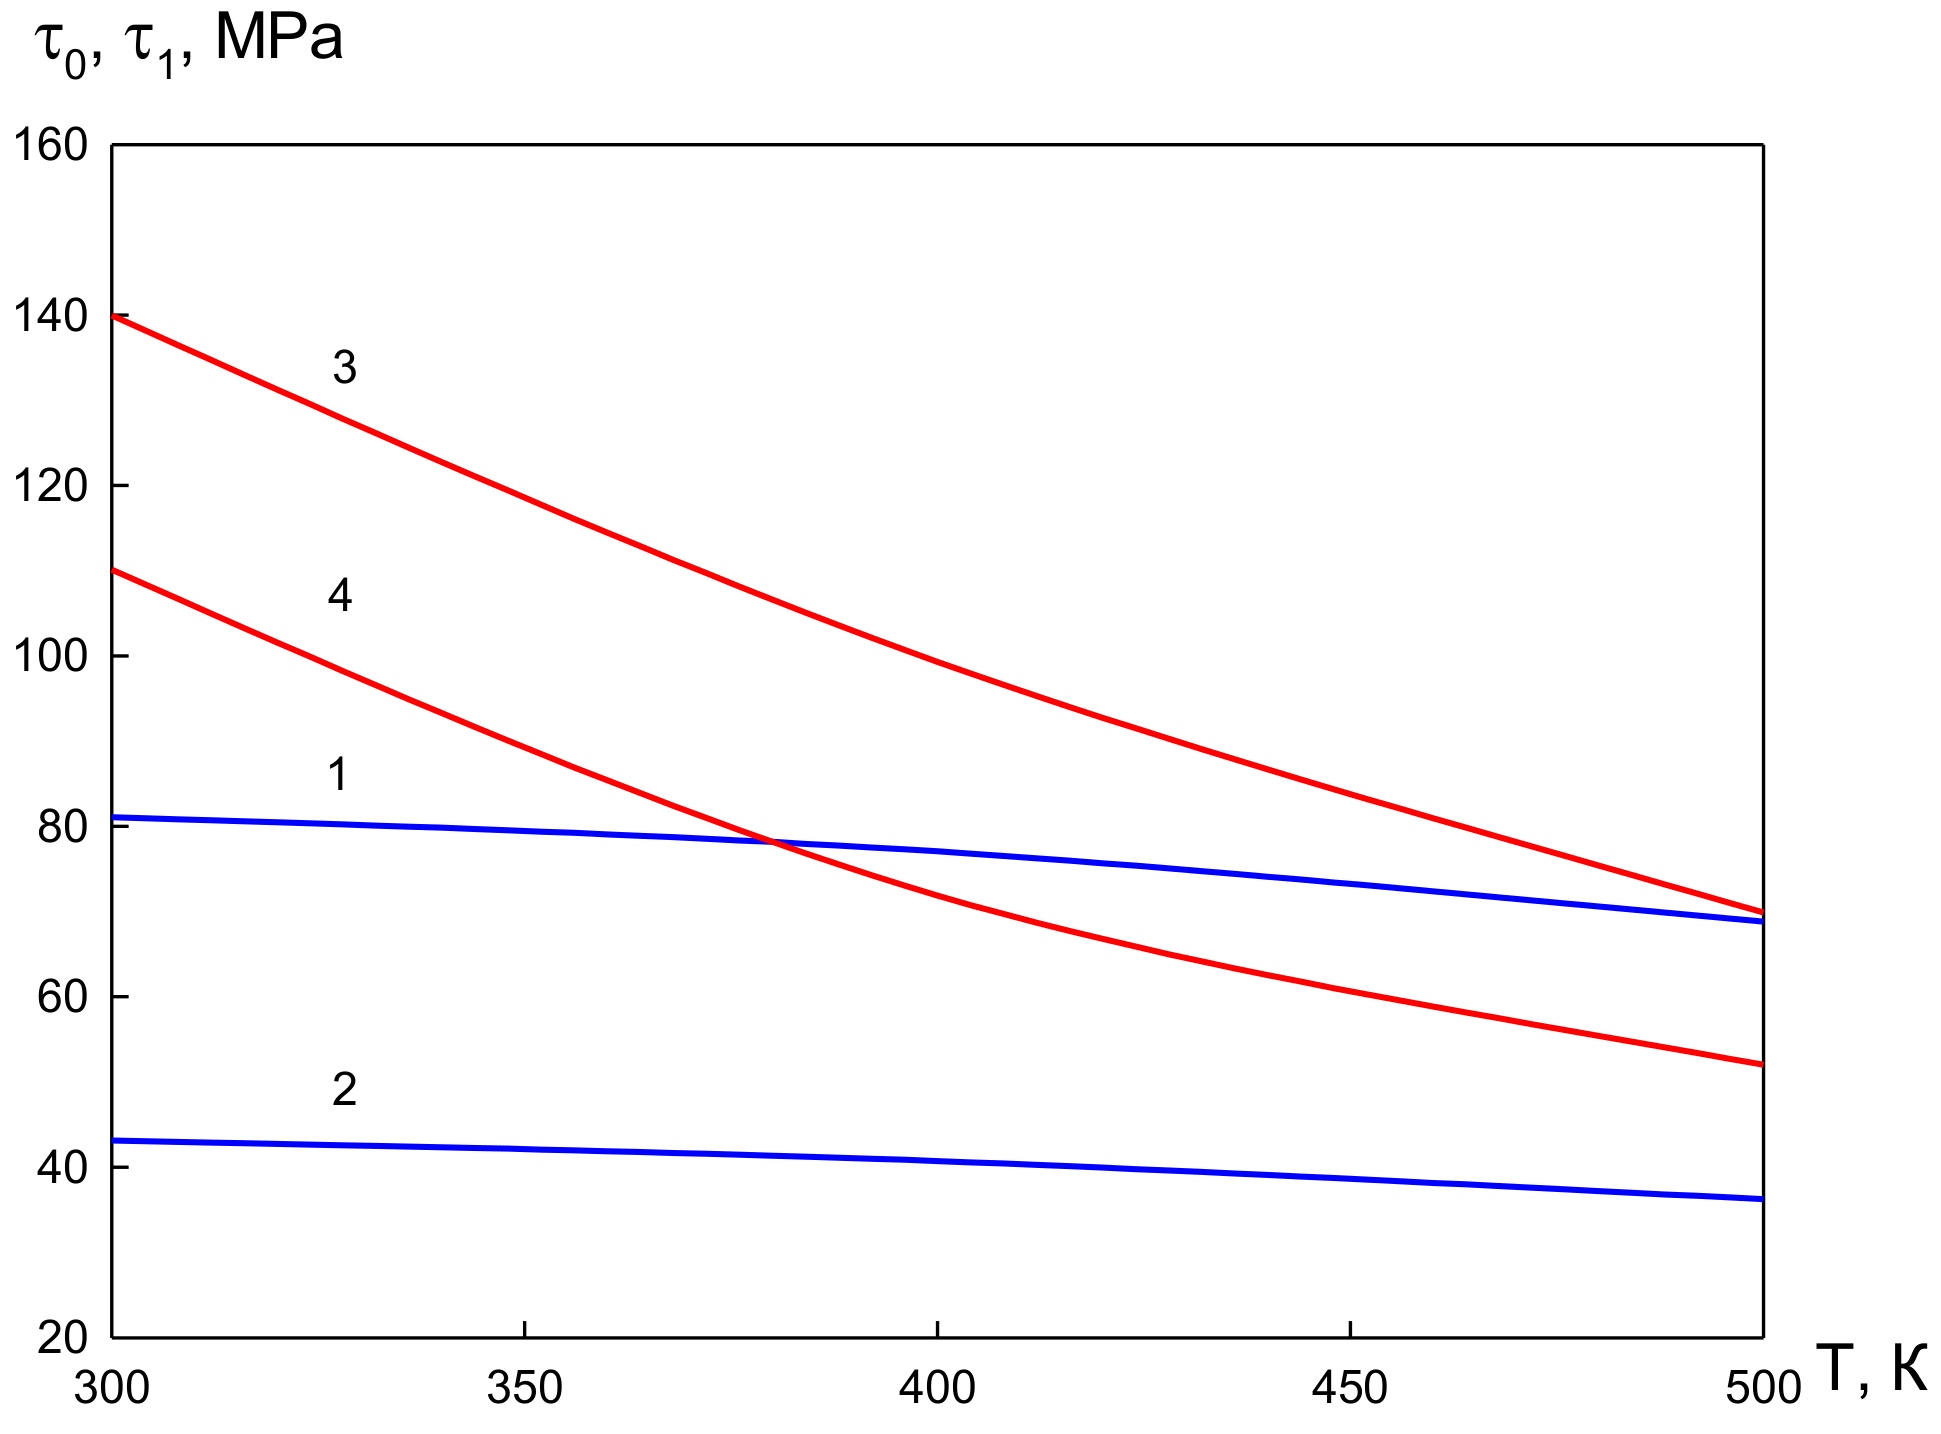
2.2. Elastoplastic Material Properties

Aluminum alloys are known for their good specific strength and corrosion resistance. Dispersion-hardened aluminum alloys consist of a coarse-grained aluminum matrix containing populations of particle Al2O3. Incoherent dispersoids distributed within a metallic matrix provide high strength at ambient and elevated temperatures, as they impede dislocation glide. Use of coarsening-resistant submicron dispersoids such as Al2O3 allows for dispersion-strengthened aluminum with creep resistance at high temperatures (500 °C and above).
Experimental studies [46] show that hardening of aluminum alloys with dispersed particles weakly affects the moduli of elasticity and shear. However, alloy properties depend on temperature. To describe the temperature dependence of the shear modulus, Bell’s formula can be used [46,47,48]:
G = G 0 at T < 0.06 T m G 1 1 T 2 T m at 0.06 T m < T < 0.57 T m .
In Equation (10), T m = 933 K is the melting temperature; G 0 = 35.017 GPa and G 1 = 36.1 GPa are parameters that characterize the elastic properties of aluminum.
The results of an investigation based on the solution of Equations (1)–(9) show that strain hardening of Al-based materials with an incoherent strengthening phase for the same volume fraction increases with decreasing particle size and the distance between them at all deformation temperatures. An investigation of the effect of the scale characteristics of the strengthening phase on the strain hardening of aluminum-based materials with an incoherent strengthening phase showed that dislocation dipoles are not formed throughout the entire process of plastic deformation in a material with nanosized particles. There is a decrease of shear-forming dislocation density and dislocation density in the prismatic loops (both vacancy and interstitial type) with an increase of deformation temperature (Figure 1).
Figure 2 presents dependences between the flow stresses, τ , and plastic deformation, a pl = a τ 0 / G , of the aluminum-based alloy strengthened with incoherent nanoparticles Al2O3.
Plastic deformation starts when the stress intensity in the material is equal to the yield shear stress. Hardening curves are characterized by a monotonic dependence between flow stress and deformation (Figure 2). At low values of plastic deformation, a pl , a significant increase of flow stress values occur. At high a pl values, the stress–strain curve has a horizontal asymptote matching the yield point at τ = τ . The simulation results predict that hardening of the material by nanoparticles significantly changes the strength characteristics of the material. A decrease of the distance between particles for the same volume fraction of the hardening phase at the same temperature leads to increasing of the flow stress (see curves 1 and 4, 2 and 5, and 3 and 6), which means hardening of the material. With increasing temperature, the material becomes more plastic, which is accompanied by decreasing of the flow stress (see curves 1–3 and 4–6).
Approximation of the obtained balance between the elements of deformation defects and dependence of the flow stress on the deformation degree allows us to obtain the function of τ a with an error not exceeding 0.1%:
τ = τ 0 + τ 1 a τ 0 / G a * + a ,
where τ 0 is the yield stress, τ 1 = τ τ 0 is the hardening stress, which characterizes the maximum increase of flow stress during plastic deformation, and a * is an empirical parameter that determines the rate at which the flow curve reaches the asymptote.
Figure 3 shows the temperature dependence of the yield stress, τ 0 , and hardening stress, τ 1 , calculated for various parameters of the strengthening phase. The simulation results show that with increasing temperature the yield stress, τ 0 , decreases (see curves 1 and 2). This means that with increasing temperature, the alloy becomes more plastic because plastic deformation occurs at lower stresses. In addition, a decrease of the hardening stress, τ 1 , with increasing temperature (see curves 3 and 4) indicates a weakening of the ability of the material to plastic hardening. An increase in the distance between the strengthening particles at the same volume fraction leads to a decrease of the yield stress, τ 0 (see curves 1 and 2), and hardening stress, τ 1 (see curves 3 and 4).
In the considered temperature range ( 293 K T 493 K ), the dependences τ 0 and τ 1 can be approximated by the correlations:
τ 0 τ 0 * = C 00 + C 01 T 0 T + C 02 T 0 2 T 2 ,
τ 1 τ 1 * = C 10 + C 11 T 0 T + C 12 T 0 2 T 2
In Equations (12) and (13) τ 0 * and τ 1 * are the yield stress and hardening stress at temperature, T 0 = 293 K. The approximation parameters have the following values: C 00 = 0.8665 , C 01 = 0.3479 , C 02 = 0.2144 , C 10 = 2.9817 , C 11 = 2.7000 and C 12 = 0.7183 .
The values of the material constants: τ 0 * , τ 1 * and a * for various sizes, δ , of hardening particles and the distances between the particles, Λ p , are presented in Table 1.

2.3. Verification of the Results

Verification of the results was carried out by comparison with experimental data presented in previous work [49,50]. Table 2 presents the mechanical properties of the aluminum alloy A356 containing scandium fluoride particles.
Table 2 shows both experimental results, which are presented in [50], and theoretical predictions of the yield stress, τ 0 , and the hardening stress, τ 1 . By comparing the experimental and theoretical values, one can see that, in general, the results of the predictions are fairly close to the experimental data. The good correlation between the experimental measurements and simulations results proved the correct methods and approaches for the simulation of processes of plastic deformation.

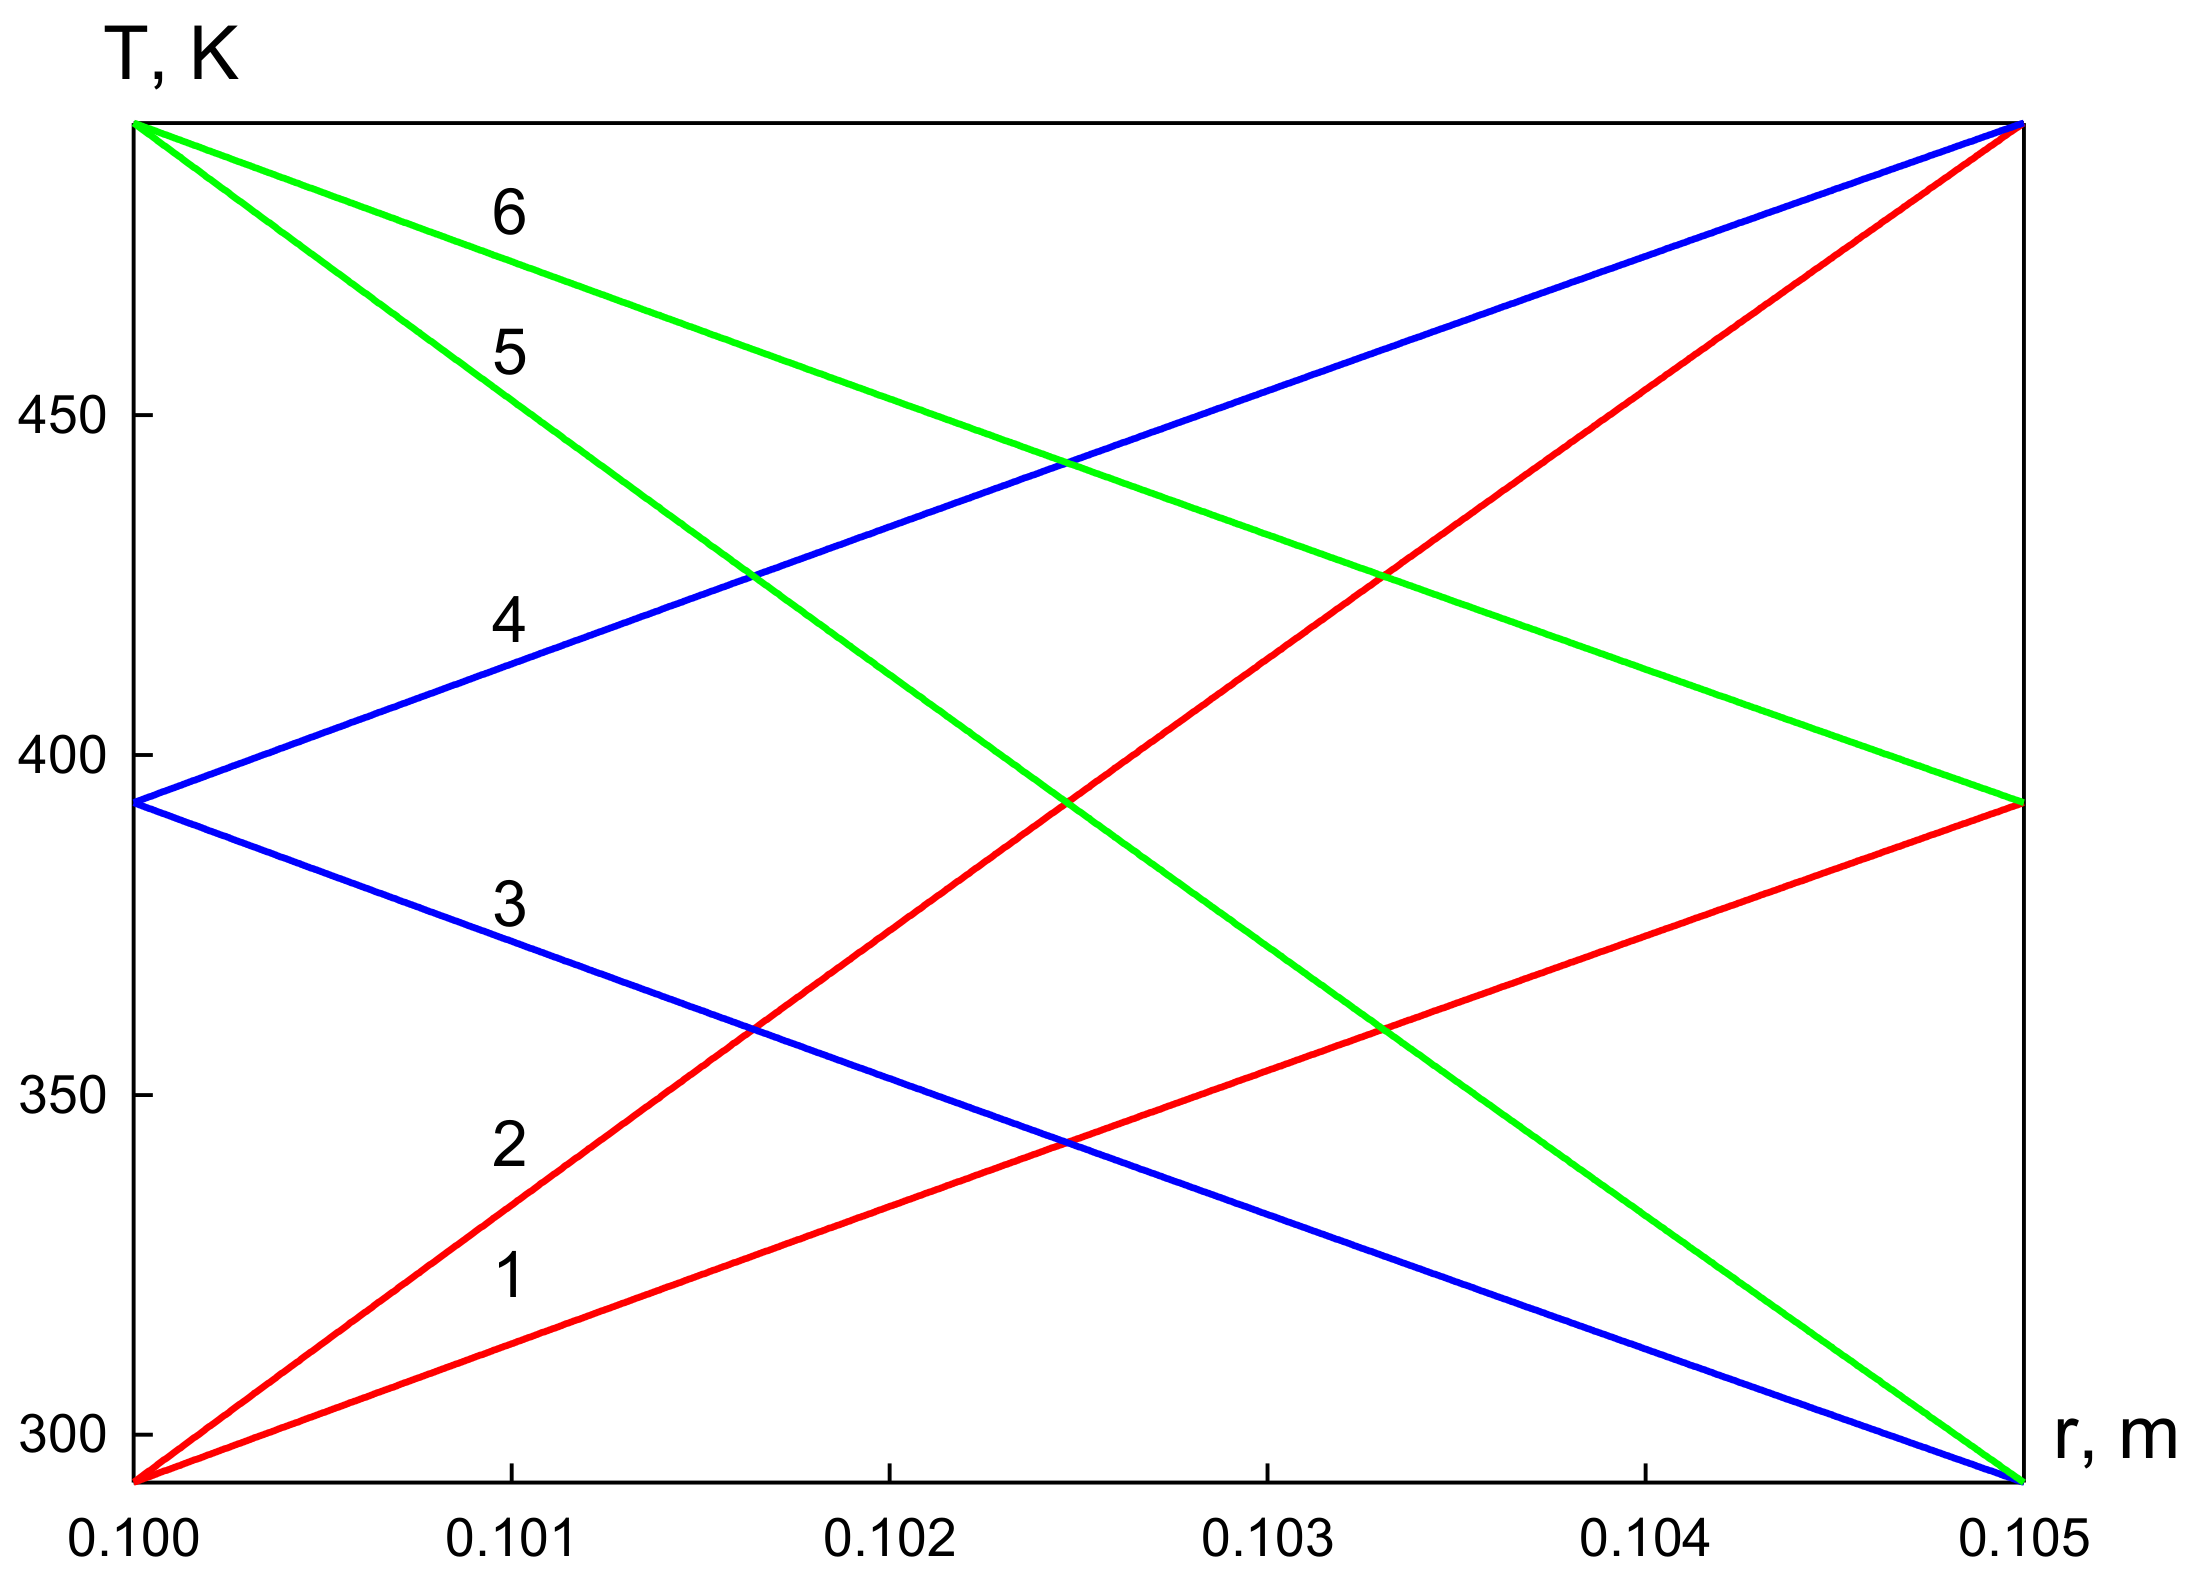
2.4. Temperature Distribution in the Tube Wall

To model the heat transfer, we will assume that the inner wall of the tube ( r = R in ) has a constant temperature, T = T in , and the external wall ( r = R ex ), T = T ex . Note that if the end walls of the tube are thermally insulated, then the temperature distribution will not depend on the axial coordinate z . In addition, due to the axial symmetry of the problem under consideration, the temperature will not depend on the angular coordinate φ . Thus, the heat transfer equation can be written as:
1 r r r T r = 0 .
The boundary conditions can be formulated as:
r = R in :   T = T in ;   r = R ex :   T = T ex
Integration of Equation (14) with boundary conditions, Equation (15), allows us to determine the dependence of temperature on the radial coordinate
T = T in + T ex T in ln r ln R in ln R ex ln R in
Figure 4 shows the temperature distribution over the tube wall thickness for various values of T in and T ex . As can be seen from the figures, this distribution is linear and can be approximated by the dependence:
T = T i n + Δ T h r R i n ,
The analysis showed that the approximation error of Equation (16) increases with an increase in the absolute temperature difference between the external T ex and internal T in walls, and with an increase in the relative wall thickness R ex R in / R in . However, in the considered range of temperature changes, T ex T in / T in < 0.7 , the linear approximation error does not exceed 1.2%. Thus, to calculate the stress–strain state of the tube walls, we will use dependence, Equation (17).

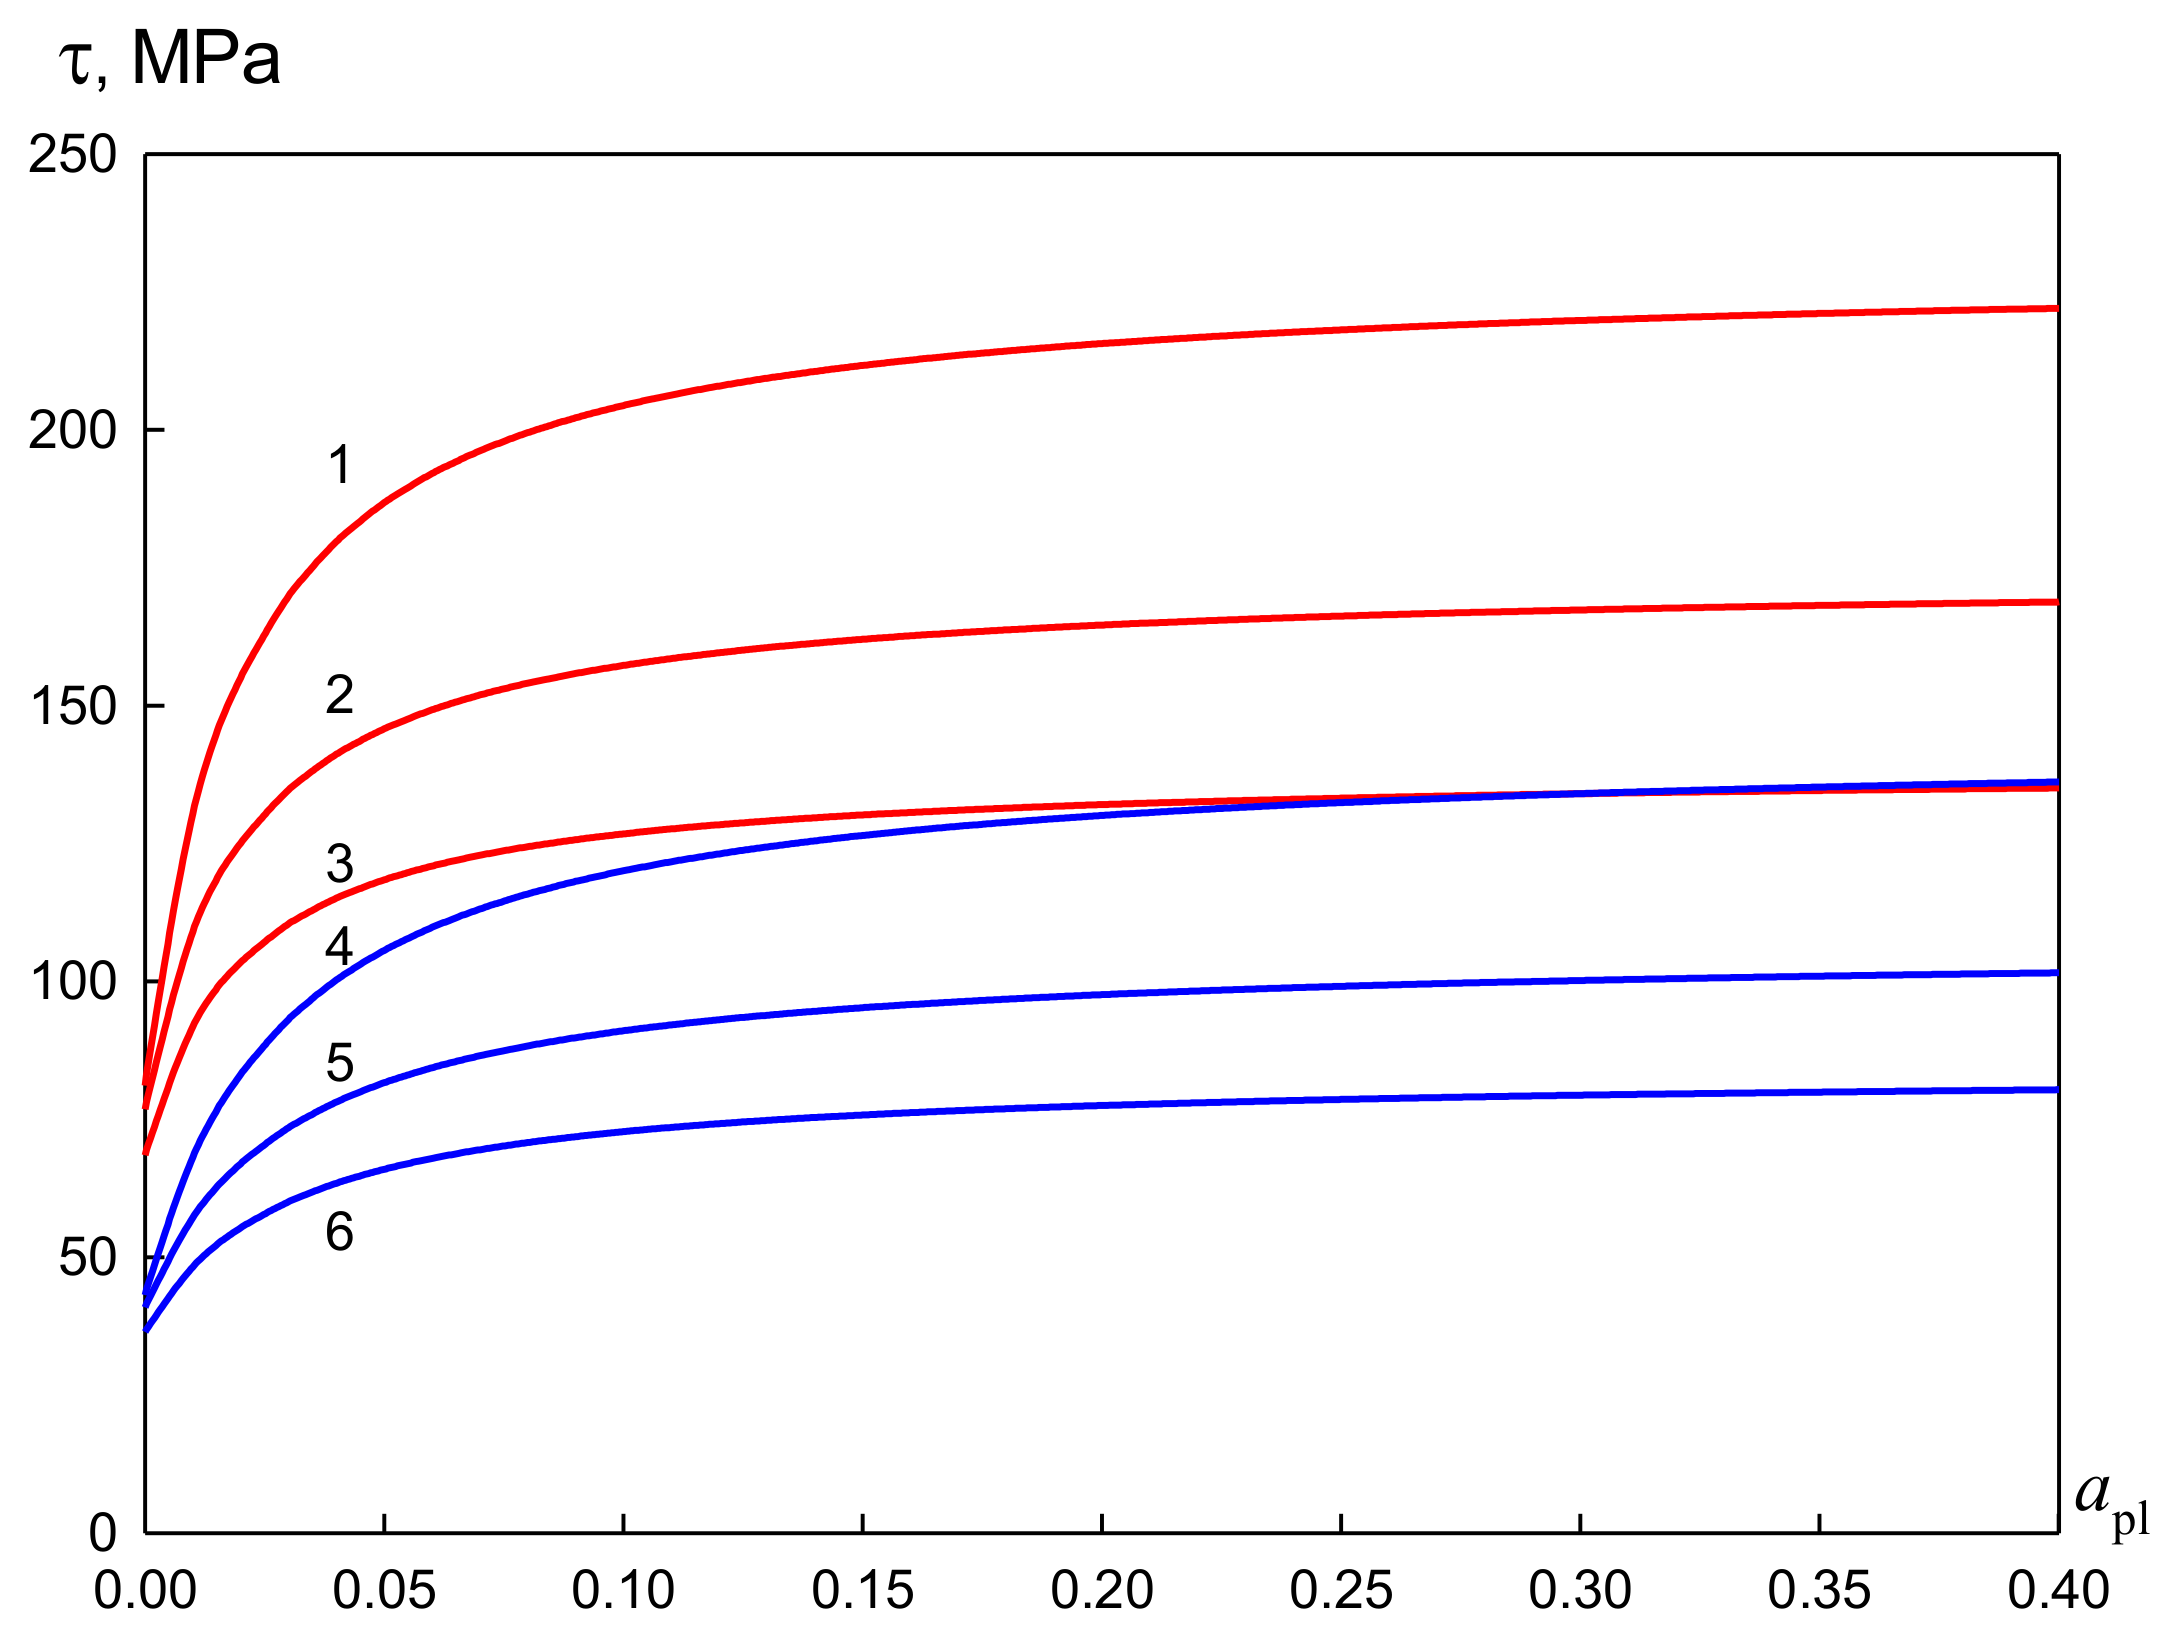
2.5. Stresses in Tube Walls

Let us consider the stress–strain state of the tube loaded by the internal pressure when the temperature of its inner and outer walls has different values (Figure 5). A mathematical model of the stress–strain state includes the equilibrium equations and relations between deformations and displacements and also between stresses and deformations. According to Timoshenko and Goodier [40], the balance of radial stresses can be described subject to axial symmetry and flat deformation [48,51] by the following equation:
σ r r r + σ r r σ φ φ r = 0
The boundary conditions for Equation (18) can be written as:
r = R i n :   σ r r = p i n ;   r = R e x :   σ r r = 0
The deformation of the tube walls is determined by the magnitude of the applied pressure, p i n . If p i n has small values, then deformation of the tube walls is elastic. As pressure is increased, stresses in the wall of the tube increase. According to the Tresca–Saint-Venant plasticity condition [51,52], a plastic deformation occurs when the maximum tangential stress achieves its ultimate value in the material:
σ rr σ φ φ = τ 0
If the value of the applied pressure becomes equal to the limit of elastic resistance, p = p e l , then plastic deformation occurs on the inner wall of the tube. At even greater pressure, the plastic state covers an annular layer of radius, R pl , adjacent to the inner surface of the tube. A region will be adjacent to the outer boundary of this layer, in which the elastic state of the material will still be preserved. When the value of the applied pressure reaches the limit of plastic resistance, p = p p l , all the material in the thickness of the tube will go into a plastic state.
In this paper we will consider the case when the limit of plastic resistance is reached, that is, the deformation of the entire tube wall is plastic. The analysis of the stress–strain state can be carried out on the basis of equations of the deformational theory of plasticity.

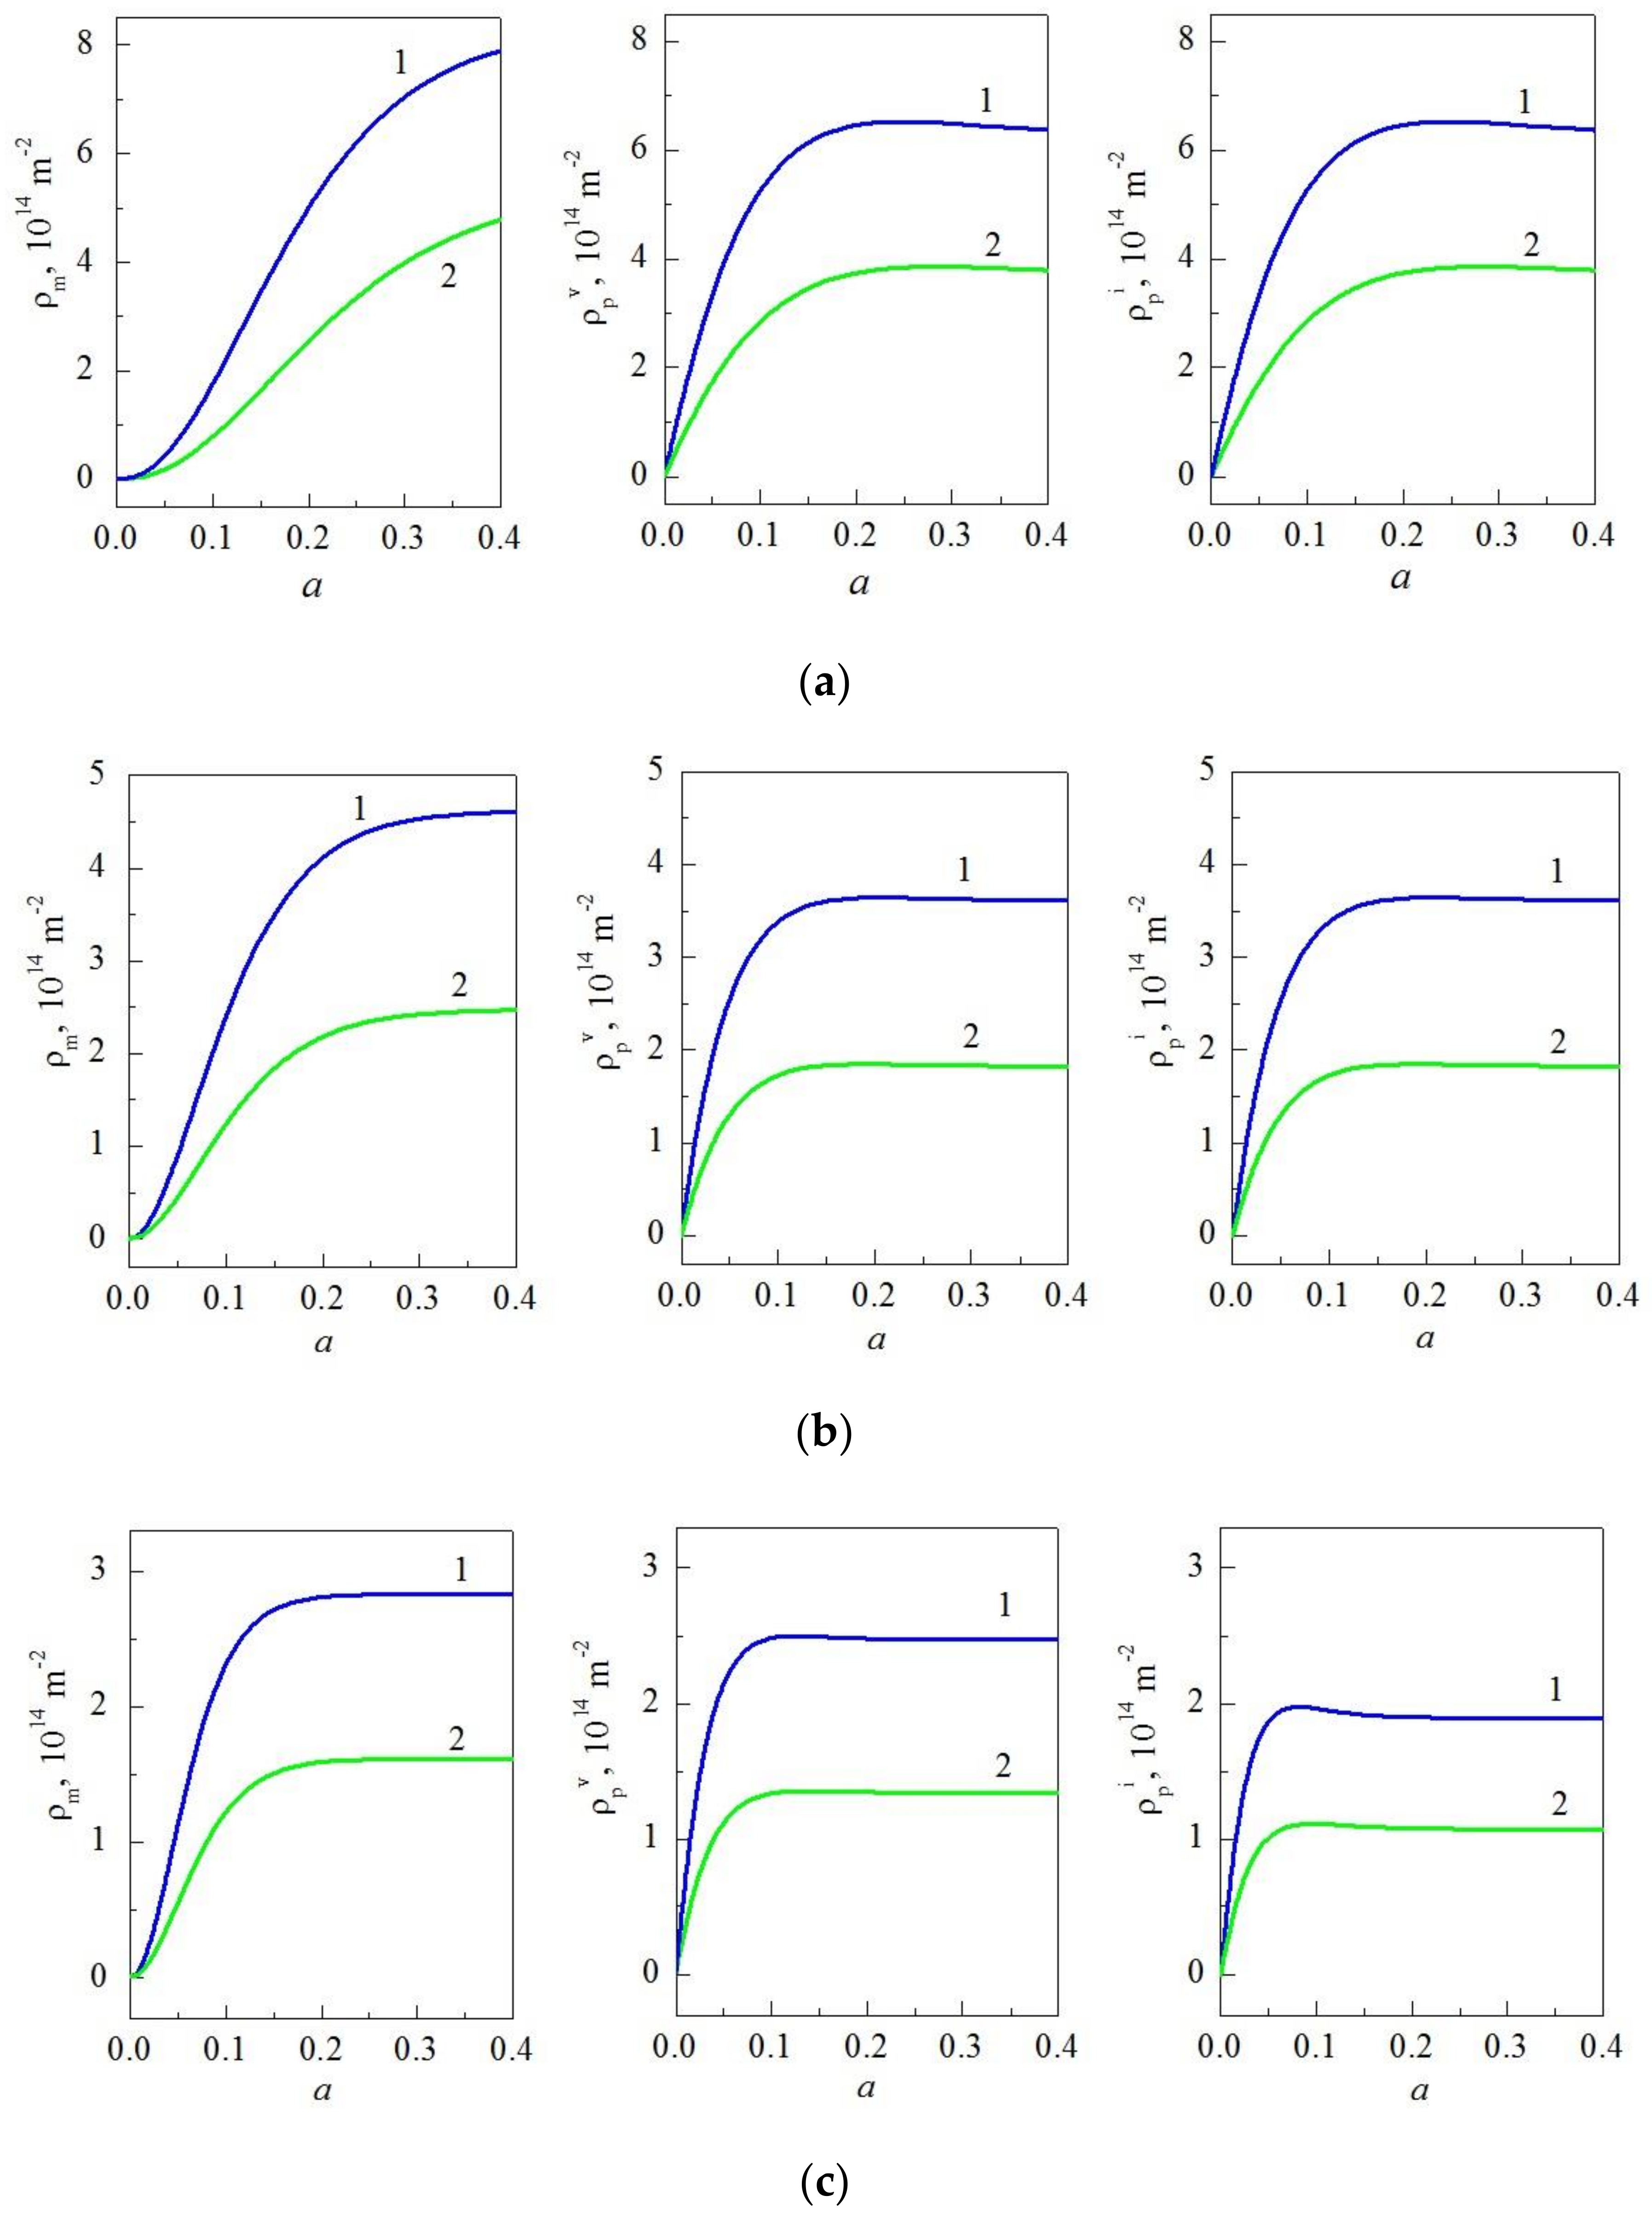
2.6. Displacements and Strains in Tube Walls

The deformation theory of plasticity is based on the theory that volume changes due to plastic deformations do not occur [40,51]. Volumetric deformation occurs only as a result of elastic and temperature stresses. Thus, during plastic deformation in an inhomogeneous temperature field, volumetric deformation is equal to:
ε V = 3 α T T T i n
With small tensile/compression and shear, the volumetric strain is equal to:
ε V = ε r r + ε φ φ + ε z z
The components of the strain tensor are determined by the Cauchy relations and, in the presence of axial symmetry and a plane deformed state, they have the form:
ε r r = d u r d r , ε φ φ = u r r , ε z z = 0
In Equation (23), u r is the radial component of the displacement vector.
Taking into account dependences, Equations (21)–(23), the volumetric deformation can be found from the solution of the equation:
u r r + u r r = 3 α T T T i n .
The solution of this equation, taking into account the temperature dependence, Equation (17), has the form:
u r = 3 α T Δ T h r 2 3 r R i n 2 + C * r ,
where C * is the integration constant which should be determined.
Equation (25) allows us to determine the components of the strain tensor:
ε r r = u r r = 3 α T Δ T h 2 r 3 R i n 2 C * r 2 ,   ε φ φ = u r r = 3 α T Δ T h r 3 R i n 2 + C * r 2 ,
According to the Duhamel–von Neumann hypothesis, deformation can be represented as the sum of deformations caused by a force load [51,53]
ε r r σ = C * r 2 , ε φ φ σ = C * r 2
and deformation caused by thermal expansion:
ε r r T = 3 α T Δ T h 2 r 3 R i n 2 ,   ε φ φ T = 3 α T Δ T h r 3 R i n 2
According to [40], strain intensity caused by a force load is equal to:
a = 2 ε r r σ 2 + ε φ φ σ 2
Substitution of dependencies (27) in Equation (29) leads to the expression
a = 2 C * r 2
Let us determine the integration constant, C * , using the condition at the boundary of elastic and plastic deformation areas.
τ 0 = G a R p l = 2 G C * R p l 2
Thus, the strain intensity is equal:
a = τ 0 G R p l 2 r 2

2.7. Numerical Method

The balance equations for elements of defect dislocation structure and mechanics of deformable solids were solved numerically by using Runge–Kutta–Merson’s fifth order method [54]. Let us write the set of Equations (1)–(8) and (18) in matrix form:
d Y d X = F X , Y
The calculation algorithm for the 5th order Runge–Kutta–Merson method is represented by the equations:
Y i + 1 = Y i + 1 6 k 0 + 4 k 3 + k 4 , k 0 = h F X i , Y i , k 1 = h F X i + h 3 , Y i + k 0 3 , k 2 = h F X i + h 3 , Y i + k 0 + k 1 6 , k 3 = h F X i + h 2 , Y i + k 0 + 3 k 2 6 k 4 = h F X i + h , Y i + k 0 3 k 2 6 + 2 k 3
The total error of the method is O (h5).
In the case of long-term calculations that require a large number of calculations, it is possible to reduce the calculation time by using a variable step of the difference grid, h . When using a variable step in the calculations, the difference between adjacent values of the grid function, Δ = Y i + 1 Y i , is controlled. If Δ exceeds the specified error, Δ max , the grid step is halved; at small values of Δ, the step is doubled. The conditions for automatic selection of the grid step are represented by Equation (35).
h i + 1 = 1 2 h i if Δ max < Δ h i if Δ max Δ 2 Δ max 2 h i if Δ < 2 Δ max ,
The conditions in Equation (35) make it possible to significantly reduce the computation time of the problem while maintaining the accuracy of the solution.

3. Results and Discussion

Let us proceed to the analysis of the main results of the mathematical modeling. The mathematical model of this tube assumes that its inner and outer radii are, respectively, R i n = 0.1 m and R e x = 0.105 m.
Figure 6 shows the dependences of the plastic resistance limit, p p l , of the tube on the temperature of the outer wall. When the outer wall is heated, the material of the outer layers of the tube becomes more plastic. As a result of this, the pressure required to achieve plastic deformation of the outer wall decreases. In contrast, cooling of the outer wall leads to an increase in the limit of plastic resistance. Note that at a fixed value, T i n , varying the temperature of the outer wall in the range of 200 K leads to a significant change in the limit of plastic resistance (for the geometry under consideration, this change is about 15%).
Similar dependences characterizing the effect of the temperature of the inner wall on plastic deformation of the tube are illustrated in Figure 7.
An increase of the temperature of the inner wall at a fixed value of the outer wall temperature, T e x , reduces the resistance to plastic deformation of the inner layers of the tube, which causes a decrease, p p l .
When cooling the inner wall of the tube, the limit of plastic resistance increases. The variation, p p l , with variation of the inner wall temperature, T i n , in the range of 200 K for the considered tube sizes ( R i n = 0.1 m, R e x = 0.105 m) is also 15%. Thus, to calculate the strength characteristics of the heat exchanger, it is necessary to take into account temperature distribution in its walls.
The result of mathematical modeling demonstrates that in alloys with small distances between the hardening particles with the same volume fraction of particles, significantly greater pressure is required to achieve plastic deformation of the tube walls. Thus, a decrease in the distance between particles with the same volume fraction of particles causes hardening of the material, leading to an increase in the limit of plastic resistance. Note that for alloys with different parameters of the hardening phase, the character of the dependences of the limit of plastic resistance on the temperature of the tube wall does not change.
Figure 8 and Figure 9 show the effect of tube dimensions on the value of the limit of plastic resistance. As the wall thickness of the tube increases, its resistance to applied pressure increases. As a result, as can be seen from Figure 8, with an increase of the wall thickness, the limits of the plastic resistance of the tube increase.
The dependence of the plastic resistance limit of a tube on its dimensions is shown in Figure 9. An increase in the radius of the tube at a fixed wall thickness leads to a decrease of p p l .
The limit of plastic resistance also decreases with increasing temperature of the tube wall. For the same absolute temperature difference between the outer and inner walls, the plastic resistance limit is lower as the temperature of the inner wall of the tube increases.

4. Conclusions

During the investigation, the authors developed the mathematical model and obtained quantitative data to determine the effect of the temperature difference between the outer and inner walls of the tube on its stress–strain state. The results of mathematical modeling showed that with an increase of the thickness of the tube wall, the plastic resistance limit increases. An increase of the tube radius at a fixed wall thickness leads to a decrease of the plastic resistance limit. The material of the outer layer of the tube becomes more plastic when heating of the outer wall occurs, so the pressure required to achieve plastic deformation of the outer wall decreases. The cooling of the outer wall leads to an increase of the plastic resistance limit. An increase of the temperature of the inner wall reduces the resistance to plastic deformation of the inner layers of the tube. When the inner wall of the tube cools, the plastic resistance limit increases. For the same absolute temperature difference between the outer and inner walls, the plastic resistance limit is lower as the temperature of the inner wall of the tube increases. To calculate the strength characteristics of the heat exchanger, it is necessary to take into account the temperature distribution in its walls. The result of mathematical modeling demonstrates that a decrease of the distance between particles with the same volume fraction leads to significantly greater pressure being required to achieve plastic deformation of the tube walls and causes hardening of the material. Investigation of the defect structure formation in the tube walls under conditions of inhomogeneous temperature is planned in following publications.

Author Contributions

Conceptualization, O.M., T.K. and O.D.; Data curation, O.D.; Formal analysis, O.M.; Funding acquisition, T.K. and the Ministry of Science and Higher Education of the Russian Federation (theme No. FEMN-2020-0004); Investigation, O.M. and O.D.; Methodology, O.M., T.K. and O.D.; Project administration, T.K.; Resources, O.M.; Software, O.M.; Supervision, O.D.; Validation, O.M.; Visualization, O.D.; Writing—original draft, O.M.; Writing—review & editing, O.M. and O.D. All authors have read and agreed to the published version of the manuscript.

Funding

The research was carried out within the state assignment of the Ministry of Science and Higher Education of the Russian Federation (theme No. FEMN-2020-0004).

Acknowledgments

The authors acknowledge the Ministry of Science and Higher Education of the Russian Federation (theme No. FEMN-2020-0004).

Conflicts of Interest

The authors declare no conflict of interest.

References

  1. Saunders, E.A. Heat Exchanges: Selection, Design and Construction; Longman Scientific and Technical: New York, NY, USA, 1988. [Google Scholar]
  2. Northcutt, B.; Mudawar, I. Enhanced design of cross-flow microchannel heat exchanger module for high-performance aircraft gas turbine engines. J. Heat Transf. 2012, 134, 061801-1–061801-13. [Google Scholar] [CrossRef] [Green Version]
  3. Wang, H.; Sang, Z. Theory solution of Hydraulic expansion tube-to-tube sheet joint residual contact pressure for power-hardening material. China Pet. Mach. 2007, 11, 24–28. [Google Scholar]
  4. Bouzid, A.H.; Mourad, A.H.I.; Domiaty, E.A. Influence of Bauschinger effect on the residual contact pressure of hydraulically expanded tube-to-tubesheet joints. Int. J. Press. Vessel. Pip. 2016, 146, 1–10. [Google Scholar] [CrossRef]
  5. Ying, H.; Xuesheng, W.; Qinzhu, C.; Jianfu, W. Bilinear Simplification of Material Model in Theoretical Calculation of Hydraulic Expansion. Mach. Des. Res. 2018, 34, 199–202. [Google Scholar]
  6. Law, M.; Bowie, G. Failure strain in high yield-to-tensile ratio line pipes. J. Pipeline Integr. 2006, 5, 25–36. [Google Scholar]
  7. Robertson, A.; Li, H.; Mackenzie, D. Plastic collapse of pipe bends under combined internal pressure and in-plane bending. Int. J. Press. Vessel. Pip. 2005, 82, 407–416. [Google Scholar] [CrossRef] [Green Version]
  8. Gajdos, L.; Sperl, M. Evaluating the integrity of pressure pipelines by fracture mechanics. INTECH Appl. Fract. Mech. 2012, 10, 283–310. [Google Scholar]
  9. Chemezov, D.; Bayakina, A.; Goremykin, V.; Prokofiev, A.; Pavlov, E.; Petrenko, A.; Sergeeva, M.; Gusenkov, M. Strain intensity of the steel pipe under the action of external tensile, compressive and combined loads. ISJ Theor. Appl. Sci. 2020, 2, 30–35. [Google Scholar] [CrossRef]
  10. Bergant, A.; Tijsseling, A.S.; Vítkovský, J.P.; Covas, D.I.; Simpson, A.R.; Lambert, M.F. Parameters affecting water-hammer wave attenuation, shape and timing, part 2: Case studies. J. Hydraul. Res. 2008, 46, 382–391. [Google Scholar] [CrossRef] [Green Version]
  11. Zhu, X.K.; Leis, B.N. Evaluation of burst pressure prediction models for line pipes. Int. J. Press. Vessel. Pip. 2012, 89, 85–97. [Google Scholar] [CrossRef]
  12. Zhu, X.K.; Leis, B.N. Theoretical and numerical predictions of burst pressure of pipelines. J. Press. Vessel. Technol. 2007, 129, 644–652. [Google Scholar] [CrossRef]
  13. Burkov, P.; Yan’nan, V.; Burkova, S. Stress–strain analysis of pipelines laid in permafrost. IOP Conf. Ser. Earth Environ. Sci. 2016, 43, 012080. [Google Scholar] [CrossRef] [Green Version]
  14. Chohan, R.K. Plastic deformation induced by pressure transients in fluid-filled pipes. Int. J. Press. Vessel. Pip. 1988, 33, 333–343. [Google Scholar] [CrossRef]
  15. Pleșcan, C.; Stanciu, M.D.; Szasz, M. The Effect of Internal Pressure on Radial Strain of Steel Pipe Subjected to Monotonic and Cyclic Loading. Materials 2019, 12, 2849. [Google Scholar] [CrossRef] [Green Version]
  16. Tomita, Y.; Shindo, A.; Kim, Y.S.; Michiura, K. Deformation behaviour of elastic-plastic tubes under external pressure and axial load. Int. J. Mech. Sci. 1986, 5, 263–274. [Google Scholar] [CrossRef]
  17. Chawla, N.; Shen, Y.L. Mechanical Behavior of Particle Reinforced Metal Matrix Composites. Adv. Eng. Mater. 2001, 3, 357–370. [Google Scholar] [CrossRef]
  18. Beffort, O.; Long, S.; Cayron, C.; Kuebler, J.; Buffat, P.A. Alloying effects on microstructure and mechanical properties of high volume fraction SiC-particle reinforced Al-MMCs made by squeeze casting infiltration. Compos. Sci. Technol. 2007, 67, 737–745. [Google Scholar] [CrossRef]
  19. Karabasov, Y.S. Advanced Materials; MISIS: Moscow, Russia, 2002; 736p. [Google Scholar]
  20. Orowan, E. Discussion on internal stresses. In Symposium on Internal Stresses in Metals and Alloys; Institute of Metals: London, UK, 1948; pp. 451–453. [Google Scholar]
  21. Ashby, M.F. Work hardening of dispersion-hardened crystals. Philos. Mag. 1966, 14, 1157–1178. [Google Scholar] [CrossRef]
  22. Ebeling, R.; Ashby, M.F. Dispersion hardening of copper single crystals. Philos. Mag. 1966, 13, 805–834. [Google Scholar] [CrossRef]
  23. Hirsch, P.B.; Hymphreys, F.J. Comment on “Dispersion hardening in metals” by E.W. Hart. Scr. Metall. 1973, 7, 259–265. [Google Scholar] [CrossRef]
  24. Hazzledine, P.M.; Hirsch, P.B. A coplanar Orowan loops model for dispersion hardening. Philos. Mag. 1974, 30, 1331–1351. [Google Scholar] [CrossRef]
  25. Humphreys, F.J.; Hirsch, P.B. Work-hardening and recovery of dispersion hardened alloys. Philos. Mag. 1976, 34, 373–390. [Google Scholar] [CrossRef]
  26. Humphreys, F.J.; Stewart, A.T. Dislocation generation at SiO2 particles in an α-brass matrix on plastic deformation. Surf. Sci. 1972, 31, 389–421. [Google Scholar] [CrossRef]
  27. Hymphreys, F.J.; Martin, J.W. The effect of dispersed phases upon dislocation distributions in plastically deformed copper crystals. Philos. Mag. 1967, 16, 927–957. [Google Scholar] [CrossRef]
  28. Hymphreys, F.J.; Hirsch, P.B. The deformation of single crystals of copper and copper-zinc alloys containing alumina particles. II. Microstructure and dislocation-particle interactions. Proc. Phys. Soc. 1973, 318, 73–92. [Google Scholar]
  29. Matvienko, O.V.; Daneiko, O.I.; Kovalevskaya, T.A. Plastic deformation of copper-based alloy reinforced with incoherent nanoparticles. Russ. Phys. J. 2017, 60, 236–248. [Google Scholar] [CrossRef]
  30. Matvienko, O.V.; Daneyko, O.I.; Kovalevskaya, T.A. Stress-stain state of pipe made of copper-based alloy strengthened with incoherent nanoparticles. Russ. Phys. J. 2017, 60, 562–569. [Google Scholar] [CrossRef]
  31. Matvienko, O.V.; Daneyko, O.I.; Kovalevskaya, T.A. Dislocation structure of the pipe made of alloy reinforced with incoherent particles under uniform internal pressure. Russ. Phys. J. 2017, 60, 1233–1242. [Google Scholar] [CrossRef]
  32. Matvienko, O.; Daneyko, O.; Kovalevskaya, T. Mathematical modeling of plastic deformation of a tube from dispersion-hardened aluminum alloy. MATEC Web Conf. 2018, 243, 00008. [Google Scholar] [CrossRef]
  33. Matvienko, O.V.; Daneyko, O.I.; Kovalevskaya, T.A. Elastoplastic deformation of dispersion-hardened aluminum tube under external pressure. Russ. Phys. J. 2018, 61, 1520–1528. [Google Scholar] [CrossRef]
  34. Matvienko, O.V.; Daneyko, O.I.; Kovalevskaya, T.A. Elastoplastic deformation of dispersion-hardened aluminum tube under external and internal pressure. Russ. Phys. J. 2019, 62, 720–728. [Google Scholar] [CrossRef]
  35. Daneyko, O.I.; Kovalevskaya, T.A. Temperature effect on stress–strain properties of dispersion-hardened crystalline materials with incoherent nanoparticles. Russ. Phys. J. 2019, 61, 1687–1694. [Google Scholar] [CrossRef]
  36. Kovalevskaya, T.A.; Daneyko, O.I. The influence of scale parameters of strengthening phase on plastic shear zone in heterophase alloys with incoherent nanoparticles. Russ. Phys. J. 2020, 62, 2247–2254. [Google Scholar] [CrossRef]
  37. Daneyko, O.I.; Kulaeva, N.A.; Kovalevskaya, T.A.; Kolupaeva, S.N. Investigation of thermal hardening of the FCC material containing strengthening particles with an L12 superstructure. Russ. Phys. J. 2015, 58, 336–342. [Google Scholar] [CrossRef]
  38. Chakrabarty, J. Theory of Plasticity; Mc Graw-Hill Book Company: New York, NY, USA; Hamburg, Germany; London, UK; Paris, France; Sydney, Australia; Tokyo, Japan, 1987; Volume VIII, 791p. [Google Scholar]
  39. Matvienko, O.V.; Daneyko, O.I.; Kovalevskaya, T.A. Strengthening particle size effect on residual stresses in dispersion-hardened alloy. Russ. Phys. J. 2018, 61, 962–973. [Google Scholar] [CrossRef]
  40. Timoshenko, S.P.; Goodier, J.N. Theory of Elasticity; McGraw Hill: New York, NY, USA, 2010; 567p. [Google Scholar]
  41. Kovalevskaya, T.A.; Vinogradova, I.V.; Popov, L.E. Mathematical Modeling of Plastic Deformation in Heterophase Alloys; TSU: Tomsk, Russia, 1992; 234p. [Google Scholar]
  42. Daneyko, O.I.; Kovalevskaya, T.A.; Matvienko, O.V. The influence of incoherent nanoparticles on thermal stability of aluminum alloys. Russ. Phys. J. 2018, 61, 1229–1235. [Google Scholar] [CrossRef]
  43. Kovalevskaya, T.; Daneyko, O.; Kulaeva, N.; Kolupaeva, S. Influence of the scale characteristics of the hardening phase with L12 superstructure on the evolution of deformation point defects. In AIP Conference Proceedings; AIP Publishing LLC: Tomsk, Russia, 2016; p. 040003. [Google Scholar] [CrossRef] [Green Version]
  44. Daneyko, O.I.; Kovalevskaya, T.A.; Kulaeva, N.A.; Kolupaeva, S.N.; Shalygina, T.A. Evolution of dislocation subsystem components during plastic deformation depending on parameters of strengthening phase with L12 superstructure. Russ. Phys. J. 2017, 60, 821–829. [Google Scholar] [CrossRef]
  45. Daneyko, O.I.; Kovalevskaya, T.A.; Kulaeva, N.A. Modeling of plastic deformation of dispersion-hardened materials with L12 superstructure particles. Russ. Phys. J. 2017, 60, 508–514. [Google Scholar] [CrossRef]
  46. Larikov, L.N.; Yurchenko, Y.F. Thermal Properties of Metals and Alloys; Naukova Dumka: Kiev, Ukraine, 1985; 312p. [Google Scholar]
  47. Polmear, L.J. Light Alloys: Metallurgy of Lights Metals; John Willey and Sons: Melbourne, Australia, 1995; 235p. [Google Scholar]
  48. Gorshkov, A.G.; Starovoitov, E.I.; Tarlakovskii, D.V. Theory of Elasticity and Plasticity; Fizmatlit: Moscow, Russia, 2002; 416p. [Google Scholar]
  49. Khrustalev, A.; Vorozhtsov, A.; Kazantseva, L.; Promakhov, V.; Kalashnikov, M.; Eskin, D.; Kurzina, I. Influence of scandium fluoride on the structure and phase composition of Al-Si alloy. MATEC Web Conf. 2018, 243, 00020. [Google Scholar] [CrossRef]
  50. Matvienko, O.; Daneyko, O.; Kovalevskaya, T.; Khrustalyov, A.; Zhukov, I.; Vorozhtsov, A. Investigation of Stresses Induced Due to the Mismatch of the Coefficients of Thermal Expansion of the Matrix and the Strengthening Particle in Aluminium-Based Composites. Metals 2020. Unpublished. [Google Scholar]
  51. Matvienko, O.V.; Daneyko, O.I.; Kovalevskaya, T.A. Residual stresses induced by elastoplastic unloading in a tube made of dispersion-hardened alloy. Russ. Phys. J. 2018, 61, 730–742. [Google Scholar] [CrossRef]
  52. Matvienko, O.; Daneyko, O.; Kovalevskaya, T. Mathematical modeling of nanodispersed hardening of FCC materials. Acta Metall. Sin. Engl. Lett. 2018, 31, 1297–1304. [Google Scholar] [CrossRef] [Green Version]
  53. Matvienko, O.V.; Daneyko, O.I.; Kovalevskaya, T.A. Stress–strain state of dispersion-hardened aluminum tube under external and internal pressure. Russ. Phys. J. 2020, 62, 1805–1812. [Google Scholar] [CrossRef]
  54. Chapra, S. Numerical Methods for Engineers; McGraw: New York, NY, USA, 2015; 518p. [Google Scholar]
Figure 1. Dependencies of the density of shear-forming dislocations, dislocation density in the prismatic loops of vacancy and interstitial types from deformation. Diameter of particles ( δ ), nm: 1–10, 2–20; distance between particles ( Λ p ), nm: 1–100, 2–200; (a) temperature: 293 K, (b) temperature: 393 K and (c) temperature: 493 K.
Crystals 10 01103 g001
Figure 2. Stress–strain curves for an aluminum-based alloy at various temperatures. Red curves (1–3) correspond to the diameter of strengthening particles, δ = 10 nm, and distances between the particles, Λ p = 100 nm; blue curves (4–6) correspond to the diameter of strengthening particles, δ = 20 nm, and distances between the particles, Λ p = 200 nm. Temperature of deformation on the curves 1 and 4 is T = 293 K, on curves 2 and 5 it is T = 393 K and on curves 3 and 6 it is T = 493 K.
Crystals 10 01103 g002
Figure 3. Temperature dependencies of yield stress, τ 0 (blue curves 1 and 2), and hardening stress, τ 1 (red curves 3 and 4). Particles diameter, δ , and distance between particles, Λ p , on curves 1 and 3 are, respectively, 10 and 100 nm, and on curve 2 they are 20 and 200 nm.
Crystals 10 01103 g003
Figure 4. Temperature distribution in the tube wall: radius of the inner wall of the pipe R in = 0.1 m, radius of the outer wall of the pipe R ex = 0.105 m. The red curves (1 and 2) correspond to an inner wall temperature of 293 K. On curve 1 the outer wall temperature is 393 K; on curve 2 it is 493 K. The blue curves (3 and 4) correspond to an inner wall temperature of 393 K. On curve 3 the outer wall temperature is 293 K; on curve 4 it is 493 K. The green curves (5 and 6) correspond to an inner wall temperature of 493 K. On curve 5 the outer wall temperature is 293 K; on curve 6 it is 493 K.
Crystals 10 01103 g004
Figure 5. Cross-sectional view of tube deformation.
Crystals 10 01103 g005
Figure 6. Dependence of the plastic resistance limit on the temperature of the outer wall: R i n = 0.1 m, R e x = 0.105 m. Curves 1–3: Λ p = 100 nm, δ = 10 nm; curves 4–6: Λ p = 200 nm, δ = 20 nm; curves 1 and 4–temperature of the inner wall of the pipe T i n = 293 K; curves 2 and 5– T i n = 393 K and curves 3 and 6– T i n = 493 K.
Crystals 10 01103 g006
Figure 7. Dependence of the plastic resistance limit on the temperature of the inner wall: R i n = 0.1 m, R e x = 0.105 m. Curves 1–3: Λ p = 100 nm, δ = 10 nm; curves 4–6: Λ p = 200 nm, δ = 20 nm; curves 1 and 4: temperature of the outer wall of the pipe T e x = 293 K; curves 2 and 5: T e x = 393 K; curves 3 and 6: T e x = 493 K.
Crystals 10 01103 g007
Figure 8. The dependence of the limit of plastic resistance on the wall thickness of the tube h = R e x R i n : T i n = 293 K, T e x = 393 K, Λ p = 100 nm, δ = 10 nm, curve 1– R i n = 0.1 m, curve 2–0.105 m and curve 3–0.11 m.
Crystals 10 01103 g008
Figure 9. The dependence of the plastic resistance limit on the tube size. Λ p = 100 nm, δ = 10 nm, h = 0.05 m; curve 1– T i n = 293 K, T e x = 293 K; curve 2–293, 393; curve 3–393, 293; curve 4–293, 493 and curve 5–493, 393.
Crystals 10 01103 g009
Table 1. The material constants τ 0 * , τ 1 * and a * (1).
Hardening Phase ParametersMaterial Constants
Λ p = 100 nm τ 0 = 81.08 MPa
δ = 10 nm τ 1 = 143.1 MPa
a * = 0.011
Λ p = 200 nm τ 0 = 43.13 MPa
δ = 20 nm τ 1 = 110.13 MPa
a * = 0.013
Table 2. Properties of A356-based composites containing scandium fluoride particles.
Alloyτ0 [MPa]τ1 [MPa]
Experiment [50]Results of ModelingExperiment [50]Results of Modeling
A356–0.2% ScF398 ± 610292 ± 1187
A356–1% ScF3109 ± 8114141 ± 9134
Publisher’s Note: MDPI stays neutral with regard to jurisdictional claims in published maps and institutional affiliations.

