Article

Kilohertz Macromolecular Crystallography Using an EIGER Detector at Low X-ray Fluxes

1
Institute of Physics, ELI Beamlines, Academy of Sciences of the Czech Republic, Na Slovance 1999/2, 18221 Prague, Czech Republic
2
Synchrotron SOLEIL, L’Orme des Merisiers, Saint-Aubin BP 48, 91192 Gif-sur-Yvette, France
3
Laboratory of Structure and Function of Biomolecules, Institute of Biotechnology, Academy of Sciences of the Czech Republic, BIOCEV, Prumyslova 595, 25250 Vestec, Czech Republic
4
Institut Galien Paris-Saclay, CNRS UMR8612, Université Paris-Saclay, F-92290 Châtenay-Malabry, France
5
Laboratory of Molecular Biophysics, Department of Cell and Molecular Biology, Uppsala University, Husargatan 3, Box 596, 75124 Uppsala, Sweden
*
Author to whom correspondence should be addressed.
Crystals 2020, 10(12), 1146; https://doi.org/10.3390/cryst10121146
Submission received: 2 November 2020 / Revised: 11 December 2020 / Accepted: 11 December 2020 / Published: 16 December 2020

Abstract

:
Time-resolved in-house macromolecular crystallography is primarily limited by the capabilities of the in-house X-ray sources. These sources can only provide a time-averaged structure of the macromolecules. A significant effort has been made in the development of in-house laser-driven ultrafast X-ray sources, with one of the goals as realizing the visualization of the structural dynamics of macromolecules at a very short timescale within the laboratory-scale infrastructure. Most of such in-house ultrafast X-ray sources are operated at high repetition rates and usually deliver very low flux. Therefore, the necessity of a detector that can operate at the repetition rate of the laser and perform extremely well under low flux conditions is essential. Here, we present experimental results demonstrating the usability of the hybrid-pixel detectors, such as Eiger X 1M, and provide experimental proof that they can be successfully operated to collect macromolecular crystallographic data up to a detector frame rate of 3 kHz from synchrotron sources. Our results also show that the data reduction and structural analysis are successful at such high frame rates and fluxes as low as 108 photons/s, which is comparable to the values expected from a typical laser-driven X-ray source.

1. Introduction

Modern macromolecular X-ray crystallography (MX) has benefited enormously from the advances in the sources and the evolution of X-ray area detectors [1,2,3]. The speed and the photon count rate of the X-ray area detector are crucial for the realization of time-resolved X-ray diffraction experiments focused on protein structure and dynamics [4,5]. With the emergence of new light sources, especially X-ray free-electron lasers (XFEL), but also the development of high repetition rate femtosecond laser-driven X-ray sources [6,7,8,9,10], time-resolved X-ray diffraction and scattering has made huge advances in recent times [11,12]. These new sources delivering flashes of femtosecond X-rays attract significant interest as they allow the tracking of events occurring at an ultrafast timescale in material and biological sciences [13,14,15].
With such advances in X-ray sources and instrumentation, X-ray crystallography has diversified [16,17,18,19]. For instance, with XFELs delivering bursts of highly brilliant ultrashort X-rays, a new variant of X-ray crystallography called serial femtosecond crystallography (SFX) has gained significant interest [20,21,22]. In this novel technique, radiation damage is avoided, or at least kept at a minimum, by collecting datasets where key damage processes are outrun by the ultrashort pulse duration and structures practically free of radiation-damage are obtained in a process called “diffraction before destruction” [23,24]. A new fresh crystal is shot with each pulse of X-rays, and the entire dataset is collected in a series of such ultra-fast exposures [25,26].
Similar types of serial crystallography data collection methods have also been introduced at many beamlines at several synchrotrons [27,28]. One of the goals of most serial protein crystallography projects practiced at synchrotrons is to obtain the structures with minimal radiation damage. This also signifies the necessity to collect data at low doses and high frame rates.
Advances made in the development of lab-based femtosecond X-ray sources and their applications in macromolecular crystallography have also gained attention [29]. Lab-based ultrafast X-ray sources can provide access to tailor-made pulse trains of X-rays and can serve as a complementary tool to free-electron lasers [30]. With a laser-driven X-ray source, the optical and X-ray pulses originate from the same drive laser, and when such a laser-driven X-ray source is used in time-resolved experiments, there is an inherent synchronization between the pump and probe pulses. However, the limited flux generated from such laboratory sources today, although avoiding radiation damage, has so far hindered meaningful crystallographic experiments on protein macromolecules. Additionally, high frame-rate detectors are required in order to best utilize all available pulses from such sources. With the tremendous development in the detection techniques seen over the past decades [30,31], a sufficient signal-to-noise ratio can be achieved even with low brilliance sources, supporting the possibility of doing single-crystal protein crystallography with laboratory-based ultrafast X-ray sources.
The increase in the rate of data collection in X-ray crystallography during the last two decades is closely linked to the developments in X-ray detection technologies [1,4]. Several high frame-rate single-photon counting detectors have been developed during this period. An example of this type of area detector is the Eiger series from the Dectris Company [1,32,33]. The Eiger X 1M detector, which is employed in the present work, belongs to the group of single-photon counting hybrid pixel array detectors (HPAD). The single module of Eiger consists of approximately 500 K pixels with 75 ìm × 75 ìm individual pixel size. The smaller pixel size compared to the previous generation detectors makes it attractive for various scattering and diffraction experiments, and it is increasingly used at synchrotrons. However, the employment of an Eiger detector at its outstanding frame rate, i.e., kHz and higher, for diffraction experiments has not yet been demonstrated, especially from the point of view of its use with parameters relevant for laser-driven sources at kHz repetition rates. This has created a void between the real capabilities of the detector and a large potential user community. The underlying problem arises from the time needed by the single pixel to process one photon, which is on the order of nanoseconds, and the X-ray fs pulse duration. This type of problem was solved for XFELs by the use of adaptive gain detectors such as AGIPD or Jungfrau. Both of them are expected to become commercially available. The limited count rate, or the count rate saturation limit, of the HPAD detectors has consequences for their use with low-intensity fs X-ray sources. Useful signals, e.g., in a diffraction experiment in one detector frame, would have one of the two possible outcomes—either no photon or one photon/pixel is registered. In spite of the fact that stronger diffraction signals would be produced by the sample in one particular pixel of the detector, only a maximum of one event would be registered. Therefore, we designed an experiment that at least in part answers the question of the feasibility of such measurements under conditions of minimal exposure and signal detection at the limit of one event per pixel per frame. In this paper, we present X-ray crystallography data collection at a low flux and at high frame rates relevant to both serial crystallography at synchrotrons and femtosecond laser-driven X-ray sources. We used X-rays from the attenuated undulator source at Synchrotron SOLEIL in eight bunch mode corresponding to a bunch separation of 148 ns and a bunch length of 89 ps at a total ring current of 100 mA and yielding an overall flux as low as 108 photons per second. The frame rates used for the Dectris Eiger X 1M detector were as high as 3 kHz. Under these conditions, we show the feasibility of doing kilohertz macromolecular crystallography at low flux, comparable to the ones generated with the lab-based ultrafast X-ray sources. This raises the possibility of performing macromolecular crystallography with such sources and eventually developing such experimental-systems as a complementary tool to study the ultrafast structural dynamics in macromolecules.

2. Materials and Methods

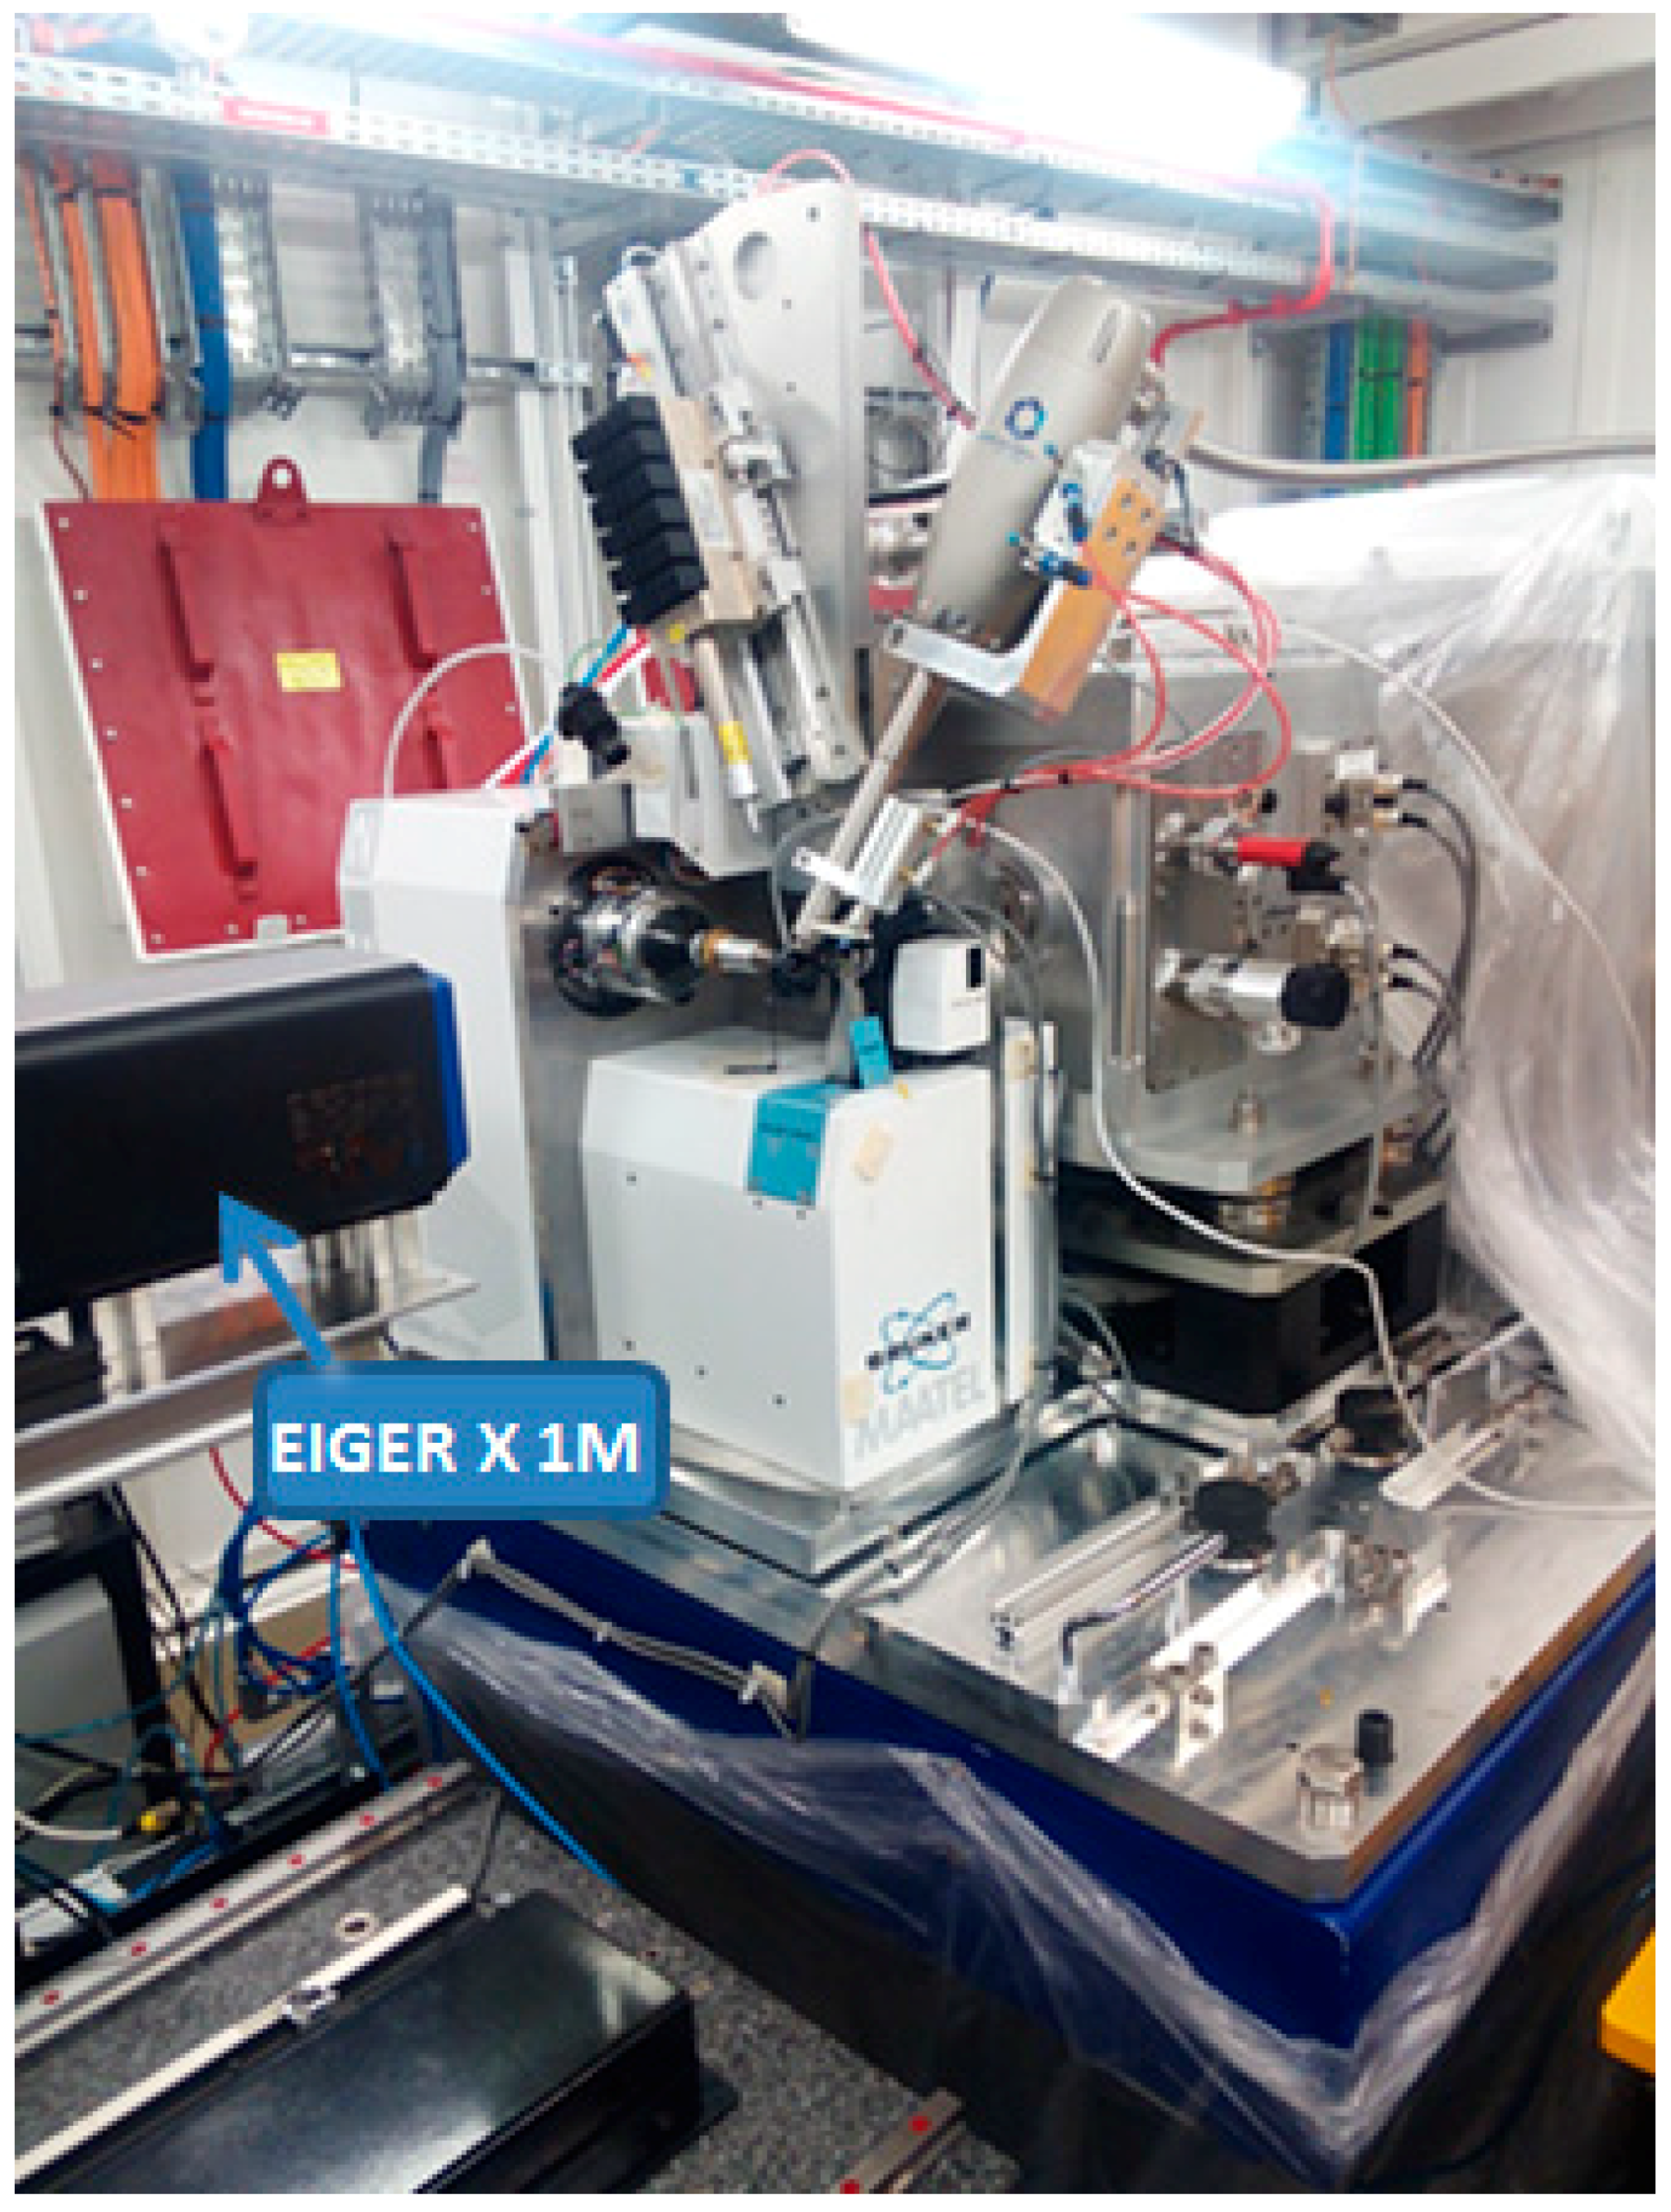
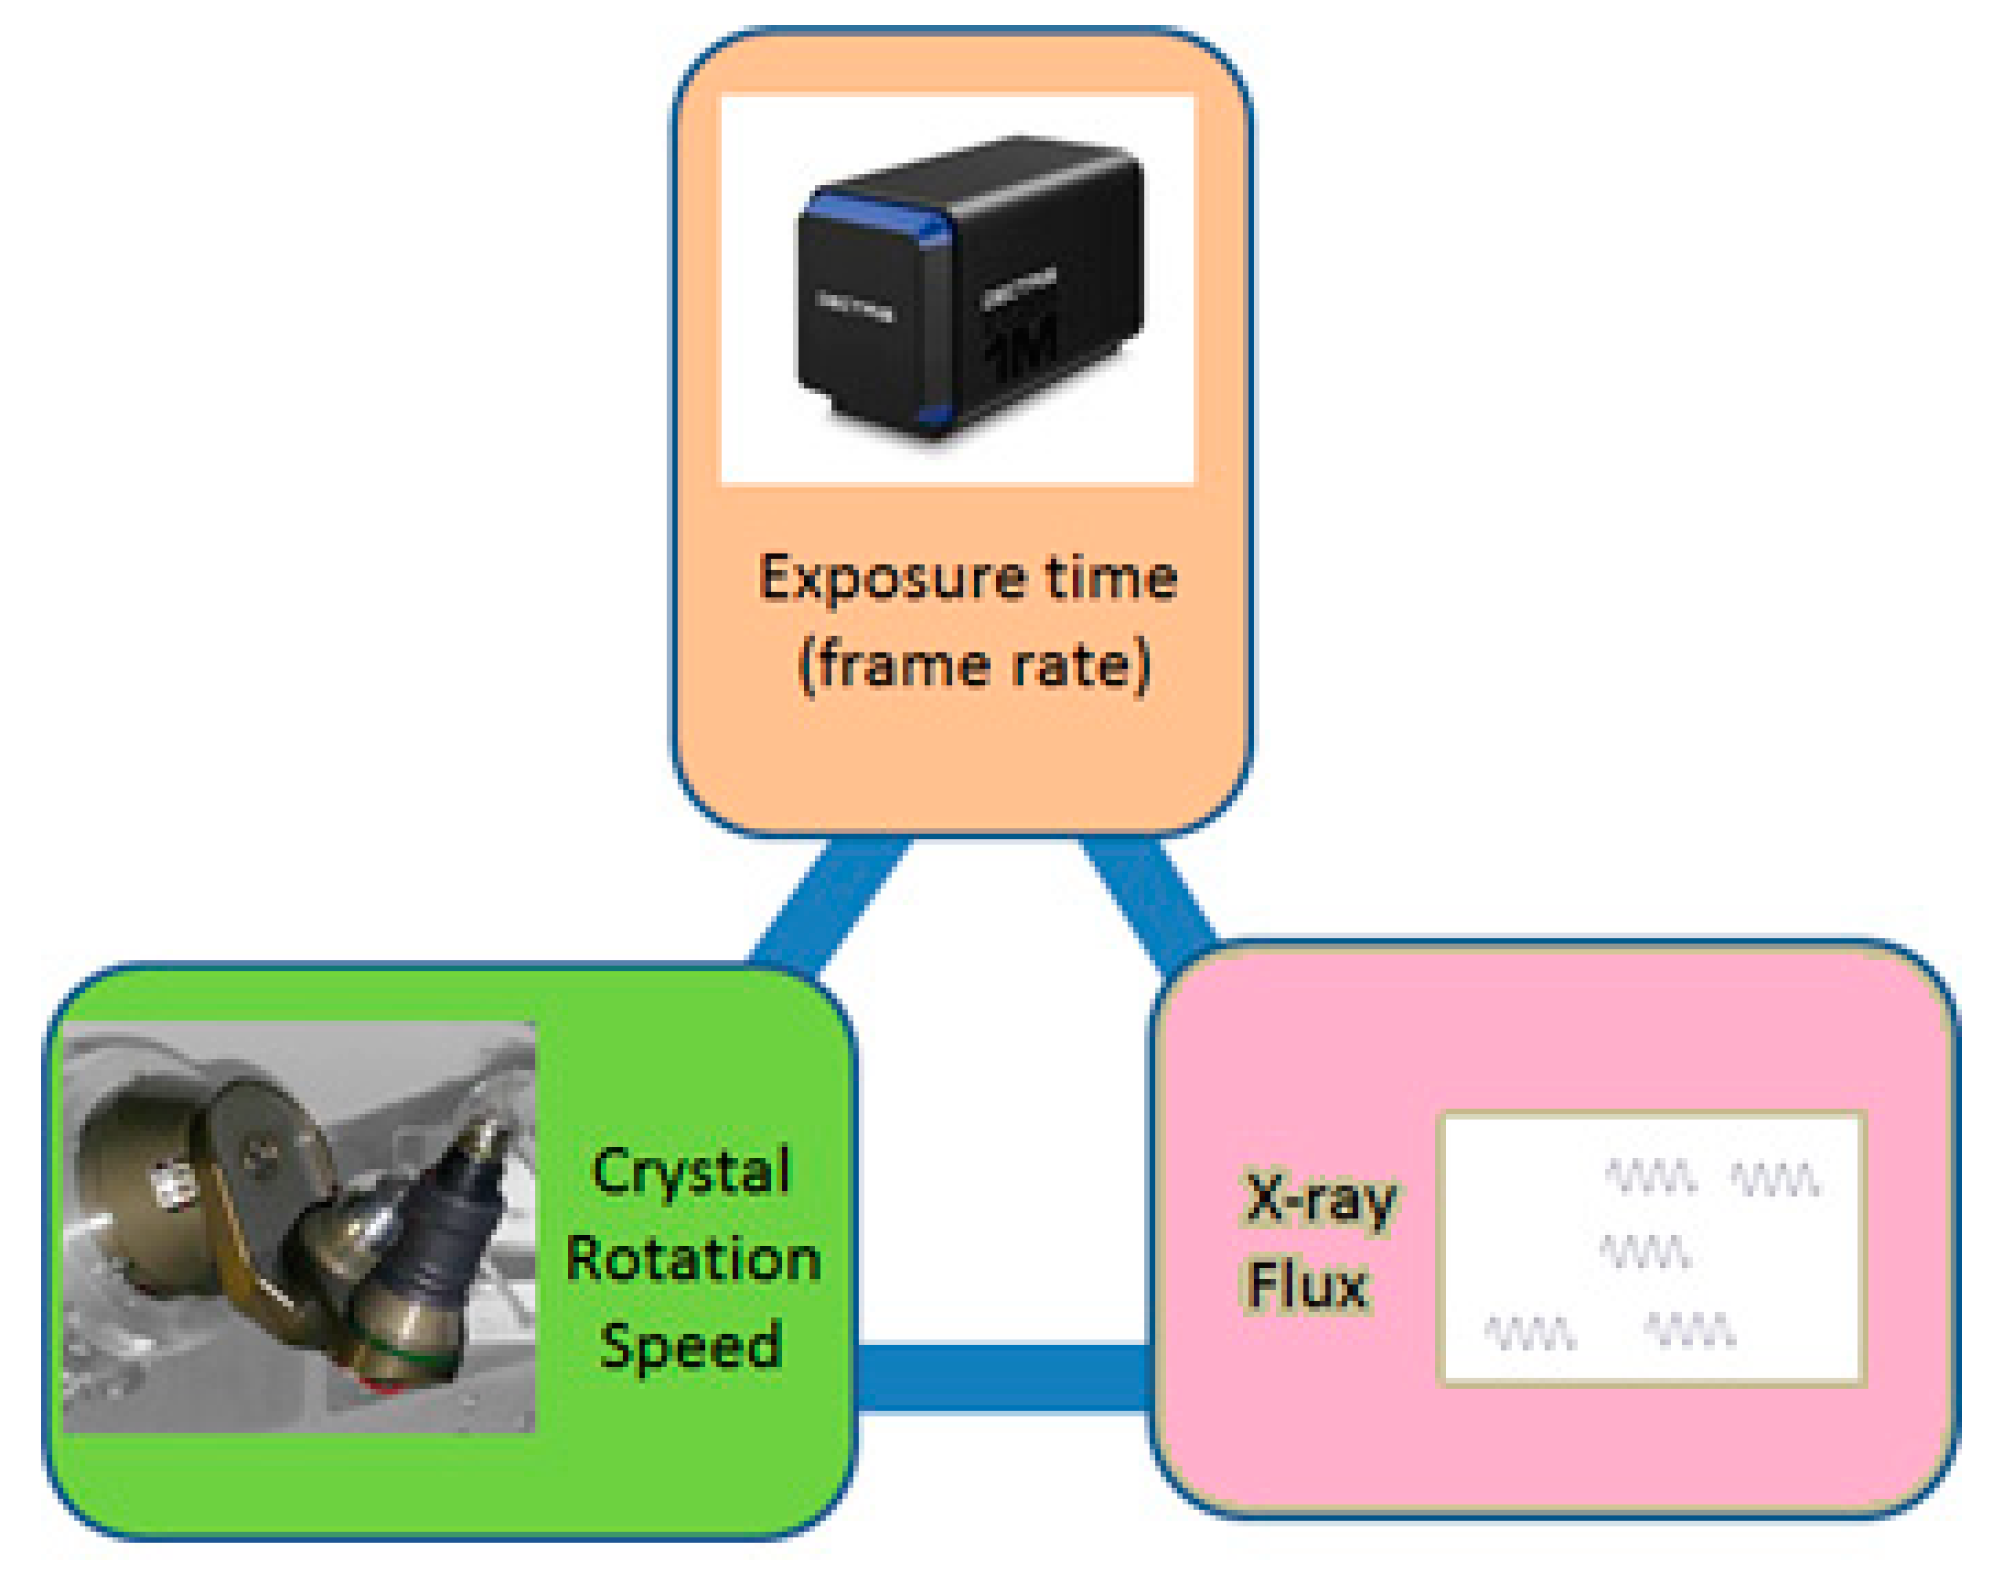
2.1. Experimental Setup

The experiments were performed at the PROXIMA 2A beamline at synchrotron SOLEIL [34]. The experimental configuration is depicted in Figure 1. X-rays of 10.836 keV from the in-vacuum undulator source were focused on using a Kirkpatrick–Baez (KB) mirror pair. X-ray energy was chosen to correspond to the Bi Lα spectral line. A laser-driven plasma source with a liquid Bi-metal target is under development at ELI beamlines (Dolni Brezany, Czech Republic). A cryogenically cooled single-cut silicon monochromator delivered X-rays with monochromaticity of ~2 × 10⁻⁴. Water-cooled primary slits located upstream of the monochromator were used in regulating the photon flux during the experiments. The beam size at the sample position was 10 μm × 5 μm. A high precision micro-diffractometer MD2 (Arinax, France) was placed downstream from the KB mirrors.
The protein crystal (Figure 2) was mounted on the goniometer head in the micro-diffractometer with the assistance of a robotic arm (Irelec, Saint-Martin-d’Hères, France). The crystal was continuously cooled to 100 K using nitrogen gas through a cryostream blower (Oxford Cryo Systems, Oxford, UK). A beam-stop was placed immediately before the detector to block the primary X-ray beam. The diffracted signal was recorded by an Eiger X 1M (Dectris, Baden-Daettwil, Switzerland), which has an active size area of 77.2 × 77.9 mm2. The detector was mounted at distances 50 mm or 60 mm downstream from the sample crystal in order to optimize the resolution and to minimize the background scattering (noise). The highest resolution provided by the employed geometry was 1.59 Å at the detector edges and 1.124 Å at the corners.

2.2. Protein Samples and Data Collection Procedures

The data presented in this article were collected using lysozyme crystals (Figure 2). The crystals were grown using the hanging drop method [35]. The investigated crystals were of sizes ~35 ìm × 35 ìm. Two different crystals were used for the reported measurements. The first crystal, labeled as lyz1 in Table 1, was used to collect the datasets at high flux and also at a high frame rate up to 3 kHz. The second crystal, hereinafter labeled as lyz2, was primarily used to collect the datasets at low fluxes.
Crystals were flash-frozen in liquid nitrogen, and the selected crystal was mounted on the goniometer head using a robotic arm. The Ω-axis of the micro-diffractometer was used to rotate the crystal. The entire dataset was collected by sampling the rotation at 0.1 degree Δω per frame. The angular-sampling selected here was small enough to avoid the lunes-overlap in the multiple consecutive frames. Datasets were collected at various detector frame rates and exposure times in order to test the feasibility of low-flux and high repetition rate experiments. The detector dead time, which was 3 μs between the consecutive frames, resulted in about 1% unrecorded time at a 3 kHz frame rate.
At each exposure time, datasets with various incident fluxes were obtained by attenuating the available maximum flux of the beamline. The attenuation of the incident flux was done by adjusting the slit opening placed upstream from the monochromator. In this manner, the incident flux was reduced to a value as low as 0.01% of the maximum flux. The maximum flux of the beamline was measured to be 1012 photons/s. The beam was almost parallel with a divergence of 1.6 × 1.0 mrad (H × V at base).

2.3. Data Reduction and Treatment

The X-ray diffraction datasets were reduced by the software package XDS [36] and also by the iMOSFLM package [37]. The output image format of the Eiger detector was HDF5, which can be directly processed with XDS.
In the case of data processing using iMOSFLM, the HDF5 to CBF conversion was done by the Eiger2cbf program, which in our case was able to automatically convert the whole dataset of a given HDF5 master file.
The data were scaled with Aimless [38], and the structures were solved with Molrep [39] and Refmac5 [40] programs of the CCP4 program suite [41]. Molrep was used to obtain phases with the lysozyme structure 1dpx [42] as a molecular replacement search model. The structure was then refined with Refmac5. The refined structure was used to generate the electron density maps.
The radial averaging of a 2D detector image to a 1D curve was calculated from the angular average of a circle at different q-values. Each pixel from the center of diffraction was considered to be one discrete q-value. The procedure is similar to the one implemented in the widely used pyFAI program [43].

3. Results

A description of the collected datasets and the data-reduction statistics are summarized in Table 1. The results were obtained at frame rates up to 3 kHz using an Eiger X 1M detector comprising two modules with approximately 1 million pixels. The collected datasets displayed remarkably low background noise, resulting in the detection of the peaks even at very low exposures.
Figure 3 shows a plot of the radial average of the X-ray intensities in the absence of a protein crystal (environmental background scattering). Different transmissions at a frequency of 1 kHz were investigated. It can be seen that the maximum noise level in the radial average of the background is well below one photon. At each exposure time, a set of background frames were recorded in order to differentiate the diffraction spots from the noise. At the lowest flux, the background images recorded in the absence of a crystal were as low as 2 photons/pixel, while diffraction spots in the images recorded with a crystal showed values as high as 8 photons/pixel.

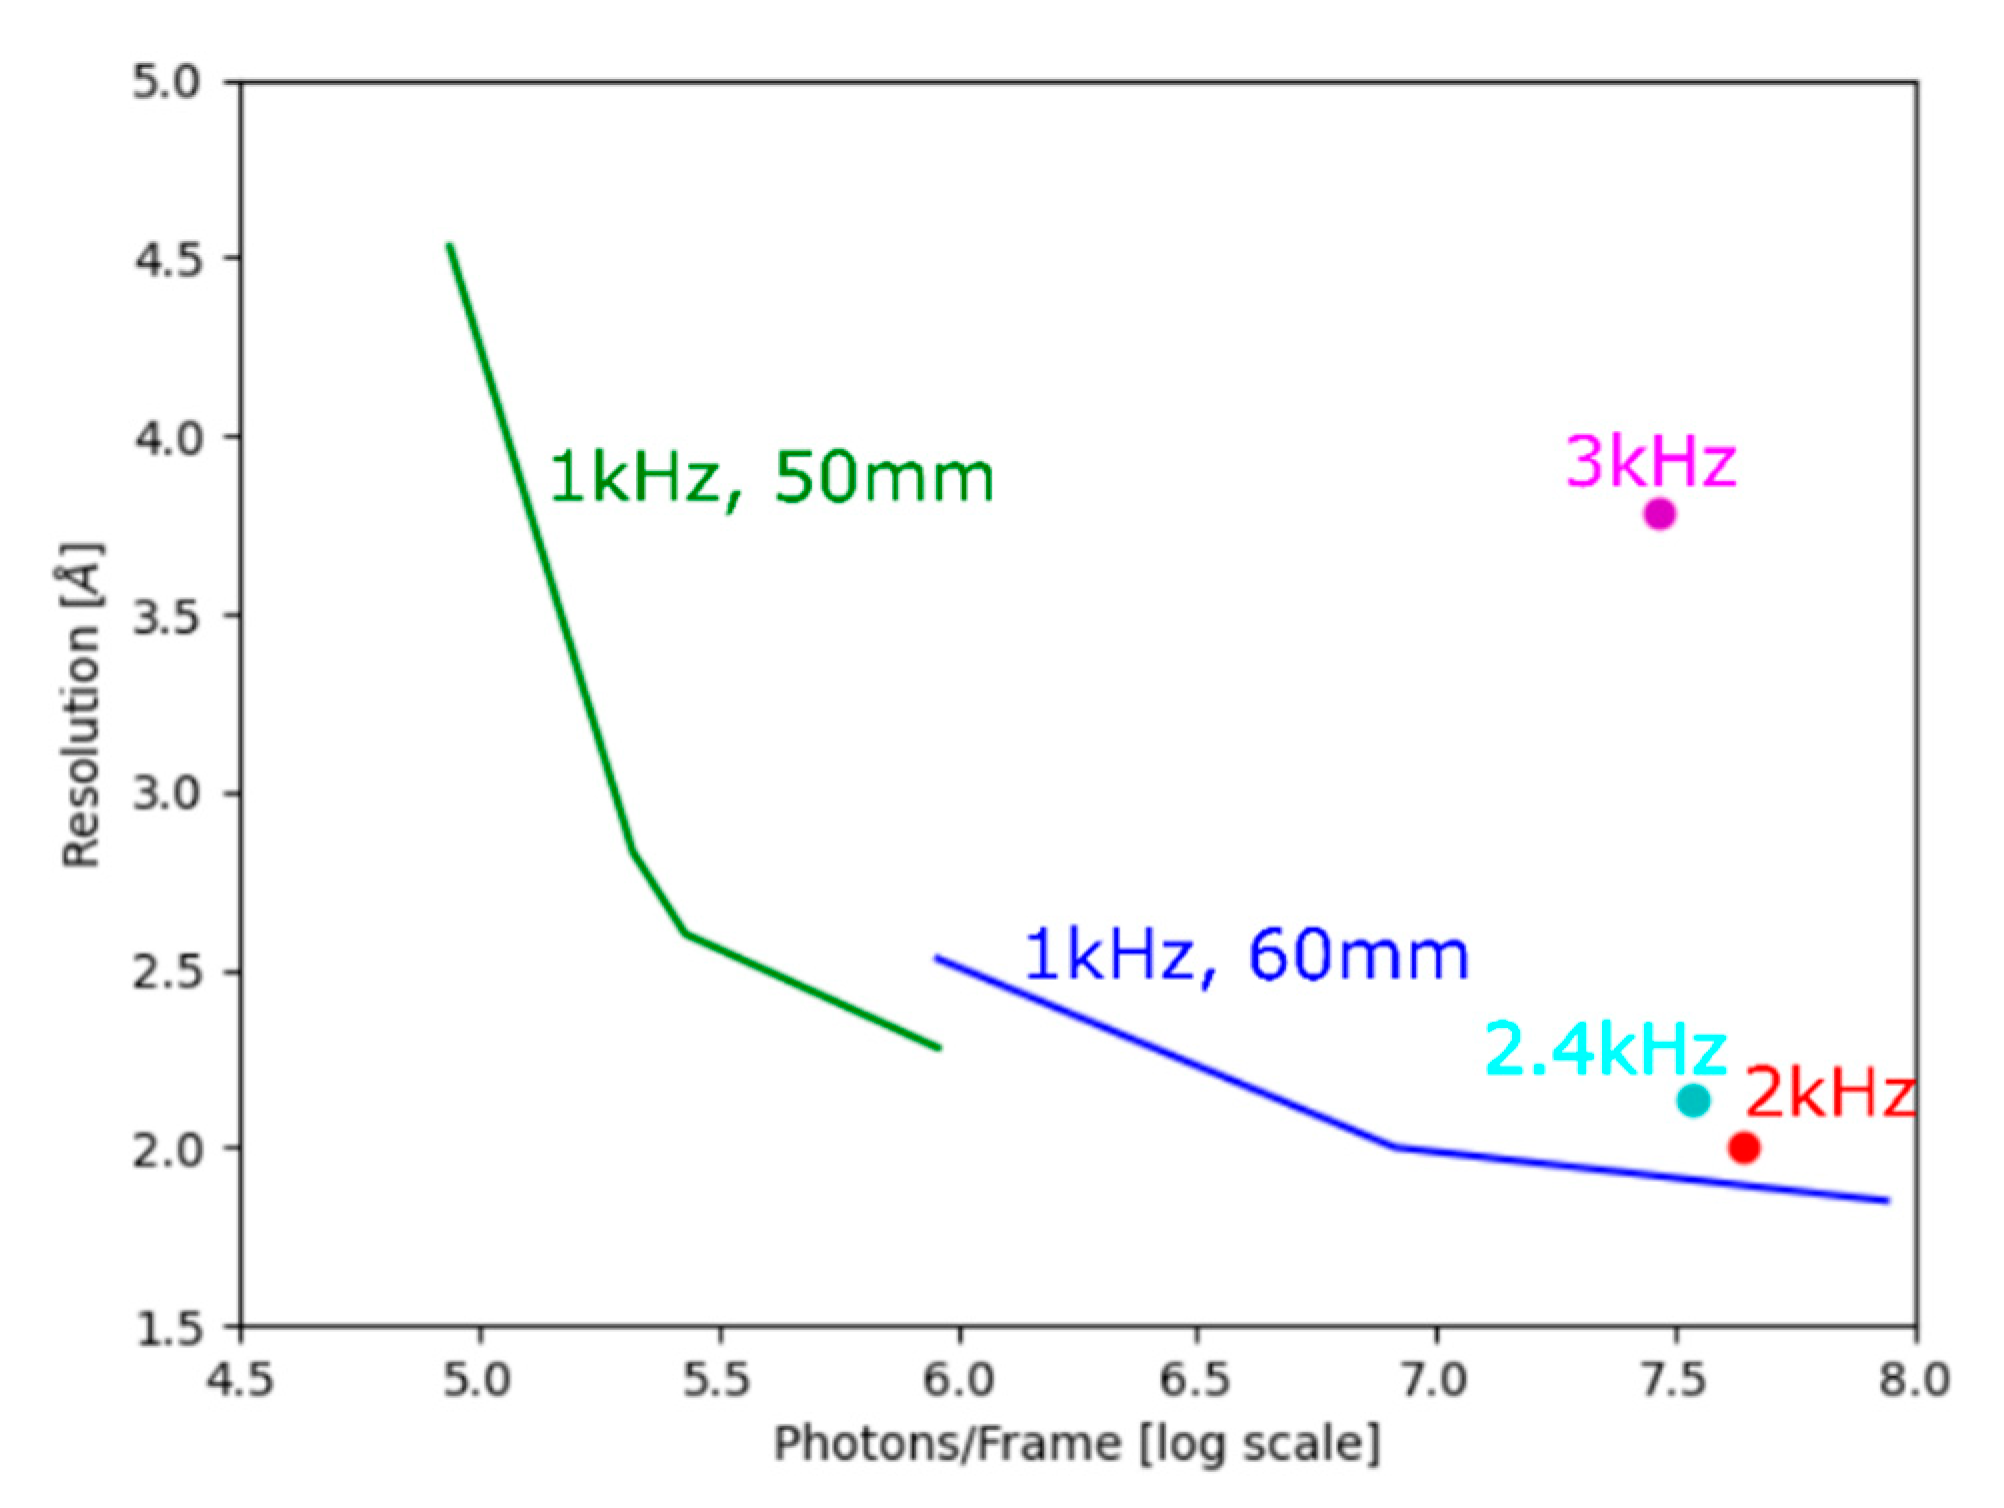
3.1. Investigation at a Frame Rate of 1 kHz

High-quality data were collected at low flux and at a frame rate of 1 kHz. Figure 4a shows an example of such a diffraction image obtained by summing thirty individual frames. The weaker spots in the diffraction can be attributed to the very low incident flux. A comparative diffraction pattern at the same repetition rate, but for the highest flux reported in this article is shown in Figure 4b. After manual inspection of the data, the X-ray diffraction datasets for 1 kHz were reduced with XDS. The results summarized in Table 1 indicate that the data treatment is straightforward at 1 kHz and at relatively high flux. Similar observations were recently reported by Casanas et al., 2016 [33]. Correspondingly, several statistical characteristics such as CC1/2, signal-to-noise ratio (I/σ(I)), etc., displayed good values confirming that the data are suitable for structural analysis. Thus, the data reduction is remarkably successful for all datasets at lower flux and at a 1 kHz frame rate. Any loss of resolution in between the datasets can be attributed to the lowering of the photon flux and therefore decreased (I/σ(I)).
The maps for 1 kHz at the lowest incident flux of ~108 photons/s (dataset L21_001) and for the 50% transmission of the incident photons (dataset L11_50) are shown in Figure 5a,b, respectively. The quality of the map corresponds to the statistical analysis presented in Table 1.

3.2. Frame Rates of 2 and 3 kHz

An example of a diffraction pattern collected at 3 kHz is shown in Figure 4c, which is also a sum of 30 consecutive frames. It is obvious that the diffraction spots are very pronounced compared to those in the pattern displayed in Figure 4a, where the spots are relatively weaker. At frame rates higher than 1 kHz, the data reduction provided some challenges. In our hands, XDS failed to give good statistical output for the initial images of the 2 and 3 kHz datasets. To overcome this problem, the iMOSFLM package was employed for the treatment of these data. iMOSFLM data reduction software can account for the discrepancies in the “mis-setting” angles (small rotations about the principle axes denoted φx, φy, and φz) of each frame resulting from any uneven movement of the crystal about the ω (or φ) axis. The obtained results yielded good statistical parameters as deduced by iMOSFLM. Note that the large values for mosaicity can be explained by the definitions and different methods of calculation between the programs iMOSFLM and XDS. iMOSFLM values are calculated base-to-base of the reflection across several images, while XDS calculates an estimated standard deviation of a Gaussian profile passing through the shortest route of the Ewald sphere. Indeed, the data acquisition at such high frame rates can also be affected by nonuniformity in the rotational speed of the MD2 goniometer axis, which may introduce an uneven rotational motion of the crystals. For the goniometer used in the present experiments, the maximum rotational speed without lag was limited to 120°/s, and the data collection at 2 kHz and 3 kHz exceeded this limit resulting in a lag of the protein crystals. This problem, coming from the axis rotation speed, is also the probable dominant cause of the lower ISa and higher mosaicity values during the analysis of the data at 2 kHz and 3 kHz with iMOSFLM. In addition, the effect of ramping of the speed to reach the desired value should be taken into account. The variations in the mis-setting angles can be caused by vibrations from the goniometer and/or the effects from the cold nitrogen gas cryostream. Although the data were collected in a series on one crystal with the 3 kHz being the last one, there were no obvious signatures of radiation damage in the diffraction patterns, such as the decay of the Bragg peak intensities at the highest resolution.
Despite the data having rather weak intensities, we have attempted to solve the structure of lysozyme collected at 2 kHz (dataset L12_50) and 3 kHz (dataset L13_50) frame rate. The electron density maps for the datasets at 2 kHz and 3 kHz are shown in Figure 6a,b, respectively. The quality of the maps corresponds to the statistical analysis presented in Table 1.
With the current state of laser-driven X-ray sources, the measurements with frame rates at 2 kHz and 3 kHz will become more feasible as more lasers operate at higher pulse rates with maintained pulse energy sufficient to drive the necessary plasma formation in the target. Our results indicate that the management of the goniometer rotation speed needs to be carefully considered when using sources with repetition rates higher than 1 kHz in operation. Thus, the rotation speed is a mechanical factor that interplays with the detector frame rate and the X-ray source flux. Furthermore, the vibrations induced by the cryo-stream gas flow can pose rotation speed limits on goniometers with high-speed motors.

3.3. Frame Rates of 2.4 kHz

In order to find out whether the problems with the 2 kHz and 3 kHz datasets stemmed from the uneven motion of the crystal, potentially arising from the fast speed of the goniometer and/or the cryo-stream, we have performed an experiment at 2.4 kHz with the rotational speed of goniometer of 120°/s, i.e., the maximum rotational speed without lag (according to the beamline specifications). The data reduction for this dataset was performed with XDS (summarized in Table 1) and gave reasonable statistics. The electron density map for the dataset at 2.4 kHz is shown in Figure 7.
Overall, Table 1 demonstrates that high-quality data can be obtained at a relatively low flux or high repetition rates. The obtained plot of resolution versus the input photon flux for 1, 2, 2.4 and 3 kHz frame rates are presented in Figure 8. As expected, the resolution depends on the photon flux for all investigated cases. The relatively lower resolution for the dataset at 3 kHz we suspect is attributed to various mechanical instabilities, such as goniometer rotation and/or cold streamflow, as noted above.

4. Discussion

Major differences in the characteristic of the synchrotron radiation and in-house laser-driven source that can be vital for the macromolecular crystallography are the coherence of the source (both spatial and temporal) and the photon flux density. Photon flux density can be compensated by the use of larger high-quality crystals compared to those used at Synchrotrons. The temporal coherence of laser-driven ultrafast X-ray source can be made comparable to that of Synchrotrons by using appropriate multilayer X-ray optics downstream of the source. Similarly, the spatial coherence of such sources can be made comparable to that of synchrotron beamlines by minimizing the divergence of the source with downstream X-ray optics. With the development of high-power lasers of kHz or higher repetition rate and continuous effort being made in ramping up the flux of laser-driven ultrafast X-ray sources [10], the result presented here takes us much closer to the realization of macromolecular crystallography with lab-based ultrafast X-ray sources. Nevertheless, proper characterization of the source and appropriate data collection and data analysis strategies must be adopted to truly harness the full potential of performing macromolecular crystallography with such laser-driven ultrafast X-ray sources. Scheme 1 highlights the parameters varied in our study.
Diffraction data collection at up to 1 kHz frame rate showed no instrumental limitations. From our analysis, we learned that ~1 million photons/frame on the crystal is necessary to obtain structure from a high-quality crystal, with a resolution better than 2.5 Å. This photon flux is comparable to what state-of-the-art laser-driven ultrafast X-ray sources currently deliver. The data collection at a frame rate higher than 1 kHz hinted that all potential sources that can introduce unwanted crystal movement need to be minimized. These sources of vibrations include those coming from the rotational speed of the goniometer above the mechanical limit of the instrument and/or the flow-rate of cryo-stream. Our analysis of data collected at 2.4 kHz frame rate at a slower rotational speed compared to 1 kHz, 2 kHz, and 3 kHz data show that the frame rate itself does not disable acquisition of good quality data. However, the goniometer rotation speed at the empirical limit of 120°/s already brings a slight deterioration of the resulting data. Therefore, the above-discussed problems of the 2 kHz and 3 kHz data sets are very likely caused by the unevenness of rotation and/or other vibrations. Further quantification of the impact of these factors on the quality of single-crystal diffraction data shall be pursued in the future. A special accent in our planned developments will be put on the fine comparison of 1 kHz, 2 kHz, and 3 kHz frame rates data at 100°/s, which may serve as a specific control experiment for additional verification of the results presented here. For data processing, alternatively, such diffraction data could also be reduced with software such as nXDS [44].

5. Conclusions

The development of new X-ray sources and detectors facilitates the development of new methods in crystallography and significantly impacts the extension of knowledge in biological sciences. Here we demonstrated that kilohertz macromolecular X-ray crystallography at frame rates up to 3 kHz and at a low flux of ~108 photon/sec works with the Eiger X 1M detector and revealed a normal behavior of the detector and the performance of the data processing software. The acquired data were further processed to obtain the corresponding structure at an acceptable resolution. These findings motivate further development of even higher frame rate detectors with integrating capabilities, such as the AGIPD or Jungfrau detector [4,5], which will become a key equipment in future crystallography. Until these detectors are not commercially available, Eiger-type detectors appear a preferable choice either for synchrotron or laboratory use for high frame rate crystallography. Though the approach used here is conventional rotation-based crystallography, the arguments presented are likewise applicable for serial X-ray crystallography. It can be concluded that in order to implement high frame rate kilohertz crystallography with the conventional rotation-based approach, a solution of the “crystal slippage”, due to various causes, must be sought. Our results contribute to the further development of synchrotron-based serial crystallography and also pave a way forward for the use of femtosecond laser-driven X-ray sources to study ultrafast dynamics in macromolecules.

Author Contributions

Conceptualization, W.S., J.H., J.A. and B.A.; data curation, S.E. and M.S.; formal analysis, K.P.K. and M.S.; funding acquisition, J.A.; investigation, S.E., M.S., J.D., W.S. and A.A.; methodology, V.P.; software, M.S. and W.S.; validation, M.S. and A.A.; visualization, K.P.K.; writing—original draft, K.P.K.; writing—review and editing, J.D., W.S., A.A., J.H. and J.A. All authors have read and agreed to the published version of the manuscript.

Funding

K.K., S.E., V.P., J.D., J.H. and B.A. are supported by the project “Structural dynamics of biomolecular systems” (CZ.02.1.01/0.0/0.0/15_003/0000447) (ELIBIO) and “Advanced research using high-intensity laser-produced photons and particles” (CZ.02.1.01/0.0/0.0/16_019/0000789) (ADONIS) from European Regional Development Fund. B.A. acknowledges the Czech Science Foundation project No.17-00973S, and cooperation with JINR, Dubna, Russia (3+3 program, No. 204, item 27 from 25.03.2020). K.K. acknowledges the financial support from the Czech Academy of Sciences (Grant number: MSM100101901). J.D. acknowledges institutional support of IBT CAS, v. v. i. (RVO: 86652036).

Acknowledgments

We acknowledge the allocation of beamtime at the PROXIMA 2A beamline (Synchrotron SOLEIL, Saint-Aubin, France) through the projects 20170581 and 20181489. We thank Damien Jeangerard for the assistance in using the beamline.

Conflicts of Interest

The authors declare no conflict of interest.

References

  1. Dinapoli, R.; Bergamaschi, A.; Henrich, B.; Horisberger, R.; Johnson, I.; Mozzanica, A.; Schmid, E.; Schmitt, B.; Schreiber, A.; Shi, X.; et al. EIGER: Next generation single photon counting detector for X-ray applications. Nucl. Instrum. Methods Phys. Res. Sect. A Accel. Spectometers Detect. Assoc. Equip. 2011, 650, 79–83. [Google Scholar] [CrossRef]
  2. Ciccone, L.; Fruchart-Gaillard, C.; Mourier, G.; Savko, M.; Nencetti, S.; Orlandini, E.; Servent, D.; Stura, E.A.; Shepard, W. Copper mediated amyloid-β binding to Transthyretin. Sci. Rep. 2018, 8, 13744. [Google Scholar] [CrossRef] [PubMed]
  3. Huang, C.-Y.; Olieric, V.; Ma, P.; Howe, N.; Vogeley, L.; Liu, X.; Warshamanage, R.; Weinert, T.; Panepucci, E.; Kobilka, B.; et al. In meso in situ serial X-ray crystallography of soluble and membrane proteins at cryogenic temperatures. Acta Crystallogr. Sect. D Struct. Biol. 2016, 72, 93–112. [Google Scholar] [CrossRef] [PubMed] [Green Version]
  4. Leonarski, F.; Redford, S.; Mozzanica, A.; Lopez-Cuenca, C.; Panepucci, E.; Nass, K.; Ozerov, D.; Vera, L.; Olieric, V.; Buntschu, D.; et al. Fast and accurate data collection for macromolecular crystallography using the JUNGFRAU detector. Nat. Methods 2018, 15, 799–804. [Google Scholar] [CrossRef] [PubMed]
  5. Orville, A.M. Entering an era of dynamic structural biology. BMC Biol. 2018, 16, 55. [Google Scholar] [CrossRef] [PubMed] [Green Version]
  6. Pellegrini, C. X-ray free-electron lasers: From dreams to reality. Phys. Scr. 2016, 111, 014004. [Google Scholar] [CrossRef]
  7. Zhavoronkov, N.; Gritsai, Y.; Bargheer, M.; Woerner, M.; Elsaesser, T.; Zamponi, F.; Uschmann, I.; Förster, E. Microfocus Cu Kα source for femtosecond X-ray science. Opt. Lett. 2005, 30, 1737–1739. [Google Scholar] [CrossRef]
  8. Korn, G.; Thoss, A.; Stiel, H.; Vogt, U.; Richardson, M.; Elsaesser, T.; Faubel, M. Ultrashort 1-kHz laser plasma hard X-ray source. Opt. Lett. 2002, 27, 866–868. [Google Scholar] [CrossRef]
  9. Zamponi, F.; Ansari, Z.; Schmising, C.V.K.; Rothhardt, P.; Zhavoronkov, N.; Woerner, M.; Elsaesser, T.; Bargheer, M.; Trobitzsch-Ryll, T.; Haschke, M. Femtosecond hard X-ray plasma sources with a kilohertz repetition rate. Appl. Phys. A 2009, 96, 51–58. [Google Scholar] [CrossRef]
  10. Weisshaupt, J.; Juvé, V.; Holtz, M.; Ku, S.; Woerner, M.; Elsaesser, T.; Ališauskas, S.; Pugžlys, A.; Baltuška, A. High-brightness table-top hard X-ray source driven by sub-100-femtosecond mid-infrared pulses. Nat. Photon. 2014, 8, 927–930. [Google Scholar] [CrossRef]
  11. Caffrey, M.; Li, D.; Howe, N.; Shah, S.T. ‘Hit and run’ serial femtosecond crystallography of a membrane kinase in the lipid cubic phase. Philos. Trans. R. Soc. B Biol. Sci. 2014, 369, 20130621. [Google Scholar] [CrossRef] [PubMed] [Green Version]
  12. Botha, S.; Baitan, D.; Jungnickel, K.E.J.; Oberthür, D.; Schmidt, C.; Stern, S.; Wiedorn, M.O.; Perbandt, M.; Chapman, H.N.; Betzel, C. De novo protein structure determination by heavy-atom soaking in lipidic cubic phase and SIRAS phasing using serial synchrotron crystallography. IUCrJ 2018, 5, 524–530. [Google Scholar] [CrossRef] [PubMed] [Green Version]
  13. Rousse, A.; Rischel, C.; Gauthier, J.C. Femtosecond X-ray crystallography. Rev. Mod. Phys. 2001, 73, 17–31. [Google Scholar] [CrossRef]
  14. Marangos, J.P. Introduction to the new science with X-ray free electron lasers. Contemp. Phys. 2011, 6, 551–569. [Google Scholar] [CrossRef]
  15. Hauf, C.; Salvador, A.-A.H.; Holtz, M.; Woerner, M.; Elsaesser, T. Phonon driven charge dynamics in polycrystalline acetylsalicylic acid mapped by ultrafast x-ray diffraction. Struct. Dyn. 2019, 6, 014503. [Google Scholar] [CrossRef] [Green Version]
  16. Chapman, H.N. X-Ray Free-Electron Lasers for the Structure and Dynamics of Macromolecules. Annu. Rev. Biochem. 2019, 88, 35–38. [Google Scholar] [CrossRef] [Green Version]
  17. Grünbein, M.L.; Bielecki, J.; Gorel, A.; Stricker, M.; Bean, R.; Cammarata, M.; Dörner, K.; Fröhlich, L.; Hartmann, E.; Hauf, S.; et al. Megahertz data collection from protein microcrystals at an X-ray free-electron laser. Nat. Commun. 2018, 9, 3487. [Google Scholar] [CrossRef]
  18. Schmidt, M. Time-Resolved Macromolecular Crystallography at Pulsed X-ray Sources. Int. J. Mol. Sci. 2019, 20, 1401. [Google Scholar] [CrossRef] [Green Version]
  19. Wiedorn, M.O.; Oberthür, D.; Bean, R.; Schubert, R.; Werner, N.; Abbey, B.; Aepfelbacher, M.; Adriano, L.; Allahgholi, A.; Al-Qudami, N.; et al. Megahertz serial crystallography. Nat. Commun. 2018, 9, 4025. [Google Scholar] [CrossRef] [Green Version]
  20. Chapman, H.N.; Fromme, N.; Barty, A.; White, T.A.; Kirian, R.A.; Aquila, A.; Hunter, M.S.; Schulz, J.; DePonte, D.P.; Weierstall, U.; et al. Femtosecond X-ray protein nanocrystallography. Nature 2011, 470, 73–77. [Google Scholar] [CrossRef]
  21. Schlichting, I. Serial femtosecond crystallography: The first five years. IUCrJ 2015, 2, 246–255. [Google Scholar] [CrossRef] [PubMed] [Green Version]
  22. Stagno, J.R.; Liu, Y.; Bhandari, Y.R.; Conrad, C.E.; Panja, S.; Swain, M.; Fan, L.; Nelson, G.; Li, C.; Wendel, D.R.; et al. Structures of riboswitch RNA reaction states by mix-and-inject XFEL serial crystallography. Nature 2017, 541, 242–246. [Google Scholar] [CrossRef] [PubMed]
  23. Weinert, T.; Olieric, N.; Cheng, R.; Brunle, S.; James, D.; Ozerov, D.; Gashi, D.; Vera, L.; Marsh, M.; Jaeger, K.; et al. Serial millisecond crystallography for routine room-temperature structure determination at synchrotrons. Nat. Commun. 2017, 8, 542. [Google Scholar] [CrossRef] [PubMed]
  24. Neutze, R.; Wouts, R.; van der Spoel, D.; Weckert, E.; Hajdu, J. Potential for biomolecular imaging with femtosecond X-ray pulses. Nature 2000, 406, 752–757. [Google Scholar] [CrossRef] [PubMed]
  25. Mancuso, A.P.; Aquila, A.; Batchelor, L.; Bean, R.J.; Bielecki, J.; Borchers, G.; Doerner, K.; Giewekemeyer, K.; Graceffa, R.; Kelsey, O.D.; et al. The Single Particles, Clusters and Biomolecules and Serial Femtosecond Crystallography instrument of the European XFEL: Initial installation. J. Synchrotron Radiat. 2019, 26, 660–676. [Google Scholar] [CrossRef]
  26. Martin-Garcia, J.M.; Conrad, C.E.; Nelson, G.; Stander, N.; Zatsepin, N.A.; Zook, J.; Zhu, L.; Geiger, J.; Chun, E.; Kissick, D.; et al. Serial millisecond crystallography of membrane and soluble protein microcrystals using synchrotron radiation. IUCrJ 2017, 4, 439–454. [Google Scholar] [CrossRef]
  27. Gati, C.; Bourenkov, G.; Klinge, M.; Rehders, D.; Stellato, F.; Oberthür, D.; Yefanov, O.; Sommer, B.P.; Mogk, S.; Duszenko, M.; et al. Serial crystallography on in vivo grown microcrystals using synchrotron radiation. IUCrJ 2014, 1, 87–94. [Google Scholar] [CrossRef]
  28. Rossmann, M.G. Serial crystallography using synchrotron radiation. IUCrJ 2014, 1, 84–86. [Google Scholar] [CrossRef]
  29. Bonvalet, A.; Darmon, A.; Lambry, J.C.; Martin, J.L.; Audebert, P. 1 kHz tabletop ultrashort hard X-ray source for time-resolved X-ray protein crystallography. Opt. Lett. 2006, 31, 2753–2755. [Google Scholar] [CrossRef] [Green Version]
  30. Kraft, P.; Bergamaschi, A.; Broennimann, C.; Dinapoli, R.; Eikenberry, E.F.; Henrich, B.; Johnson, I.; Mozzanica, A.; Schleputz, C.M.; Willmotta, P.R.; et al. Performance of single-proton-counting PILATUS detector modules. J. Synchrotron Radiat. 2009, 16, 368–375. [Google Scholar] [CrossRef]
  31. Johnson, I.; Bergamaschi, A.; Billich, H.; Cartier, S.; Dinapoli, R.; Greiffenberg, D.; Guizar-Sicairos, M.; Henrich, B.; Jungmann, J.; Mezza, D.; et al. Eiger: A single-photon counting X-ray detector. J. Instrum. 2014, 9, C05032. [Google Scholar] [CrossRef]
  32. Radicci, V.; Bergamaschi, A.; Dinapoli, R.; Greiffenberg, D.; Henrich, B.; Johnson, I.; Mozzanica, A.; Schmitt, B.; Shi, X. EIGER a new single photon counting detector for X-ray applications: Performance of the chip. J. Instrum. 2012, 7, C02019. [Google Scholar] [CrossRef] [Green Version]
  33. Casanas, A.; Warshamanage, R.; Finke, A.D.; Panepucci, E.; Olieric, V.; Nöll, A.; Tampé, R.; Brandstetter, S.; Förster, A.; Mueller, M.; et al. EIGER detector: Application in macromolecular crystallography. Acta Crystallogr. Sect. D Struct. Biol. 2016, 72, 1036–1048. [Google Scholar] [CrossRef]
  34. Duran, D.; Couster, S.L.; Desjardins, K.; Delmotte, A.; Fox, G.; Meijers, R.; Moreno, T.; Savko, M.; Shepard, W. PROXIMA 2A—A new fully tunable micro-focus beamline for macromolecular crystallography. J. Phys. Conf. Ser. 2013, 425, 012005. [Google Scholar] [CrossRef]
  35. McPherson, A.; Gavira, J.A. Introduction to protein crystallization. Acta Crystallogr. Sect. F Struct. Biol. Commun. 2014, 70, 2–20. [Google Scholar] [CrossRef] [PubMed] [Green Version]
  36. Kabsch, W. Integration, scaling, space-group assignments and post-refinement. Acta Crystallogr. Sect. D Struct. Biol. 2010, 66, 125–132. [Google Scholar] [CrossRef] [PubMed] [Green Version]
  37. Battye, T.G.; Kontogiannis, L.; Johnson, O.; Powell, H.R.; Leslie, A.G. iMOSFLM: A new graphical interface for diffraction-image processing with MOSFLM. Acta Crystallogr. Sect. D Biol Crystallogr. 2011, 67, 271–281. [Google Scholar] [CrossRef] [Green Version]
  38. Evans, P.R.; Murshudov, G.N. How good are my data and what is the resolution? Acta Crystallogr. Sect. D Struct. Biol. 2013, 69, 1204–1214. [Google Scholar] [CrossRef]
  39. Vagin, A.A.; Teplyakov, A. MOLREP: An automated program for molecular replacement. J. Appl. Crystallogr. 1997, 30, 1022–1025. [Google Scholar] [CrossRef]
  40. Murshudov, G.N.; Skubak, P.; Lebedev, A.A.; Pannu, N.S.; Steiner, R.A.; Nicholls, R.A.; Winn, M.D.; Long, F.; Vagin, A.A. REFMAC5 for the refinement of macromolecular crystal structures. Acta Crystallogr. Sect. D Struct. Biol. 2011, 67, 355–367. [Google Scholar] [CrossRef] [Green Version]
  41. Collaborative Computational Project. The CCP4 suite: Programs for protein crystallography. Acta Crystallogr. Sect. D Biol. Crystallogr. 1994, 50, 760–763. [Google Scholar] [CrossRef] [PubMed]
  42. Weiss, M.S.; Palm, G.J.; Hilgenfeld, R. Crystallization, structure solution and refinement of hen egg-white lysozyme at pH 8.0 in the presence of MPD. Acta Crystallogr. Sect. D Struct. Biol. 2000, 56, 952–958. [Google Scholar] [CrossRef] [PubMed]
  43. Kieffer, J.; Karkoulis, D. PyFAI, a versatile library for azimuthal regrouping. J. Phys. Conf. Ser. 2013, 425, 202012. [Google Scholar] [CrossRef]
  44. Kabsch, W. Processing of X-ray snapshots from crystals in random orientations. Acta Crystallogr. Sect. D Struct. Biol. 2014, 70, 2204–2216. [Google Scholar] [CrossRef]
Figure 1. Photograph of the experimental setup at Proxima 2A beamline. The lysozyme crystal was mounted on an MD2 goniometer and cryo-cooled during the data collection with an Eiger X 1M detector.
Crystals 10 01146 g001
Figure 2. Micrograph of the protein crystals used in the study. The crystallization procedure yielded lysozyme crystals of the tetragonal space group P43212 (Table 1). The scale bar corresponds to 20 μm.
Crystals 10 01146 g002
Figure 3. Radial average of the X-ray diffraction intensities determined at 1 kHz operational frequency of frame readout of the Eiger X 1M detector for different transmissions and in the lack of protein crystals, i.e., the background coming from the air scattering and other factors. Y-axis gives the radial average of photons counted by the detector per 1 ms exposure time per frame. The average is calculated for one typical background frame.
Crystals 10 01146 g003
Figure 4. Examples of diffraction images acquired at (a) the lowest flux of ~108 photons/s (dataset L21_001), (b) at 1 kHz frame rate with 50% of the incident photon flux ~9 × 10¹⁰ photons/s (dataset L11_50), and (c) at 3 kHz frame rate with 50% of the incident photon flux ~9 × 10¹⁰ photons/s (dataset L13_50) (summation of 30 images for each subpanel).
Crystals 10 01146 g004
Figure 5. 2mFobs- DFcalc (contoured at 1σ) for residues 5–45 of lysozyme (a) for data collected at 0.01% transmission of the incident flux (dataset L21_001) and 1 kHz frame rate (b) for data collected at 50% transmission of the incident flux and 1 kHz frame rate (dataset L11_50).
Crystals 10 01146 g005
Figure 6. 2mFobs- DFcalc electron density (contoured at 1σ) for residues 5–45 of lysozyme (a) for data collected at 2 kHz frame rate (dataset L12_50) (b) for data collected at 3 kHz frame rate (dataset L13_50).
Crystals 10 01146 g006
Figure 7. 2mFobs- DFcalc electron density (contoured at 1σ) for residues 5–45 of the lysozyme for data collected at 2.4 kHz frame rate (dataset L12.4_5).
Crystals 10 01146 g007
Figure 8. A plot of resolution versus the number of photons (on the crystal) per frame (see Table 1) after the analysis with the XDS and iMOSFLM programs.
Crystals 10 01146 g008
Scheme 1. Parameters that were varied during the data collection strategies to find the conditions that would simulate future in-house laser-driven plasma source installations. Rotation speed 100°/s, frame rate 1 kHz, and flux on the crystal at least 106 photons/frame appeared to be the preferred parameters.
Crystals 10 01146 sch001
Table 1. Details of experimental data and data reduction results. The results for lyz1 2 kHz and lyz1 3 kHz were obtained with iMOSFLM, and the others were obtained with XDS. The space group of the crystals in all cases is P43212. The X-ray energy 10.836 keV, sample temperature 100 K, total rotation range 360°, rotation range per image 0.1°, number of images 3600. The crystal detector distance was 60 mm for lyz1 and 50 mm for lyz2. The data in parenthesis corresponds to the highest resolution shell.
Datasetlyz1 1 kHz
0.5Io
lyz1 1 kHz
5Io
lyz1 1 kHz
50Io
lyz1 2 kHz
50Io
lyz1 2.4 kHz
5Io
lyz1 3 kHz
50Io
lyz2 1 kHz
0.01Io
lyz2 1 kHz
0.05Io
lyz2 1 kHz
0.1Io
lyz2 1 kHz
0.5Io
Dataset abbreviationL11_05L11_5L11_50L12_50L12.4_5L13_50L21_001L21_005L21_01L21_05
Rotation speed (°/s)100100100200120300100100100100
Exposure time (s)0.0010.0010.0010.00050.000410.00030.0010.0010.0010.001
Set transmission (%)0.5550505500.010.050.10.5
Flux 1 (photons/s) on crystal9.1 × 1088.2 × 1098.7 × 10108.7 × 10108.2 × 1098.7 × 10108.7 × 1072.1 × 1082.7 × 1089.1 × 108
Unit cell
a = b (Å)75.9776.1476.379.1676.1278.9775.875.975.9976.08
c (Å)35.4735.5435.6137.0135.5435.0135.1635.3635.435.44
Mosaicity (°) * MOSFLM0.110.110.150.68 *0.140.74 *0.070.070.070.07
Resolution (Å)2.53 (2.64–2.53)2.0 (2.07–2.0)1.85 (1.93–1.85)2.0 (2.09–2.0)2.14 (2.18–2.14)3.78 (3.86–3.78)4.53 (4.64–4.53)2.83 (2.96–2.83)2.6 (2.71–2.6)2.28 (2.40–2.28)
No. of reflection92,496179,722209,230199,428156,432151,61615,92361,38286,921179,654
No. of unique reflection3762745394088388630861601009296539227444
Completeness (%)99.5 (97.3)99.6 (96.3)99.7 (96.9)99.9 (95.6)99.7 (97.0)98.1 (92.0)99.1 (95.1)99.4 (93.4)99.5 (94.0)99.5 (94.9)
Multiplicity24.6 (24.2)24.1 (16.1)22.2 (12.5)23.8 (17.1)24.8 (19.1)24.6 (16.3)15.8 (17.8)20.7 (19.0)22.2 (19.8)24.1 (17.9)
ISa7.3219.3518.1627.2316.8323.924.094.724.187.11
I/σ(I)10.8 (3.9)26.2 (5.8)37.7 (3.1)45.0 (6.1)22.1 (4.2)21.0 (4.8)5.7 (3.4)7.1 (4.1)7.7 (3.1)8.3 (3.0)
Rmeas (%)28.2 (58.2)10.1 (54.5)6.2 (48.0)5.9 (13.8)11.2 (55.1)6.0 (22.3)47.7 (49.8)42 (76.0)37.7 (61.8)29.1 (48.2)
CC1/299.2 (95.9)99.9 (96.0)99.9 (95.1)99.9 (88.2)99.9 (90.2)91.7 (76.3)96.1 (95.8)97.8 (92.4)98.5 (89.5)99.3 (82.2)
1 The beam divergence was 1.6 × 1.0 mrad.
Publisher’s Note: MDPI stays neutral with regard to jurisdictional claims in published maps and institutional affiliations.

