Article

Microstructure and Material Properties of Ti-15mass%Nb Alloy after Gas Nitriding and Quenching Process

1
Department of Materials Science and Engineering, National Institute of Technology (KOSEN), Suzuka College, Suzuka 510-0294, Japan
2
Advanced Engineering Course of Science and Technology for Innovation, National Institute of Technology (KOSEN), Suzuka College, Suzuka 510-0294, Japan
*
Author to whom correspondence should be addressed.
Crystals 2020, 10(12), 1156; https://doi.org/10.3390/cryst10121156
Submission received: 30 November 2020 / Revised: 16 December 2020 / Accepted: 17 December 2020 / Published: 18 December 2020
(This article belongs to the Special Issue Thermomechanical Processing and Microstructure Control of Ti Alloys)

Abstract

:
The α′ martensite of Ti-15mass%Nb alloy exhibits high internal friction with high damping properties. However, its structure is smoother than the α + β structure. Therefore, a hardened surface layer is required for abrasion resistance. This study fabricated a martensite structure inside the nitriding layer by quenching, after gas nitriding at 1023 and 1223 K. Vickers hardness test, X-ray diffraction, scanning electron microscopy (SEM), and SEM-energy dispersive X-ray (SEM-EDX) measurements from the surface to the inside were made after the heat treatment process. In addition, the Young’s modulus and internal friction were calculated from the damping analysis. The α-TiN0.3 and β phase region was formed at approximately 80 µm from the surface at 1023 and 1223 K, and it was hardened. The internal friction of the gas nitriding and quenching specimens at 1023 and 1223 K was relatively high, though it did not reach that of the as-quenched specimen owing to the influence of the surface structure. From these results, it is considered that these material property values of the alloy can be controlled using the nitriding and quenching processes.

1. Introduction

Although titanium and its alloys have been used as structural materials, various studies have employed its functional properties, such as low Young’s modulus E [1,2,3], shape memory effect [4,5,6], and super elasticity [6,7,8,9]. In addition to the functional properties, it was established that the α’ martensite structure of the Ti-15mass%Nb alloy exhibits high internal friction Q−1 with high damping properties [10,11,12]. However, the α’ martensite structure is smoother than that of the α + β structure [10]. Therefore, a hardened surface layer is required for abrasion resistance. The nitriding is often performed as a typical surface treatment method for hardening a titanium alloy. There are many reports on the plasma nitriding [13,14,15,16,17,18] and gas nitriding [19,20,21,22,23,24,25,26,27] of titanium and its alloys. However, there are few reports on the nitriding of Ti-Nb alloy systems or the martensite structure of titanium alloys.
Plasma nitriding occurs at a wide range of temperatures from approximately 773 to 1373 K, whereas gas nitriding occurs at only high temperatures ranging from approximately 973 to 1273 K. Therefore, to obtain high hardness and high damping properties, a nitriding process at a relatively low temperature while maintaining the martensite structure of the titanium alloy and forming a martensite structure after nitriding at a high temperature can be considered. In the former, we attempted the plasma nitriding of Ti-15mass%Nb alloy at a relatively low temperature range of approximately 773 K, but only the outermost surface could be hardened. Therefore, this study fabricated a martensite structure inside the nitriding layer by quenching after gas nitriding at 1023 and 1223 K.

2. Materials and Methods

Ti-15mass%Nb alloy was used in this study. It was cut to achieve the following dimensions: 15 × 10 × 1 mm for the Vickers hardness test (HM-220D; Motutoyo, Kawasaki, Japan), scanning electron microscopy (SEM) (S-4300; HITACHI, Tokyo, Japan), and X-ray diffraction (XRD) measurement (SmartLab; Rigaku, Tokyo, Japan), and 70 × 7 × 1 mm for damping analysis (DS3000; Ono Sokki, Yokohama, Japan). The specimen was placed on a quartz boat and then poured into a quartz tube in an electric furnace, and the evacuation process and nitrogen gas substitution were repeated three times. The nitrogen gas used had a purity of 99.999%, and it was set to a pressure of 0.15 MPa. After heating at 1023 or 1223 K and holding for 3.6 ks in a nitrogen atmosphere, the quartz boat was soaked in ice water for quenching. This heat treatment is called the gas nitriding and quenching process (GNQP). The Vickers hardness test was performed at intervals of 20 μm for the cross-sectional depth direction with a test force of 0.01 kgf and a holding time of 15 s. Damping analysis was performed via the free resonance method. The attenuation waveform of the vibration amplitude was read, and the frequency response function was obtained. The E was calculated from the resonance frequency, and the Q−1 was calculated from the Hilbert calculation. Mirror-polished cross-sectional specimens were used for SEM observation and SEM-energy dispersive X-ray (EDX) measurement. The constituents of the layer from the surface to a depth of 150 µm were investigated via XRD analysis of CuKα (40 kV, 30 mA). The GNQP specimens were ground to 10, 50, and 150 µm from the surface.

3. Results

Figure 1 shows the cross-sectional SEM microstructure after GNQP. A brighter layer was formed on the surface for the microstructure at 1023 K (a). In addition, a dense acicular structure of 30 µm and sparse long acicular structure of 50 µm were observed. At 1223 K (b), the first layer of 10 µm, a dense massive structure layer of 16 µm and a sparse massive structure of 54 µm were formed. At the corner area of the specimen (c), a wide area lamellar microstructure was formed in addition to the first layer of 10 μm.
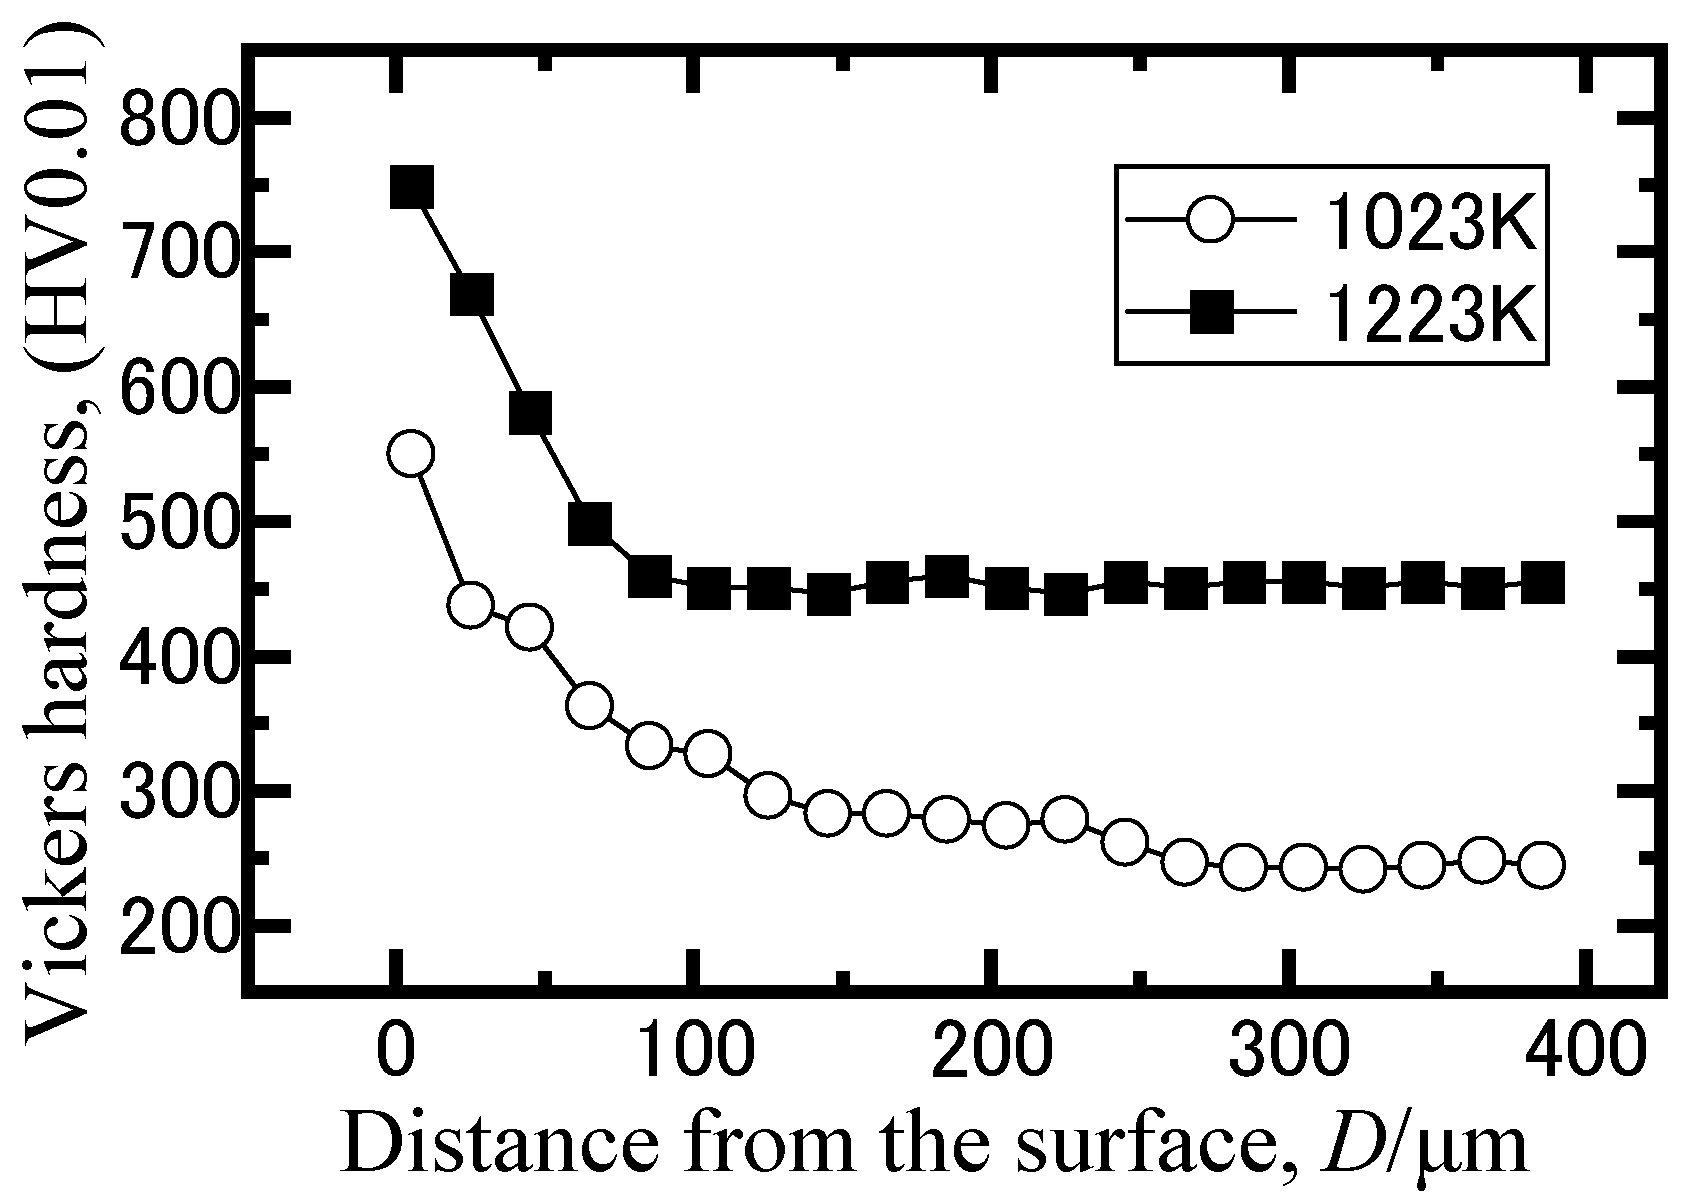
Figure 2 shows the micro Vickers hardness distribution from the surface after GNQP. At 1023 K, the hardness of the surface layer was 540 HV, and it was 327 HV at a depth of 100 µm. The hardness of the α′ martensite in the alloy was approximately 240 HV [10], which is equivalent to that observed at a position deeper than 250 µm. Conversely, the hardness of the surface layer was 720 HV at 1223 K, which was 450 HV at a depth of 100 µm. At deeper positions, almost the same hardness value was maintained, and it did not drop to a similar hardness to that of the α′ martensite.
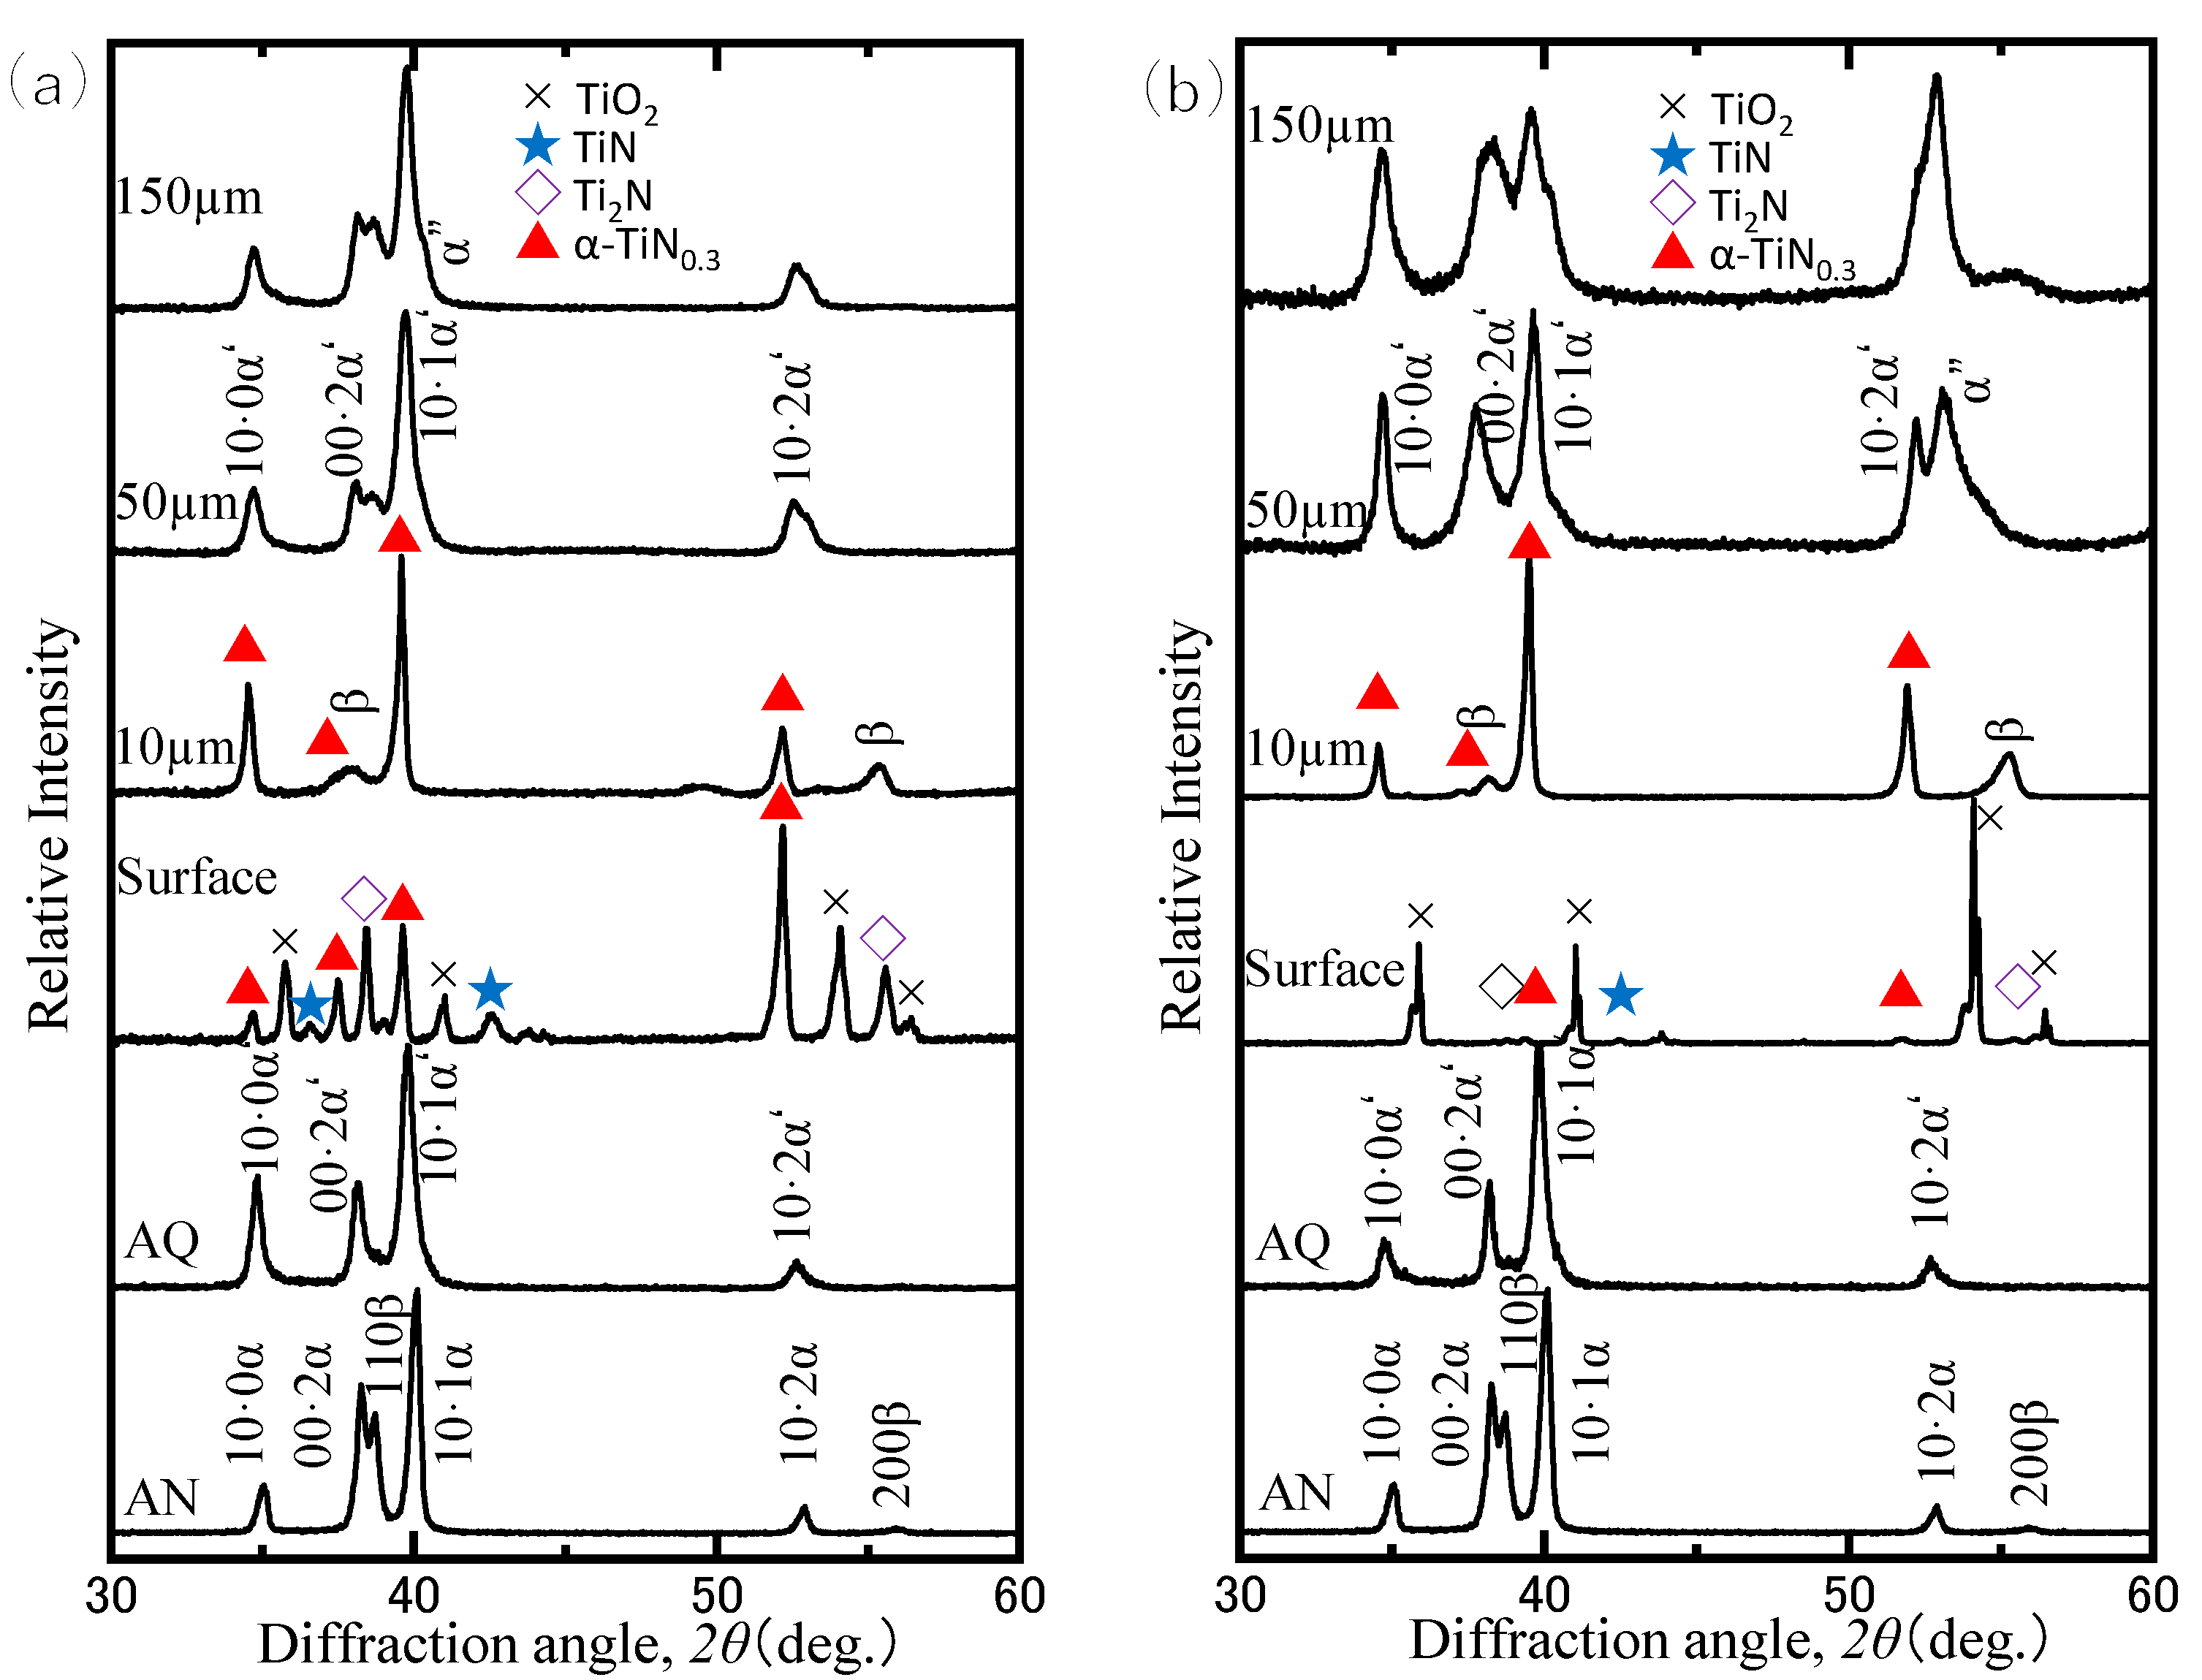
Figure 3 shows the change in the XRD profile from the surface. For comparison, the XRD profiles of the as-annealed (AN) and the as-quenched (AQ) specimens at 1023 and 1223 K are shown in the figure [11,12]. From Figure 3, it can be observed that the AN has a mixed phase structure of the α phase and the β phase. However, in the AQ, the supersaturated α′ martensite exhibits a diffraction peak shifted to a lower angle than the α phase; thus, it can be observed that the α′ martensite expanded. Comparing the calculated lattice constants of the α′ martensite with the annealed α phase from the XRD profiles, expansion of the a-axis is approximately 0.8% and that of the c-axis is approximately 0.2%. At the surface XRD profile at 1023 K (a), the diffraction peaks of TiO2, TiN, Ti2N, and α-TiN0.3 were detected. In addition to the α-TiN0.3 peak, β phase diffraction peaks were detected in the XRD profile after 10 μm grinding. After 50 µm grinding, it was considered that the structure contained the α′ martensite. After 150 µm grinding, for some percentage of the structure to be changed into the α′′ martensite, the peaks were split. For the surface at 1223 K (b), the diffraction peaks of TiO2 were very strong. However, very weak peaks of TiN, Ti2N, and α-TiN0.3 were also detected. Similar to that at 1023 K, α-TiN0.3 and β phase were detected at 10 μm, and the α′ martensite was detected at 50 μm. Because the diffraction peak of the α′ martensite is very broad, residual strain is generated. Moreover, a part of the structure is formed as an α′′ martensite from the separation state of the peak. Even after 150 µm grinding, the diffraction peak was still broadened, and a large residual strain was introduced during the formation of the martensite.
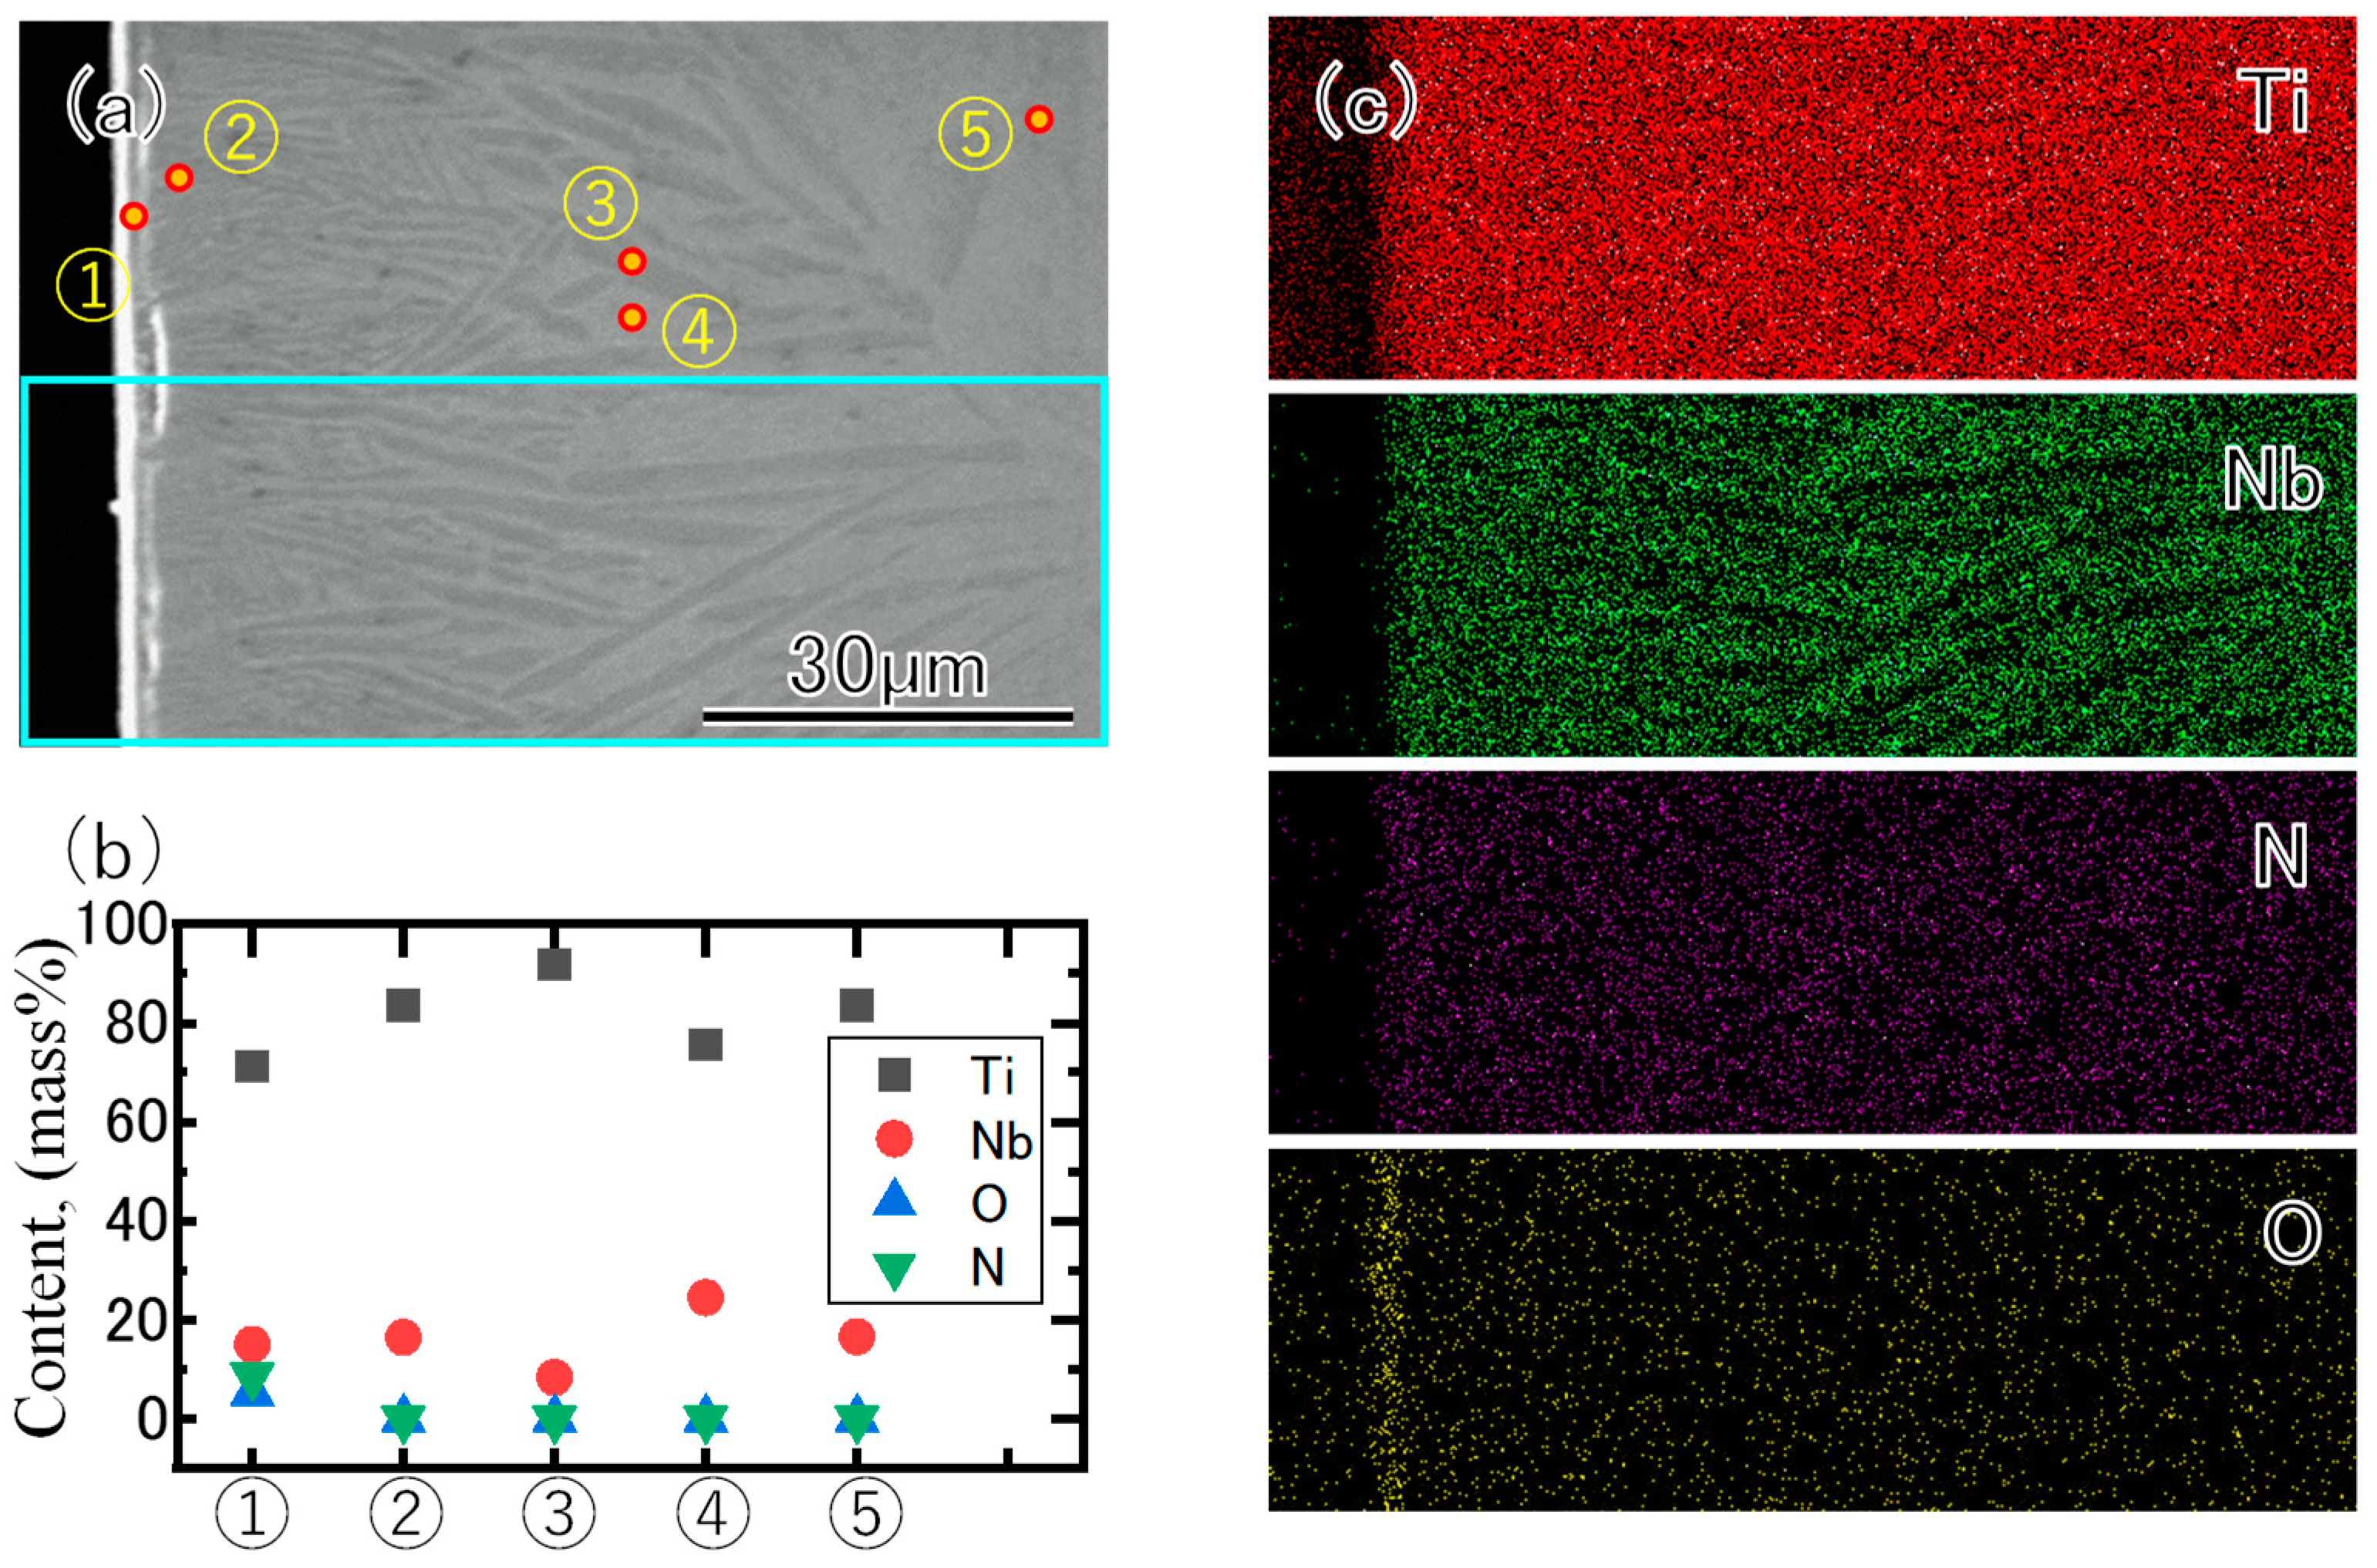
Figure 4 shows the cross-sectional SEM-EDX analysis results after GNQP at 1023 K. In the SEM image (a), the position where the point analysis was performed and the mapping range surrounded by the light blue frame area are shown. Nitrogen and oxygen were detected at the outermost surface (1) of the point analysis result (b), and a decrease in Ti content was observed. This is attributed to the formation of nitrides and oxides. Almost no nitrogen and oxygen were detected in regions (2) to (5), marked on (a). A decreased content of Nb was observed in the dark region (3), whereas it increased in the bright region (4). In region (5), the default amount of Nb is shown. In the element mapping result (c), a region of increased/decreased Ti and Nb contents detected via point analysis was detected. Although it is difficult to evaluate the distribution of N, an increase in O was observed in the outermost surface region.
Figure 5 shows the cross-sectional SEM-EDX analysis results after GNQP at 1223 K. The position of the point analysis and the mapping range are indicated in the SEM image (a). The amount of oxygen detected at the outermost surface (1) of the point analysis result is high (b), indicating that it is an oxide film layer. It can be observed that nitrogen is detected and diffused in region (2). The amount of Nb decreased in the dark region (3), whereas it increased in the bright region (4). In the element mapping result (c), a region of increased/decreased Ti and Nb contents detected via point analysis could be confirmed. In addition, the distribution of nitrogen corresponds to the region with a high amount of Ti. The distribution of oxygen was confirmed in the outermost surface region, and it was established that a TiO2 layer was formed.
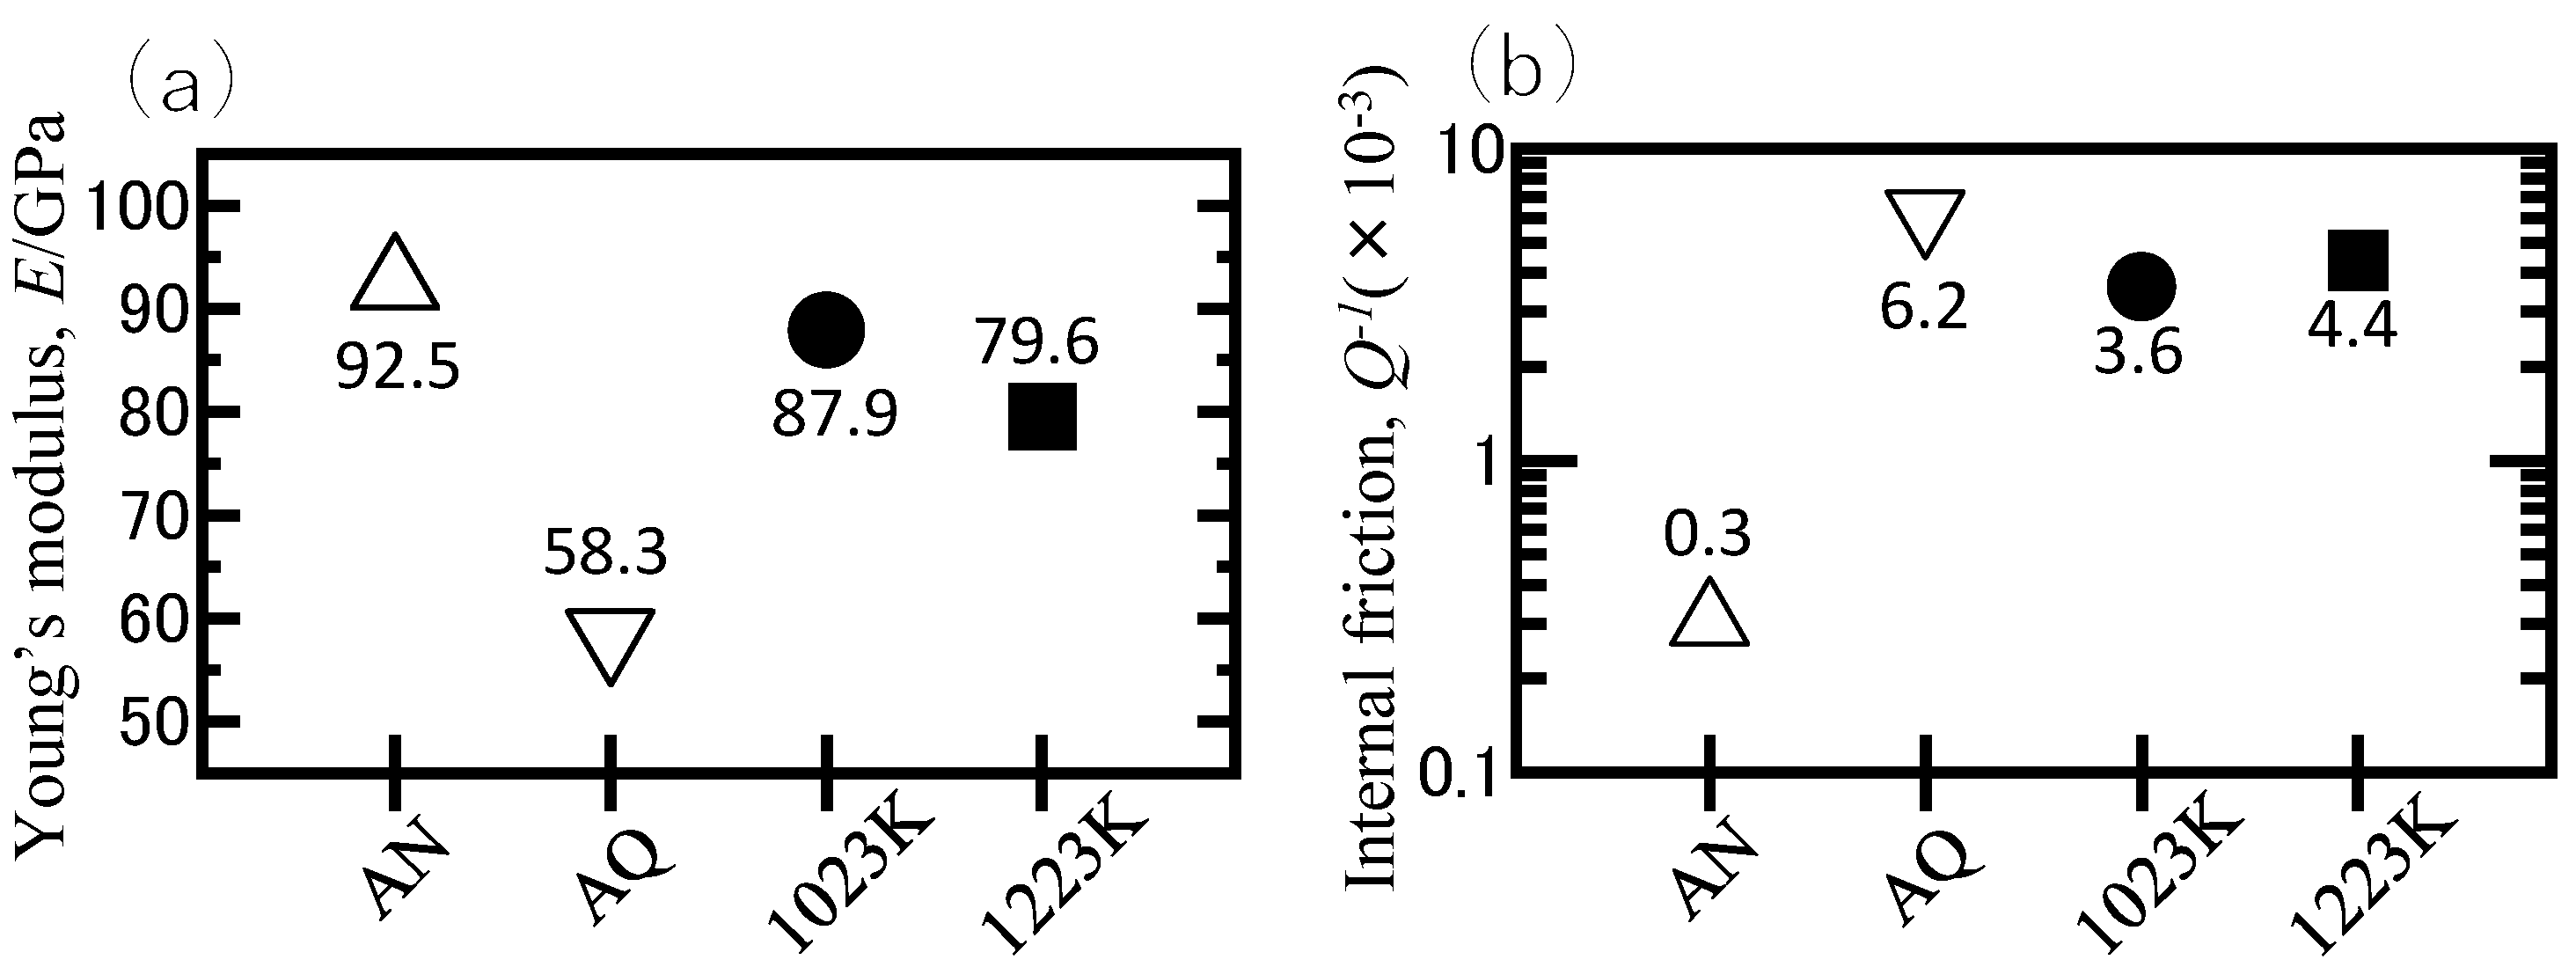
Figure 6 shows the E (a) and the Q−1 (b) after each heat treatment. The E of the Ti-15Nb alloy AN specimen with α + β structure is 92.5 GPa, whereas that of the AQ specimen with the α′ martensite structure is 58.3 GPa [10,11,12]. That of the specimen after GNQP at 1023 K was 87.9 GPa, whereas that of the specimen after GNQP at 1223 K was 79.6 GPa, indicating a high value close to that of the AN specimen, although the α′ martensite structure was formed. Conversely, the Q−1 (× 10−3) of the AQ specimen increased from 0.3 to 6.2, showing high damping properties. The Q−1 of the specimen after GNQP at 1023 K was 3.6, whereas that of the specimen after GNQP at 1223 K was 4.4, indicating relatively high values, although not as high as that of the AQ specimen. Notably, these changes are consistent with the influence of the formed layer and the state of the α′ martensite structure.

4. Discussion

The microstructural state is discussed based on the results of the Vickers hardness test, X-ray diffraction, and SEM-EDX analysis. The oxide film layer formed on the outermost surface was formed during water quenching. During gas nitriding, nitrogen diffuses from the surface to a depth of approximately 80 µm, and nitrides are formed in the portion close to the surface layer. In addition, because nitrogen diffuses in α-Ti, α-TiN0.3 with a low Nb content is formed. Moreover, the portion with a high Nb content becomes a β phase, and it remains even after quenching. In particular, GNQP at 1223 K is significantly affected by the structural change of the surface layer, and the residual strain remains inside the specimen during quenching and shows high hardness. Conversely, the base value of hardness is high in gas nitriding at temperatures above 1223 K, and a similar phenomenon occurs [23].
The specimen after GNQP at 1023 K exhibited an E value closer to that of the AN specimen than that of the AQ specimen. According to the XRD results shown in Figure 3, the α′ martensite structure is formed at 80 µm from the surface layer. Notably, the actual value is slightly lower, but according to this measurement method, it is possible that it was significantly influenced by the acicular structure of the surface layer. Further factors need to be explored. The Q−1 is relatively high, which corresponds to the value of the α′ martensite structure inside [10,11,12]. Conversely, the specimen after GNQP at 1223 K exhibited a relatively high E. This is attributed to the increase in hardness and the effect of the surface structure. Further, when the Q−1 of the alloy was increased, the hardness reduced and the E decreased. However, after the GNQP treatment, the hardness increased, the E increased, and the Q−1 was relatively high, although it was not as high as that of the AQ specimen. From these results, it is considered that the material property values of the alloy can be controlled by the GNQP heat treatment.

5. Conclusions

In this study, the changes in the microstructure and material properties of the Ti-15mass%Nb alloy after GNQP at 1023 or 1223 K were investigated. The following conclusions were obtained:
(1)
As a result of changing the hardness in the depth direction after GNQP, the region of α-TiN0.3 and β phase was formed at approximately 80 µm at 1023 and 1223 K, and this region was hardened. It was established that the hardness of the α′ martensite was observed in the region deeper than 250 µm at 1023 K, whereas the inside was also very hard at 1223 K. From the XRD result at 1223 K, it was established that although the martensite structure was formed in the internal region, it was extremely strained.
(2)
It was established that the Q−1 of the specimens after GNQP was relatively high, though both 1023 and 1223 K did not reach the AQ specimen due to the influence of the surface structure. In addition, the E showed a high value close to that of the AN specimen. From these results, it is considered that the material property values of the alloy can be controlled by the GNQP heat treatment.

Author Contributions

Conceptualization, Methodology, Validation, Writing: Y.M.; Investigation: K.S. and N.E. All authors have read and agreed to the published version of the manuscript.

Funding

This research received no external funding.

Conflicts of Interest

The authors declare no conflict of interest.

References

  1. Ozaki, T.; Matsumoto, H.; Watanabe, S.; Hanada, S. Beta Ti alloys with low young’s modulus. Mater. Trans. 2004, 45, 2776–2779. [Google Scholar] [CrossRef] [Green Version]
  2. Matsumoto, H.; Watanabe, S.; Hanada, S. α′ martensite Ti-V-Sn alloys with low Young’s modulus and high strength. Mater. Sci. Eng. A 2007, 448, 39–48. [Google Scholar] [CrossRef]
  3. Bönish, M.; Calin, M.; Humbeeck, J.V.; Skrotzki, W.; Eckert, J. Factors influencing the elastic moduli, reversible strains and hysteresis loops in martensitic Ti-Nb alloys. Mater. Sci. Eng. C 2015, 48, 511–520. [Google Scholar] [CrossRef]
  4. Kim, H.Y.; Hashimoto, S.; Kim, J.I.; Hosoda, H.; Miyazaki, S. Mechanical Properties and Shape Memory Behavior of Ti-Nb Alloys. Mater. Trans. 2004, 45, 2443–2448. [Google Scholar] [CrossRef] [Green Version]
  5. Kim, J.I.; Kim, H.Y.; Hosoda, H.; Miyazaki, S. Shape Memory Behavior of Ti-22Nb-(0.5–2.0)O(at%) Biomedical Alloys. Mater. Trans. 2005, 46, 852–857. [Google Scholar] [CrossRef] [Green Version]
  6. Kim, H.Y.; Ikehara, Y.; Kim, J.I.; Hosoda, H.; Miyazaki, S. Martensitic transformation, shape memory effect and superelasticity of Ti–Nb binary alloys. Acta Mater. 2006, 54, 2419–2429. [Google Scholar] [CrossRef]
  7. Inamura, T.; Fukui, Y.; Hosoda, H.; Wakashima, K.; Miyazaki, S. Relationship between texture and macroscopic transdormation strain in severely colled-rolled Ti-Nb-Al superelastic alloy. Mater. Trans. 2004, 45, 1083–1089. [Google Scholar]
  8. Niinomi, M.; Akahori, T.; Nakai, M. In situ X-ray analysis of mechanism of nonlinear super elastic behavior of Ti-Nb-Ta-Zr system beta-type titanium alloy for biomedical applications. Mater. Sci. Eng. C 2008, 28, 406–413. [Google Scholar] [CrossRef]
  9. Kuramoto, S.; Nishino, K.; Saitou, S. Multifunctional titanium alloy. J. JILM 2005, 55, 618–623. [Google Scholar] [CrossRef]
  10. Mantani, Y.; Tsumura, T.; Nakata, K. Effect of α’ martensite structure of Ti-15Nb alloy on material properties and its surface hardening treatment by plasma nitriding. J. Jpn. Soc. Heat Treat. 2012, 52, 263–268. [Google Scholar]
  11. Mantani, Y.; Kudou, K. Effect of plastic deformation on material properties in martensite structures of Ti-Nb alloys. J. Alloys Comp. 2013, 577S, S448–S452. [Google Scholar] [CrossRef]
  12. Mantani, Y.; Takemoto, Y. Change in crystal structure and material properties with deformation of quenched martensite in Ti-Nb alloys. J. Jpn. Inst. Met. Mater. 2015, 79, 461–467. [Google Scholar] [CrossRef] [Green Version]
  13. Rolinski, E. Mechanism of high-temperature plasma nitriding of titanium. Mater. Sci. Eng. 1988, 100, 193–199. [Google Scholar] [CrossRef]
  14. Rolinski, E. Surface properties of plasma-nitrided titanium alloys. Mater. Sci. Eng. 1989, A108, 37–44. [Google Scholar] [CrossRef]
  15. Bacci, T.; Pradelli, G.; Tesi, B.; Gianoglio, C.; Badini, C. Surface engineering and chemical characterization in ion-nitrided titanium and titanium alloys. J. Mater. Sci. 1990, 25, 4309–4314. [Google Scholar] [CrossRef]
  16. Sato, T.; Akashi, K. Surface modification of Ti-6Al-4V alloy by plasma nitriding. J. JILM 1992, 42, 650–656. [Google Scholar] [CrossRef] [Green Version]
  17. Da Silva, S.L.R.; Kerber, L.O.; Amaral, L.; Da Santos, C.A. X-ray diffraction measurements of plasma-nitrided Ti-6Al-4V. Surf. Coat. Technol. 1999, 116–119, 342–346. [Google Scholar] [CrossRef]
  18. Kapczinski, M.P.; Kinast, E.J.; Da Dos Santos, C.A. New-surface composition and tribological behavior of plasma nitride titanium. J. Phys. D Appl. Phys. 2003, 36, 1858–1863. [Google Scholar] [CrossRef] [Green Version]
  19. Zhecheva, A.; Sha, W.; Malinov, S.; Long, A. Enhancing the microstructure and properties of titanium alloys through nitriding and other surface engineering methods. Surf. Coat. Technol. 2005, 200, 2192–2207. [Google Scholar] [CrossRef]
  20. Ge, L.; Tian, N.; Lu, Z.; You, C. Influence of surface nanocrystallization on the gas nitriding of Ti-6Al-4V alloy. Appl. Surf. Sci. 2013, 286, 412–416. [Google Scholar] [CrossRef]
  21. Miyagi, M.; Sato, Y.; Mizuno, T.; Sawada, S. ESCA study on nitriding of titanium. J. Jpn. Inst. Metals 1979, 43, 939–947. [Google Scholar] [CrossRef] [Green Version]
  22. Yan, X.; Kato, M.; Nakasa, K.; Morita, K. Evaluation of fracture strength and interfacial strength of titanium-nitride layers formed by gas nitriding of titanium. J. Soc. Mat. Sci. Jpn. 2001, 50, 764–771. [Google Scholar] [CrossRef]
  23. Nakai, M.; Niinomi, M.; Akahori, T.; Ohtsu, N.; Ogawa, M.; Nishimura, H.; Toda, H.; Fukui, H.; Ogawa, M. Surface hardening of biomedical Ti-29Nb-13Ta-4.6Zr and Ti-6Al-4V ELI by gas nitriding. Mater. Sci. Eng. A 2008, 486, 193–201. [Google Scholar] [CrossRef]
  24. Haibin Li, H.; Cui, Z.; Li, Z.; Zhu, S.; Yang, X. Effect of gas nitriding treatment on cavitation behavior of commercially pure Ti and Ti-6Al-4V alloy. Surf. Coat. Technol. 2013, 221, 29–36. [Google Scholar]
  25. Li, H.; Cui, Z.; Li, Z.; Zhu, S.; Yang, X. Surface modification by gas nitriding for improving cavitation erosion resistance of CP-Ti. Appl. Surf. Sci. 2014, 298, 164–170. [Google Scholar] [CrossRef]
  26. Liu, J.; Suslov, S.; Vellore, A.; Ren, Z.; Amanov, A.; Pyun, Y.S.; Martini, A.; Dong, Y.; Ye, C. Surface nonocystallization by ultrasonic nano-crystal surface modification and its effect on gas nitriding of Ti6Al4V alloy. Mater. Sci. Eng. A 2018, 736, 335–343. [Google Scholar] [CrossRef]
  27. Yang, C.; Liu, J. Intermittent vacuum gas nitriding of TB8 titanium alloy. Vacuum 2019, 163, 52–58. [Google Scholar] [CrossRef]
Figure 1. Cross-sectional SEM microstructure after the gas nitriding and quenching process (GNQP). (a) Edge area at 1023 K. (b) Edge area at 1223 K. (c) Corner area at 1223 K.
Crystals 10 01156 g001
Figure 2. Micro Vickers hardness distribution from the surface after GNQP.
Crystals 10 01156 g002
Figure 3. Change in the XRD profile from the surface to the depth direction. (a) 1023 K. (b) 1223 K.
Crystals 10 01156 g003
Figure 4. Cross-sectional SEM-EDX analysis results after GNQP at 1023 K. (a)SEM microstructure. (b) The result of point analysis at the position indicated by the number of (a). (c) The element mapping results of Ti, Nb, N and O.
Crystals 10 01156 g004
Figure 5. Cross-sectional SEM-EDX analysis results after GNQP at 1223 K. (a)SEM microstructure. (b) The result of point analysis at the position indicated by the number of (a). (c) The element mapping results of Ti, Nb, N and O.
Crystals 10 01156 g005
Figure 6. Change in material properties after each heat treatment. (a) Young’s modulus E. (b) Internal friction Q−1.
Crystals 10 01156 g006
Publisher’s Note: MDPI stays neutral with regard to jurisdictional claims in published maps and institutional affiliations.