Article

Correlation between Crystal Structure and Thermoelectric Properties of Sr1−xTi0.9Nb0.1O3−δ Ceramics

1
Instituto de Ciencia de Materiales de Madrid (ICMM). Consejo Superior de Investigaciones Científicas (CSIC). Sor Juana Inés de la Cruz 3, E-28049 Madrid, Spain
2
Departamento de Química Inorgánica, Universidad Complutense de Madrid, E-28040 Madrid, Spain
3
INTEQUI, Universidad Nacional de San Luis, CONICET, Fac. Qca., Bqca. y Far. (Chacabuco y Pedernera, 5700), San Luis, Argentine
4
Departamento de Física de Materiales, Universidad Complutense de Madrid, E-28040 Madrid, Spain
5
Departamento de Física Aplicada, Universidad de Castilla-La Mancha, E-13071 Ciudad Real, Spain
6
Institut Laue Langevin, BP 156X, F-38042 Grenoble, France
*
Author to whom correspondence should be addressed.
Crystals 2020, 10(2), 100; https://doi.org/10.3390/cryst10020100
Submission received: 14 January 2020 / Revised: 6 February 2020 / Accepted: 7 February 2020 / Published: 9 February 2020
(This article belongs to the Section Inorganic Crystalline Materials)

Abstract

:
Polycrystalline Sr1−xTi0.9Nb0.1O3−δ (x = 0, 0.1, 0.2) ceramics have been prepared by the solid state method and their structural and thermoelectric properties have been studied by neutron powder diffraction (NPD), thermal, and transport measurements. The structural analysis of Sr1-xTi0.9Nb0.1O3−δ (x = 0.1, 0.2) confirms the presence of a significant amount of oxygen vacancies, associated with the Sr-deficiency of the materials. The analysis of the anisotropic displacement parameters (ADPs) indicates a strong softening of the overall phonon modes for these samples, which is confirmed by the extremely low thermal conductivity value (κ ≈ 1.6 W m-1 K−1 at 823 K) found for Sr1−xTi0.9Nb0.1O3−δ (x = 0.1, 0.2). This approach of introducing A-site cation vacancies for decreasing the thermal conductivity seems more effective than the classical substitution of strontium by rare-earth elements in SrTiO3 and opens a new optimization scheme for the thermoelectric properties of oxides.

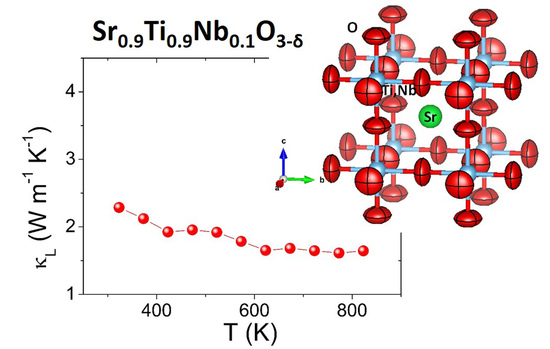
Graphical Abstract

1. Introduction

Thermoelectric (TE) materials enable direct conversion of waste heat into electrical energy, or vice versa; they can pump heat by using electricity through the thermoelectric effect. By exploiting these properties, thermoelectric device applications are concerned with power generation and environmental-friendly refrigeration [1,2,3,4,5]. Despite the significant benefits of thermoelectric devices, such as low cost electricity, green energy technology without using any moving part, stability, and reliability, the correct performance largely depends on the material efficiency [6]. This efficiency may be evaluated in terms of the figure of merit (zT) (Equation (1)):
z T = S 2 σ k T =   S 2 σ k e + k L   T
where S is the Seebeck coefficient, σ corresponds to the electrical conductivity (σ = 1/ρ; ρ = electrical resistivity), T is the absolute temperature, and κ defines the total thermal conductivity. A high thermoelectric performance involves the unusual combination of high electrical conductivity (typical of metallic systems) together with a high Seebeck coefficient and low thermal conductivity (typical of nonmetallic phases). A compromise between a large power factor (PF = S2σ) and low thermal conductivity (κ) is required, which occurs in some heavily doped semiconductors with carrier concentration between 1019 and 1021 carriers per cm3 [7,8]. Since κ has electronic (κe) and lattice (κL) contributions, one approach to optimize zT is to target a reduction in κL, without impairing the electron-transport properties.
Numerous materials have been identified as candidates for thermoelectric applications; most of them are intermetallic compounds such as skutterudites [9,10,11], clathrates [12], half-Heusler compounds [13], Zintl phases [14], chalcogenides [15,16], etc. Although many of the materials with these structures exhibit good thermoelectric performance, their use for waste-heat recovery is limited by their poor chemical stability at high temperatures. Surface oxidation or sublimation of the constituent elements of the phases are crucial limitations for their adequate operation [17]. Furthermore, the most relevant thermoelectric materials contain expensive, scarce, or toxic heavy elements (such as Ge, Se, Te), which is also a constraint for applications [18,19]. On the basis of this background, metal oxide materials are very appealing as thermoelectric materials for high temperature applications because of their abundance, low toxicity, and stability at high temperatures. Initially, ceramic metal oxides were not taken into account as good candidates for thermoelectric applications due to their low carrier mobility and high thermal conductivity [20,21]. Nevertheless, this fact changed with the discovery of good thermoelectric properties in metallic NaxCo2O4 (p-type material, zT ≈ 0.8 at 1000 K for a polycrystalline sample) [22,23,24]. This cobalt oxide has a heavy effective mass of carriers due to the strong electron correlation, which is responsible for the large Seebeck coefficient as in some 4f heavy-fermion systems [25]. Both p-type and n-type oxide materials are required to construct an efficient thermoelectric device, but n-type oxide thermoelectrics with high performance are rare. In the last decade, progress has been made in the development of Al-doped ZnO, CaMnO3, and SrTiO3-based systems. However, thermoelectric efficiency for these materials is still far from p-type NaxCo2O4 or other n-type intermetallics [17,20].
SrTiO3 cubic perovskite is a wide band gap (3.2 eV) insulator, which exhibits a very low carrier concentration (< 1015 cm−3) [3] and large thermal conductivity with values between 9–12 W m−1 K−1 in its pristine form [20,26]. It has been extensively shown that donor doping is a powerful tool to tune the carrier concentration and mobility of SrTiO3. Lanthanide (Ln3+)-doping on Sr2+-site or Nb5+-doping on Ti4+-site injects electrons into the empty t2g orbitals, producing the unique combination of high Seebeck coefficient and good electrical conduction, due to its large effective carrier mass and its degenerate conduction band. In the case of Nb-doped STO, a charge compensation mechanism occurs and the addition of Nb5+ produces the reduction of Ti4+ by Ti3+ to compensate the charges. This effect creates oxygen vacancies, which also generates charge carriers [27,28,29]. As a result, power factors of ca. 3.5 mW m−1 K−2 have been reported for STO-based materials [30]. Additionally, a strong phonon-electron coupling can take place and induce the formation of polarons. Consequently, the introduction of point defects within the perovskite structure leads to a decrease in κL. Typical κ values higher than 3–4 W m−1 K−1 at temperatures ≈ 1000 K have been reported in the literature for Sr1-xLaxTiO3-δ and SrTi1−xNbxO3−δ systems [30,31,32]. However, Popuri et al. [26] claim that a much substantial reduction of thermal conductivity to κ ≈ 1–2 W m−1 K−1 is needed in order to achieve a competitive figure of merit (zT ≈ 1) for thermoelectric applications.
In this work, Sr1−xTi0.9Nb0.1O3−δ (x = 0, 0.1, 0.2) ceramics were prepared and evaluated to identify the influence of A-site cation deficiency on thermoelectric performance. We find that a conspicuous effect on thermal properties is associated with the introduction of Sr2+ vacancies, leading to an extremely low thermal conductivity, achieving competitive values of κ for applications of 1.6 W m−1 K−1 at 823 K for Sr1−xTi0.9Nb0.1O3−δ (x = 0.1, 0.2). In order to understand the relationship between the enhancement of thermal properties and the crystal structure, a temperature-dependent neutron powder diffraction (NPD) study is also here included. Highly anisotropic mean square displacement (MSD) ellipsoids were analyzed in terms of the Debye-model and suggest the softening of phonons in the samples where A-site cation deficiency exists.

2. Materials and Methods

Samples of composition Sr1−xTi0.9Nb0.1O3−δ (x = 0, 0.1, 0.2) were prepared by a conventional solid- state reaction. Stoichiometric amounts of SrCO3 (>99.9%, Sigma-Aldrich, Merck KGaA, Darmstadt, Germany), TiO2 (>99.995%, Sigma-Aldrich, Merck KGaA, Darmstadt, Germany), and Nb2O5 (>99.99%, Sigma-Aldrich, Merck KGaA, Darmstadt, Germany) were heated at 1000 °C for 6 h in air. The resulting powders were then ground in a mortar and heated again under the same conditions. Finally, the powder was calcined at 1400 °C for 5 h in 5% H2/95% N2. The use of this reducing atmosphere allows the reduction of part of Ti4+ to Ti3+, which dramatically affects the thermoelectric properties. For this reason, the sintering of 10 mm diameter pellets was carried out under the same conditions (1400 °C, 5 h, 5% H2).
Phase characterization was achieved using temperature-dependent NPD data collected at the D2B diffractometer of the ILL (Grenoble), with wavelengths λ = 1.051 or 1.594 Å. An amount of 2 g of the sample were packed in a cylindrical vanadium holder (dia. 8 mm), and the counting time was 2 h in the high-intensity mode. The coherent scattering lengths for the elements contained in the sample are: Sr (7.02 fm), Ti (−3.438 fm), Nb (7.054 fm), and O (5.803 fm) [33]. The Fullprof software was used to refine the structure [34]. The refinement was carried out with no regions excluded from the data. The zero-point error, scale factor, background coefficients, pseudo-Voigt shape parameters, occupancy of the elements, atomic coordinates, and anisotropic displacements for all the atoms were refined.
The Seebeck coefficient was determined by using a commercial MMR-technologies system (MMR Technologies Inc, San Jose, California, USA). Measurements were completed under vacuum conditions (10−3 mbar) from 300 to 800 K. A constantan wire was utilized as a reference for comparison with bar-shaped samples, previously cut with a diamond saw perpendicular to the pressing direction. Reproducibility was tested with different contacts and constantan wires.
The thermal diffusivity (α) of Sr1−xTi0.9Nb0.1O3−δ (x = 0, 0.1, 0.2) samples was measured from 300 to 800 K using a Linseis LFA 1000 instrument (Linseis Messgeraete GmbH, Selb, Germany). In order to maximize the heat absorption and emissivity of the sample, a thin graphite coating was applied to the surface of the pellet. The thermal conductivity (κ) was calculated by κ = αCpd, where Cp is the specific heat and d is the sample density. Specific heat was calculated using the well-known Dulong–Petit equation.

3. Results and Discussion

3.1. Structural Characterization by Neutron Powder Diffraction (NPD)

The determination of O positions in perovskite oxides containing heavy elements such as Sr is difficult by X-ray diffraction, given the weak scattering factor for O2− ions; hence neutron diffraction measurements are crucial. In addition to that, our aim was to determine anisotropic displacement factors (ADPs) that may give hints to account for the exceptionally low thermal conductivities observed here. An NPD study for a selected Sr0.9(Ti0.9Nb0.1)O3−δ sample at RT (25 °C) and elevated temperatures up to 800 °C was essential to unveil these features, allowing to microscopically determine the oxygen contents in oxygen deficient specimens. A short neutron wavelength (λ = 1.051 Å) was chosen to access a wide region of the reciprocal space. The RT neutron pattern confirms the cubic symmetry with unit-cell parameter a = 3.91726(4) Å; the structure was therefore defined in the cubic Pm-3m space group with Sr located at 1b Wyckoff site (½, ½, ½); Ti and Nb distributed at random at 1a (0,0,0) site; and O1 at 3d(1/2,0,0). The Ti vs. Nb and O1 occupancies were refined, yielding a crystallographic formula at RT Sr0.9Ti0.88(1)Nb0.12(1)O2.85(4), showing a significant oxygen deficiency. The anisotropic displacement factors of O1 were also refined. The Ti/Nb rate is similar to that expected, while the oxygen positions show a conspicuous nonstoichiometry. For the determined occupancy factors, the mean oxidation state of Ti is 3.75+. The final structural parameters and agreement factors are gathered at Table 1 for this perovskite oxide at RT. The structural refinement from data collected above RT (300, 600, 800 °C) was correctly performed in Pm 3 ¯ m; the corresponding structural parameters are listed in the Supplementary Materials. The good agreement between observed and calculated profiles is displayed in Figure 1a and Figure 1b for the 25 and 800 °C patterns, respectively.
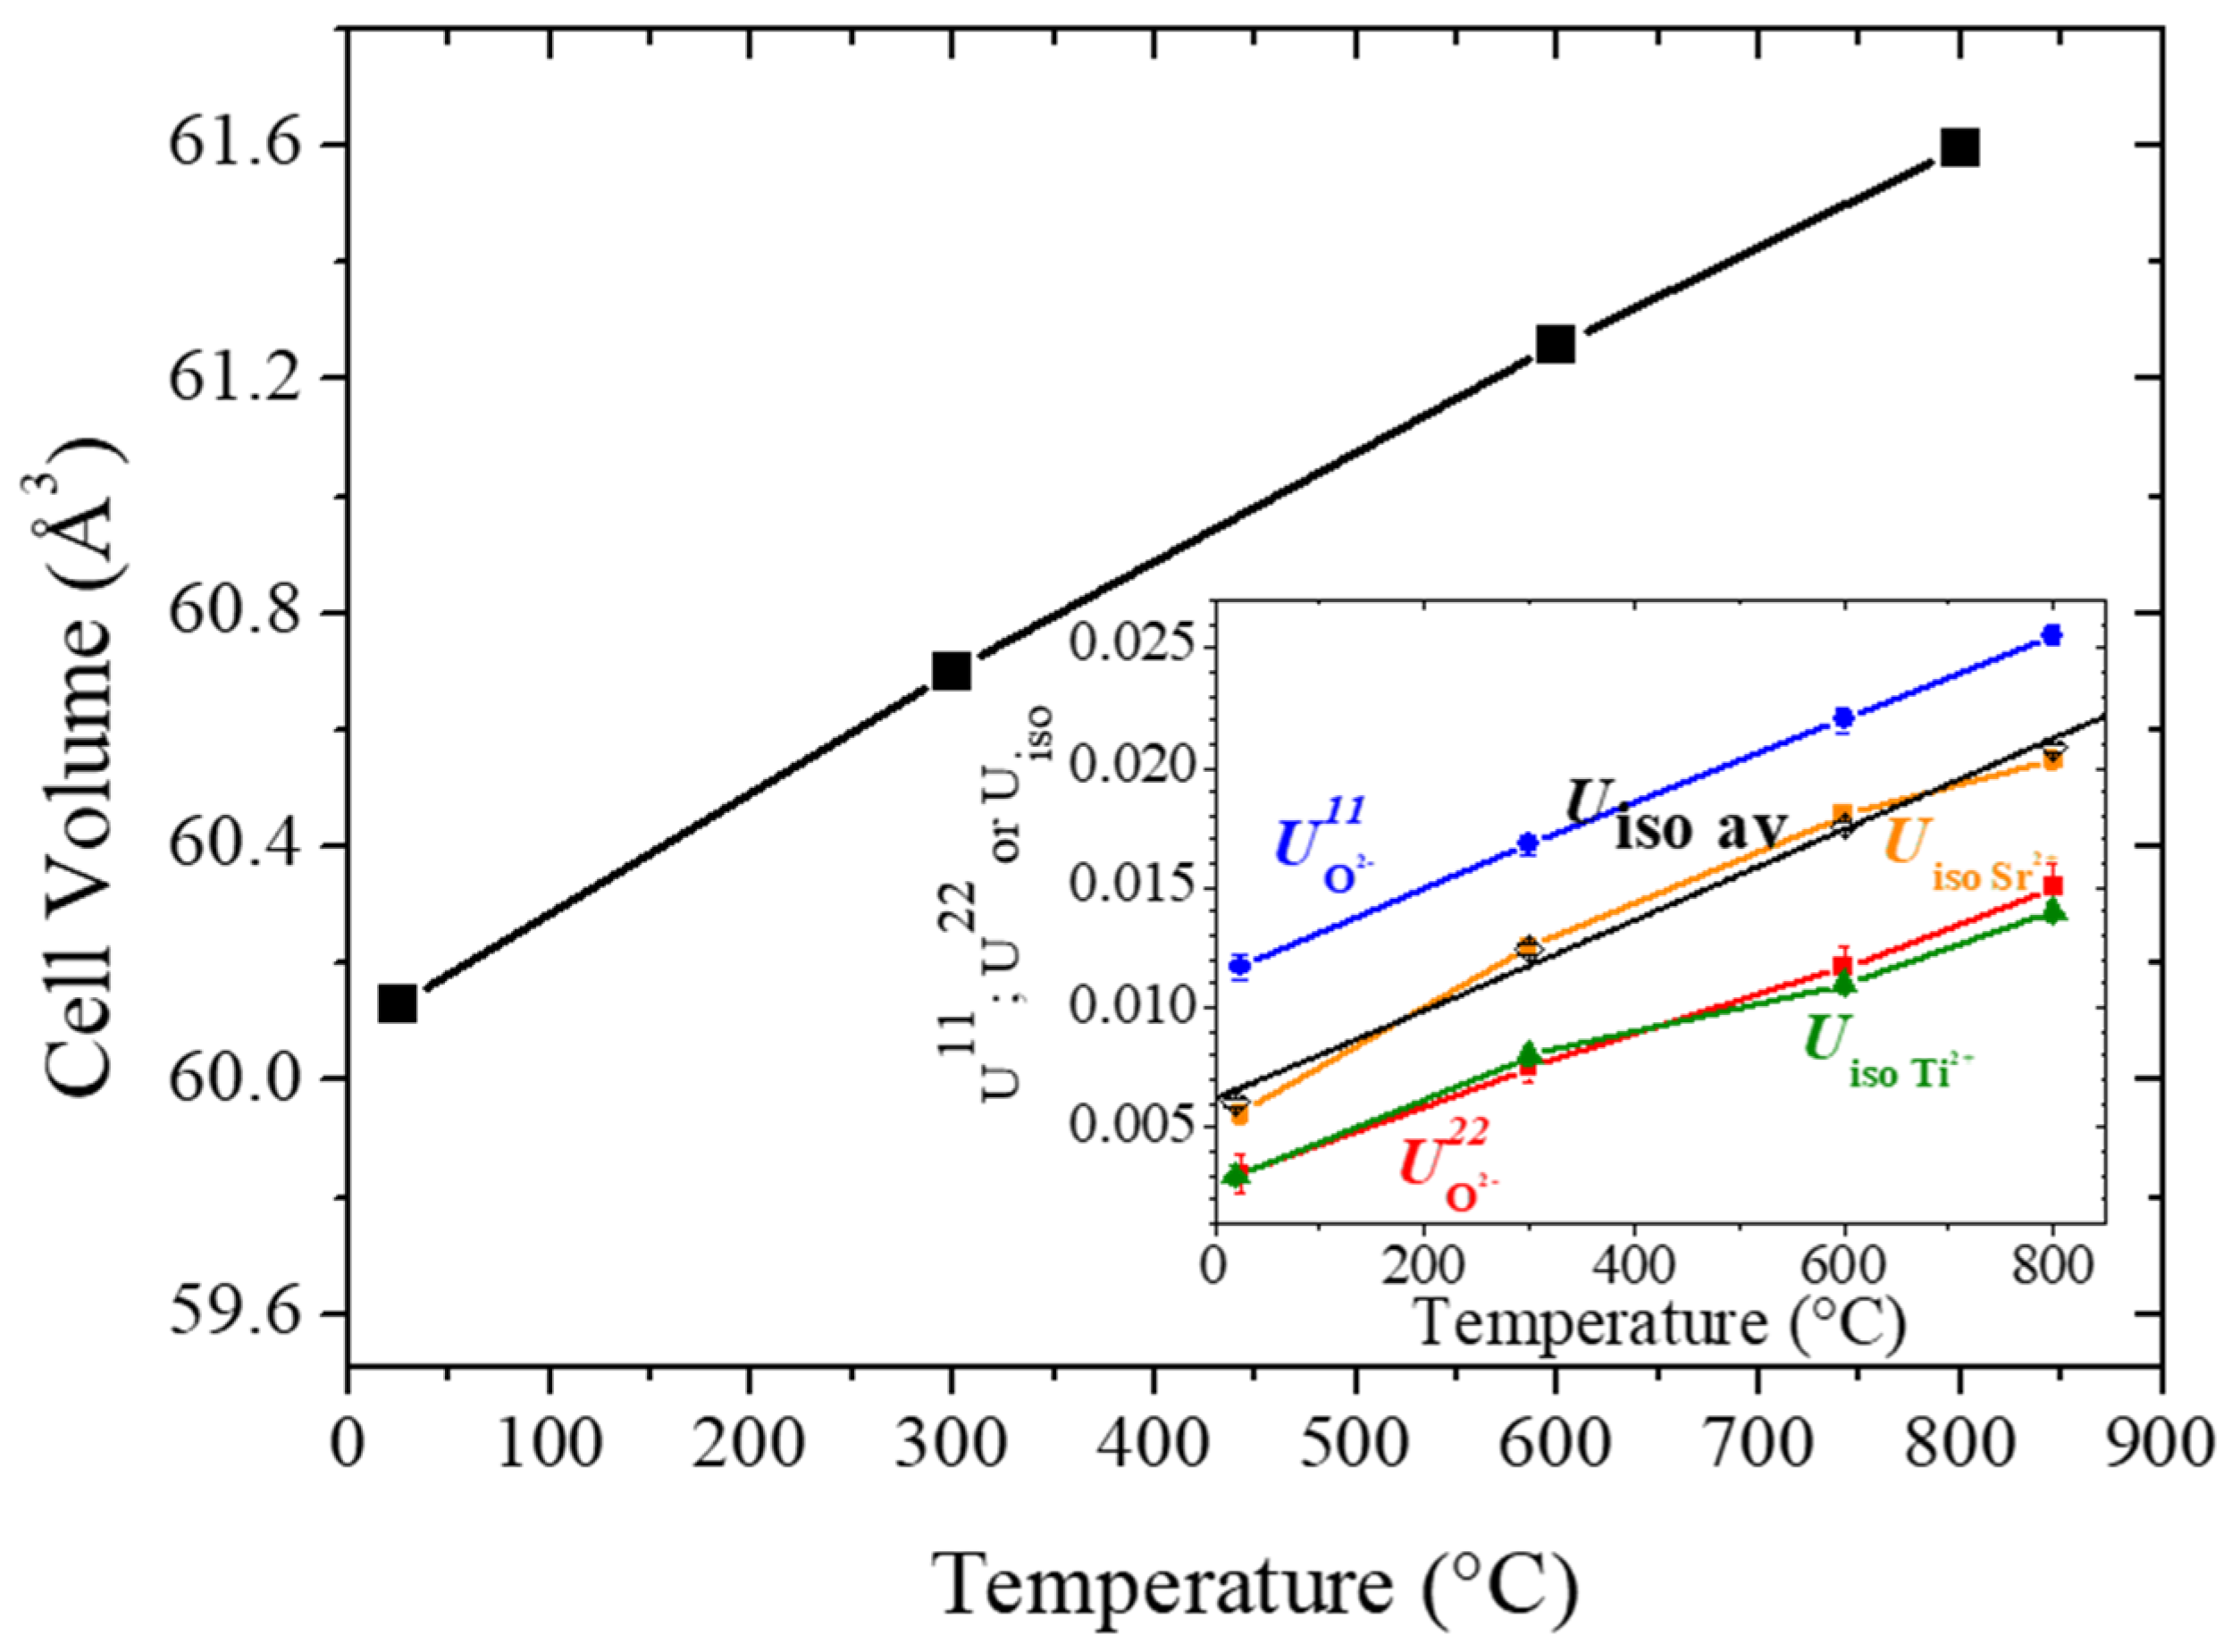
Figure 2 illustrates the cubic crystal structure at 800 °C, displaying a remarkable anisotropy in the disk-shaped (oblate) displacement ellipsoids for oxygen atoms. Figure 3 displays the thermal variation of the unit-cell volume of the perovskite oxide; the inset shows the Uij thermal displacement across the measured temperature range. For the cations (Sr, Ti, Nb) the thermal displacement parameters are constrained, by symmetry, to be spherical. For oxygen atoms at 800 °C, the anisotropic ellipsoids exhibit the root mean square (rms) displacements of 0.18 Å perpendicular to the Ti-Ti distance and 0.11 Å parallel to it. This suggests that the thermal vibrations are mainly permitted in a perpendicular direction to the covalent Ti(Nb)-O-Ti(Nb) chemical bonds, as usual in many perovskite-like oxides.
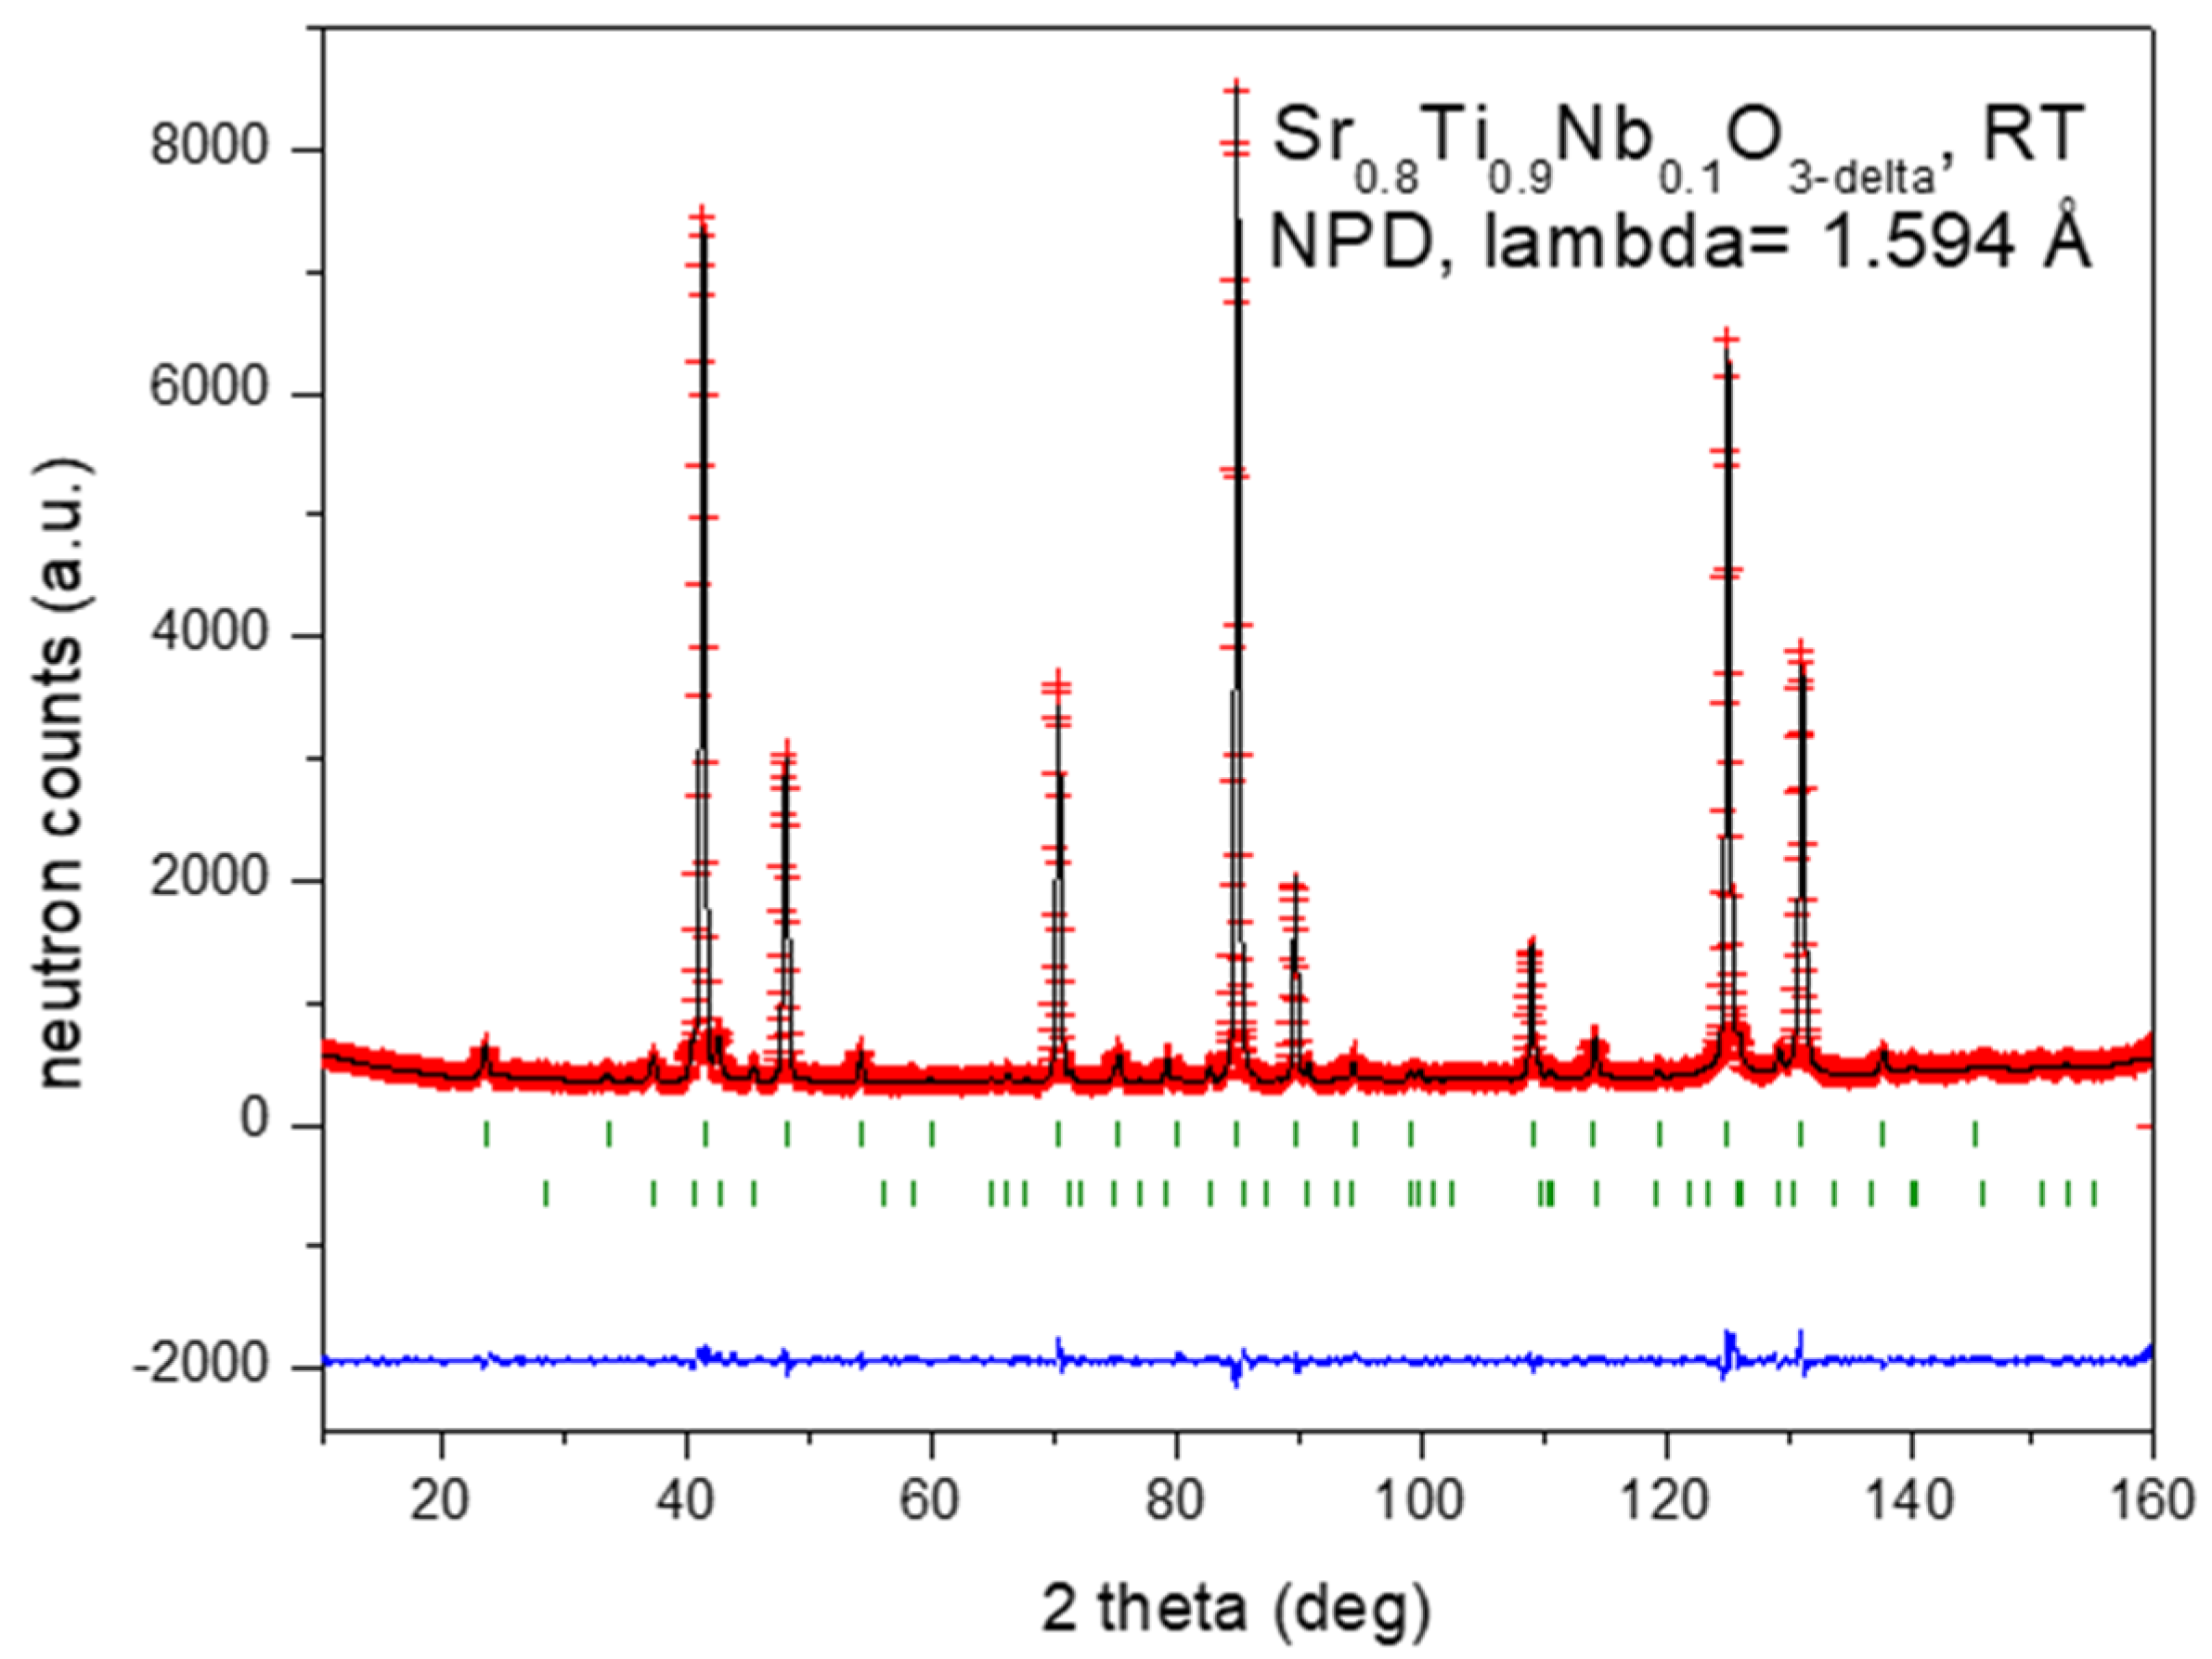
Regarding Sr0.8(Ti0.9Nb0.1)O3-δ, a NPD pattern was collected at RT with λ = 1.594 Å. The crystal structure was refined in the Pm-3m space group as described above. This time a minor impurity of TiO2 (rutile) was detected and introduced as a second phase in the refinement. The limited number of diffraction peaks obtained with this longer wavelength did not allow the anisotropic refinement of oxygen displacement factors. The mixed Ti vs. Nb and O occupancy were refined yielding the crystallographic composition Sr0.8Ti0.875(3)Nb0.125(3)O2.50(2), showing an important oxygen deficiency, associated with the Sr deficiency. For the determined occupancy factors, the oxidation state of Ti is 3.16+ (assuming pentavalent Nb). The final structural parameters and the refinement agreement factors are listed in Table 2 for this perovskite oxide at room temperature. The excellent agreement between observed and calculated profiles is displayed in Figure 4.

3.2. Analysis of the Anisotropic Displacement Parameters (ADPs)

The ADPs of the various atoms of the structure can give important insight into their vibrations. We analyze the mean square displacements (MSD), which are the main semi-axes of the ellipsoids described by the ADPs (basically the Uiso/Uij of Table 1 and Table 2), following the treatment by Mi et al. [35]. The Debye temperature (θD) can be obtained from Equation (2):
U i s o = 3 ħ 2 T m k B θ D 2 T θ D [ 0 θ D T x e x 1 d x + θ D 4 T ] + d D 2
where Uiso is an atomic-mass weighted average obtained from the Uiso of Table 1, taking into account each occupancy, too. The m is an averaged mono-atomic mass for the unit cell, and dD describes additional site-disorder. A least-squares fit yields θD = 452 K, with a negligible dD ~0.013 Å (inset Figure 3). This low value of the Debye temperature suggests a softening of the phonon-modes in A-site cation deficient Nb:STO.

3.3. Thermoelectric Properties

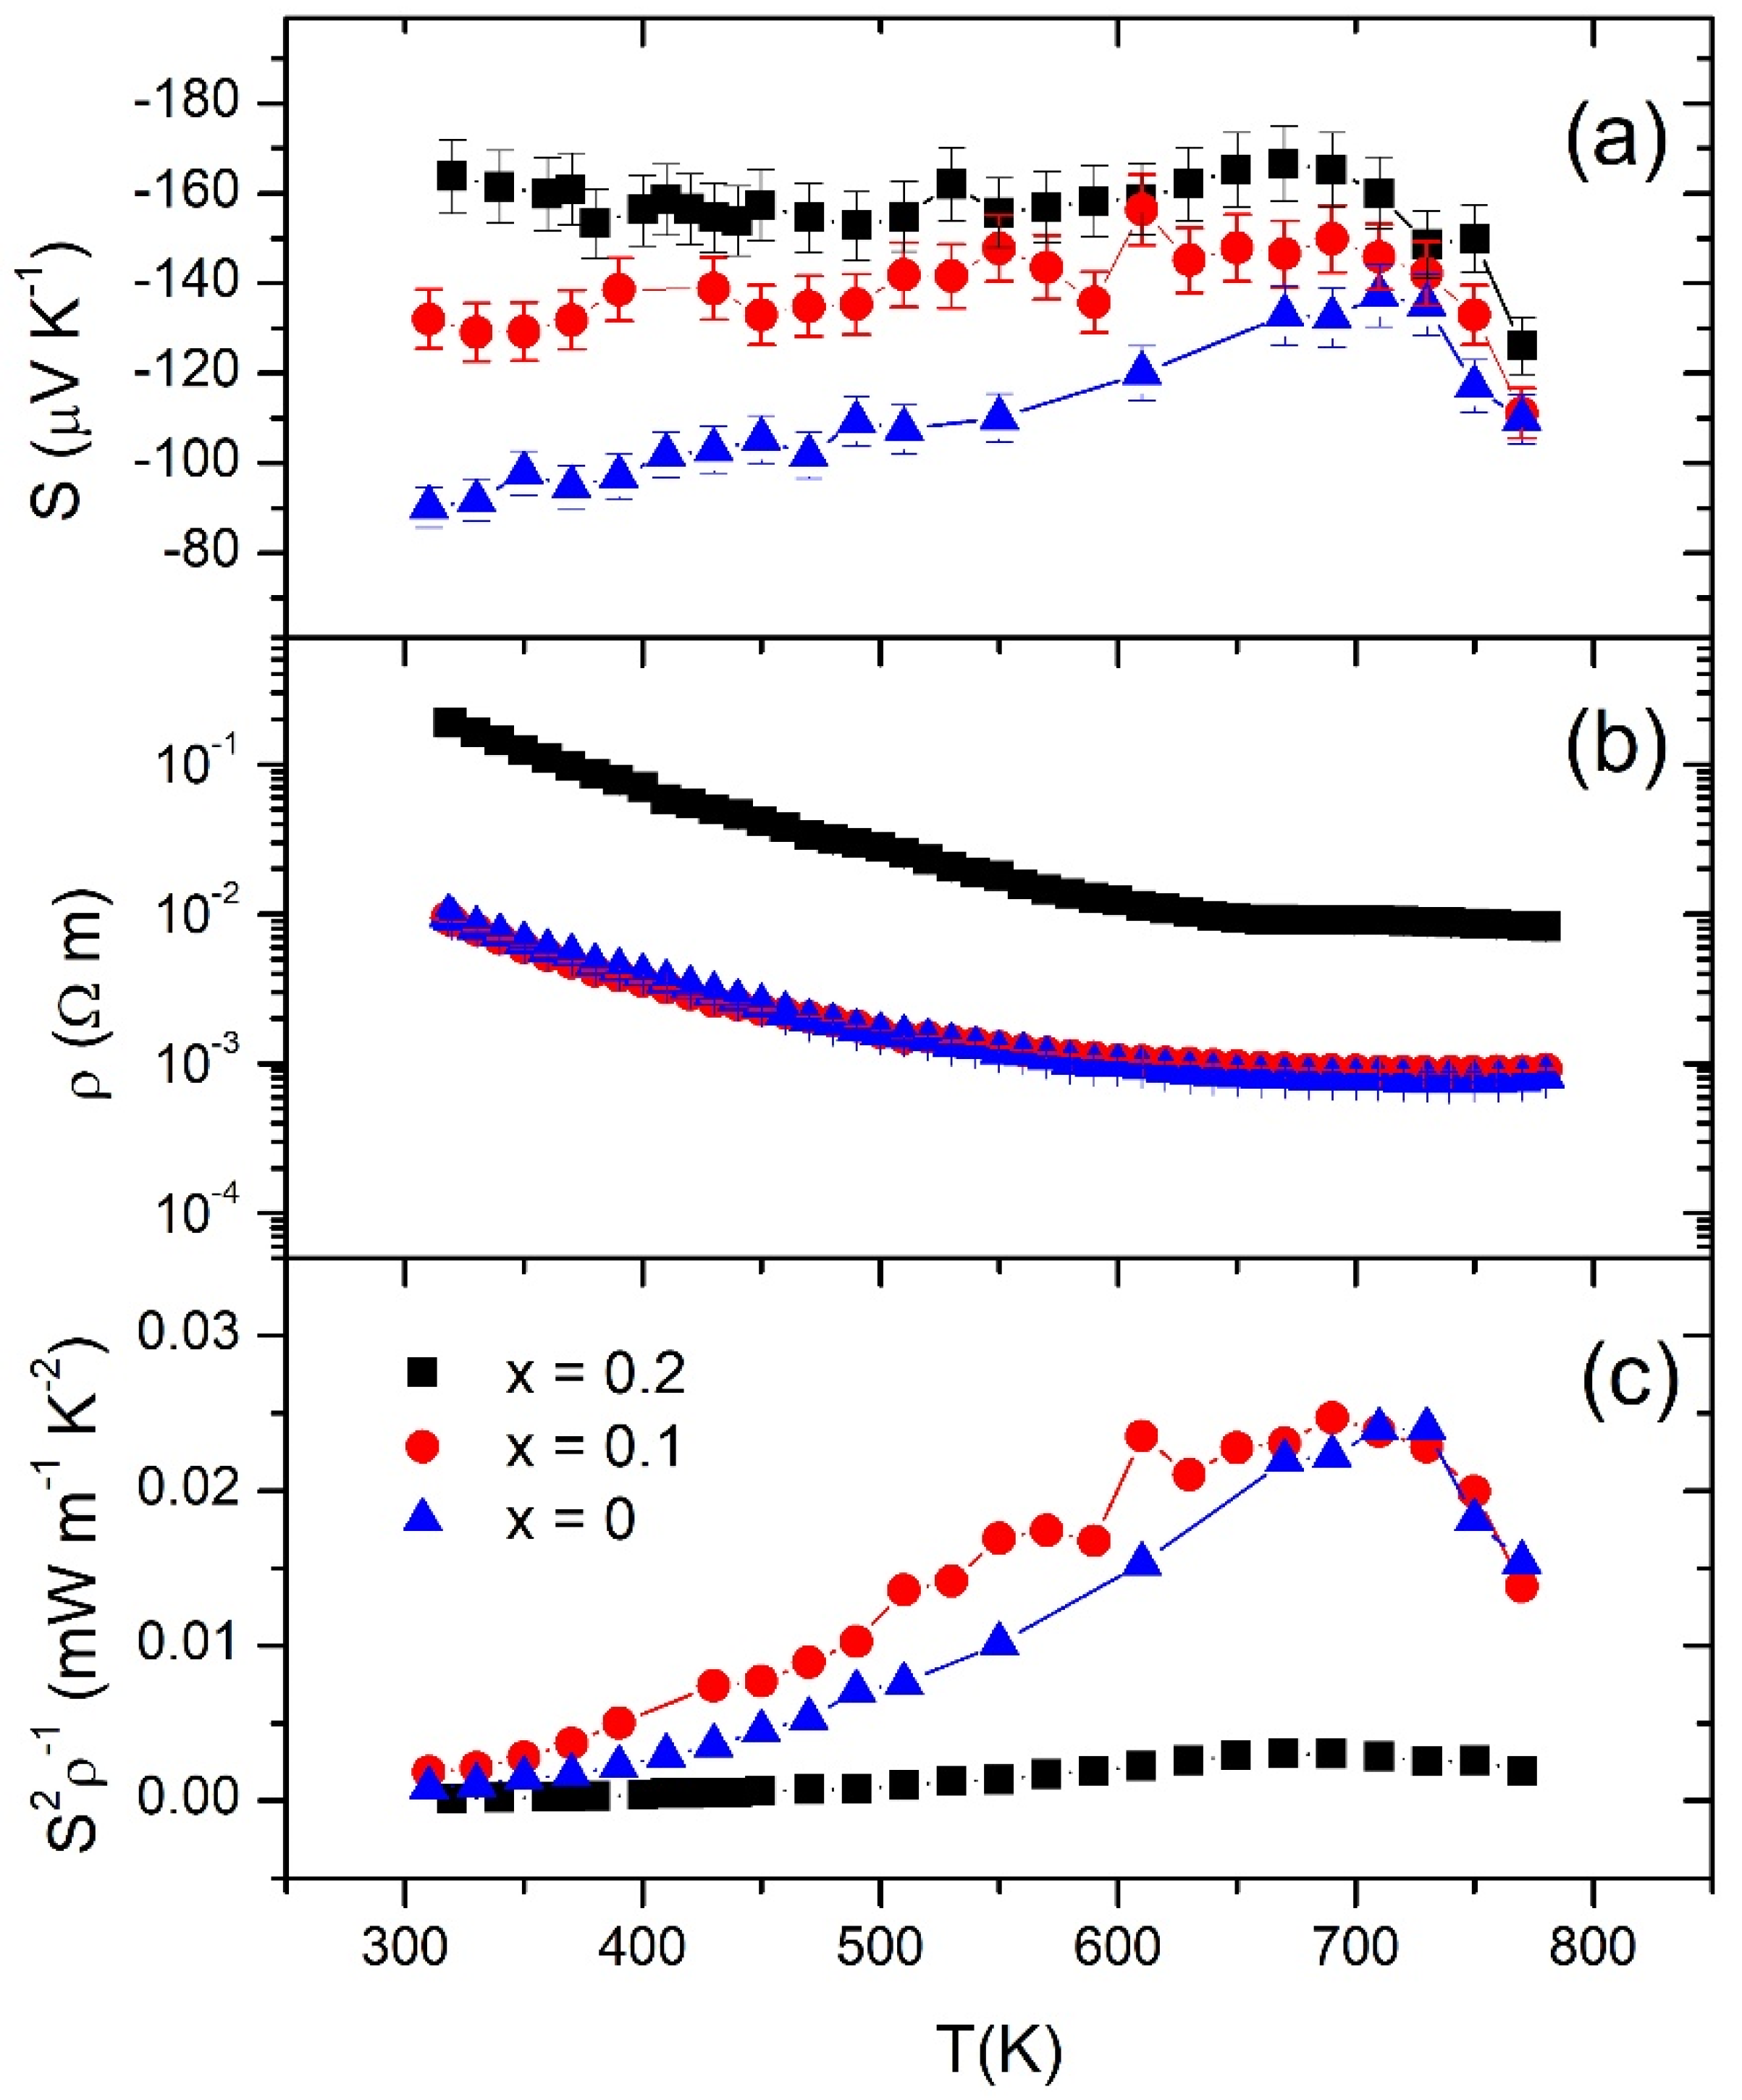
Figure 5 shows the electronic properties of Sr1−xTi0.9Nb0.1O3−δ (x = 0, 0.1, 0.2). Blennon et al. [27] demonstrated that Nb-doped SrTiO3 compositions are donor-doped perovskites. A donor dopant has higher cationic charge than the host cation that it replaces. In the case of Sr0.9Ti0.9Nb0.1O3-δ, the Nb5+ is substituting and reducing part of Ti4+ and is thus trying to bring either more oxide ions or more electrons into the structure [27]. On the other hand, the introduction of vacancies in the A-site perovskite position alters the charge compensation by electronic species and cation vacancies and therefore modifies the electronic properties of the system. Our NPD data clearly show that the effect of electron doping brought about by the conspicuous oxygen deficiency compensates the hole-doping effect induced by Sr vacancies, yielding a net oxidation state for Ti lower than 4+, i.e., injecting electrons into the system.
Figure 5a shows the evolution of the Seebeck coefficient with temperature for the three compositions. S(T) is negative, indicating n-type electrical transport. For SrTi0.9Nb0.1O3−δ, there is a slight increase of the absolute value of the Seebeck coefficient between room temperature (S = –90 μV K−1) and 723 K (S = –137 μV K−1). However, samples containing A-site cation vacancies, present a value of S(T) that remains almost constant with temperature up to 723 K. It is worth noting that the Seebeck coefficient is improved by A-site cation deficiency, reaching a maximum value of S(T) = –163 μV K−1 at room temperature for Sr0.8Ti0.9Nb0.1O3−δ. These measurements are in good agreement with the results found by Kovalevsky et al. [36]. In a typical semiconductor, one can expect a decrease in Seebeck coefficient when increasing the charge carrier concentration, but in this system, this variation would be attributed to a combined result of the presence of defects. Concerning the electrical resistivity (Figure 5b), there is a slight decrease with temperature for the three samples. Sr1−xTi0.9Nb0.1O3−δ have similar resistivities for x = 0 and 0.1 (ρ ≈ 9 × 10⁻³ Ω m at RT and ρ ≈ 8 × 10⁻⁴ Ω m at 780 K). However, upon introducing the highest concentration of vacancies (x = 0.2), the electrical resistivity abruptly rises (ρ ≈ 0.18 Ω m at room temperature and ρ ≈ 7 × 10⁻³ Ω m at 780 K). This undesirable increase of the electrical resistivity could be related to the presence of TiO2 as minor phase and the large amount of oxygen vacancies, as determined from NPD data, which perturb the Ti-O-Ti paths that permit the electronic conduction in these materials, despite the nominal oxidation state of this perovskite, well below 4+. A high level of donor substitution could drive to a notable number of planar defects, which may induce localization of electronic charge carriers, increasing the Seebeck coefficient and the electrical resistivity [36]. Other authors suggest the instability of the fraction of Ti+3 ions that become easily oxidized to Ti4+ [37], thus diminishing the related electrons in the conduction band. As a result, the highest power factor (S2ρ-1) at room temperature was found for Sr0.9Ti0.9Nb0.1O3−δ (PF = 0.019 mW m−1 K−2) (Figure 5c). Power factors of Sr1-xTi0.9Nb0.1O3−δ (x = 0, 0.1) at higher temperatures (723 K) are comparable, due to the similar Seebeck coefficient and resistivity, reaching values of 0.025 and 0.022 mW m−1 K−2 for Sr0.9Ti0.9Nb0.1O3-δ and SrTi0.9Nb0.1O3−δ, respectively.
Temperature dependence of the thermal conductivity (κ) is represented in Figure 6a. The relative density of the three studied samples was ≈ 90%; this means that the differences between the compounds’ thermal conductivity cannot be associated with porosity.
Total thermal conductivity achieved for SrTi0.9Nb0.1O3−δ (κ ≈ 4.8 W/m K at room temperature) is in good agreement with the value found by Kovalevsky et al. [36] for SrTi0.8Nb0.2O3−δ (κ ≈ 5.6 W m−1 K−1 at room temperature). However, an impressive reduction of the thermal conductivity is observed when vacancies are introduced in the perovskite structure, finding room temperature values of κ ≈ 2.7 W m−1 K−1 (reduction of 44%) and ≈2.3 W m−1 K−1 (reduction of 52%) for Sr0.8Ti0.9Nb0.1O3−δ and Sr0.9Ti0.9Nb0.1O3-δ, respectively. This reduction of κ is observed for all the measured temperature range, leading to a total thermal conductivity value κ ≈1.6 W m−1 K−1 at 823 K for Sr1−xTi0.9Nb0.1O3−δ (x = 0.1, 0.2). This approach for reducing thermal conductivity seems more effective than the classical introduction of rare-earth elements in the A-site of the perovskite, where thermal conductivity values between 3–4 W m−1 K−1 at 823 K are achieved for Sr1−xRExTiO3 (RE = La, Nd, Sm, Gd, Dy) [38,39].
The electronic (κe) and lattice (κL) dependence of the thermal conductivity is represented in Figure 6b. The electronic thermal conductivity contribution was calculated using the well-known Wiedemann–Franz law, which states κe = LσT, where L is the Lorentz number (L ≈ 2∙10−8 W Ω K−2), σ is the electrical conductivity (σ = ρ−1), and T corresponds to the absolute temperature. Lattice contribution dominates the total thermal conductivity. κL decreases monotonically with the increase of temperature for the samples, typical of semiconductors (Figure 6a). Point defects scatter optical phonons effectively, for this reason, the strontium and oxygen vacancies associated with these compounds are responsible for the decrease of the lattice thermal conductivity in these samples.
As shown in Figure 6b, the lowest κL was found for Sr0.9Ti0.9Nb0.1O3−δ, (κ ≈ 2.2 W/m K at room temperature), which is reduced by ≈ 53 % compared to that of SrTi0.9Nb0.1O3−δ. Both types of vacancies, A-cation and oxygen vacancies, are participating in this reduction. The electronic thermal conductivity for the sample with the largest A-cation vacancies (x = 0.2) is much decreased due to the higher presence of oxygen vacancies that impair the electrical conductivity, as commented above. It seems that the optimum oxygen deficiency values are those found for the Sr0.9Ti0.9Nb0.1O3 specimen.
The remarkable reduction of the thermal conductivity together with the maintenance of the power factor in Sr0.9Ti0.9Nb0.1O3−δ results in an increase in the figure of merit ZT (improvement of 42% at 723 K), compared to SrTi0.9Nb0.1O3−δ (Figure 7). In the case of the sample Sr0.8Ti0.9Nb0.1O3−δ, although the reduction in κ is substantial, the worsening of the electronic transport properties diminishes ZT. Although the thermoelectric performance achieved for these materials is still far from the competitive values for applications, this work suggests that the adequate control of A-site cation vacancies can be a promising approach for the optimization of the thermoelectric properties in oxides.

4. Conclusions

Sr1−xTi0.9Nb0.1O3−δ (x = 0, 0.1, 0.2) samples were synthesized by the ceramic route to study the impact of A-site cation deficiency on the thermoelectric performance. Rietveld refinements from neutron diffraction data show a substantial oxygen deficiency composition in the samples containing Sr-vacancies, giving compositions of Sr0.9Ti0.88(1)Nb0.12(1)O2.85(4) and Sr0.8Ti0.875(3)Nb0.125(3)O2.50(2). The existence of Sr-cation and O-anion defects and the reduction of Ti4+ to Ti3+ in the samples, affect dramatically the electronic and thermal properties of the materials. The power factors of Sr1−xTi0.9Nb0.1O3−δ (x = 0, 0.1) samples are preserved. However, a higher concentration of vacancies (x = 0.2) results in an undesired increase of resistivity, possibly due to a perturbation of the crystallographic structure. Interestingly, a low thermal conductivity is reached for both A-site cation deficiency compositions, with a minimum value of κ ≈ 1.6 W m−1 K−1 at 823 K. This exceptionally low value is also in agreement with the highly anisotropic atomic displacement parameters of the oxygen, and with a strong softening of the overall phonon modes for Sr-deficient samples, shown by the decreased Debye-temperature. The outstanding reduction of the thermal conductivity in Sr-deficient samples gives clues to devise optimized thermoelectric materials based on ceramic STO-type perovskite oxides.

Supplementary Materials

The following are available online at https://www.mdpi.com/2073-4352/10/2/100/s1, Table S1. Structural parameters after the Rietveld refinement of Sr0.9(Ti0.9Nb0.1)O3-δ from NPD data at 300 °C in the Pm-3m space group, a = 3.92942 (5) Å, with λ = 1.051 Å. Discrepancy factors: Rp = 2.36%, Rwp = 3.11%, Rexp = 2.03%, RBragg = 4.65, χ2 = 2.51. Table S2. Structural parameters after the Rietveld refinement of Sr0.9(Ti0.9Nb0.1)O3-δ from NPD data at 600 °C in the Pm-3m space group, a = 3.94097 (8) Å, with λ = 1.051 Å. Discrepancy factors: Rp = 2.22%, Rwp = 2.78%, Rexp = 2.03%, RBragg = 6.70%, χ2 = 1.87. Table S3. Structural parameters after the Rietveld refinement of Sr0.9(Ti0.9Nb0.1)O3-δ from NPD data at 800 °C in the Pm-3m space group, a = 3.94935 (10) Å, with λ = 1.051 Å. Discrepancy factors: Rp = 2.08%, Rwp = 2.57%, Rexp = 2.04%, RBragg = 6.62%, χ2 = 1.65. Figure S1. Observed (red crosses), calculated (black line), and difference (lower blue line) NPD profiles for Sr0.9(Ti0.9Nb0.1)O3-δ, at 300 °C. The allowed Bragg positions are shown as green vertical marks. Figure S2. Observed (red crosses), calculated (black line), and difference (lower blue line) NPD profiles for Sr0.9(Ti0.9Nb0.1)O3-δ, at 600 °C. The allowed Bragg positions are shown as green vertical marks.

Author Contributions

Conceptualization, J.A.A.; methodology, J.P.-G., C.A.L., O.J.D., M.T.F.-D., and J.A.A.; software, J.P.-G., C.A.L., F.S.-S., N.M.N., O.J.D., M.T.F.-D., and J.A.A.; validation M.T.F.-D. and J.A.A.; formal analysis, M.T.F.-D. and J.A.A.; investigation, J.P.-G., C.A.L., R.M.P., F.S.-S., N.M.N., O.J.D., J.L.M., M.T.F.-D., and J.A.A.; resources, M.T.F.-D.; data curation, J.A.A.; writing—original draft preparation, J.P.-G. and J.A.A.; writing—review and editing, J.P.-G., C.A.L., R.M.P., F.S.-S., N.M.N., O.J.D., J.L.M., M.T.F.-D., and J.A.A.; visualization, J.A.A.; supervision, J.A.A.; project administration, J.L.M. and J.A.A.; funding acquisition, J.L.M. and J.A.A. All authors have read and agreed to the published version of the manuscript.

Funding

This research was funded by the Spanish Ministry of Economy and Competitivity, grant numbers MAT2017-84496-R and MAT2017-87134-C2-2-R; the Community of Madrid and Complutense University of Madrid, grant number PR65/19-22459, ANPCyT; and UNSL, under grant numbers PICT2014-3576 and PROICO 2-2016.

Acknowledgments

We are grateful to the Spanish Ministry of Economy and Competitivity for granting the projects MAT2017-84496-R and MAT2017-87134-C2-2-R, and ILL for making all facilities available for the neutron diffraction experiments. J.P.G. thanks the Community of Madrid for granting “Atracción de Talento program” fellowship, 2017-T2/I ND-5597, and project PR65/19-22459. C.A.L. acknowledges ANPCyT and UNSL for financial support (projects PICT2014-3576 and PROICO 2-2016), Argentine. C.A.L. is a member of CONICET.

Conflicts of Interest

The authors declare no conflict of interest.

References

  1. Snyder, G.J.; Toberer, E.S. Complex thermoelectric materials. Nat. Mater. 2008, 7, 105–114. [Google Scholar] [CrossRef]
  2. Dresselhaus, M.S.; Chen, G.; Tang, M.Y.; Yang, R.; Lee, H.; Wang, D.; Ren, Z.; Fleurial, J.P.; Gogna, P. New directions for low-dimensional thermoelectric materials. Adv. Mater. 2007, 19, 1043–1053. [Google Scholar] [CrossRef]
  3. Alam, H.; Ramakrishna, S. A review on the enhancement of figure of merit from bulk to nano-thermoelectric materials. Nano Energy 2013, 2, 190–212. [Google Scholar] [CrossRef]
  4. Minnich, A.; Dresselhaus, M.; Ren, Z.; Chen, G. Bulk nanostructured thermoelectric materials: Current research and future prospects. Energy Environ. Sci. 2009, 2, 466–479. [Google Scholar] [CrossRef]
  5. Mohebali, M.; Liu, Y.; Tayebi, L.; Krasinski, J.S.; Vashaee, D. Thermoelectric figure of merit of bulk FeSi2–Si0.8Ge0.2 nanocomposite and a comparison with β-FeSi2. Renew. Energy 2015, 74, 940–947. [Google Scholar] [CrossRef]
  6. Twaha, S.; Zhu, J.; Yan, Y.; Li, B. A comprehensive review of thermoelectric technology: Materials, applications, modelling and performance improvement. Renew. Sustain. Energy Rev. 2016, 65, 698–726. [Google Scholar] [CrossRef]
  7. Majumdar, A. Thermoelectricity in Semiconductor Nanostructures. Science 2004, 303, 777–778. [Google Scholar] [CrossRef]
  8. Nolas, G.S.; Sharp, J.; Goldsmid, J. Thermoelectrics: Basic Principles and New Materials Developments; Springer Science & Business Media: Berlin, Germany, 2013; Volume 45. [Google Scholar]
  9. Sales, B.; Mandrus, D.; Williams, R.K. Filled skutterudite antimonides: A new class of thermoelectric materials. Science 1996, 272, 1325–1328. [Google Scholar] [CrossRef]
  10. Serrano-Sánchez, F.; Prado-Gonjal, J.; Nemes, N.M.; Biskup, N.; Varela, M.; Dura, O.J.; Martínez, J.; Fernández-Díaz, M.T.; Fauth, F.; Alonso, J.A. Low thermal conductivity in La-filled cobalt antimonide skutterudites with an inhomogeneous filling factor prepared under high-pressure conditions. J. Mater. Chem. A 2018, 6, 118–126. [Google Scholar] [CrossRef] [Green Version]
  11. Lee, J.-K.; Choi, S.-M.; Seo, W.-S.; Lim, Y.-S.; Lee, H.-L.; Kim, I.-H. Thermoelectric properties of Spark Plasma Sintered InxYbyLa0.3-x-yCo4Sb12 skutterudite system. Renew. Energy 2012, 42, 36–40. [Google Scholar] [CrossRef]
  12. Nolas, G.; Cohn, J.; Slack, G.; Schujman, S. Semiconducting Ge clathrates: Promising candidates for thermoelectric applications. Appl. Phys. Lett. 1998, 73, 178–180. [Google Scholar] [CrossRef] [Green Version]
  13. Fu, C.; Bai, S.; Liu, Y.; Tang, Y.; Chen, L.; Zhao, X.; Zhu, T. Realizing high figure of merit in heavy-band p-type half-Heusler thermoelectric materials. Nat. Commun. 2015, 6, 8144. [Google Scholar] [CrossRef] [PubMed] [Green Version]
  14. Kauzlarich, S.M.; Brown, S.R.; Snyder, G.J. Zintl phases for thermoelectric devices. Dalton Trans. 2007, 21, 2099–2107. [Google Scholar] [CrossRef] [PubMed] [Green Version]
  15. Powell, A.V.; Vaqueiro, P. Chalcogenide thermoelectric materials. In Thermoelectric Materials and Devices; RSC Publishing: Cambridge, UK, 2016; p. 27. [Google Scholar]
  16. Guélou, G.; Vaqueiro, P.; Prado-Gonjal, J.; Barbier, T.; Hébert, S.; Guilmeau, E.; Kockelmann, W.; Powell, A.V. The impact of charge transfer and structural disorder on the thermoelectric properties of cobalt intercalated TiS2. J. Mater. Chem. C 2016, 4, 1871–1880. [Google Scholar] [CrossRef] [Green Version]
  17. Hebert, S.; Maignan, A. Thermoelectric oxides. In Functional Oxides; Wiley Online Library: Hoboken, NJ, USA, 2010; pp. 203–255. [Google Scholar]
  18. He, Y.; Day, T.; Zhang, T.; Liu, H.; Shi, X.; Chen, L.; Snyder, G.J. High Thermoelectric Performance in Non-Toxic Earth-Abundant Copper Sulfide. Adv. Mater. 2014, 26, 3974–3978. [Google Scholar] [CrossRef]
  19. An, T.-H.; Choi, S.-M.; Kim, I.-H.; Kim, S.-U.; Seo, W.-S.; Kim, J.-Y.; Park, C. Thermoelectric properties of a doped Mg2Sn system. Renew. Energy 2012, 42, 23–27. [Google Scholar] [CrossRef]
  20. Yin, Y.; Tudu, B.; Tiwari, A. Recent advances in oxide thermoelectric materials and modules. Vacuum 2017, 146, 356–374. [Google Scholar] [CrossRef]
  21. Weidenkaff, A.; Robert, R.; Aguirre, M.; Bocher, L.; Lippert, T.; Canulescu, S. Development of thermoelectric oxides for renewable energy conversion technologies. Renew. Energy 2008, 33, 342–347. [Google Scholar] [CrossRef]
  22. Wang, H.; Su, W.; Liu, J.; Wang, C. Recent development of n-type perovskite thermoelectrics. J. Mater. 2016, 2, 225–236. [Google Scholar] [CrossRef] [Green Version]
  23. Tritt, T.M.; Subramanian, M. Thermoelectric materials, phenomena, and applications: A bird’s eye view. Mrs Bull. 2006, 31, 188–198. [Google Scholar] [CrossRef] [Green Version]
  24. Sootsman, J.R.; Chung, D.Y.; Kanatzidis, M.G. New and old concepts in thermoelectric materials. Angew. Chem. Int. Ed. 2009, 48, 8616–8639. [Google Scholar] [CrossRef] [PubMed]
  25. Okuda, T.; Nakanishi, K.; Miyasaka, S.; Tokura, Y. Large thermoelectric response of metallic perovskites: Sr1− xLaxTiO3 (0<~ x<~ 0. 1). Phys. Rev. B 2001, 63, 113104. [Google Scholar] [CrossRef]
  26. Popuri, S.R.; Scott, A.; Downie, R.; Hall, M.; Suard, E.; Decourt, R.; Pollet, M.; Bos, J.-W. Glass-like thermal conductivity in SrTiO3 thermoelectrics induced by A-site vacancies. Rsc Adv. 2014, 4, 33720–33723. [Google Scholar] [CrossRef] [Green Version]
  27. Blennow, P.; Hagen, A.; Hansen, K.K.; Wallenberg, L.R.; Mogensen, M. Defect and electrical transport properties of Nb-doped SrTiO3. Solid State Ion. 2008, 179, 2047–2058. [Google Scholar] [CrossRef]
  28. Kovalevsky, A.V.; Aguirre, M.H.; Populoh, S.; Patrício, S.G.; Ferreira, N.M.; Mikhalev, S.M.; Fagg, D.P.; Weidenkaff, A.; Frade, J.R. Designing strontium titanate-based thermoelectrics: Insight into defect chemistry mechanisms. J. Mater. Chem. A 2017, 5, 3909–3922. [Google Scholar] [CrossRef]
  29. Lu, Z.; Zhang, H.; Lei, W.; Sinclair, D.C.; Reaney, I.M. High-figure-of-merit thermoelectric La-doped A-site-deficient SrTiO3 ceramics. Chem. Mater. 2016, 28, 925–935. [Google Scholar] [CrossRef] [Green Version]
  30. Wang, H.C.; Wang, C.L.; Su, W.B.; Liu, J.; Sun, Y.; Peng, H.; Mei, L.M. Doping effect of La and Dy on the thermoelectric properties of SrTiO3. J. Am. Ceram. Soc. 2011, 94, 838–842. [Google Scholar] [CrossRef]
  31. Wang, N.; Chen, H.; He, H.; Norimatsu, W.; Kusunoki, M.; Koumoto, K. Enhanced thermoelectric performance of Nb-doped SrTiO3 by nano-inclusion with low thermal conductivity. Sci. Rep. 2013, 3, 3449. [Google Scholar] [CrossRef]
  32. Muta, H.; Kurosaki, K.; Yamanaka, S. Thermoelectric properties of reduced and La-doped single-crystalline SrTiO3. J. Alloy. Compd. 2005, 392, 306–309. [Google Scholar] [CrossRef]
  33. Sears, V.F. Neutron scattering lengths and cross sections. Neutron News 1992, 3, 26–37. [Google Scholar] [CrossRef]
  34. Rodriguez-Carvajal, J.; Roisnel, T. Recent advances in magnetic structure determination by neutron powder diffraction. Phys. B 1993, 192, 55–69. [Google Scholar] [CrossRef]
  35. Mi, J.-L.; Christensen, M.; Nishibori, E.; Iversen, B.B. Multitemperature crystal structures and physical properties of the partially filled thermoelectric skutterudites M0.1Co4Sb12 (M= La, Ce, Nd, Sm, Yb, and Eu). Phys. Rev. B 2011, 84, 064114. [Google Scholar] [CrossRef]
  36. Kovalevsky, A.; Yaremchenko, A.; Populoh, S.; Weidenkaff, A.; Frade, J. Effect of A-site cation deficiency on the thermoelectric performance of donor-substituted strontium titanate. J. Phys. Chem. C 2014, 118, 4596–4606. [Google Scholar] [CrossRef]
  37. Koumoto, K.; Wang, Y.; Zhang, R.; Kosuga, A.; Funahashi, R. Oxide thermoelectric materials: A nanostructuring approach. Annu. Rev. Mater. Res. 2010, 40, 363–394. [Google Scholar] [CrossRef]
  38. Muta, H.; Kurosaki, K.; Yamanaka, S. Thermoelectric properties of rare earth doped SrTiO3. J. Alloy. Compd. 2003, 350, 292–295. [Google Scholar] [CrossRef]
  39. Liu, J.; Wang, C.; Li, Y.; Su, W.; Zhu, Y.; Li, J.; Mei, L. Influence of rare earth doping on thermoelectric properties of SrTiO3 ceramics. J. Appl. Phys. 2013, 114, 223714. [Google Scholar] [CrossRef]
Figure 1. Observed (red crosses), calculated (black line), and difference (lower blue line) Neutron Powder Diffraction (NPD) profiles for (a) Sr0.9(Ti0.9Nb0.1)O3-δ, at 25 and (b) 800 °C. The allowed Bragg positions are shown as green vertical marks.
Crystals 10 00100 g001
Figure 2. View of the crystal structure of Sr0.9(Ti0.9Nb0.1)O3 at 800 °C, highlighting the anisotropic ellipsoids for O atoms (99% probability), shaped as disks perpendicular to the Ti(Nb)-O-Ti(Nb) chemical bonds.
Crystals 10 00100 g002
Figure 3. Thermal evolution of the unit-cell volume for Sr0.9(Ti0.9Nb0.1)O3-δ in the 25–800 °C temperature range. The inset shows the evolution of the atomic displacement parameters (ADPs) for Sr (orange), Ti (green), and O (red and blue) atoms, and the unit-cell averaged Uiso (black) and corresponding Debye-fit (black line) with θD = 452 K.
Crystals 10 00100 g003
Figure 4. Observed (red crosses), calculated (black line), and difference (lower blue line) NPD profiles for Sr0.8(Ti0.9Nb0.1)O3−δ at 25 °C. The two series of allowed Bragg positions (green vertical marks) correspond to the main perovskite phase and TiO2 minor impurity, respectively.
Crystals 10 00100 g004
Figure 5. Temperature dependence of (a) the Seebeck coefficient (S), (b) electrical resistivity (ρ), and (c) power factor (S2ρ−1) of Sr1-xTi0.9Nb0.1O3-δ (x = 0, 0.1, 0.2).
Crystals 10 00100 g005
Figure 6. Temperature dependence of the (a) total thermal conductivity and (b) electronic (κe) and lattice (κL) contributions of Sr1-xTi0.9Nb0.1O3−δ (x = 0, 0.1, 0.2).
Crystals 10 00100 g006
Figure 7. Temperature dependence of the figure of merit, ZT, of Sr1-xTi0.9Nb0.1O3−δ (x = 0, 0.1, 0.2). error bars of ± 15% are indicated in the graph. This is based on the addition of 5% error for the Seebeck coefficient, 5% for the thermal conductivity, and 1.5% for the electrical resistivity error (obtained after three repetitions of the measurements).
Crystals 10 00100 g007
Table 1. Structural parameters after the Rietveld refinement of Sr0.9(Ti0.9Nb0.1)O3-δ from NPD data at 25 °C in the Pm-3m space group, a = 3.91726 (4) Å, with λ = 1.051 Å. Discrepancy factors: Rp = 3.14%, Rwp = 4.27%, Rexp = 2.49%, RBragg = 3.14%, χ2 = 3.27.
Fractional Atomic Coordinates and Isotropic or Equivalent Isotropic Displacement Parameters 2)
xyzUiso*/UeqOcc. (<1)
Sr0.500000.500000.500000.0065(4)*0.9
Ti0.000000.000000.000000.0028(6)*0.877(5)
Nb0.000000.000000.000000.0028(6)*0.123(5)
O10.500000.000000.000000.0085(5)0.95(1)
Atomic Displacement Parameters (Å2). U22(O1) = U33(O1).
U11U22U33U12U13U23
O10.0035(7)0.0109(4)0.0109(4)0.000000.000000.00000
Table 2. Structural parameters after the Rietveld refinement of Sr0.8(Ti0.9Nb0.1)O3-δ from NPD data at 25 °C in the Pm-3m space group, a = 3.91476 (3) Å, with λ = 1.594 Å. Discrepancy factors: Rp = 2.78%, Rwp = 3.63%, Rexp = 2.52%, RBragg = 1.77%, χ2 = 2.42.
ElementxyzUisoOcc. (<1)
Sr0.50000.50000.50000.0040(4)0.8
Ti0.00000.00000.00000.0007(8)0.875(3)
Nb0.00000.00000.00000.0007(8)0.125(3)
O10.50000.00000.00000.0046(2)0.832(6)