Article

Effects of Pulsed Magnetic Fields of Different Intensities on Dislocation Density, Residual Stress, and Hardness of Cr4Mo4V Steel

1
Department of Mechanical Engineering, Tsinghua University, Beijing 100084, China
2
Key Laboratory for Advanced Materials Processing Technology, Ministry of Education, Beijing 100084, China
3
Tianjin Research Institute for Advanced Equipment, Tsinghua University, Tianjin 300304, China
4
State Key Laboratory of Tribology, Tsinghua University, Beijing 100084, China
*
Author to whom correspondence should be addressed.
Crystals 2020, 10(2), 115; https://doi.org/10.3390/cryst10020115
Submission received: 29 January 2020 / Revised: 5 February 2020 / Accepted: 10 February 2020 / Published: 13 February 2020
(This article belongs to the Special Issue Defects in Crystals)

Abstract

:
To study the effects of pulsed magnetic fields of different intensities on the dislocation density, residual stress, and hardness of Cr4Mo4V steel, magnetic treatment is conducted at 0, 1.0, 1.3, 1.5, 2.0, and 2.5 T. The dislocation density and residual stress are measured using Electron Backscatter Diffraction (EBSD) and X-ray technique, respectively. The results reveal the dislocation density and compressive residual stress decrease at lower magnetic fields such as 1.0 T and 1.3 T, while they increase at higher magnetic fields such as 2.0 T and 2.5 T. The average value of kernel averaged misorientation (KAM) and compressive residual stress decrease about 10.4% and 15.8%, respectively, at 1.0 T, while they increase about 5.88% and 18.2%, respectively, at 2.5 T. The average value of hardness decreases about 3.5% at 1.0 T, from 817 HV to 787 HV. With the increments of intensities, the hardness of the treated samples increases. The hardness essentially remains unchanged at 2.0 T and 2.5 T. The reason for the dislocation motion under the action of pulsed magnetic fields is discussed.

1. Introduction

Cr4Mo4V steel is widely used in extreme environments owing to its high strength, hardness, toughness, and contact fatigue resistance at high temperatures (300–350 °C) [1]. However, extreme working conditions such as high contact pressure, speed, and temperature will accelerate the rolling contact fatigue (RCF) failure of bearing steels, thereby shortening bearing life [2]. Therefore, keeping Cr4Mo4V steel bearings away from RCF failure and extending the service life of these bearings are very important [3].
Several investigations have shown that a certain degree of residual compressive stress could delay the occurrence of RCF failure of bearing steel [4,5,6,7,8,9]. Bryan, et al. [5] found that the material properties of AISI M50 bearing balls with initial residual compressive stress change less than those without this initial stress. Dommarco, et al. [6] revealed that the existence of residual compressive stress delayed the occurrence of fatigue failure of the SAE 52100 steel. Youngsik [7] investigated the effects of residual stress on the rolling contact fatigue of cold-worked parts and revealed that the RCF performance could be improved by adjusting the distribution of residual stress inside the components.
At present, natural aging, heat treatment, hammer peening, surface strengthening, and ultrasonic impact treatments have been the main methods to adjust the distribution of residual stress [10]. Magnetic treatment could be a supplementary method for samples treated by these main methods, which could further improve the mechanical properties.
The effect of magnetic fields on residual stress [10,11,12], wear behavior [13], fatigue behavior [14], tensile properties [15], surface hardness [16], and crack growth [17] have been investigated in ferromagnetic materials. These studies have shown that ferromagnetic materials treated with specific magnetic fields possess better mechanical properties than those untreated. Shao et al. [10] revealed that the residual compressive stress reduced about 14.26% after treatment of 1.0 T pulsed magnetic field. Choi [14] found that the fatigue life increased as a result of the increments in yield strength, tensile strength, and elongation and the decrement of elastic modulus after magnetic field treatment. The following reasons were discussed: more cementite precipitation and the decrement of residual compressive stress after treatment. Paulmiera [16] revealed that the fluctuations in the friction coefficient and wear rate decreased, while the surface hardness and dislocation density increased with magnetic field treatment at room temperature. These studies have mainly focused on microstructure, residual stress, and mechanical properties before and after treatment. Only a few discussed effects of different magnetic fields on ferromagnetic materials. For example, Cai et al. [11,12] found that residual stress could decrease or increase after the treatment of pulsed magnetic fields of different intensities.
Dislocations in crystals could be separated into two types with regard to their function, geometrically necessary dislocations (GNDs) and statistically stored dislocations (SSDs). GNDs occurred in strain gradient fields because of the geometrical constraints of the crystal lattice. SSDs evolved from random trapping processes during plastic deformation [18]. GNDs would contribute far more than SSDs to the total dislocations when the characteristic scale is smaller than the dislocation dipole size and the plastic strain is very small [19,20]. Kernel averaged misorientation (KAM) is defined as the average misorientation between a central point and points around the center, except those out of the grain boundary. KAM values characterize changes caused by geometrically necessary dislocations in the local misorientation. The previous results reported by our co-author in Rui et al. [21] confirmed that KAM serves as a qualitative description of true dislocations density distribution using the coupled Electron Backscatter Diffraction and Electron Channeling Contrast Imaging observations. KAM plotted as a map reveals areas with an increased density of the defects, and as an average value for the whole scan, may reflect material strain history [21,22,23,24,25]. The KAM map is very similar with its GND map, as shown in Calcagnotto et al. [22]. The changes of KAM could also serve as a qualitative description of changes of true dislocations density with the same EBSD scanning step size and 2D coordinate system in the EBSD observational surface [21].
In this paper, the effects of pulsed magnetic fields of different intensities on dislocation density, residual stress, and hardness of Cr4Mo4V steel are investigated experimentally. The reason for the dislocation motion under the action of pulsed magnetic fields is discussed. This investigation provides the reference for determining appropriate magnetic treatment parameters that could improve the mechanical properties of Cr4Mo4V steel.

2. Materials and Methods

2.1. Sample Preparation

Cr4Mo4V steel that has been heat treated was employed for this study. The chemical composition of this Cr4Mo4V steel is shown in Table 1.
Six samples for EBSD measurements, numbered as 1, 2, 3, 4, 5, and 6, were prepared by wire cutting. The sizes of these samples are 15 mm × 15 mm × 5 mm.
Six samples with the size of 15 mm × 15 mm × 5 mm were prepared for residual stress measurement. Six circular measurement areas in each sample were randomly marked with a diameter of 2 mm by CO2 laser.
Seventy-two samples with the size of 15 mm × 15 mm × 5 mm were prepared for Vickers Hardness testing.
The surface of all specimens was produced by wet grinding on 200, 400, 600, 800, 1000, 1200, 1500, and 2000-grit sand papers, and mechanically polished to be scratch-free. All specimens were cleaned ultrasonically with acetone and dried. To maintain the structural integrity of samples, the whole cross-section surface was prepared by argon ion-beam polishing (EM TIC 3X, Leica, Germany), using an accelerating voltage of 4.5 kV for 4 h.

2.2. Materials Characterization

The surface of Cr4Mo4V steel was etched with the 10% HNO3–CH3CH2OH solution for 30 s. Then, the microstructure of Cr4Mo4V steel was obtained using scanning electron microscopy (FEI, QUANTA 200 FEG, Netherlands). Phase analysis was conducted using X-ray diffractometer (D/max-2500/PC, Rigaku Corporation, Japan) with Cu Kα1 radiation, and the parameters were 45 kV, 35 mA at 293 K. The measuring range was from 30° to 120° and a continuous scanning mode was used with the speed of 1°/min.

2.3. EBSD Tests

The EBSD experiments were conducted on a scanning auger probe (ULVAC-PHI 710, ULVAC-PHI INCORPRATED, Japan) equipped with an OXFORD Instruments NordlysMax2 EBSD system with a voltage of 20 kV and a current of 8 nA. EBSD data collected during the test were processed using EDAX OIM v.7.2 software. This EDAX OIM software was used to calculate KAM values and maps. KAM is calculated using only the nearest neighbors (one step or first order KAM), maximum misorientation of 5°, and all points in the kernel [25]. The inverse pole figure and phase distribution map are also calculated using this EDAX OIM software.
The same areas were observed in the scanning electron microscope before and after magnetic treatment. EBSD settings (e.g., working distance, magnification) were kept as consistent as possible for the reference and exposed specimens through the test. A small zone of 5 μm × 5 μm was scanned at 5000 × magnification before and after treatment, where the step length was set to 0.01 μm. EBSD data were cleaned using grain dilation type. The cleaning up parameters included grain tolerance angle and minimum grain size. The grain tolerance angle was 5 and minimum grain size was 2 for the first time. The grain tolerance angle was 2 and minimum grain size was 1 for the second and third times.

2.4. Residual Stress Measurement

Residual stress was measured by μ-X360s (Pulstec, Japan) with Cr Kα1 radiation and the parameters were 30 kV, 1 mA at 293 K. The diameter of illuminated surface of this μ-X360s was 2 mm. Circular measurement areas were already marked with the diameter of 2 mm in each sample. Each area was measured before and after pulsed magnetic field treatment. This measurement takes 30 s for X-ray exposure and 90 s for displaying the results of residual stress.

2.5. Vickers Hardness Measurement

Vickers hardness test was conducted on FM-810 (Future-Tech, Japan) with a load of 500 gf at a holding time of 10 s. There were six groups corresponding to six kinds of pulsed magnetic fields of different intensities. Twelve samples with the size of 10 mm × 10 mm × 5 mm were prepared in each group. Six samples were measured before treatment and the other six samples were measured after treatment. In each sample, ten random points were measured. In total, sixty points were measured separately before and after treatment in each group.

2.6. Pulsed Magnetic Field Treatment

The self-made pulsed magnetic field equipment [11,12] includes two parts, as shown in Figure 1a. The first part is the pulse power supply, which can output the sine wave and square wave. The pulse width and frequency can be adjustable in succession within the range of the fixed one. The second part is a magnetic field generator. This generator includes magnet yokes and current carrying coils. The cavity size can be adjusted to generate a continuously tunable pulsed magnetic field from 0 T to 2.8 T.
Half sine-wave pulsed magnetic field was used, as shown in Figure 1b. The maximum intensities of pulsed magnetic fields were 0 T, 1.0 T, 1.3 T, 1.5 T, 2.0 T, and 2.5 T. The pulse frequency was 1 Hz. In total, 55 pulses were used in each group at room temperature.

3. Experiment Results

3.1. Materials Characterization

The main phases of this Cr4Mo4V steel are tempered martensite and carbides. The structure of tempered martensite is flaky or needle-like. Original austenite grain boundaries are observed and the original austenitic grain size in the matrix is within the range from 20 to 60 µm, as shown in Figure 2a,b. The structure of carbides is lumpy or spherical. Carbide constituent elements include Fe, C, Cr, Mo, and V. The grain size of carbides is within in the range from 0.5 to 6 µm. Globular carbide particles of about 0.5–2 µm distribute along the original austenite grain boundaries discontinuously, as shown in Figure 2c. The typical (110), (200), (211), (220), and (310) peaks of martensite are determined in Figure 2d. The peaks of retained austenite, such as (111) and (200), are not observed owing to its extremely low content.
The inverse pole figure and distribution map of phases are shown in Figure 3. The crystal orientation of martensite laths in the same original austenite is similar and twin structures are observed in Figure 3a. The main phases are martensite and carbides, while almost no retained austenite exists, as shown in Figure 3b. The width of the tempered martensite lath is within the range of 0.2–1 µm and the length is within the range of 0.2–5 µm.

3.2. Dislocations

KAM maps of six samples before and after treatment are shown in Figure 4. The color bar from blue to red corresponds to KAM values from 0° to 5° in the bottom. The black lines represent grain boundaries. The regions divided by these black lines represent individual martensite grains inside the maps. Sample 1 is a control group without treatment, while the other five samples are treated. The subarea selected by the frames in each map is with obvious changes.
It can be seen from Figure 4a, the control group, that there is little change before and after treatment. The green and yellow color fade and the blue color is pronounced in grains and around grain boundaries, which imply the reduction of KAM values in the selected subarea of Figure 4b,c, for example, area 1 and area 2 in Figure 4b and area 1 in Figure 4c. The green and yellow color are pronounced in the most selected subarea of Figure 4d–f, for example, hot spot a in Figure 4d and hot spot a and b in Figure 4f. However, there are still some areas where the green and yellow color fade, for example, hot spot b in Figure 4d and hot spot c in Figure 4f. These results indicate the KAM values decrease at 1.0 and 1.3 T, while the increase and decrease of KAM values coexist at 1.5, 2.0, and 2.5 T.
Figure 5 shows the density curves of KAM values before and after treatment corresponding to KAM maps in Figure 4. Figure 5b,c show that the density curves of KAM after treatment in each is offset to the left compared with untreated, which means the overall values decrease after treatment at 1.0 and 1.3 T. Figure 5f shows the density curves of KAM after treatment are offset to the right, which means the overall values increase after treatment at 2.5 T.
The results in Figure 6 quantitatively describe the phenomenon in Figure 4 and Figure 5. They reveal the average value of KAM after treatment reduce from 0.84° and 0.60° to 0.75° and 0.55° at 1.0 T and 1.3 T, respectively, while the average value of KAM after treatment separately increase from 0.64° and 0.68° to 0.67° and 0.72°at 2.0 and 2.5 T, respectively.

3.3. Residual Stress

The details of residual stress distribution are demonstrated in Figure 7. The result of the control group is shown in Figure 7a. The average residual compressive stress of six areas in each group decrease at 1.0, 1.3, and 1.5 T, from 21.5 MPa to 18.1 MPa, 40.3 MPa to 36.7 MPa, and 69.7 MPa to 64.4 MPa, respectively, while they increase from 132.5 MPa to 147.7 MPa and 73.7 MPa to 87.1 MPa at 2.0 and 2.5 T, as shown in Figure 8. Though the average residual compressive stress decreases at 1.0, 1.3, and 1.5 T, the compressive stress in some specific areas, however, increases. For example, it increases from 18.0 MPa to 32.0 MPa in Area 1 in Figure 7b, from 32.0 MPa to 43.3 MPa in Area 3 in Figure 7c, and from 62.0 MPa to 69.2 MPa in Area 4 in Figure 7d. From Figure 7 and Figure 8, the maldistribution of residual compressive stress could be seen in different samples with the lower limit of residual compressive stress of about 160 MPa and the upper limit about of 18 MPa in Cr4Mo4V steel.

3.4. Vickers Hardness

Superior hardness is critically important for bearings working in extreme environments because of the demand of long fatigue life [26,27]. Figure 9 shows the distribution of sixty hardness points both before and after treatment. The result of the control group is shown in Figure 9a. From Figure 9, we could see the minimum hardness of Cr4Mo4V steel is higher than 700 HV and the maximum value is below 860 HV. Figure 9a,e,f reveal that there are no clear differences before treatment and after treatment. The hardness points treated are lower overall in Figure 9b–d.
Figure 10 presents average values of hardness before and after treatment. It indicates that the hardness of untreated samples is distributed equally and the average value is 817 HV. The average values of treated samples reduce to 787 HV, 789 HV, and 798 HV at 1.0 T, 1.3 T, and 1.5 T, while the values essentially remain unchanged at 2.0 T and 2.5 T.

4. Discussion

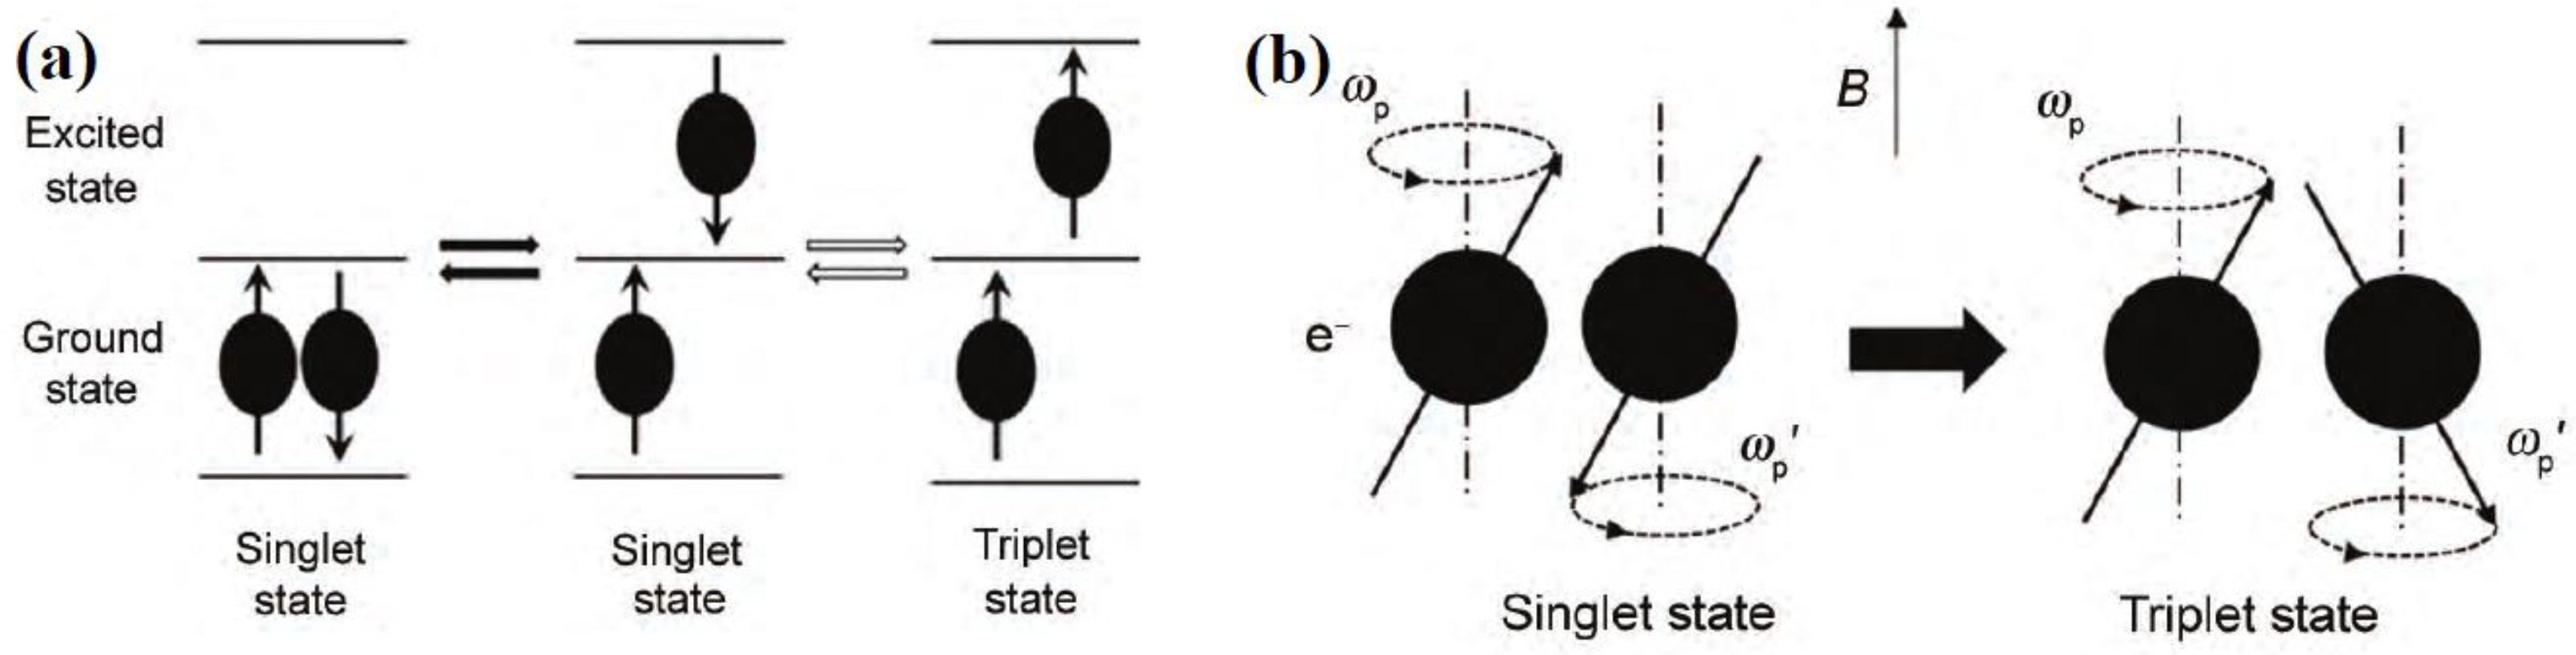
4.1. Mechanism of Dislocation Movement with Magnetic Treatment

Figure 4, Figure 5 and Figure 6 reveal that the dislocation density decreases at 1.0 and 1.3 T, while it increases at 2.0 and 2.5 T. The mechanism explanation of dislocation motion under pulsed magnetic field can be divided into two types. The first is magnetoplastic effects. The energy state of the electrons in the pinning area of dislocations changed under magnetic field treatment, which accelerates the electrons transformation from singlet state to triplet state, and then increases the mobility of the vacancy or impurity atoms so that the dislocation depinning could occur under the original stress field, and thus leads to dislocation movement and transformation of the microstructure [28,29,30,31,32]. As shown in Figure 11a, the spin state of the electron pair forming a covalent bond has a ground state and excited state, and excited states can be divided into the S state (singlet state) and T state (triplet state) according to their total spin. Black arrows indicate frequent state transitions and white arrows indicate infrequent state transitions. Gs-S denotes the S state in the ground state, Es-S denotes the S state in the excited state, and Es-T denotes the T state in the excited state. The transformation between Gs-S and Es-S is frequent as thermal activation during the transformation between Gs-S and Es-T is much lower owing to the spin-forbidden transition.
g -Mechanism [29,31,32] is a visualized model and discusses the Larmor frequency difference caused by non-collinear of μ and B in Equation (1).
ω p = μ g B h
where ω p is precession angular frequency; B is the magnetic field; μ the is magnetic moment of electron; and h is the Planck constant. As shown in Figure 11b, because of the pulsed magnetic field, the Larmor precession angular frequency of the electron pair changes faintly ω p   ω p , which produces a chance for electron pair to transform their state from ground singlet state or excited singlet state to excited triplet state. The frequency of these changes (from singlet state to triplet state) could increase from 0 to 108~109 s−1 inside the materials [30].
Once the electron pair energy state changed into Es-T, it can remain excited for a long time because the transition from triplet state (Es-T) to ground state (Gs-S) or excited singlet state (Es-S) is spin-forbidden owing to the spin selection rule. The excited triplet state has a lower binding energy than the ground singlet state. The metallic bond can be analyzed using localized models, such as the covalent theory of metals [33], which attributes metal bonding partially to the covalent bond, thus making it possible to apply the magnetically induced electron pair energy state change mechanism to the magnetoplastic effects of metals and alloys. Briefly, the magnetic field can cause the bonding electron pairs to transform from singlet state to triplet state and the bonding electron pairs will exist in the excited triplet state for a long time. The result is that the covalent bond is much easier to break. The atomic mobility is enhanced and the atom-migration-related processes are prompted [34]. Thus, the mobility of vacancy or impurity atoms increases so that the dislocation depinning could occur under the original stress field and leads to the dislocation movement.
Second, magneto-vibration would occur inside steel materials, which provides impetus for the dislocation movement with a positive and negative magnetostriction coefficient. This magneto-vibration is induced by the change of the magnetostriction coefficient. The magnetostriction coefficient is positive under the treatment of a weak magnetic field, while the magnetostriction coefficient is negative under the treatment of a strong magnetic field [10,35,36,37]. This vibration provides energy for the dislocation movement. It should be emphasized that the thermal energy induced by a magnetic field with an intensity of several Teslas is ignorable [34]. As the total processing time is only 55 s, the temperature of the Cr4Mo4V steel sample hardly changes.
Figure 12 reveals that the percent change of the average value of KAM increases from −10.7% at 1.0 T to 5.88% at 2.5 T. The dislocation decreases at lower magnetic fields such as 1.0 T and 1.3 T, while it increases at higher magnetic fields such as 2.0 T and 2.5 T. The reason is that dislocations are scattered because the depinning of dislocations is more likely to happen and magnetostriction provides extra energy for dislocation motion. Therefore, the dislocation densities decrease. If the intensities of magnetic fields increase, the distance of the dislocation motion would increase, resulting in the new sources of dislocations [11]. Therefore, the dislocation densities increase.

4.2. Mechanism of Residual Stress Change

Figure 12 shows that the trend of percent change of compressive residual stress is like the trend of percent change of KAM. The compressive residual stress decreases about 15.8% at 1.0 T, while it increases about 18.2% at 2.5 T. It decreases at lower magnetic fields such as 1.0 T and 1.3 T, while it increases at higher magnetic fields such as 2.0 T and 2.5 T.
The reason is that the dislocation slip, dislocation creep, grain boundary sliding, or diffusion creep could transform elastic residual strains into microplastic strains. The residual stress relaxation could occur [38]. If the residual stress remains the same during the treatment, excess dislocations must escape at the surface or dislocations’ annihilation must occur inside the sample [39]. Therefore, the change of dislocation is accompanied by the change of residual stress.

4.3. Mechanism of Hardness Change

As shown in Figure 10 and Figure 12, the average value of hardness decreases about 3.5% at 1.0 T and 1.3 T. With the increments of magnetic field intensities, the hardness of treated samples increases. It essentially remains unchanged at 2.0 T and 2.5 T.
In engineering, hardness is usually defined in terms of resistance of the material to penetration by a hard ball or point [40].The high hardness of the quenched and tempered high-carbon steel is the result of its martensitic structure [41]. Martensitic steels possess high deformation resistance owing to hardening by dislocations and precipitates. The dislocations in martensitic steels are divided into two types, firstly as individual (free dislocations) and secondly as two-dimensional dislocation networks [42].
Two-dimensional dislocation networks impede the movement of dislocations during elastic and plastic deformation. When this Cr4Mo4V steel is magnetic treated, two-dimensional dislocations are scattered and dislocations’ annihilation will happen because the depinning of dislocations [11]. Therefore, both the dislocation density and hardness decreases, such as 1.0 and 1.3 T. When the intensities of magnetic fields increase, the distance of dislocation motion would increase, resulting in the new sources of dislocations. These new dislocations are individual, so-called free dislocations. Free dislocations are pinned by solute atoms or carbides during movement, thereby strengthening the steel. With the resolution of the two-dimensional dislocation networks, even if the free dislocations increase, causing the increments of dislocation density, the hardness does not increase, or it is a little lower than untreated at 2.0 T and 2.5 T.

5. Conclusions

The present work focused on dislocation, residual stress, and hardness evolution in Cr4Mo4V steel under treatment of pulsed magnetic fields of different intensities. The results can be concluded as follows.
(1) The dislocation decreases at lower magnetic fields such as 1.0 T and 1.3 T, while it increases at higher magnetic fields such as 2.0 T and 2.5 T. For example, the percent change of the average value of KAM increases from −10.7% at 1.0 T to 5.88% at 2.5 T.
(2) The change law of compressive residual stress is the same as the dislocation. It decreases about 15.8% at 1.0 T, while it increases about 18.2% at 2.5 T.
(3) The average value of hardness decreases about 3.5% at 1.0 T and 1.3 T. With the increment of magnetic intensities, the hardness of treated samples increases and remains unchanged at 2.0 and 2.5 T.
(4) The mechanism of dislocation movement under treatment of pulsed magnetic fields is discussed: (1) Transformation of electron in the pinning area from singlet state to triplet state is accelerated, and then vacancy or impurity atoms are easier to move. Therefore, under the action of the original stress field, the depinning of dislocations could occur. (2) Magnetostriction provides extra energy for dislocation motion.

Author Contributions

Conceptualization, M.H. and X.Z.; methodology, M.H. and X.L.; validation, M.H.; formal analysis, M.H., K.L., and X.L.; investigation, M.H.; resources, Z.C.; data curation, M.H. and S.R.; writing—Original draft preparation, M.H.; writing—Review and editing, Z.C., K.L., and X.L.; visualization, M.H.; supervision, Z.C.; project administration, Z.C., Y.W., and K.L.; funding acquisition, Z.C. All authors have read and agreed to the published version of the manuscript.

Funding

This work is supported by the National Natural Science Foundation of China (No. 51775300 and No. 51901113) and National Science and Technology Major Project of China (No. 2018ZX04042001).

Acknowledgments

The authors appreciate the guidance of EBSD experiments from Yiqing Han, who belongs to School of Materials Science and Engineering, Tsinghua University.

Conflicts of Interest

The authors declared that they have no conflicts of interests to this work.

References

  1. Mukhopadhyay, P.; Kannaki, P.S.; Srinivas, M.; Roy, M. Microstructural developments during abrasion of M50 bearing steel. Wear 2014, 315, 31–37. [Google Scholar] [CrossRef]
  2. Bhadeshia, H.K.D.H. Steels for bearings. Prog. Mater. Sci. 2012, 57, 268–435. [Google Scholar] [CrossRef]
  3. Wang, F.; Qian, D.S.; Hua, L.; Lu, X.H. The effect of prior cold rolling on the carbide dissolution, precipitation and dry wear behaviors of M50 bearing steel. Tribol. Int. 2019, 132, 253–264. [Google Scholar] [CrossRef]
  4. Guan, J.; Wang, L.Q.; Mao, Y.Z.; Shi, X.J.; Ma, X.X.; Hu, B. A continuum damage mechanics based approach to damage evolution of M50 bearing steel considering residual stress induced by shot peening. Tribol. Int. 2018, 126, 218–228. [Google Scholar] [CrossRef]
  5. Allison, B.; Subhash, G.; Arakere, N.; Haluck, D.A.; Chin, H. Influence of initial residual stress on material properties of bearing steel during rolling contact fatigue. Tribol. Trans. 2014, 57, 533–545. [Google Scholar] [CrossRef]
  6. Dommarco, R.C.; Kozaczek, K.J.; Bastias, P.C.; Hahn, G.T.; Rubin, C.A. Residual stresses and retained austenite evolution in SAE 52100 steel under non-ideal rolling contact loading. Wear 2004, 257, 1081–1088. [Google Scholar] [CrossRef]
  7. Choi, Y. A study on the effects of machining-induced residual stress on rolling contact fatigue. Int. J. Fatigue 2009, 31, 1517–1523. [Google Scholar] [CrossRef]
  8. Guo, Y.B.; Barkey, M.E. Modeling of rolling contact fatigue for hard machined components with process-induced residual stress. Int. J. Fatigue 2004, 26, 605–613. [Google Scholar] [CrossRef]
  9. Shen, Y.; Moghadam, S.M.; Sadeghi, F.; Paulson, K.; Trice, R.W. Effect of retained austenite compressive residual stresses on rolling contact fatigue life of carburized AISI 8620 steel. Int. J. Fatigue 2015, 75, 135–144. [Google Scholar] [CrossRef]
  10. Shao, Q.; Kang, J.J.; Xing, Z.G.; Wang, H.D.; Huang, Y.F.; Ma, G.Z.; Liu, H.P. Effect of pulsed magnetic field treatment on the residual stress of 20Cr2Ni4A steel. J. Magn. Magn. Mater. 2019, 476, 218–224. [Google Scholar] [CrossRef]
  11. Cai, Z.P.; Lin, J.A.; Zhou, L.A.; Zhao, H.Y. Evaluation of effect of magnetostriction on residual stress relief by pulsed magnetic treatment. Mater. Sci. Technol. 2004, 20, 1563–1566. [Google Scholar] [CrossRef]
  12. Cai, Z.P.; Huang, X.Q. Residual stress reduction by combined treatment of pulsed magnetic field and pulsed current. Mater. Sci. Eng. A. 2011, 528, 6287–6292. [Google Scholar] [CrossRef]
  13. Fu, L.C.; Zhou, L.P. Effect of applied magnetic field on wear behavior of martensitic steel. J. Mater. Res. Technol. 2019, 28, 2880–2886. [Google Scholar] [CrossRef]
  14. Choi, K.J.; Yoo, S.C.; Ham, J.; Kim, J.H.; Jeong, S.Y.; Choi, Y.S. Fatigue behavior of AISI 8620 steel exposed to magnetic field. J. Alloy. Compd. 2018, 764, 73–79. [Google Scholar] [CrossRef]
  15. Wang, Y.Q.; Gorley, M.; Kabra, S.; Surrey, E. Influence of a 1.5 T magnetic field on the tensile properties of Eurofer-97 steel. Fusion Eng. Des. 2019, 141, 68–72. [Google Scholar] [CrossRef]
  16. Paulmiera, D.; Zaidia, H.; Bedria, R.; Kadiri, E.K.; Pan, L.; Jiang, Q. Steel surface modifications in magnetised sliding contact. Surf. Coat. Technol. 1995, 76–77, 583–588. [Google Scholar] [CrossRef]
  17. Lu, B.T.; Qiao, S.R.; Sun, X.Y. Exploration on repairing fatigue damage of steel specimens with magnetic treatment. Scr. Mater. 1999, 40, 767–771. [Google Scholar]
  18. Ashby, M.F. The deformation of plastically non-homogeneous materials. Philos. Mag. 1970, 21, 399–424. [Google Scholar] [CrossRef]
  19. Jiang, J.; Britton, T.B.; Wilkinson, A.J. Measurement of geometrically necessary dislocation density with high resolution electron backscatter diffraction: Effects of detector binning and step size. Ultramicroscopy 2013, 125, 1–9. [Google Scholar] [CrossRef]
  20. Zhu, C.Y.; Harrington, T.; Gray, G.T., III; Vecchio, K.S. Dislocation-type evolution in quasi-statically compressed polycrystalline nickel. Acta Mater. 2018, 155, 104–116. [Google Scholar] [CrossRef]
  21. Rui, S.S.; Niu, L.S.; Shi, H.J.; Wei, S.L.; Tasan, C.C. Diffraction-based misorientation mapping: A continuum mechanics description. J. Mech. Phys. Solids 2019, 133, 103709. [Google Scholar] [CrossRef]
  22. Calcagnotto, M.; Ponge, D.; Demir, E.; Raabe, D. Orientation gradients and geometrically necessary dislocations in ultrafine grained dual-phase steels studied by 2D and 3D EBSD. Mater. Sci. Eng. A 2010, 527, 2738–2746. [Google Scholar] [CrossRef]
  23. Nye, J.F. Some geometrical relations in dislocated crystals Quelques relations géométriques dams des cristaux disloqués Einige geometrische beziehungen in verformten kristallen. Acta Metall. 1953, 1, 153–162. [Google Scholar] [CrossRef]
  24. Arsenlis, A.; Parks, D.M. Crystallographic aspects of geometrically-necessary and statistically-stored dislocation density. Acta Mater. 1999, 47, 1597–1611. [Google Scholar] [CrossRef]
  25. Gussev, M.N.; Leonard, K.J. In situ SEM-EBSD analysis of plastic deformation mechanisms in neutron-irradiated austenitic steel. J. Nucl. Mater. 2019, 517, 45–56. [Google Scholar] [CrossRef]
  26. Zaretsky, E.V. Rolling bearing steels-a technical and historical perspective. Mater. Sci. Technol. 2012, 28, 58–69. [Google Scholar] [CrossRef] [Green Version]
  27. Cui, W.; Martin, D.S.; Pedro, E.J. Towards efficient microstructural design and hardness prediction of bearing steels—An integrated experimental and numerical study. Mater. Des. 2017, 133, 464–475. [Google Scholar] [CrossRef]
  28. Bhaumik, S.; Molodova, X.; Molodov, D.A.; Gottstein, G. Magnetically enhanced recrystallization in an aluminum alloy. Scr. Mater. 2006, 55, 995–998. [Google Scholar] [CrossRef]
  29. Alshits, V.I.; Darinskaya, E.V.; Koldaeva, M.V.; Petrzhik, E.A. Magnetoplastic effect: Basic properties and physical mechanisms. Crystallogr. Rep. 2003, 48, 768–795. [Google Scholar] [CrossRef]
  30. Xu, Q.D.; Li, K.J.; Cai, Z.P.; Wu, Y. Effect of Pulsed Magnetic Field on the Microstructure of TC4 Titanium Alloy and Its Mechanism. Acta Metall. Sin. 2019, 55, 489–495. [Google Scholar]
  31. Molotskii, M.I.; Kris, R.E.; Fleurov, V. Internal friction of dislocations in a magnetic field. Phys. Rev. B 1995, 51, 12531–12536. [Google Scholar] [CrossRef] [PubMed]
  32. Golovin, Y.I. Study on the relationship between magneto-vibration and residual stress in steel materials. J. Mater. Sci. 2004, 39, 5129–5134. [Google Scholar] [CrossRef]
  33. Wang, F.E. Bonding Theory for Metals and Alloys; Elsevier: Amsterdam, The Netherlands, 2005; pp. 6–7. [Google Scholar]
  34. Zhang, X.; Zhao, Q.; Cai, Z.P.; Pan, J.L. Effects of Magnetic Field on the Residual Stress and Structural Defects of Ti-6Al-4V. Metals 2020, 10, 141. [Google Scholar] [CrossRef] [Green Version]
  35. Tang, G.Y.; Xu, Z.H.; Tang, M.; Chen, X.H.; Zhou, H.H.; Lu, A.L. Effect of a pulsed magnetic treatment on the dislocation substructure of a commercial high strength steel. Mater. Sci. Eng. A 2003, 48, 768–795. [Google Scholar] [CrossRef]
  36. Lin, J.; Zhao, H.Y.; Cai, Z.P.; Lei, Y.P. Study on the relationship between magneto-vibration and residual stress in steel materials. Acta Metall. Sin. 2008, 44, 451–456. [Google Scholar]
  37. Lu, A.L.; Tang, F.; Luo, X.J.; Mei, J.F.; Fang, H.Z. Research on residual-stress reduction by strong pulsed magnetic treatment. J. Mater. Process. Technol. 1998, 74, 259–262. [Google Scholar] [CrossRef]
  38. Vohringer, O. Relaxation of residual stresses by annealing or mechanical treatment. Adv. Surf. Treat. 1987, 4, 367–396. [Google Scholar]
  39. Prussin, S. Generation and Distribution of Dislocations by Solute Diffusion. J. Appl. Phys. 1961, 32, 1876–1881. [Google Scholar] [CrossRef]
  40. Dowling, N.E. Mechanical Behavior of Materials; Pearson Education: Boston, MA, USA, 2013; p. 118. [Google Scholar]
  41. Meyers, M.A.; Chawla, K.K. Mechanical Behavior of Materials; Cambridge University Press: Cambridge, UK, 2009; pp. 2–3. [Google Scholar]
  42. Blum, W.; Gotz, G. Evolution of dislocation structure in martensitic steels: The subgrain size as a sensor for creep strain and residual creep life. Mater. Technol. 1999, 70, 274–278. [Google Scholar] [CrossRef]
Figure 1. (a) Schematic of the pulsed magnetic field equipment; (b) half sine-wave pulsed magnetic field during the treatment.
Crystals 10 00115 g001
Figure 2. Microstructure of the Cr4Mo4V steel. (a) Low magnification; (b) a magnified image of (a); (c) a magnified image of the carbide; (d) XRD pattern of Cr4Mo4V steel.
Crystals 10 00115 g002
Figure 3. (a) Inverse pole figure of the Cr4Mo4V steel; (b) distribution map of phases.
Crystals 10 00115 g003
Figure 4. Kernel averaged misorientation (KAM) maps before and after treatment at different magnetic fields. (a) 0 T; (b) 1.0 T; (c) 1.3 T; (d) 1.5 T; (e) 2.0 T; (f) 2.5 T.
Crystals 10 00115 g004
Figure 5. KAM density curves before and after treatment at different magnetic fields. (a) 0 T; (b) 1.0 T; (c) 1.3 T; (d) 1.5 T; (e) 2.0 T; (f) 2.5 T.
Crystals 10 00115 g005
Figure 6. Average value of KAM before and after treatment at different magnetic fields.
Crystals 10 00115 g006
Figure 7. Residual stress before and after treatment at different magnetic fields. (a) 0 T; (b) 1.0 T; (c) 1.3 T; (d) 1.5 T; (e) 2.0 T; (f) 2.5 T.
Crystals 10 00115 g007
Figure 8. Average value of residual stress before and after treatment at different magnetic fields.
Crystals 10 00115 g008
Figure 9. Vickers hardness before and after treatment at different magnetic fields. (a) 0 T; (b) 1.0 T; (c) 1.3 T; (d) 1.5 T; (e) 2.0 T; (f) 2.5 T.
Crystals 10 00115 g009
Figure 10. Average value of Vickers hardness before and after treatment at different magnetic fields.
Crystals 10 00115 g010
Figure 11. (a) Transforming relationship of the spin energy state of the electron pair and (b) transformation of the state of electron spin under pulsed magnetic field [30].
Crystals 10 00115 g011
Figure 12. The percent change of the average value of KAM, residual stress, and Vickers hardness at different magnetic fields.
Crystals 10 00115 g012
Table 1. Chemical composition of the Cr4Mo4V steel (wt.%).
SteelCrMoVCMnSiNiCuSP
Cr4Mo4V steel4410.720.300.200.100.050.010.01

