Article

Influence of Oxidation on Temperature-Dependent Photoluminescence Properties of Hydrogen-Terminated Silicon Nanocrystals

1
Department of Physics, Triveni Devi Bhalotia College, Raniganj, West Bengal 713347, India
2
International Center for Materials Nanoarchitectonics (MANA), National Institute for MaterialsScience (NIMS), 1-1 Namiki, Tsukuba 305-0044, Japan
3
Graduate School of Chemical Sciences and Engineering, Hokkaido University, Sapporo 060-0814, Japan
4
Department of Physics, Chuo University, 1-13-27 Kasuga, Bunkyo, Tokyo 112-8551, Japan
*
Authors to whom correspondence should be addressed.
Crystals 2020, 10(3), 143; https://doi.org/10.3390/cryst10030143
Submission received: 13 November 2019 / Revised: 11 February 2020 / Accepted: 21 February 2020 / Published: 25 February 2020
(This article belongs to the Special Issue Light-Emittting Silicon Nanostructures)

Abstract

:
In this study, we investigate temperature-dependent photoluminescence (PL) in three samples of hydrogen-terminated silicon nanocrystals (ncSi-H) with different levels of surface oxidation.ncSi-H was oxidized by exposure to ambient air for 0 h, 24 h, or 48 h. The PL spectra as a function of temperature ranging between room temperature (~297 K) and 4 K are measured to elucidate the underlying physics of the PL spectra influenced by the surface oxidation of ncSi-H. There are striking differences in the evolution of PL spectra according to the surface oxidation level. The PL intensity increases as the temperature decreases. ForncSi-H with a smaller amount of oxide, the PL intensity is nearly saturated at 90 K. In contrast, the PL intensity decreases even below 90 K for the heavilyoxidized ncSi-H. For all the samples, full-width at half maxima (FWHM)decreases as the temperature decreases. The plots of the PL peak energy as a function of temperature can be reproduced with an equation where the average phonon energy and other parameters are calculated.

Graphical Abstract

1. Introduction

Since the discovery of photoluminescence (PL) from porous silicon (Si) in 1991, many theoretical and experimental studies have focused on the development of a highly luminescent Si nanocrystal (ncSi) for applications in bioimaging, LEDs, and sensors [1,2,3,4,5,6,7,8,9]. Among these nanostructures, freestanding, highlystable, luminescent colloidal ncSihashas gained considerable attention due to its unique advantages, including high quantum yields (QYs) of PL. In the past decade, considerable progress has been made toward realizing highly luminescent freestanding ncSi [10,11,12,13,14]. In the last two decades, freestanding hydrogen terminated ncSi (ncSi-H) with 1–2% PL QYs has been widely studied because Si-H bonds are promising to achieve various functionalizations with organics. By tuning the size of ncSi, the PL spectrum is controlled in a broad range between the visible and near-infrared wavelengths.
The PL emission of the silicon nanostructure remains debatable. However, the indirect nature of silicon makes it more complicated to develop an accurate emission model for the direct band gap semiconductor nanostructure. The emission mechanism is further complicated by the highlyreactive surface of ncSi-H. Hydrogen-terminated surfaces are prone to oxidation in ambient air. It is well accepted that, depending on the surface quality, both quantum confinement of excitons and localized defect states at the surface/interface of ncSiplay important roles in the emission. In particular, the amount of oxidation of ncSi-H on the surface plays a major role in determining the emission color, emission origin, and postsynthetic ligand exchange reaction efficiency [15,16,17,18,19]. The PL intensity and spectral shapes are sensitive to the surface oxidation of ncSi due to a large surface-to-volume ratio. Therefore, the PL properties should depend on the extent of surface oxidation of ncSi-H. Some previous studies have examined the PL emission with different surface configurations [20,21]. Bürkle et al. studied theoretically and experimentally hydroxyl (OH) functionalized Si quantum dots (QDs) with different levels of oxidation [22]. Valenta et al. recently reported that the QY reaches unity at low temperature for ncSi embedded in SiO2 [23]. Guerra et al. investigated the optical properties of Si nanocrystals with different sizes and shapes, passivated with hydrogen, OH groups, or embedded in a SiO2 matrix [24]. V. Švrček et al. reported that surface-engineering of ncSi could enhance the PL properties, primarily due to Si-O termination on the surface [25,26]. Since a hydrogen-terminated Si QD is the fundamental unit for further ligand passivation in optical gain or LED applications where a higher PLQY is desirable, studies on PL of ncSi-H and its effect on oxidation are interesting and necessary.
Previous works on the temperature-dependent PL properties of Si structures mainly involve porous Si, SiO2-embedded ncSi or ncSi in a polymer matrix [27,28,29,30,31]. Comparing the results of previous studies indicates some inconsistencies. One possible reason is the difference in the surroundings (i.e., matrix or shell) may influence the PL properties. However, it is difficult to control the surface configuration in the previous Si systems. In this regard, using a system of freestanding ncSi is a suitable method, because the surface is highly accessible via various chemical modification techniques. For example, the temperature-dependences of the PL properties were compared between freestanding ncSi-H and alkyl-capped ncSi to investigate the manifold increase of PLQY due to hydrosilylation of 1-alkene [32].
In this study, we report the role of surface oxidation of ncSi-H on the PL properties using low-temperature fluorescence spectroscopy. For this purpose, we prepare three samples of ncSi-H with different amounts of amorphous SiOx on their surfaces.

2. Materials and Methods

2.1. Reagents and Materials

Triethoxysilane (TES) was purchased from TCI Chemicals (Tokyo, Japan). Electronic gradehydrofluoric acid (49% aqueous solution) was purchased from Kanto Chemical (Tokyo, Japan). Ethanol was purchased from Wako Chemicals (Tokyo, Japan).

2.2. Preparation of ncSi-H

Samples of ncSi-H were prepared by thermal disproportionationof amorphous hydrogen silsesquioxane at high temperature, as reported in our previous paper [3,10,32]. In a typical synthesis, 5 mL of TES (45 mmol) was added to a round-bottom flask equipped with a magnetic stir bar and stirred in Ar atmosphere using standard Schlenk techniques. 1.59 mL of HCl solution of pH 3 was added drop wise slowly to the flask. Theresultant xerogel was dried in vacuum overnight. Next, the dried powder was placed in a quartz crucible and annealed at 1100 °C for 1 h in 5%/95% H2/Ar atmosphere. The TES derived precursor after thermal disintegration transformed into SiO2-embedded ncSi.We obtained a dark brown powder of SiO2/ncSi. Three hundred milligrams of the powder was mechanically ground in a mortar and pestle to yield fine.Next, the resultant powder was placed in a 50 mL in volume of Teflon containerand slurried in HF (10 mL) and ethanol (20 mL). The mixture was stirred vigorouslyfor 60 min. The powder form of ncSi:H was isolated by centrifugation at 15,000 rpm for 5 min, washed twice with ethanol and dichloromethane followed by separationthrough centrifugation.In this study, we prepared three samples of ncSi-H with different amounts of surface oxide;the first sample was minimally exposed to the ambient condition, and the other two samples were prepared by exposing them in ambient air for 24 h and 48 h, respectively.

2.3. Characterization

X-ray powder diffraction (XRD) pattern was acquired with Rigaku Smart Lab X-ray diffractometer (Rigaku, Tokyo, Japan). The peak ratio of Si-H to O-Si-O was estimated by attenuated total reflectance Fourier transform infrared spectroscopy (ATR-FTIR) measurement (JASCO, Tokyo, Japan). The measurements were carried out in the frequency range of 900–2500 cm−1 using a germanium prism on a JASCO FTIR 4100 spectrometer. PL properties of the samples were measured using their solid forms as powder. PL measurements were performed by a modular double-grating Czerny–Turner monochromator(Horiba, Kyoto, Japan) and an iHR 320 emission monochromator (1200 lines/mmof gratings) coupled to a photodetectoron a NanoLog Horiba JovinYvonspectrofluorometer(Horiba, Kyoto, Japan) with 450W xenon arc lamp. The value of photon power for excitation estimated by a power meter (PD300, Ophir Optronics Solutions Ltd) and NOVA II display was 0.014 mW/cm2 with wavelength 360nm. The spectral resolution of the system was around 0.3 nm.PL QY was measured by standardized integrating-sphere method using a commercial QY measurement system, model C9920-02 (Hamamatsu Photonics Co. Ltd). For temperature-dependent PL measurement, samples were prepared by casting a dichloromethane solution of the ncSi-H over the surface of quartz glass substrate followed by drying for few minutes under vacuum conditions. Then, the samples were placed into an Opticool Stage cryostat connected to GM cooler and controlled by MercuryiTC temperature controller, which allowed tuning the sample temperature in the range from 3 to 300 K.

3. Results

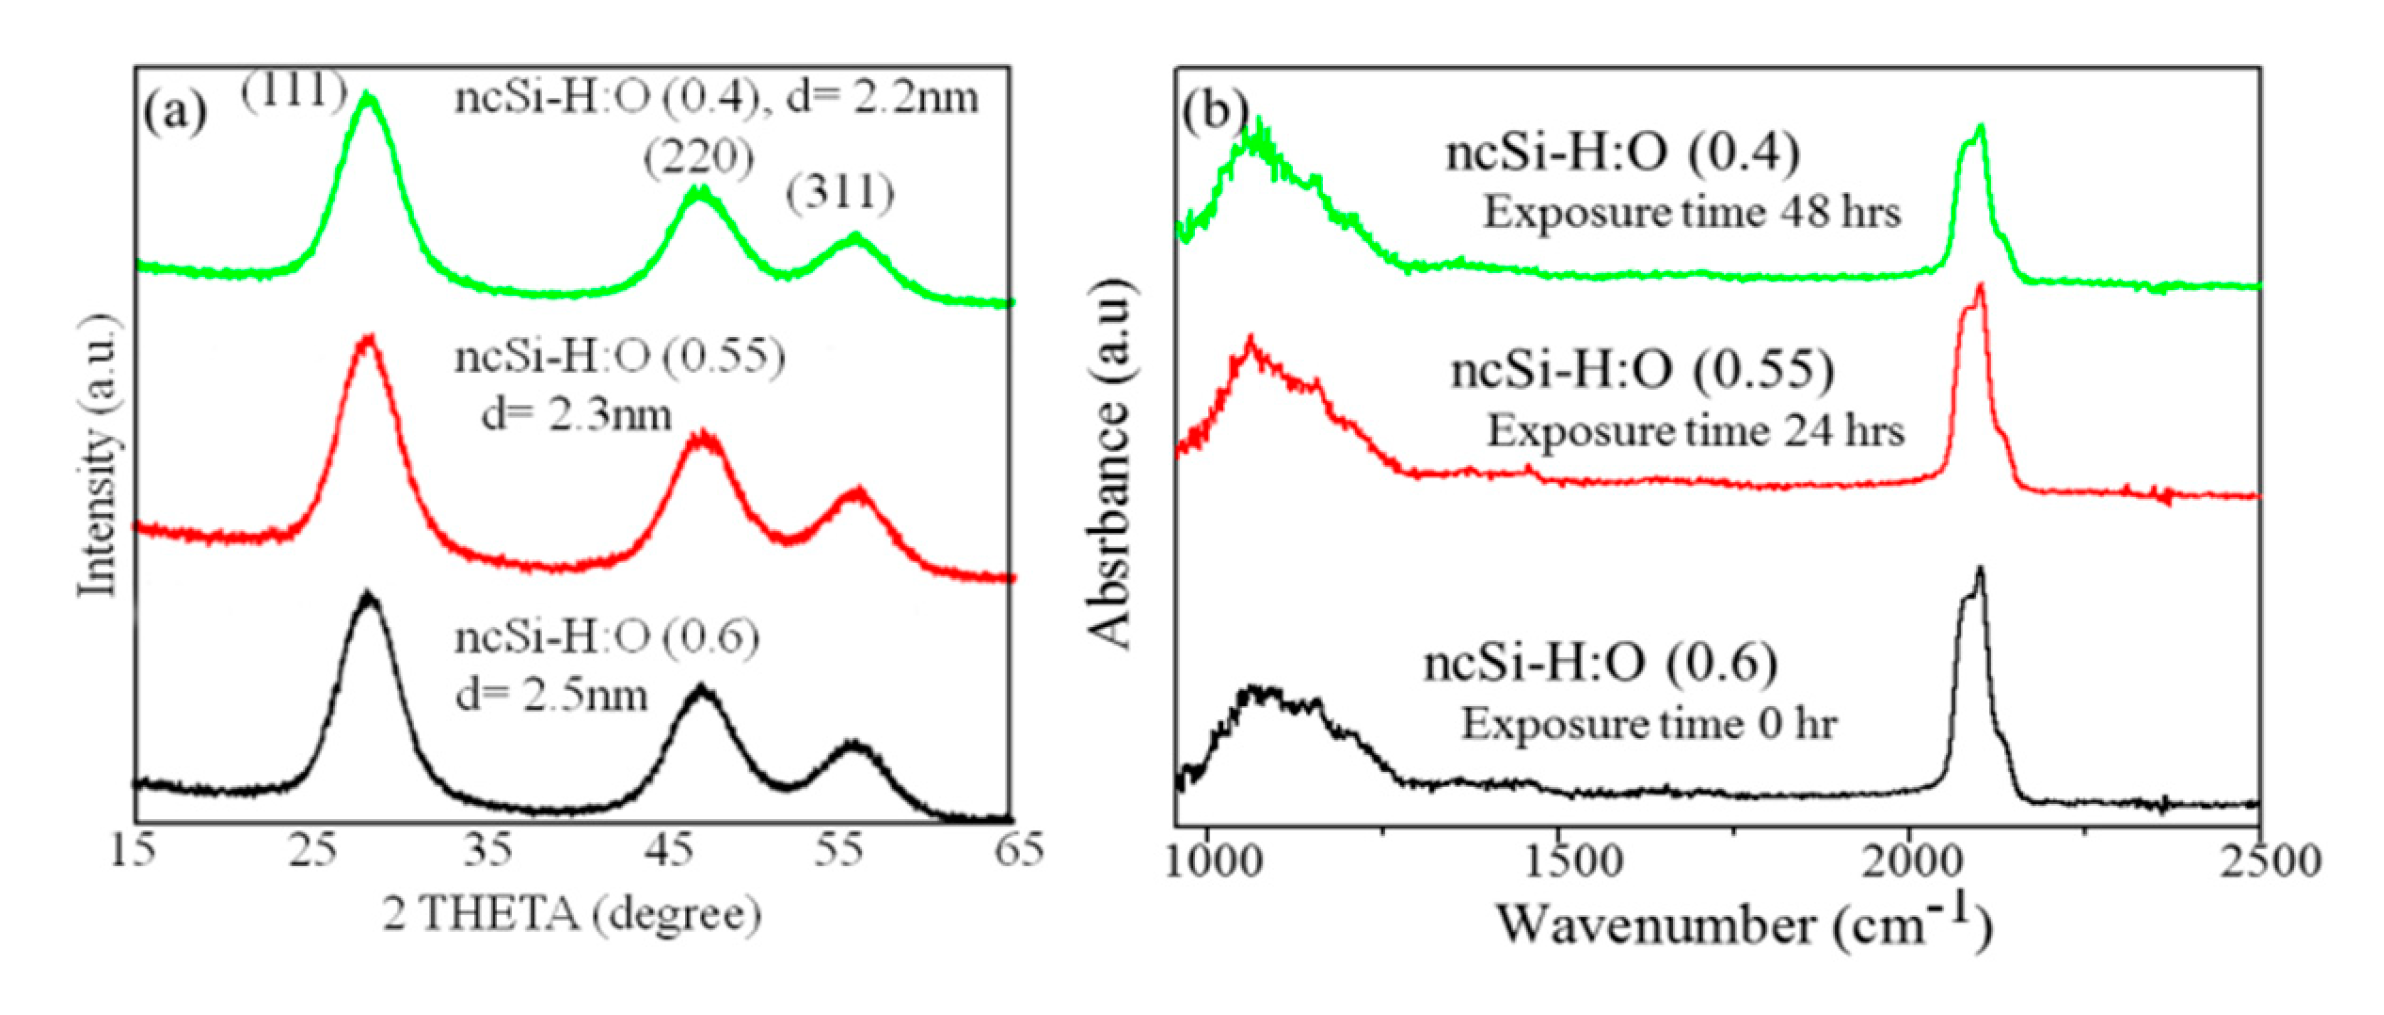
3.1. Analysis of the Surface Configuration

Figure 1a shows the XRD patterns of samples with minimal exposure (~0 h) and exposure (24 h and 48 h) to ambient air. The diffraction peaks at 2θ = 28°, 47°, and 56° are indexed to the (111), (220), and (311) planes of the diamond cubic Si lattice. The diameters of the NCs are estimated by theScherrer equation from the broadening of the diffraction lines. For the minimally exposed sample, the diameter is ~2.5 ± 0.2 nm, which is small enough to confine the photoexcited carriers in ncSi. This result is consistent with previous studies [13,14].
After 24-h or 48-h exposure, the core NC size decreases due to oxidation. As the exposure time increases, theshell of the amorphous SiOx layer grows. The calculated sizes are 2.3 ± 0.3 nm and 2.1 ± 0.2 nm for 24-h and 48-h samples, respectively. The surface configuration of ncSiis verified by ATR-FTIR (Figure 1b). The absorbance peak at 2100 cm−1 is attributed to the Si-H bond. The appearance of Si-O-Si and Si-OR (R = alkyl) vibrations at 1000–1200 cm−1 indicates that all the samples contain partiallyoxidized ncSi-H. As predicted, the peak for the Si-O-Si vibration grows as the exposure time to ambient air increases. For clarification of the difference in the amount of oxidized Si between the samples, we calculated the ratio of the spectral area peak at 2100 cm−1 to the spectral area peaking in the 1000–1200 cm−1 range. The peak ratio in the as-synthesized sample is 0.6, whereas the exposure to ambient air for 24 h and 48 h enhances the oxidation and changes the stoichiometry of the shell oxide layer of ncSi, resulting in higher ratios of 0.55 and 0.4, respectively. Hereafter, these samples are assigned by the ratios in the bracket, namely, ncSi-H:O (0.6), ncSi-H:O (0.55), and ncSi-H:O (0.4), which are minimally exposed to the ambient condition; the other two samplesare prepared by exposing them in ambient air for 24 h and 48 h, respectively.

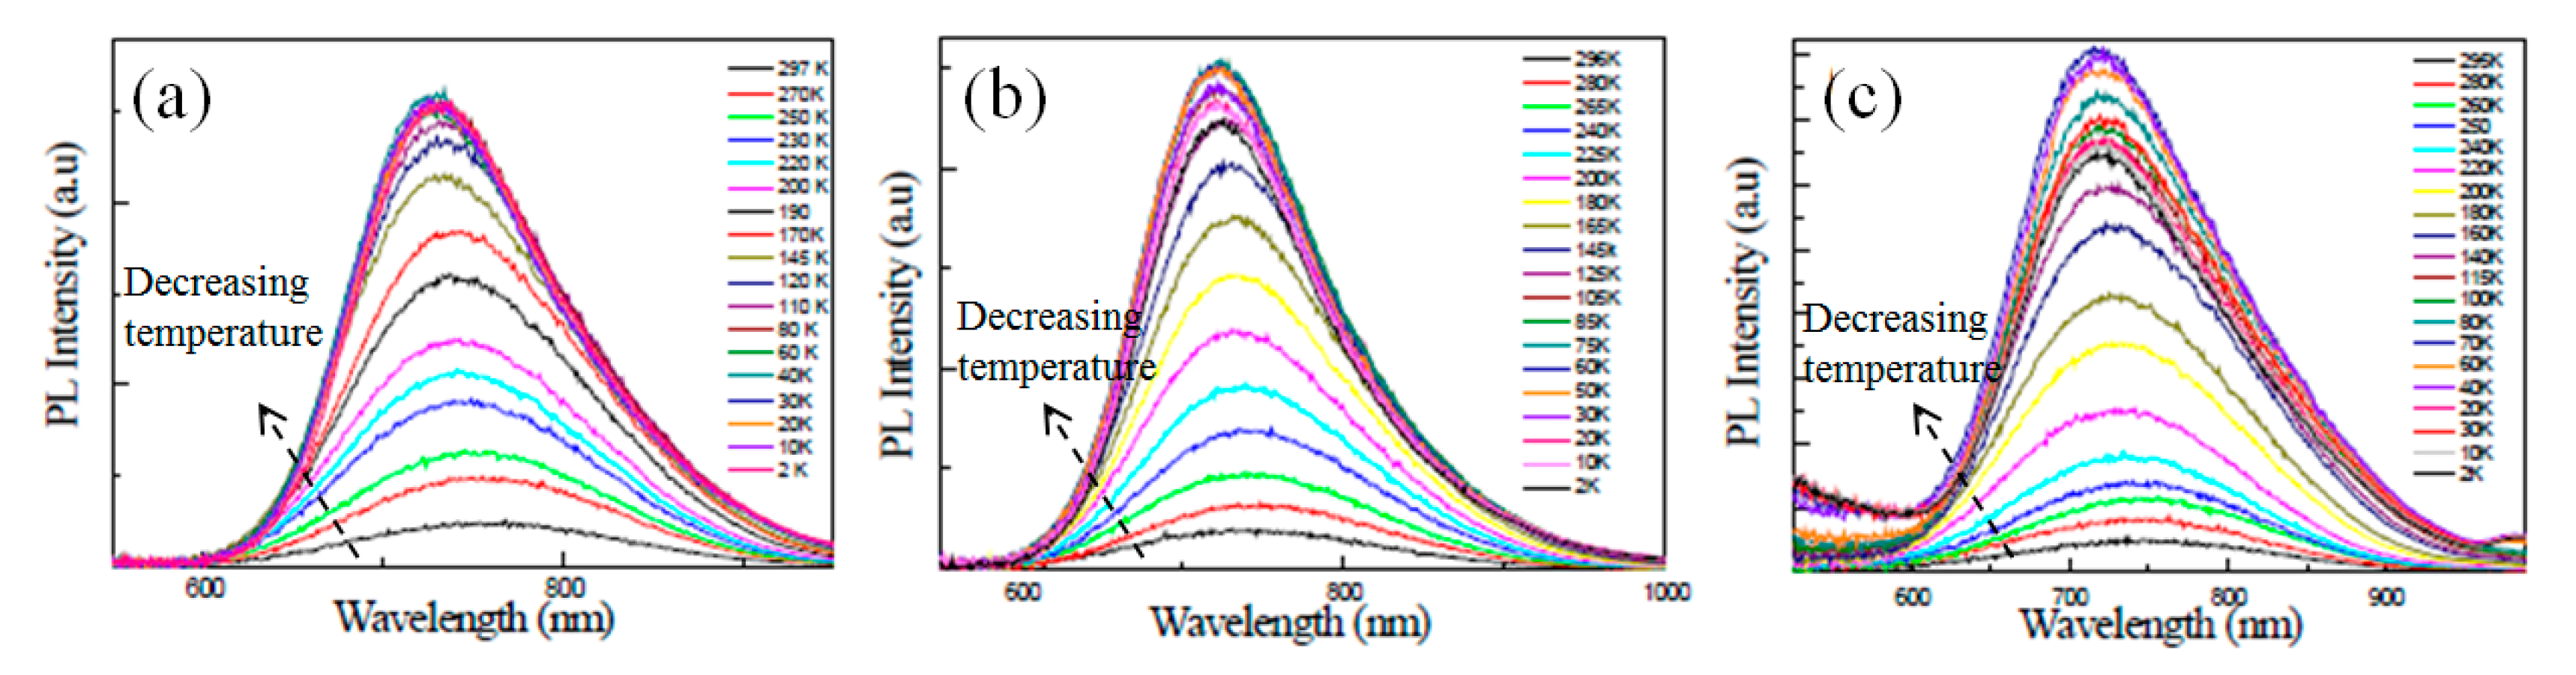
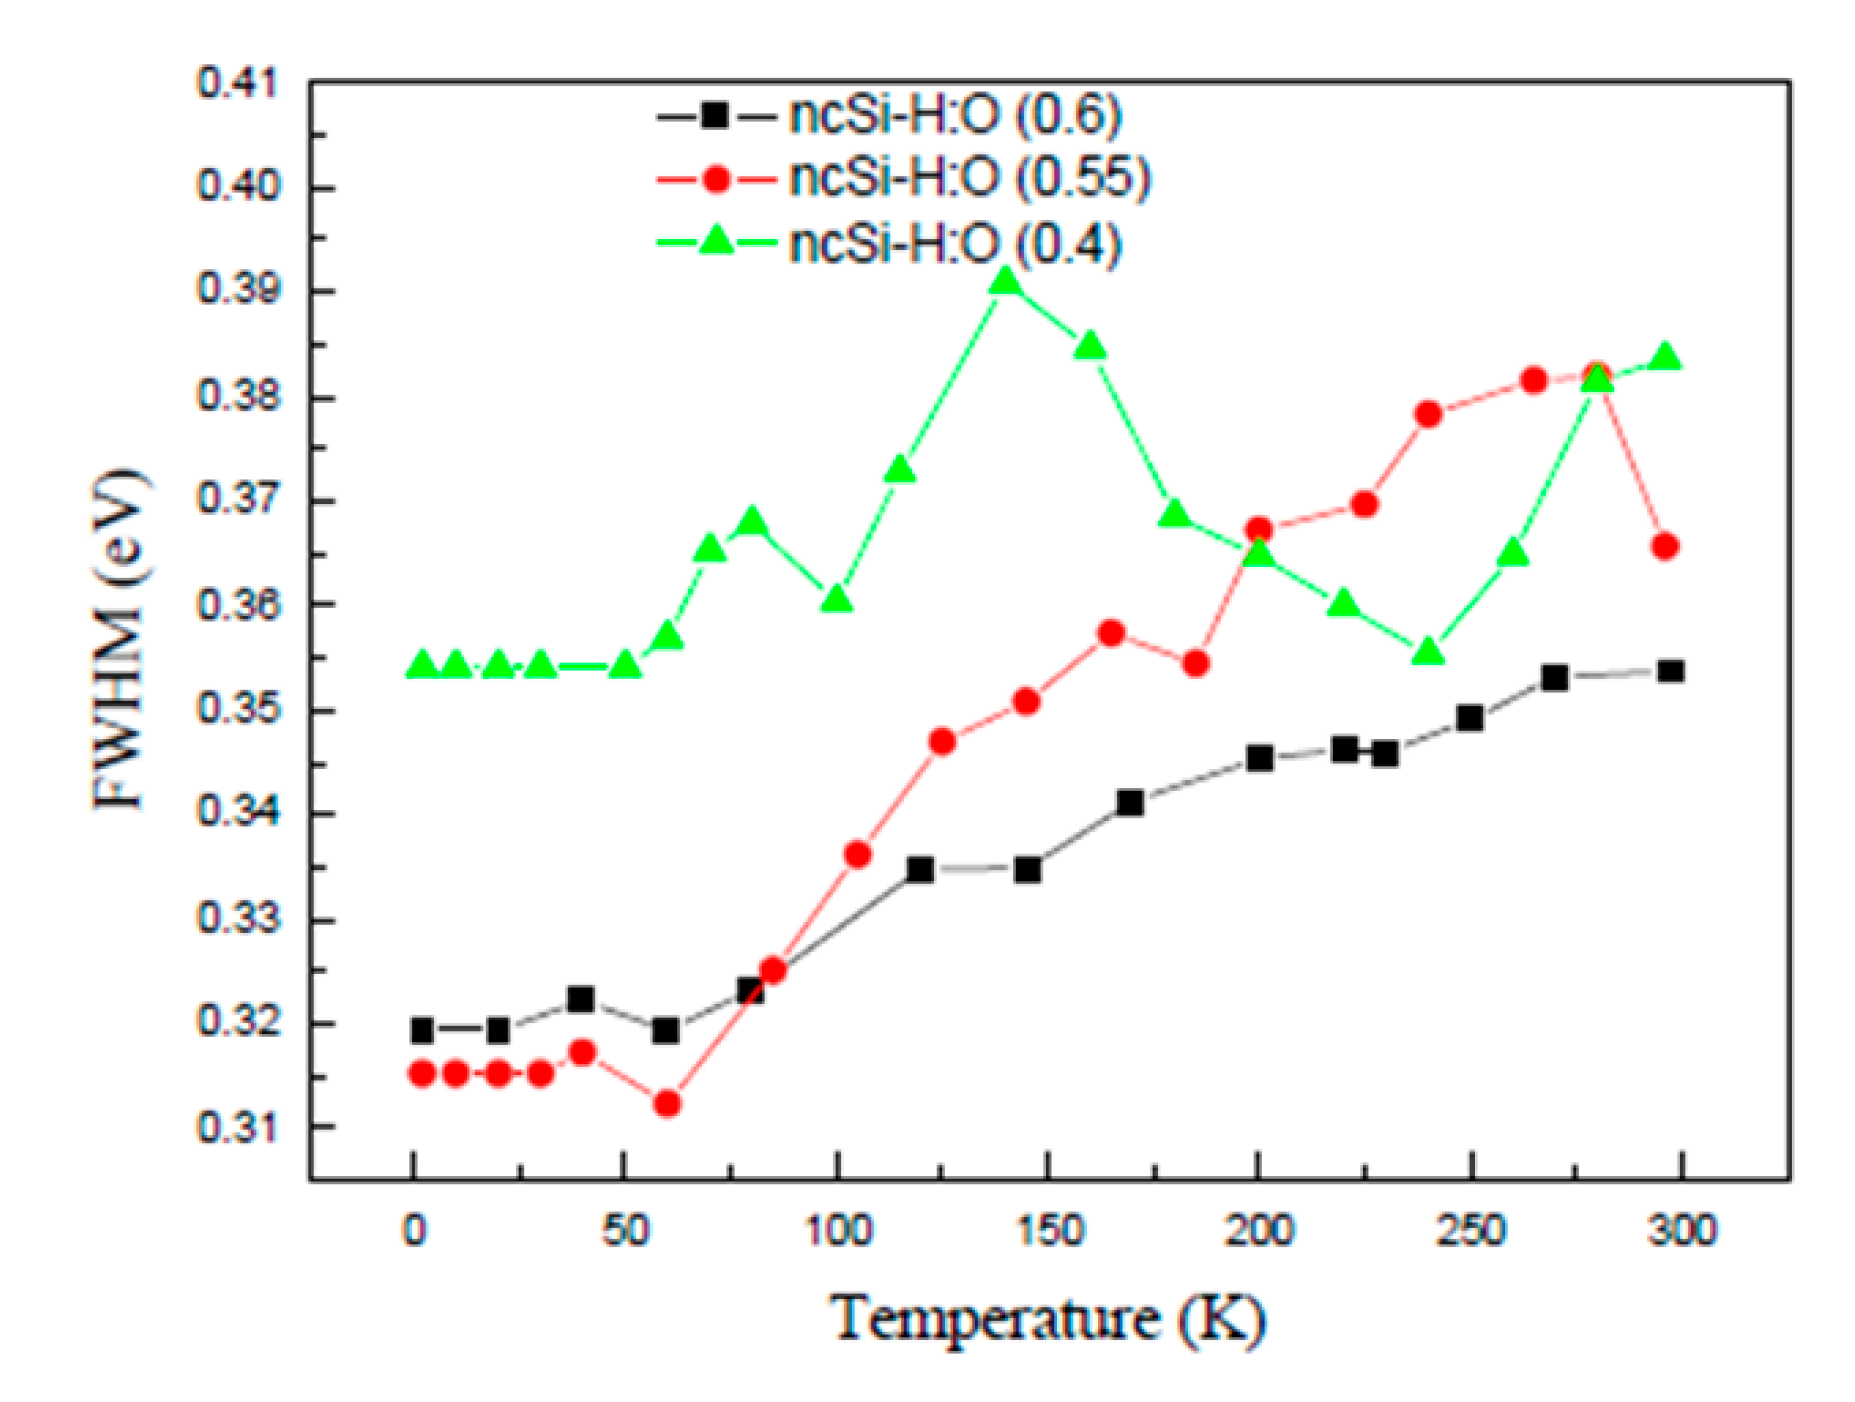
3.2. Temperature Dependence of the PL Intensity

Figure 2 shows the temperaturedependences of the PL spectra for ncSi-H:O (0.6), ncSi-H:O (0.55), and ncSi-H:O (0.4). In Panel (a), the PL spectrum of ncSi-H:O (0.6) is centered at 760 nm, and its full width half maximum (FWHM) is 180 nm at 297 K. The peak PL quantum yield (QY) is about 1.4% when excited with 360-nm light.
The relationship between ncSi-H size and the PL peak wavelength is consistent with those previously reported [13,14]. A 16-nm reduction of PL FWHM is observed at 4 K. By exposure to air for 24 h, the room-temperature PL spectrum is blue-shifted slightly, as shown in Panel (b). A further blue spectral shift is observed for the sample exposed to air for 48 h. As shown in Panel (c), the PL peak of ncSi-H:O (0.4) is positioned at 750 nm. The observation of such a spectral shift suggests that oxidation reduces the size of core Si, leading to an increase in the fundamental energy gap based on the quantum confinement effect [15]. Comparing the spectra between the samples, as the temperature decreases from 297 K to 4 K, the PL intensity continues to grow for all samples.
Figure 3 plots the PL intensity at each temperature normalized with respect to the value at 297 K. The normalized values of the PL intensity increase as the temperature decreases in the 90–297 K range. Below 90 K, the samples exhibit different temperature-dependent behaviors for the PL intensity. For ncSi-H:O (0.6), the increasing trend shows a small increment, suggesting the PL intensity is saturated along with a successive blue-shift of the PL peak position until the lowest temperature (~4 K). This is consistent with the trend reported previously [33]. However, two other samples exhibit a different temperature-dependence of the PL intensity. In the 50–90 K range, we see the temperature-dependent behavior of the normalized intensity that is similar to the case of ncSi-H:O (0.6), and below 50 K, both ncSi-H:O (0.55) and ncSi-H:O (0.4) exhibit decreasing trends as the temperature decreases. For ncSi-H:O (0.6), the PL intensity at 4 K is eleven-times higher than that at 297K.
Such a dramatic increase in the PL intensity is attributed to the presence of nonradiative channels in NCs [32,33]. Two types of nonradiative processes typically diminish the PL intensity: (1) carrier trapping at surface defects and (2) phonon-assisted thermal escape of excitons from NCs. As the temperature increases, NCs receive activation energy for carrier trapping and more phonon energy to activate the nonradiative processes. During the emission, nonradiative and radiative processes compete. Next, as the temperature decreases, the contributions of nonradiative recombination are weakened, while those of radiative recombination contribution are strengthened [30]. The interface between the oxidized layer and ncSi is believed to work as a nonradiativechannel. Due to the oxidized interface working as a quencher of PL by trapping photoexcited carriers [32,33,34,35], we see normalized values of PL intensity of ncSi-H:O (0.55), which are higher than those of ncSi-H:O (0.6). As predicted, this behavior is enhanced as the amount of oxide increases, as evidenced in the behavior of ncSi-H:O (0.4).
The decreasing behaviors of the PL intensity below 50 K observed for ncSi-H:O (0.55) and ncSi-H:O (0.4) are similar to those of other nanostructures such as the Si/SiO2 core-shell [26,28] and porous Si [27]. Similar behavior was reported for the freestanding ncSi-H:O, suggesting that the surface Si might be oxidized highly as supported by a drastic decreasing trend of PL intensity with increasing temperature [32]. The threshold temperature after which the PL intensity decreased was around 30 K, which was little bit lower than the present report, likely due to the difference in oxidation level.
For clarification, several mechanisms have been proposed. Nakajima et al. explained this decrease as a result of tunneling escape, whereas Kovalev et al. reported the saturation of PL [36]. Boer et al. proposed a self-trapped exciton model to explain this phenomenon [37]. Rinnert et al. reported that this phenomenon appears due to saturation [28]. For ncSi-H:O (0.6), there is no decrement in the PL intensity (Figure 3, black curve). The PL intensity decrement becomes more prominent as the oxidation is enhanced, suggesting that a decrease in the PL intensity below 50 K may not be the result of an artificial or saturation effect. Instead, a possible mechanism of PL observed from ncSi-H:O (0.55) and ncSi-H:O (0.4) may involve band edge recombination along with defect state related to radiative recombination. Wen et al. reported such a decrement around 150 K, which is much higher than this experiment. They used silicon embedded with silicon dioxide. We think that the threshold value is high due to this oxide matrix. In our experiment, a silicon quantum dot is liberated and the oxide layer is much smaller than that in Wen’s report [26]. The possible reason is that an exciton from the defect state can return to the ground state by emitting a photon by thermally induced tunneling. As the temperature decreases, the probability for escape of the exciton from the defect state to the emitting state is lessened. In the lower temperature range, it is possible that not all trapped excitons return to the emitting state within the time scale, as evidenced by the PL decay lifetime on the order of the microsecond range [32]. An exciton living longer in adefect state increases the probability of recombining through another channel than radiative PL recombination. This process decreases the PL intensity to a lower temperature than the thermal activation energy for an exciton to leave the defect state for an emitting state, and 50 K is low enough to cause this process. Furthermore, this process is more enhanced for ncSi-H:O (0.4) than forncSi-H:O (0.55) due to the larger amount of defect states at the interface between ncSi and oxide (Figure 3).
Figure 4 shows the change in PL FWHM as a function of temperature for the samples. Clearly, the PL spectra become narrow as temperature decreases. Besides the fluctuation, depending on the size and the shape due to exciton scattering with acoustic and optical phonon, the line width of PL broadens. At a low temperature due to fewer phonons interacting with excitons, the PL spectra become narrow for each sample.

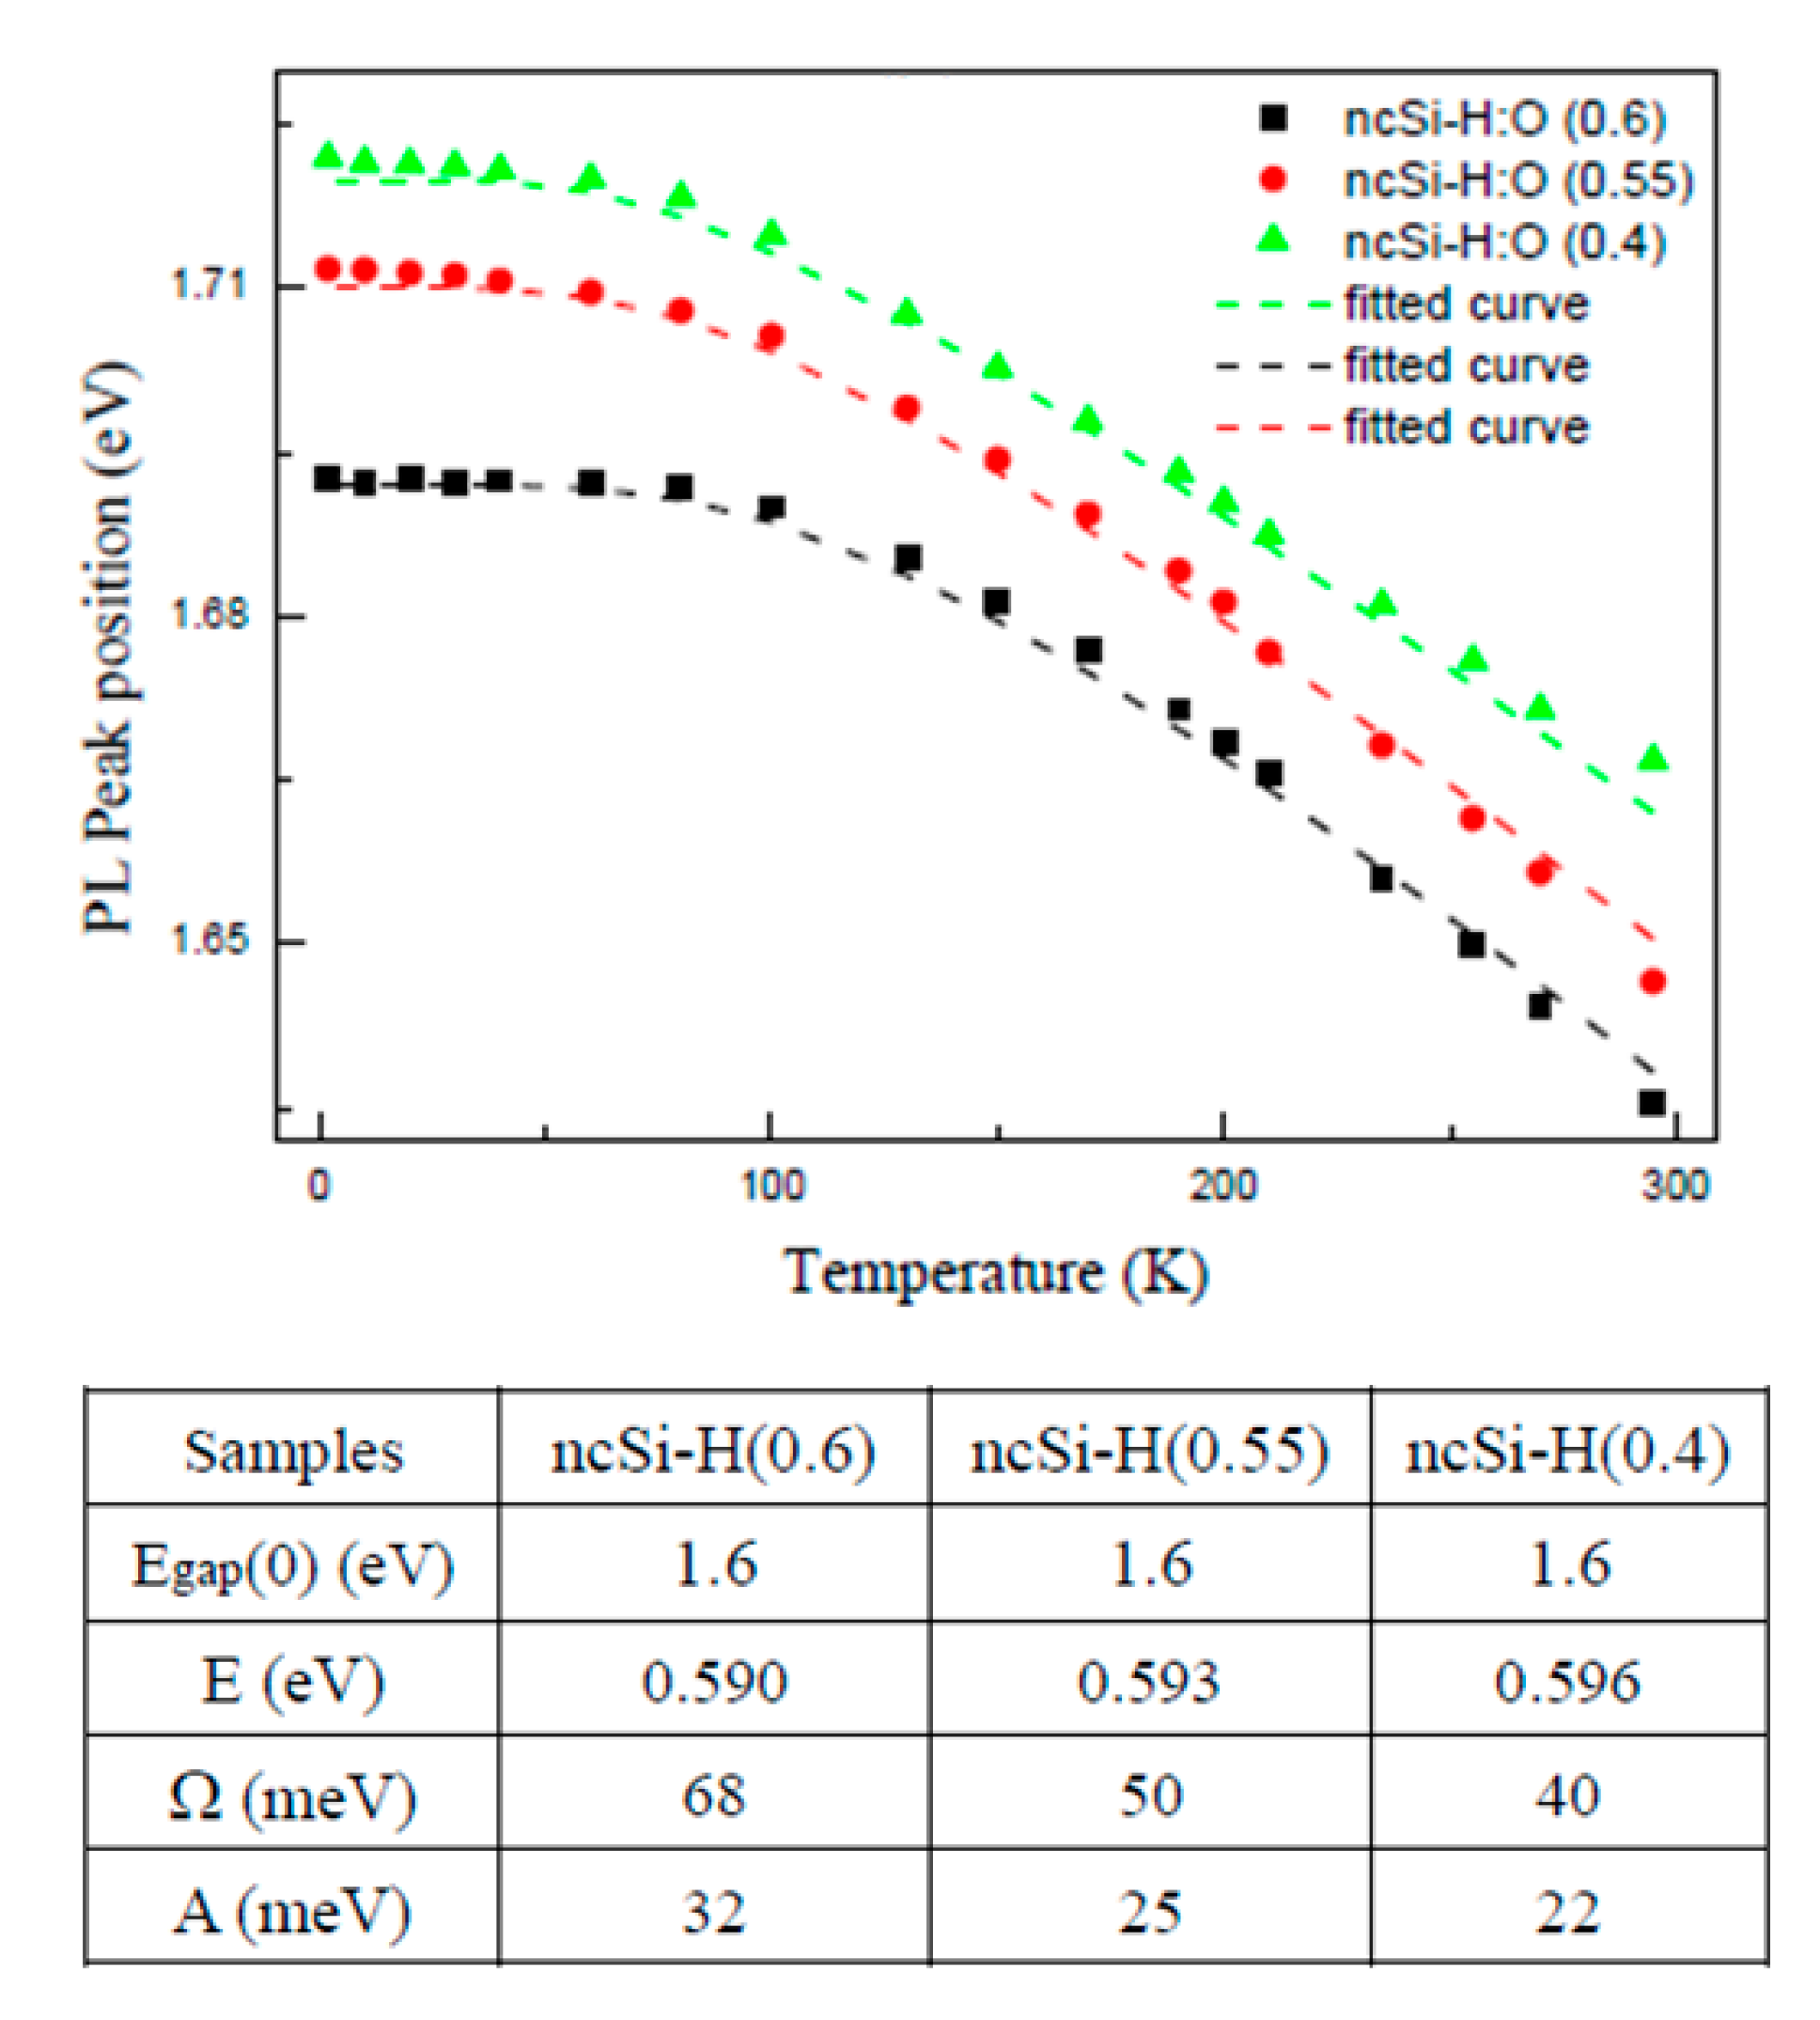
3.3. Temperature Dependence of the PL Energy

Figure 5 plots the PL peak energy as a function of temperature for the samples. As the temperature decreases, the PL peak energy increases. This implies that the fundamental energy gap for emission increases with a lower temperature. Possible mechanisms for the change in the energy gap are shrinking of the crystalline lattice, strained crystalline lattice, and electron–phonon interaction [29,32]. The temperature coefficient of the energy gap, dE/dT, is expressed as
dE/dT= dE/dT (lattice expansion) + dE/dT (electron–phonon coupling)
A change in the bandgap dE/dT of NCs due to the thermal expansion of crystalline lattice depends on the lattice parameter “a”. The relation can be written as (∂E/∂T)a = (∂E/∂a) (∂a/∂T). However, due to the small magnitude of (∂E/∂a), the influence of lattice expansion on (∂E/∂T)a is small. As a result, the electron–phonon coupling strongly influences the reduction in the energy gap with temperature. The value of dE/dT for NCs is larger than that for bulk Si. Due to a strong spatial confinement in NCs, the electron–phonon interaction becomes strong [27,37,38].The strong coupling leads to a change in the energy gap as the temperature decreases.
In general, the temperature dependence of the bulk bandgap is reproduced by Varshini’s equation [39]. The experimental plots are fitted with the equation using adjusted R2 values greater than 0.96 over the whole experimental temperature range for the three samples (Figure S1, Supporting Information). These observations are consistent with the literature [28,32], implying that the changes in the PL peak energy as a function of temperature even for heavily oxidized ncSi are reproduced by Varshni’s equation. We tried using the phenomenological expression proposed by Cardona et al. [40] for further insight into the underlying photophysics about the temperature-dependent PL peak energy. The expression contains the phonon energy and the Bose Einstein statistical factor
E ( T ) = E   g a p ( 0 ) + E   ( c o n f i n e m e n t ) A ( 2 e x p Ω k T 1 + 1 )
where Ω is related to the average phonon energy, A is a temperature independent constant, and k is the Boltzmann constant. E gap(0) is the energy gap value at zero Kelvin. E is the confinement energy due to size of ncSi below the bulk Bohr radius. For each experimental plot, the estimated fitting parameters of the R2 values are greater than 0.99, which are a good fit with Equation (2).
Figure 5 tabulates the three fitted parameters of E, A, and Ω. From the values of the average phonon energy, the phonon energy decreases with exposure time to ambient air. The highest value of Ω (0.068 eV) is obtained for ncSi-H:O (0.6). As the exposure time to air increases, the value of Ω decreases. Since the value of Ω corresponds to the phonon frequency, it is consistent to see a decreasing trend of phononfrequency with an enhanced oxidation that leads to decrease in the size of ncSi [33]. As predicted, the confinement energy, E, also increases as the size decreases based on the confinement effect of excitons.

4. Conclusions

We investigated the temperature-dependent PL spectral properties of freestanding ncSi-H as a function of the surface oxidation level. ncSi-H samples were oxidizedby exposure to ambient air for 0 h, 24 h, or 48 h. According to the PL spectroscopic measurements, the PL intensity of the lesser-oxidized sample (i.e., ncSi-H:O (0.6)) increases as the temperature is reduced, and becomes nearly saturated over the entire range from 90 K to 4 K. In contrast, the PL intensity plots for the heavily oxidized sample show a decreasing curve below 50 K. Thisdramatic difference in the temperature dependence of the PL intensity suggests that a possible origin of PL observed below 90 K is a defect state related to the emission from surface oxidation of ncSi-H instead of saturation or an artifact, as previously reported. We confirm that oxide-related PL appears from ncSi-H with an oxidized surface similar to the oxidation level in ncSi-H:O (0.55). For all samples, the PL peak positions shift to the lower wavelength side as the temperature decreases. According to the curve fitting, the average phonon energy value decreases and the confinement energy increases as the amount of surface oxide (i.e., amorphous SiOx) or the stoichiometric ratio of Si and O in the shell increases. This supports that the oxide interface plays an important role in phonon generation, because surface Si is oxidized in ambient air, which slightly decreases the Si core.

Supplementary Materials

The following are available online at https://www.mdpi.com/2073-4352/10/3/143/s1, Figure S1: Temperature dependencies of the PL peak position for three samples of ncSi-H:O listed in the legend. The dotted line shows the Varshni fit of the experimental data. The accuracy for fitting is evaluated by R2.

Author Contributions

B.G. and N.S. designed research, B.G. performed research, and B.G. and N.S. wrote the paper. All authors have read and agreed to the published version of the manuscript.

Funding

A-step (JPMJTS1619) from Japan Science and Technology Agency and the Izumi Science and Technology Foundation (2018-J-053), Kakenhi (19K22176). B.G. thanks the JSPS international fellowship program for research in Japan (L18530).

Conflicts of Interest

The authors declare no conflict of interest.

References

  1. Chandra, S.; Ghosh, B.; Beaune, G.; Nagarajan, U.; Yasui, T.; Nakamura, J.; Tsuruoka, T.; Baba, Y.; Shirahata, N.; Winnik, F.M. Functional Double-Shelled Silicon Nanocrystals for Two-Photon Fluorescence Cell Imaging: Spectral Evolution and Tuning. Nanoscale 2016, 8, 9009. [Google Scholar] [CrossRef] [PubMed]
  2. Maier-Flaig, F.; Rinck, J.; Stephan, M.; Bocksrocker, T.; Bruns, M.; Kübel, C.; Powell, A.K.; Ozin, G.A.; Lemmer, U. Multicolor Silicon Light-Emitting Diodes (SiLEDs). Nano Lett. 2013, 13, 475. [Google Scholar] [CrossRef] [PubMed]
  3. Ghosh, B.; Masuda, Y.; Wakayama, Y.; Imanaka, Y.; Inoue, J.I.; Hashi, K.; Deguchi, K.; Yamada, H.; Sakka, Y.; Ohki, S. Hybrid White Light Emitting Diode Based on Silicon Nanocrystals. Adv. Funct. Mater. 2014, 24, 7151. [Google Scholar] [CrossRef]
  4. Liu, X.; Zhao, S.; Gu, W.; Zhang, Y.; Qiao, X.; Ni, Z.; Pi, X.; Yang, D. Light-Emitting Diodes Based on Colloidal Silicon Quantum Dots with Octyl and Phenylpropyl Ligands. ACS Appl. Mater. Interfaces 2018, 10, 5959. [Google Scholar] [CrossRef] [PubMed]
  5. Cheng, K.-Y.; Anthony, R.; Kortshagen, U.R.; Holmes, R.J. High-Efficiency Silicon Nanocrystal Light-Emitting Devices. Nano Lett. 2011, 11, 1952. [Google Scholar] [CrossRef] [PubMed]
  6. Puzzo, D.P.; Henderson, E.J.; Helander, M.G.; Wang, Z.; Ozin, G.A.; Lu, Z. Visible Colloidal Nanocrystal Silicon Light-Emitting Diode. Nano Lett. 2011, 11, 1585. [Google Scholar] [CrossRef]
  7. Ghosh, B.; Yamada, H.; Chinnathambi, S.; Özbilgin, İ.N.G.; Shirahata, N. Inverted Device Architecture for Enhanced Performance of Flexible Silicon Quantum Dot Light-Emitting Diode. J. Phys. Chem. Lett. 2018, 9, 5400–5407. [Google Scholar] [CrossRef]
  8. Erogbogbo, F.; Chang, C.-W.; May, J.L.; Liu, L.; Kumar, R.; Law, W.-C.; Ding, H.; Yong, K.T.; Roy, I.; Sheshadri, M. Bioconjugation of luminescent silicon quantum dots to gadolinium ions for bioimaging applications. Nanoscale 2012, 4, 5483–5489. [Google Scholar] [CrossRef]
  9. Montalti, M.; Cantelli, A.; Battistelli, G. Nanodiamonds and silicon quantum dots: Ultrastable and biocompatible luminescent nanoprobes for long-term bioimaging. Chem. Soc. Rev. 2015, 44, 4853–4921. [Google Scholar] [CrossRef]
  10. Ghosh, B.; Hamaoka, T.; Nemoto, Y.; Takeguchi, M.; Shirahata, N. Impact of Anchoring Monolayers on the Enhancement of Radiative Recombination in Light-Emitting Diodes Based on Silicon Nanocrystals. J. Phys. Chem. C 2018, 122, 6422. [Google Scholar] [CrossRef]
  11. Hessel, C.M.; Reid, D.; Panthani, M.G.; Rasch, M.R.; Goodfellow, B.W.; Wei, J.; Fujii, H.; Akhavan, V.; Korgel, B.A. Synthesis of Ligand-Stabilized Silicon Nanocrystals with Size-Dependent Photoluminescence Spanning Visible to Near-Infrared Wavelengths. Chem. Mater. 2012, 24, 393. [Google Scholar] [CrossRef]
  12. Jurbergs, D.; Rogojina, E.; Mangolini, L.; Kortshagen, U. Silicon nanocrystals with ensemble quantum yields exceeding 60%. Appl. Phys. Lett. 2006, 88, 233116. [Google Scholar] [CrossRef]
  13. Henderson, E.J.; Kelly, J.A.; Veinot, J.G.C. Influence of HSiO1.5 Sol–Gel Polymer Structure and Composition on the Size and Luminescent Properties of Silicon Nanocrystals. Chem. Mater. 2009, 21, 5426–5434. [Google Scholar]
  14. Veinot, J.G.C. Synthesis, surface functionalization, and properties of freestanding silicon nanocrystals. Chem. Commun. 2006, 4160–4168. [Google Scholar] [CrossRef]
  15. Pi, X.D.; Mangolini, L.; Campbell, S.A.; Kortshagen, U. Room-temperature atmospheric oxidation of Si nanocrystals after HF etching. Phys. Rev. B 2007, 75, 85423. [Google Scholar] [CrossRef]
  16. Mastronardi, M.L.; Henderson, E.J.; Puzzo, D.P.; Chang, Y.; Wang, Z.B.; Helander, M.G.; Jeong, J.; Kherani, N.P.; Lu, Z.; Ozin, G.A. Silicon Nanocrystal Oleds: Effect of Organic Capping Group on Performance. Small 2012, 8, 3647. [Google Scholar] [CrossRef]
  17. Puzder, A.; Williamson, A.J.; Grossman, J.C.; Galli, G. Surface Chemistry of Silicon Nanoclusters. Phys. Rev. Lett. 2002, 88, 97401. [Google Scholar] [CrossRef] [Green Version]
  18. Takeoka, S.; Fujii, M.; Hayashi, S. Size-dependent photoluminescence from surface-oxidized Si nanocrystals in a weak confinement regime. Phys. Rev. B 2000, 62, 16820–16825. [Google Scholar] [CrossRef]
  19. Shirahata, N.; Hirakawa, D.; Sakka, Y. Interfacial-related color tuning of colloidal Si nanocrystals. Green Chem. 2010, 12, 2139–2141. [Google Scholar] [CrossRef]
  20. Mitra, S.; Švrček, V.; Macias-Montero, M.; Velusamy, T.; Mariotti, D. Temperature-dependent photoluminescence of surface-engineered silicon nanocrystals. Sci. Rep. 2016, 6, 27727. [Google Scholar] [CrossRef] [Green Version]
  21. Švrček, V.; Pelant, I.; Rehspringer, J.-L.; Gilliot, P.; Ohlmann, D.; Crégut, O.; Hönerlage, B.; Chvojka, T.; Valenta, J.; Dian, J. Photoluminescence properties of sol–gel derived SiO2 layers doped with porous silicon. Mater. Sci. Eng. C 2002, 19, 233–236. [Google Scholar] [CrossRef]
  22. Bürkle, M.; Lozac’h, M.; McDonald, C.; Mariotti, D.; Matsubara, K.; Švrček, V. Bandgap Engineering in OH-Functionalized Silicon Nanocrystals: Interplay between Surface Functionalization and Quantum Confinement. Adv. Funct. Mater. 2017, 27, 1701898. [Google Scholar] [CrossRef] [Green Version]
  23. Valenta, J.; Greben, M.; Dyakov, S.A.; Gippius, N.A.; Hiller, D.; Gutsch, S.; Zacharias, M. Nearly perfect near-infrared luminescence efficiency of Si nanocrystals: A comprehensive quantum yield study employing the Purcell effect. Sci. Rep. 2019, 9, 1–9. [Google Scholar] [CrossRef] [PubMed]
  24. Guerra, R.; Degoli, E.; Ossicini, S. Size, oxidation, and strain in small Si/SiO 2 nanocrystals. Phys. Rev. B 2009, 80, 155332. [Google Scholar] [CrossRef] [Green Version]
  25. Svrcek, V.; Dohnalova, K.; Mariotti, D.; Trinh, M.T.; Limpens, R.; Mitra, S.; Gregorkiewicz, T.; Matsubara, K.; Kondo, M. Dramatic Enhancement of Photoluminescence Quantum Yields for Surface-Engineered Si Nanocrystals within the Solar Spectrum. Adv. Funct. Mater. 2013, 23, 6051–6058. [Google Scholar] [CrossRef]
  26. Wen, X.; Van Dao, L.; Hannaford, P. Temperature dependence of photoluminescence in silicon quantum dots. J. Phys. D Appl. Phys. 2007, 40, 3573. [Google Scholar] [CrossRef]
  27. Suemoto, T.; Tanaka, K.; Nakajima, A. Interpretation of the temperature dependence of the luminescence intensity, lifetime, and decay profiles in porous Si. Phys. Rev. B 1994, 49, 11005–11009. [Google Scholar] [CrossRef]
  28. Rinnert, H.; Jambois, O.; Vergnat, M. Photoluminescence properties of size-controlled silicon nanocrystals at low temperatures. J. Appl. Phys. 2009, 106, 23501. [Google Scholar] [CrossRef]
  29. Van Sickle, A.R.; Miller, J.B.; Moore, C.; Anthony, R.J.; Kortshagen, U.R.; Hobbie, E.K. Temperature dependent photoluminescence of size-purified silicon nanocrystals. ACS Appl. Mater. Interfaces 2013, 5, 4233–4238. [Google Scholar] [CrossRef]
  30. Alex, V.; Finkbeiner, S.; Weber, J. Temperature dependence of the indirect energy gap in crystalline silicon. J. Appl. Phys. 1996, 79, 6943–6946. [Google Scholar] [CrossRef]
  31. Gupta, A.; Wiggers, H. Freestanding silicon quantum dots: Origin of red and blue luminescence. Nanotechnology 2010, 22, 55707. [Google Scholar] [CrossRef] [PubMed]
  32. Ghosh, B.; Takeguchi, M.; Nakamura, J.; Nemoto, Y.; Hamaoka, T.; Chandra, S.; Shirahata, N. Origin of the photoluminescence quantum yields enhanced by alkane-termination of freestanding silicon nanocrystals: Temperature-dependence of optical properties. Sci. Rep. 2016, 6, 36951. [Google Scholar] [CrossRef] [PubMed] [Green Version]
  33. Hartel, A.M.; Gutsch, S.; Hiller, D.; Zacharias, M. Fundamental temperature-dependent properties of the Si nanocrystal band gap. Phys. Rev. B 2012, 85, 165306. [Google Scholar] [CrossRef]
  34. Ghosh, B.; Shirahata, N. Colloidal silicon quantum dots: Synthesis and luminescence tuning from the near-UV to the near-IR range. Sci. Technol. Adv. Mater. 2014, 15, 014207. [Google Scholar] [CrossRef] [PubMed]
  35. Harris, C.I.; Syväjärvi, M.; Bergman, J.P.; Kordina, O.; Henry, A.; Monemar, B.; Janzén, E. Time-resolved decay of the blue emission in porous silicon. Appl. Phys. Lett. 1994, 65, 2451. [Google Scholar] [CrossRef]
  36. Kovalev, D.; Heckler, H.; Polisski, G.; Koch, F. Optical properties of Si nanocrystals. Phys. Stat. Sol. 1999, 215, 871–932. [Google Scholar] [CrossRef]
  37. De Boer, W.; Timmerman, D.; Gregorkiewicz, T.; Zhang, H.; Buma, W.J.; Poddubny, A.N.; Prokofiev, A.A.; Yassievich, I.N. Self-trapped exciton state in Si nanocrystals revealed by induced absorption. Phys. Rev. B 2012, 85, 161409. [Google Scholar] [CrossRef] [Green Version]
  38. Prezhdo, O.V. Multiple excitons and the electron–phonon bottleneck in semiconductor quantum dots: An ab initio perspective. Chem. Phys. Lett. 2008, 460, 1–9. [Google Scholar] [CrossRef]
  39. Varshni, Y.P. Temperature dependence of the energy gap in semiconductors. Physica 1967, 34, 149–154. [Google Scholar] [CrossRef]
  40. Viña, L.; Logothetidis, S.; Cardona, M. Temperature dependence of the dielectric function of germanium. Phys. Rev. B 1984, 30, 1979–1991. [Google Scholar] [CrossRef]
Figure 1. (a) XRD patterns and (b) attenuated total reflectance Fourier transform infrared spectroscopy (ATR-FTIR) spectra of the ncSi-H:O samples.
Crystals 10 00143 g001
Figure 2. Spectra of (a) ncSi-H:O (0.6) (b) ncSi-H:O (0.55), and (c) ncSi-H:O (0.4), with decreasing temperature from 300K to 4K. Temperature of the corresponding emission is shown in the legends.
Crystals 10 00143 g002
Figure 3. Integrated photoluminescence (PL) intensity of ncSi-H:O (0.6), ncSi-H:O (0.55), and ncSi-H:O (0.4), as a function of temperature. All the values of PL intensity were normalized to the values recorded at room temperature.
Crystals 10 00143 g003
Figure 4. Plots of full-width at half maxima (FWHM) of PL for ncSi-H:O (0.6), ncSi-H:O (0.55) and ncSi-H:O (0.4), as a function of temperature.
Crystals 10 00143 g004
Figure 5. Plots of PL peak energy for ncSi-H:O (0.6), ncSi-H:O (0.55), and ncSi-H:O (0.4). Dotted lines are the fitting results according to Equation (2). Fitting parameters (E, Ω, and A) are tabulated.
Crystals 10 00143 g005

