Article

Manufacturing of Ti-6%Al and Ti-6%Al-4%V Alloys and Their Corrosion in Sodium Chloride Solutions

by
Hany S. Abdo
1,2,
El-Sayed M. Sherif
1,3,* and
Hamed A. El-Serehy
4
1
Center of Excellence for Research in Engineering Materials (CEREM), King Saud University, P.O. Box 800, Al-Riyadh 11421, Saudi Arabia
2
Mechanical Design and Materials Department, Faculty of Energy Engineering, Aswan University, Aswan 81521, Egypt
3
Electrochemistry and Corrosion Laboratory, Department of Physical Chemistry, National Research Centre, El-Behoth St. 33, Dokki, 12622 Cairo, Egypt
4
Department of Zoology, College of Science, King Saud University, P.O. Box 800, Riyadh, Saudi Arabia
*
Author to whom correspondence should be addressed.
Crystals 2020, 10(3), 181; https://doi.org/10.3390/cryst10030181
Submission received: 7 February 2020 / Revised: 5 March 2020 / Accepted: 5 March 2020 / Published: 7 March 2020
(This article belongs to the Special Issue Advance in Alloy Materials)

Abstract

:
The current research aims at the manufacturing of Ti-6%Al alloy and Ti-6%Al-4%V alloy using the mechanical alloying method and studying their corrosion behavior after various periods of immersions in 3.5% NaCl solutions. The fabricated alloys were also evaluated using spectroscopic techniques such as X-ray diffraction, scanning electron microscopy, and energy dispersive X-ray spectroscopy analyses. The corrosion behavior was studied using potentiodynamic polarization, electrochemical impedance spectroscopy, and chronoamperometric current-time electrochemical methods. It is confirmed that the presence of 4% V greatly decreases the uniform corrosion of the Ti-6%Al alloy as a result of the role of V in decreasing the cathodic, anodic, and corrosion current, and the rate of corrosion along with increasing the corrosion resistance. Increasing the time of immersion to 24 h and further to 48 h highly decreased the corrosion of the alloys. The presence of 4% V and extending the time of exposure thus increase the resistance against corrosion via decreasing the corrosion of Ti-6%Al alloy in the chloride test solution.

Graphical Abstract

1. Introduction

Ti-base alloys have exceptional properties such as excellent mechanical properties, great biocompatibility, and outstanding corrosion resistance against various aggressive electrolytes [1,2,3,4,5]. For that, these alloys have been employed as a standard engineering materials in numerous industrial applications such as their potential use in medical, military, marine, and offshore application [4,5,6,7,8]. The fact that the good corrosion resistance to most corrosive media, the low density, and the high strength make various titanium alloys applicable to be employed in the marine industries and offshore structures [4,5,6,7,8]. The excellent corrosion resistance accounted for the Ti-base alloys has been claimed due to the surfaces of these materials having the ability to develop and form a continuous, highly adherent, stable, and protective titanium oxide layer (TiO2). Under some anhydrous conditions, where there is no oxygen available, these like in sodium hydroxide solutions, sulfuric, and hydrochloric concentrated acid solutions, and, in some instants, the solutions containing chloride ions such as 3.5% NaCl solutions, the formed TiO2 will damage and will not be able to be regenerated [7,9,10,11].
Numerous titanium base alloys have been reported to have a vital usage in the field of biomedical applications [12,13,14,15,16,17,18,19,20,21]. These alloys have been employed as screws for fracture fixation, artificial hip and knee joints, and bone plates to replace the failed tissues in the human bodies. An important issue in selecting the use of Ti alloys is the selection for the elements that can be alloyed with Ti, where these alloying elements have to be nontoxic metallic materials such as V, Nb, Ta, Zr, etc. [20]. Alloying Ti with these metals also enhances the resistance to corrosion and enhances the strength of α + β and the low-modulus β-type titanium alloy. One of these alloys, Ti6Al4V, has excellent resistance to corrosion and high mechanical and physical properties for which it has been chosen to be the most applicable Ti alloy in implantation systems [22,23,24,25]. This alloy was coated with titanium dioxide to be employed in the building of a new heart valve design [25]. Several Ti-base alloys like Ti6Al4V, Ti13Cu4.5Ni, and Ti6Al7Nb have been reported to be the ultimate choice for the use in orthopedic implants [26]. The reason for employing such alloys in the aforementioned uses is their corrosion resistance in vitro to form a stable oxide film in most aggressive environments [26,27,28,29,30,31,32]. The prevention of the release of Ti ions can be done via the formation of a uniform and a homogeneous coating layer of TiO2 on the surface of Ti6Al4V alloy through its anodization in 1.0 M H2SO4 solution at 60 V [33,34,35,36].
This research study aims at the manufacturing of Ti-6%Al alloy and Ti-6%Al-4%V alloy from its raw powders by a high energy ball mall and a heat induction furnace using the mechanical alloying method. The electrochemical corrosion behavior of these alloys after 1 h, 24 h, and 48 h immersion in the corrosive solution using cyclic polarization (CPP), impedance spectroscopy (EIS), and chronoamperometric current-time (CCT) after stepping up the potential at fixed value techniques was carried out. The X-ray diffraction (XRD) patterns were collected to identify the composition and phase structure of the sintered alloys. SEM micrographs and EDX spectra were obtained after 48 h immersion in the test solution and then applying 300 mV (Ag/AgCl) for 30 min. It was expected that the presence of 4%V within the Ti-6%Al would increase its corrosion resistance via reducing its corrosion currents and corrosion rate after being immersed for various immersion times in the chloride medium.

2. Experimental Procedure

2.1. Supplies and Alloy Fabrication

A solution of 3.5% NaCl that was employed as the test solution was prepared from a sodium chloride salt that has 99.95% purity and was supplied by Sigma-Aldrich (Glasgow, UK). The alloys of Ti-6%Al and Ti-6%Al-4%V (percent of all alloying elements was in wt.%) were synthesized using 99.99% Ti, Al, and V powders, which were purchased for Sigma-Aldrich (Glasgow, UK). The required compositions of powders were mixed together in the presence of steel balls at a ratio 5 to 1 ball-to-powder. The mixture was placed in an evacuated jar of steel that accommodates for 80 mL. The jar was then placed in a desktop 220 V ball mill (Across International Co., Livingston, New Jersey NJ, USA). The operating conditions for the ball mill were 2000 rpm speed and 30 min milling time. After the ball milling, the powders were subject to sintering in a die made of graphite has 10 mm in diameter and 20 mm in length. The coupons were sintered using a high frequency induction heat sintering furnace (High-tech Zone, Zhengzhou City, Henan Province, China) under 40 MPa pressure of and 1200 °C temperature for 5 min.

2.2. Electrochemical Test Methods

The corrosion measurements were performed using an electrochemical cell with a three-electrode configuration; this cell accommodates for 250 mL NaCl solution. Both Ti alloys were used as the working electrodes. The employed reference and the counter electrodes were silver/silver chloride (Ag/AgCl) and a platinum sheet, respectively. The preparation of the working electrodes for the corrosion tests were reported in the previous work [37,38,39,40]. All electrochemical tests were obtained by the use of an Autolab workstation (PGSTAT302N, Metrohm, Amsterdam, Netherlands). The polarization tests were carried out in a potential range between −800 mV and 800 mV at scan rate of 1.66 mV/s [41,42]. The EIS experiments were obtained from the value of the open-circuit potential (EOCP) and a frequency range started from 100,000 Hz to 0.01 Hz [38,39]. The potentiostatic (chronoamperometric, CCT) current-time data were gathered in NaCl solution after 48 h after immersion prior to applying a fixed potential value of 0.5 V for 0.5 h.

2.3. XRD Patterns, SEM, and EDX Analyses

Surface investigations were performed employing the XRD, SEM, and EDX techniques. The XRD spectra were performed by the use of D-8 Discover (Bruker, Berlin, Germany); the XRD spectra were carried out at 2°/min scan rate, and the angle range was recorded between 10° and 90° at an increment of 0.02° with locked scan type. The morphology as well as the elemental analysis for the surface of the corroded samples were investigated by the SEM and EDX; all images and spectra were obtained at 15 kV using SEM/EDX instruments purchased from JEOL (Tokyo, Japan).

3. Results and Discussion

3.1. XRD Patterns

XRD patterns collected for Ti-6%Al alloy (upper) and Ti-6%Al-4%V (bottom) are depicted in Figure 1. It is evident that the diffraction peaks that are corresponding to the Ti-6%Al alloy are Ti (see the powder diffraction standard for Ti, JCPDS No. 01-079-6208) and Al (see the powder diffraction standard for Al, JCPDS No. 01-074-5282). The Ti-6%Al-4%V alloy has also recorded the same aforementioned peaks in addition to the peak that is corresponding to vanadium or vanadium oxide (see the powder diffraction standard for V, JCPDS No. 01-086-2248). The XRD patterns confirmed the presence of all alloying elements; i.e., Ti, Al, and V, in the nanocomposites and at the exact compositions. Moreover, the XRD analysis has indicated that there were no contamination peaks observed as the result of the good preparation and mixing processes for the powders.

3.2. CPP Measurements

The CPP curves obtained for (1) Ti-6%Al and (2) Ti-6%Al-4%V after being immersed in the 3.5% NaCl solution for 1 h, respectively, are depicted in Figure 2. The CPP curves were also obtained after the alloy immersion in the same solution for 24 h and 48 h as seen from Figure 3 and Figure 4, respectively. The values of the cathodic and Tafel slopes, βc, βa, corrosion current and potential, jCorr, ECorr, corrosion rate, RCorr, and polarization resistance, RP, all these values were manually collected from Figure 1, Figure 2 and Figure 3, and are seen in Table 1. It is worth mentioning that the βc, jCorr, ECorr, and βa value were calculated as have been reported in the previous research [37,40]. Moreover, the values of RCorr and RP were calculated using the following two equations [38,39]:
R P = 1 j C o r r   ( β c . β a 2.3 ( β c + β a ) ) ,
R C o r r = j C o r r ( k . E W d . A ) .
Here, k is a constant used to define the unit for RCorr, EW is the equivalent weight for the alloy(s), d represents the density of the alloy(s), and A is the surface area of the alloy(s) [38,39].
It is clear that the cathodic branch of the polarization curves shows a decrease in the currents with potential, where the cathodic reaction has reported to be the oxygen reduction reaction that can be represented as follows [43]:
2 H 2 O + O 2 + 4 e = 4 OH ,
1 2 O + H 2 O + 2 = 2 OH .
The cathodic reaction may be undertaken by the reduction of oxygen, which will be adsorbed on the alloy’s surface as per the following reaction [5,7]:
OH ads + e = OH .
The decrease of currents continued with scanning the potential in the forward direction until it reaches the value of ECorr and jCorr after which the anodic reaction starts. The anodic reaction for Ti-Al alloy has been reported to [44,45] take place via the dissolution of Al:
Al = Al3+ + 3e.
The occurrence of this dissolution reaction increases the anodic currents, while the steady slowdown of the increase of current results from the adsorption of hydroxide ions on the surface to form aluminum hydroxide, Al(OH)3ads as follows [46,47]:
Al ( S ) + 3 OH = Al ( OH ) 3 , ads + 3 e .
The formed Al(OH)3 is unstable and is transformed to hydrated oxide (Al2O3·3H2O) [14]:
2 Al ( OH ) 3 , ads = Al 2 O 3 .3 H 2 O .
Figure 2 reveals that the titanium alloy with only Al and Ti-6%Al shows higher absolute cathodic and anodic currents. Adding 4%V is seen to highly reduce the obtained currents and confirm that the presence of V decreases the reactions that take place at the cathode and anode and thus increases the alloys’ corrosion resistance. This was confirmed by the data listed in Table 2, where the values of jCorr and RCorr were much lower for Ti-6%Al-4%V alloy as compared to their values for Ti-6%Al alloy. Table 2 also shows that the presence of V increases the value of RP, which confirm the positive effect for V on decreasing the corrosion of the alloy in the 3.5% NaCl solution. In addition to the formation of Al2O3, titanium dioxide (TiO2) may form on the surface of alloy because Ti alloys tend to form a spontaneous passive film of TiO2 layer when its surface is exposed to air or being immersed in solution that contains water [10,48,49]. Accordingly, the surface of Ti gets oxidized first to form its cations (Ti2+) or reacts with the hydroxide ions formed in the cathodic reaction or may oxidize as per the following reactions [10,49]:
Ti = Ti2+ + 2e,
2Ti(S) + 4OH = 2Ti(OH)2 + 4e,
2Ti(S) + 2O2− = 2TiO2(S) + 4e.
Moreover, the presence of V increases the surface protection up to its additions due to the formation of V2O5 on the surface. This may lead to the increase of pitting corrosion, where the backward direction of the CPP curve recorded for Ti-6%Al-4%V alloy depicted the presence of a bigger hysteresis loop than the obtained one for Ti-6%Al. This may have resulted from the presence of both Ti and V together with Al leading to the increase of Al dissolution from the surface (reaction 6), which in turn leads to the increase of the pitting attack. The propagation of the pits after its initiation has been reported [46,50,51,52,53] to be attributed to the following reactions [43]:
Al3+ + 3Cl = AlCl3,
AlCl3 + Cl = AlCl4.
AlCl3 was formed due to the reaction between Al3+ and the chloride ions and would react with Cl to produce AlCl4 complex [47]. Another opinion stated that, instead of a direct reaction, the dissolution of the oxide film via the chemisorption of the Cl onto this film produces an oxychloride complex, Al(OH)2Cl2, which causes the pitting [54,55,56];
2Al3+ + 2Cl + 2OH- = Al(OH)2Cl2.
The CPP curves obtained after 24 h and 48 h (Figure 3 and Figure 4) decreased the cathodic currents, anodic currents, jCorr and RCorr and increased RP, and this effect increases in the presence of V and the prolonging of time. Table 1 confirmed this finding as the values of jCorr decreased from 4.3 µA/cm2 for Ti-6%Al to be only 0.22 µA/cm2 for Ti-6%Al-4%V. These values greatly decreased for both alloys with increasing time as listed in Table 1. On the other hand, the intensity of pitting corrosion was quite opposite for the long periods of immersed alloys, where, the increase of time increased the possibility of occurrence of pitting corrosion for Ti-6%Al alloy as indicated by the increase of the area of the obtained hysteresis loop with time, unlike the pitting corrosion, which, for Ti-6%Al-4%V, was found to decrease with time via decreasing the area of the hysteresis loop seen after 24 h and 48 h. The CPP results thus reveal that the presence of 4% V within the Ti-6%Al alloy highly decreases its corrosion, and this effect increases with increasing the immersion time to 24 h and much further to 48 h.

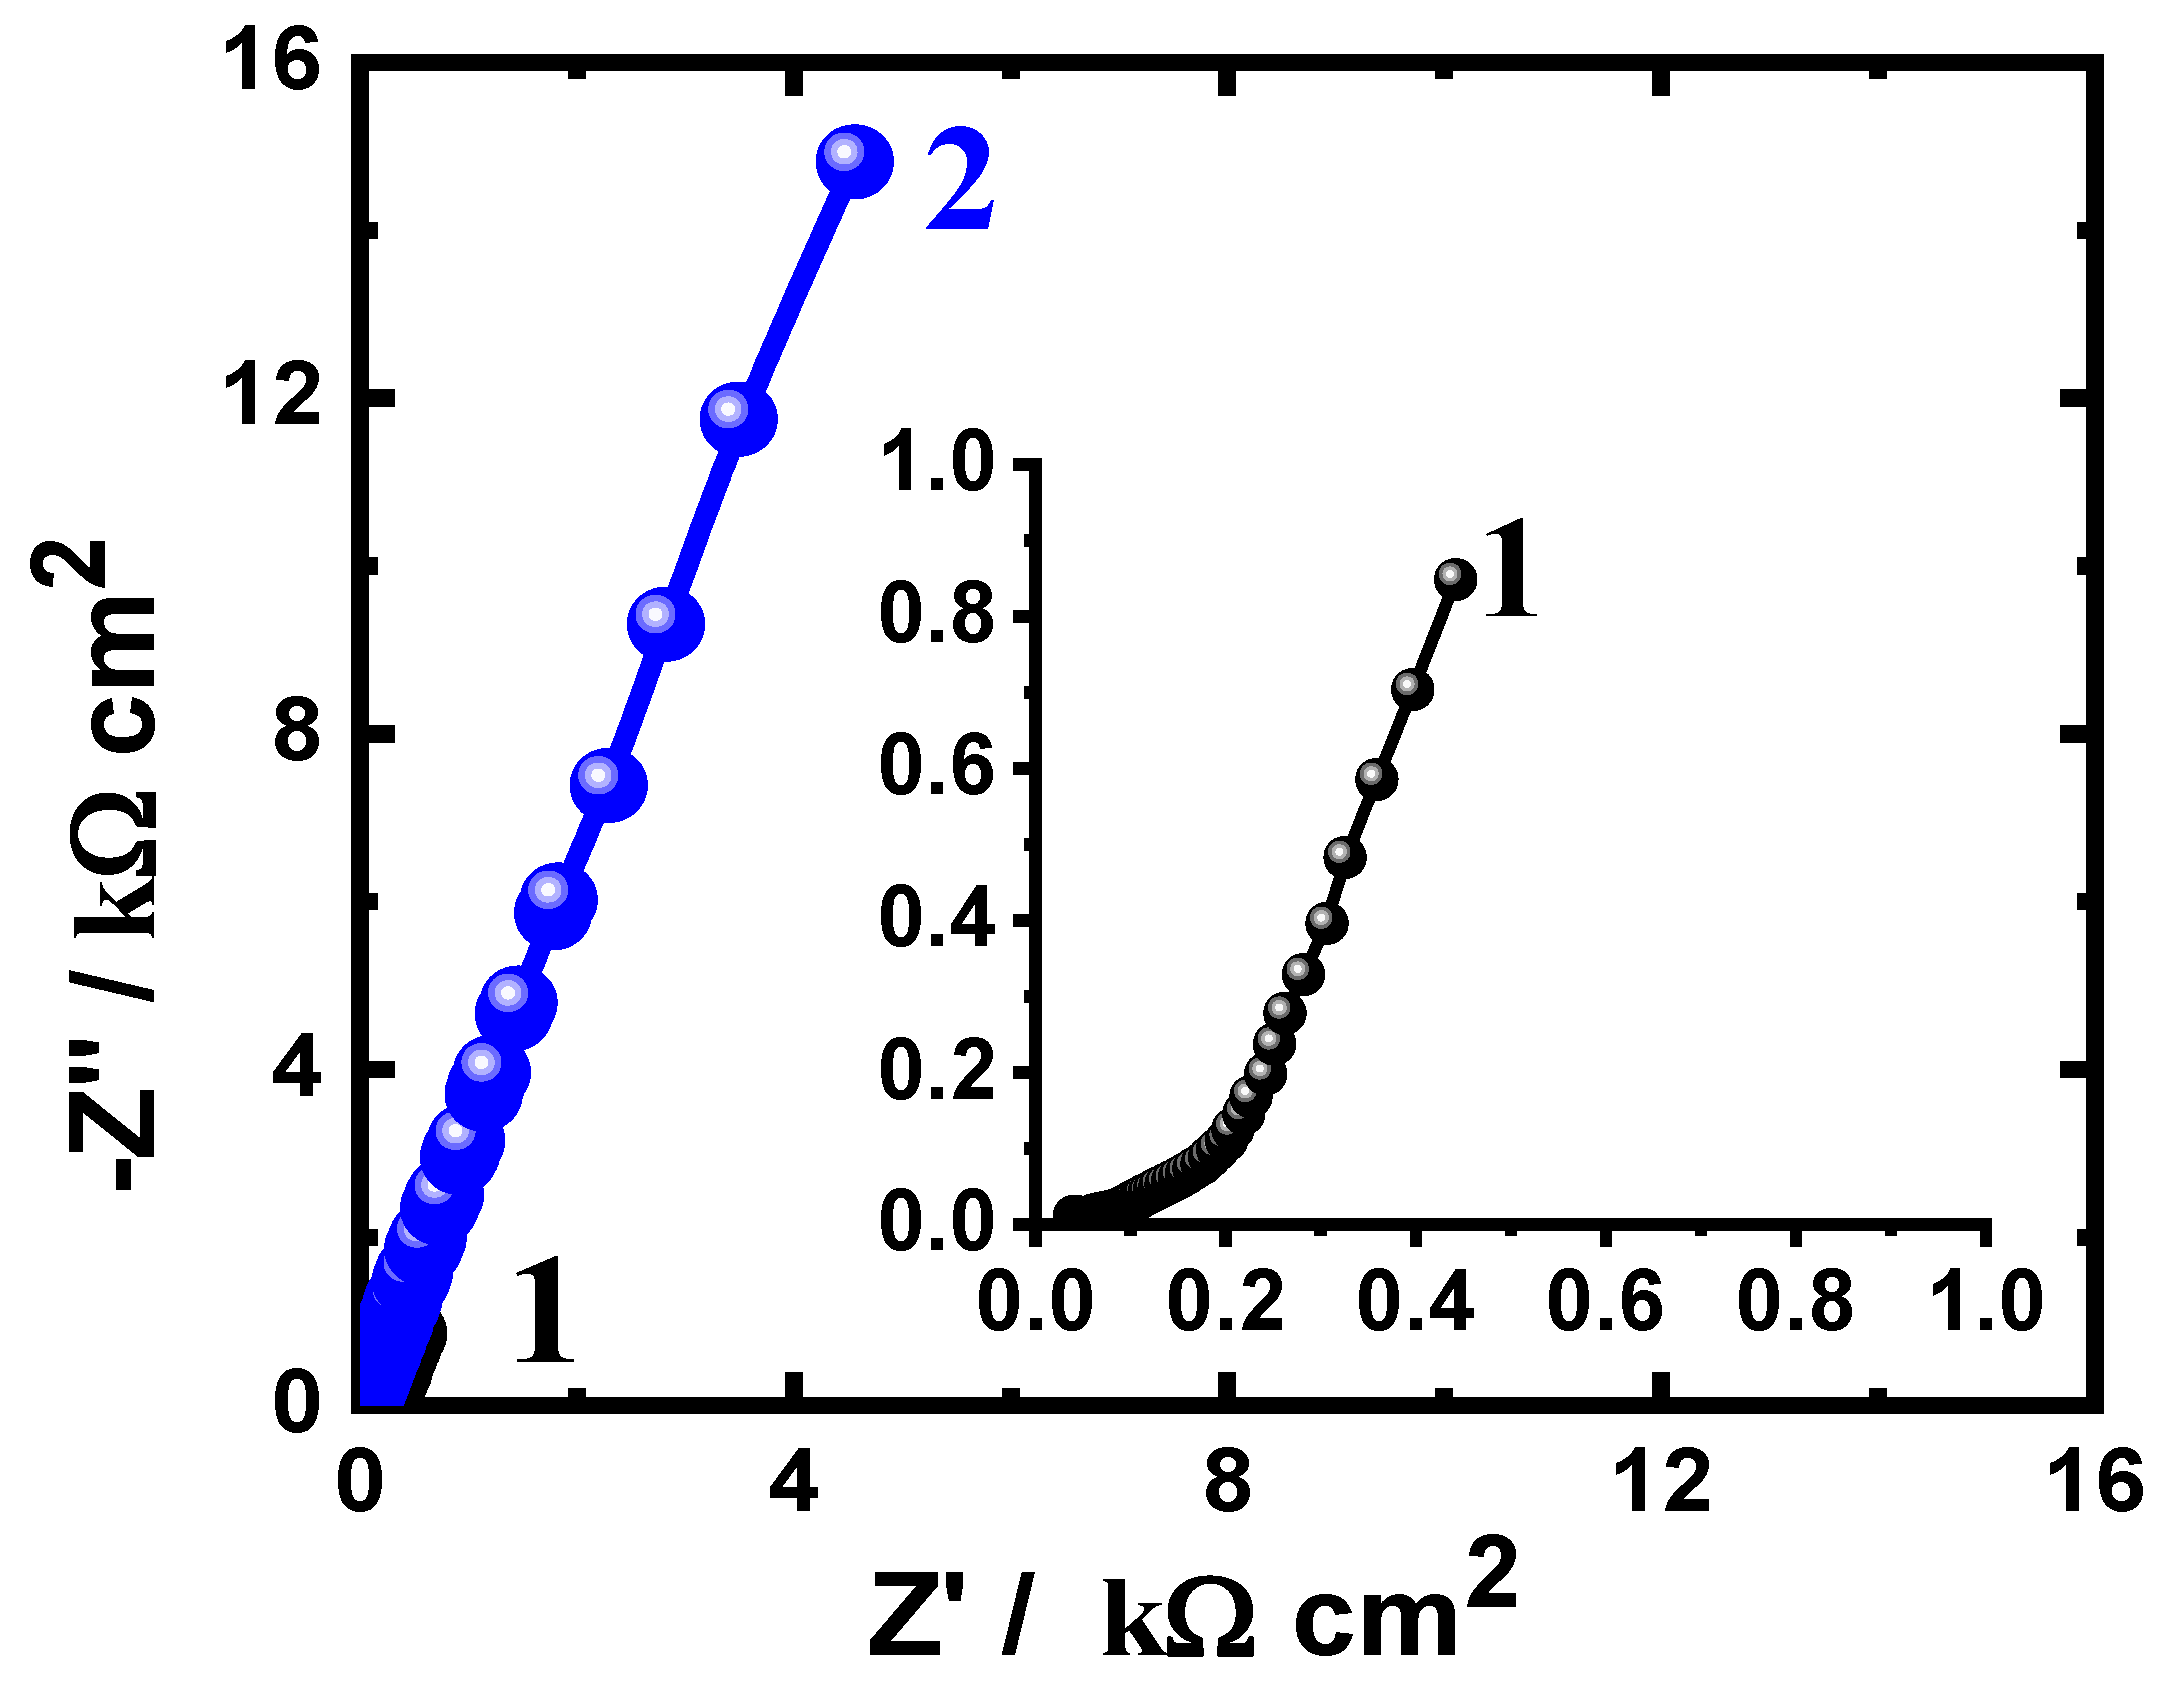
3.3. EIS Measurements

The Nyquist plots measurements for (1) Ti-6%Al alloy and (2) Ti-6%Al-4%V alloy immersed in 3.5% NaCl solution for 1 h are represented by Figure 5. Similar plots were measured for the same alloys in NaCl solution after 24 h and 48 h as seen by Figure 6 and Figure 7. These measurements were best fitted to a circuit model that is displayed in Figure 8, and the values of its parameters are recorded in Table 2. Here, RS is the resistance of the test solution, Cdl is defined as the double layer capacitance, RP1 is the polarization resistance, Q (YQ, CPEs) is considered as the constant phase elements, and RP2 is the second polarization resistance [37].
The obtained spectra of Figure 5 show one semicircle, whether V is present or not. The presence of V is seen to greatly increase the corrosion resistance as indicated by the wide diameter of the semicircle that belongs to Ti-6%Al-4%V alloy. Another indication on the high corrosion resistance for the V containing alloy is values of the impedance parameters listed in Table 2, where the presence of V increased RS, RP1, and RP2 values. Furthermore, the n value that accompany Q is circa 0.5 and can be considered as a Warburg impedance (W) in the case of Ti-6%Al alloy only. On the other side, in the case of a Ti-6%Al-4%V alloy, the value of n is > 0.75 and, therefore, its Q can be considered as a double layer capacitor with some pores. The presence of Cdl confirms also that the existence of V increases the resistance versus corrosion. Table 2 shows the decrease of YQ and Cdl values the presence of V, which further confirms the useful role of V on the protection of corrosion for the fabricated Ti-6%Al alloy.
As previously reported [57], the value of n varies between 0 and 1. If n = 1, then the behavior is related to an ideal capacitor, while if n value is closer to 1 and higher than 0.5, the behavior is a capacitor with some pores and is related to a non-uniform current caused by the inhomogeneities of the films or surface roughness distribution. If the value of n is around 0.5 means a Warburg impedance (W) and if n value is closer to 0, the system can be considered as an inductance.
As exhibited in Figure 6, the increase of immersion time to 24 h is seen to increase the width of the obtained semicircle of the Nyquist plots for (1) Ti-6%Al and (2) Ti-6%Al-4%V alloys. This effect was further increased to 48 h before measurement as depicted in Figure 7. The increase of immersion time thus increases the corrosion resistance of the alloys, which is certainly due to the development of thicker oxide films or corrosion product layer with time. The formed films or layers on the surface protect it from being attacked in the NaCl solution. This is supported by the data seen in Table 2, where all resistances are shown to increase and the values of YQ and Cdl decrease with the prolonging of the time of immersion as it is also increased due to the existence of V. The EIS obtained data thus confirm the polarization ones that the presence of 4% V highly enhances the resistance of the Ti-6%Al all against corrosion, and this effect greatly increased with prolonging the time of exposure from 1 h to 24 h and further to 48 h before collecting the measurements.

3.4. CCT Measurements

In order to confirm the effect of V addition on both the uniform corrosion and pitting attack at a constant anodic value of potential, CCT experiments were performed after various exposure times in the chloride test solution. The CCT plots seen in Figure 9 were recorded for (1) Ti-6%Al alloy and (2) Ti-6%Al-4%V alloy at 300 mV (Ag/AgCl) after immersion in 3.5% NaCl solution for 1 h. The obtained currents recorded an abrupt shift in the first few moments due to the dissolution of surface layer possibly forming as a result of immersing the alloys for 1 h before applying the positive potential. The current then slightly decreases with time because of the stabilization of the surface with an oxide film. For Ti-6%Al alloy, the current recorded high absolute values, while Ti-6%Al-V% alloy recorded very low currents. This indicates that the presence of 4%V highly increases the corrosion resistance of the titanium alloy. The current vs. time behavior also indicated that there is no pitting corrosion noticed for the surface of the alloys at the condition of 300 mV applied potential and 1 h immersion time.
Expanding the period of immersion time to 24 h (Figure 10) decreased the absolute currents for Ti-6%Al alloy and Ti-6%Al-4%V alloy meaning that the surface of the alloys developed an oxide film. This film gets thickened with time and leads to minimizing the attack on the surface of the alloys and reflects on the decrease of the obtained currents. This was further confirmed by prolonging the exposure period of time to 48 h as depicted in Figure 11, where the obtained currents were the minimum for both tested alloys. The most pronounced decreases in currents were recorded for a Ti-6%Al alloy, where it decreased from about 135 µA/cm2 when it was exposed for 1 h to only 20 µA/cm2 after 48 h exposure in the chloride solutions, while the decrease of currents for Ti-6%Al-4%V alloy was from circa 12 µA/cm2 after 1 h immersion to about 4 µA/cm2 after 48 h exposure in the chloride solutions before measurement. Therefore, the obtained currents decreased with time in the following order; 48 h < 24 h < 1 h as well as with the alloys as following; Ti-6%Al-4%V alloy < Ti-6%Al alloy. The chronoamperometric current–time measurements at +300 mV agree with the obtained results from CPP and EIS that the presence of 4% V greatly enhances the resistance towards corrosion of the titanium–aluminum alloy in the sodium chloride solution, and this effect highly enhanced when the exposure periods of time increases.

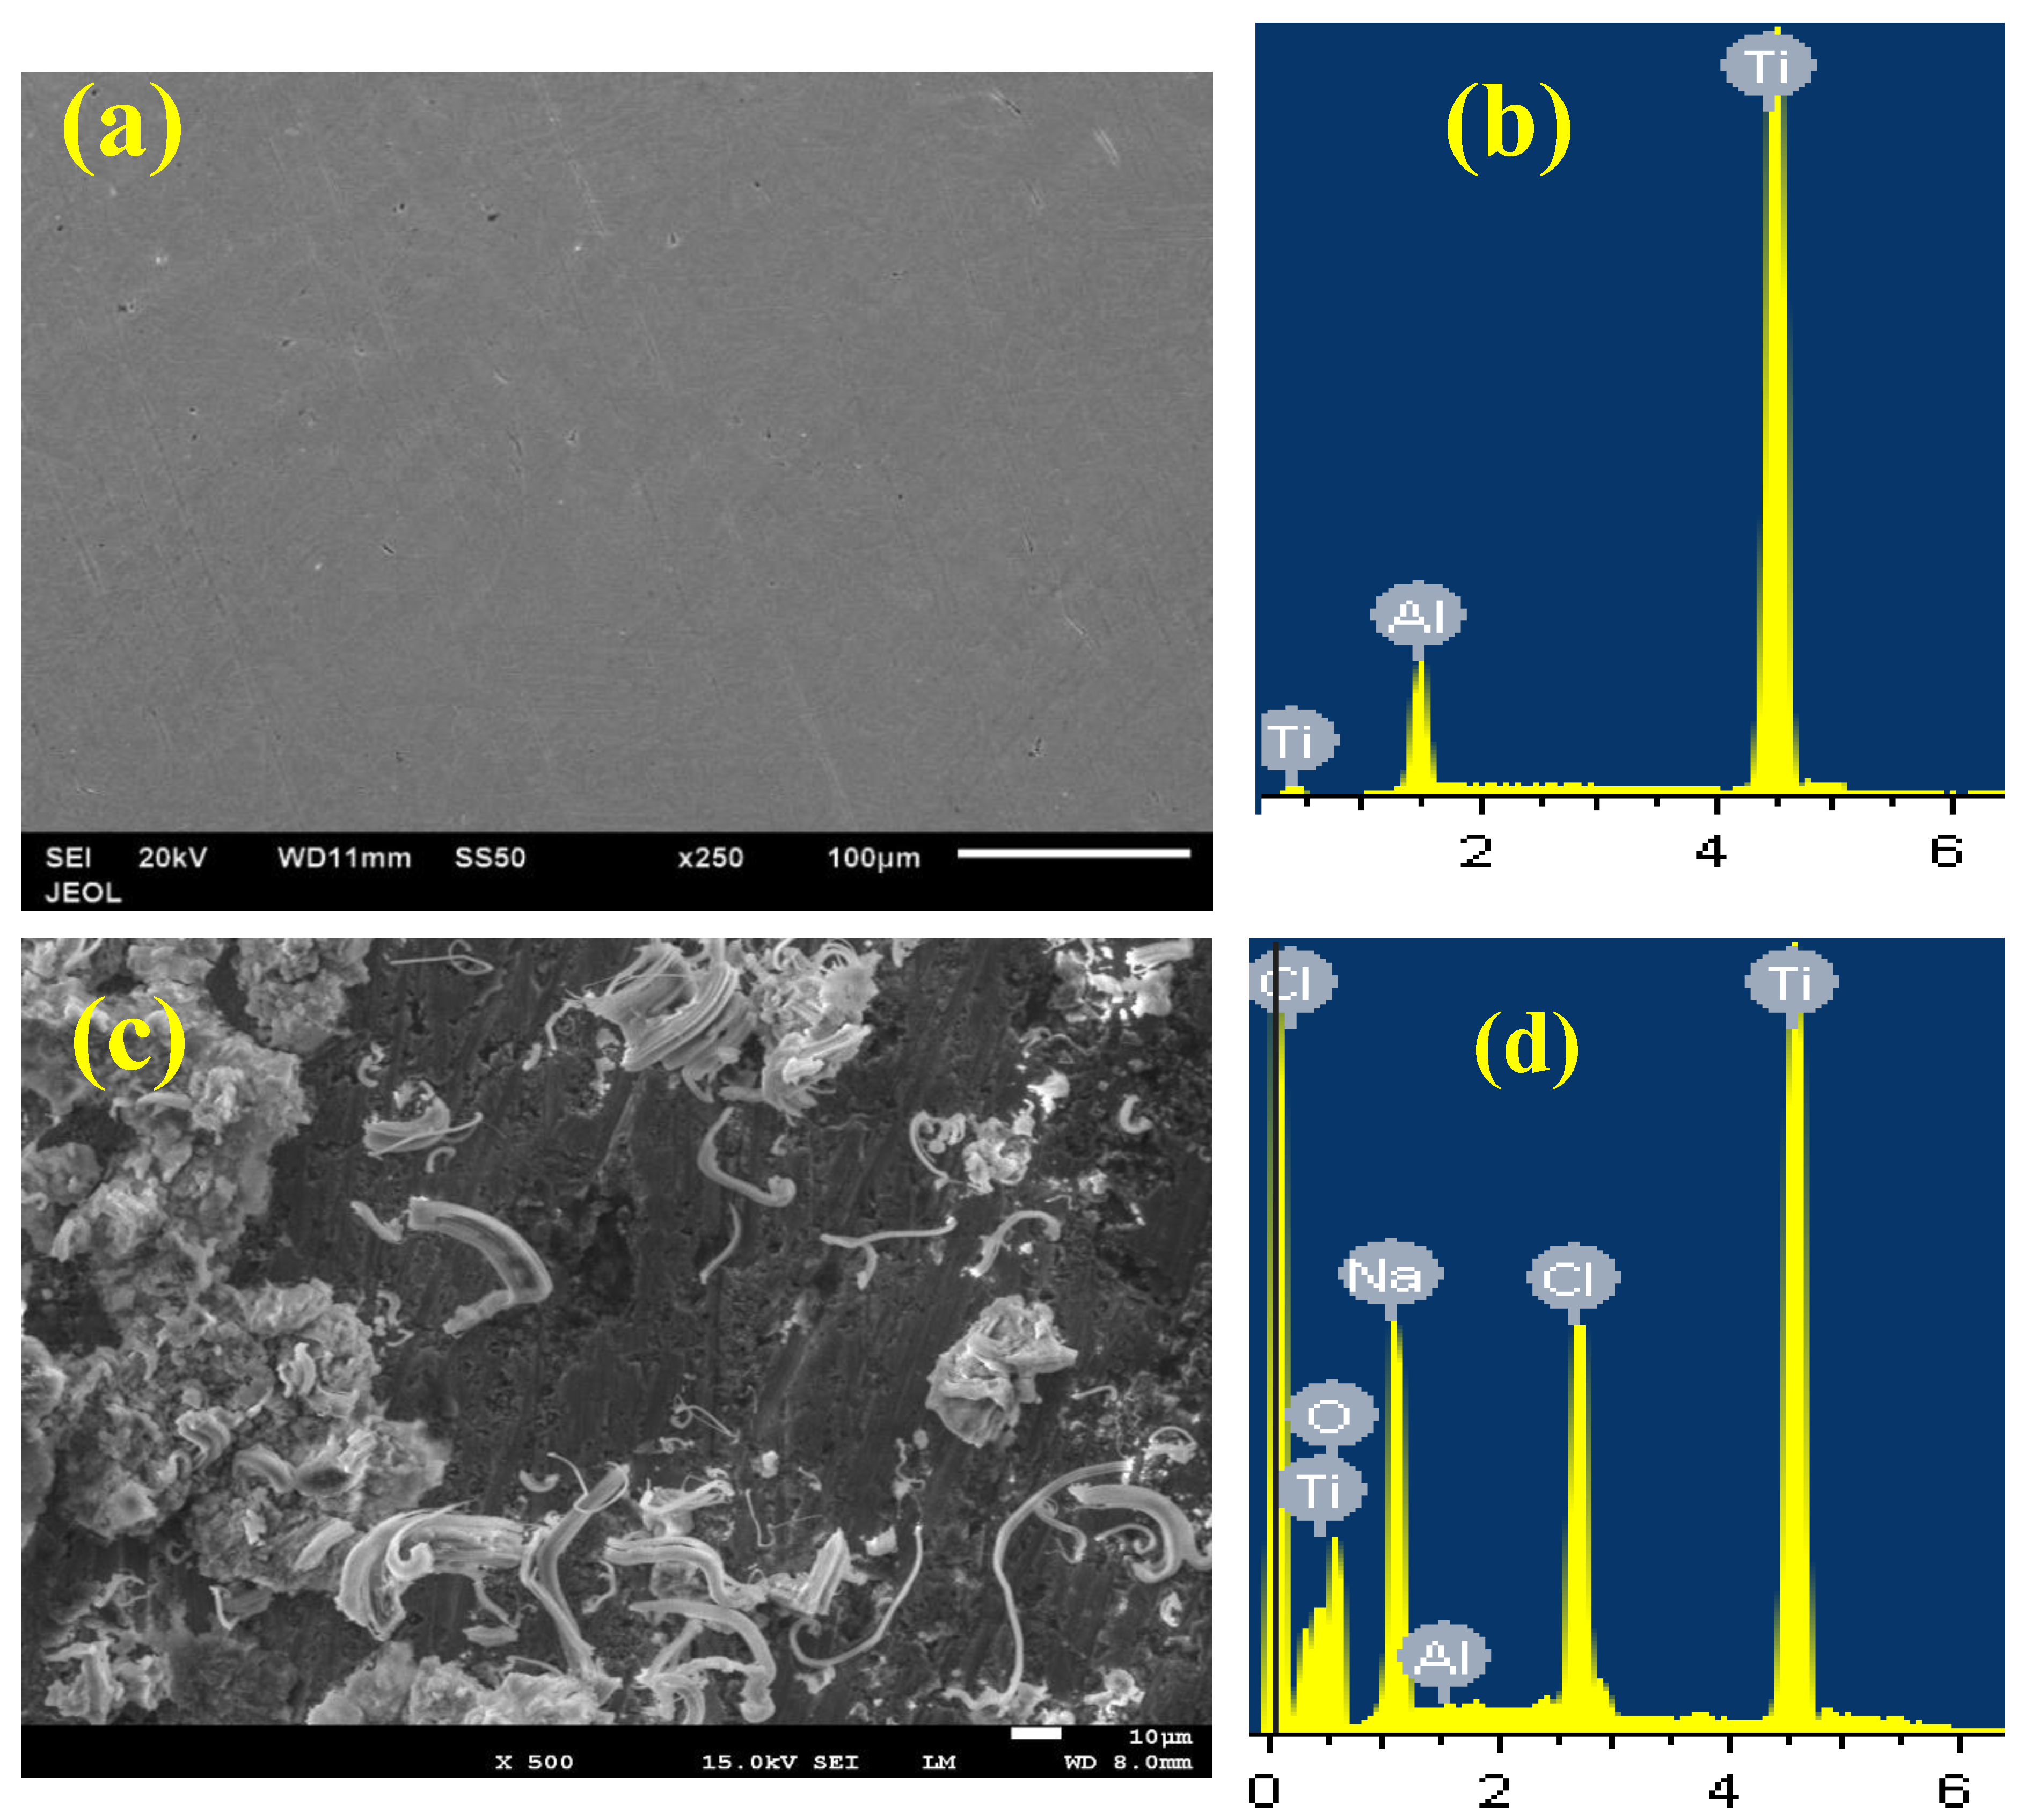
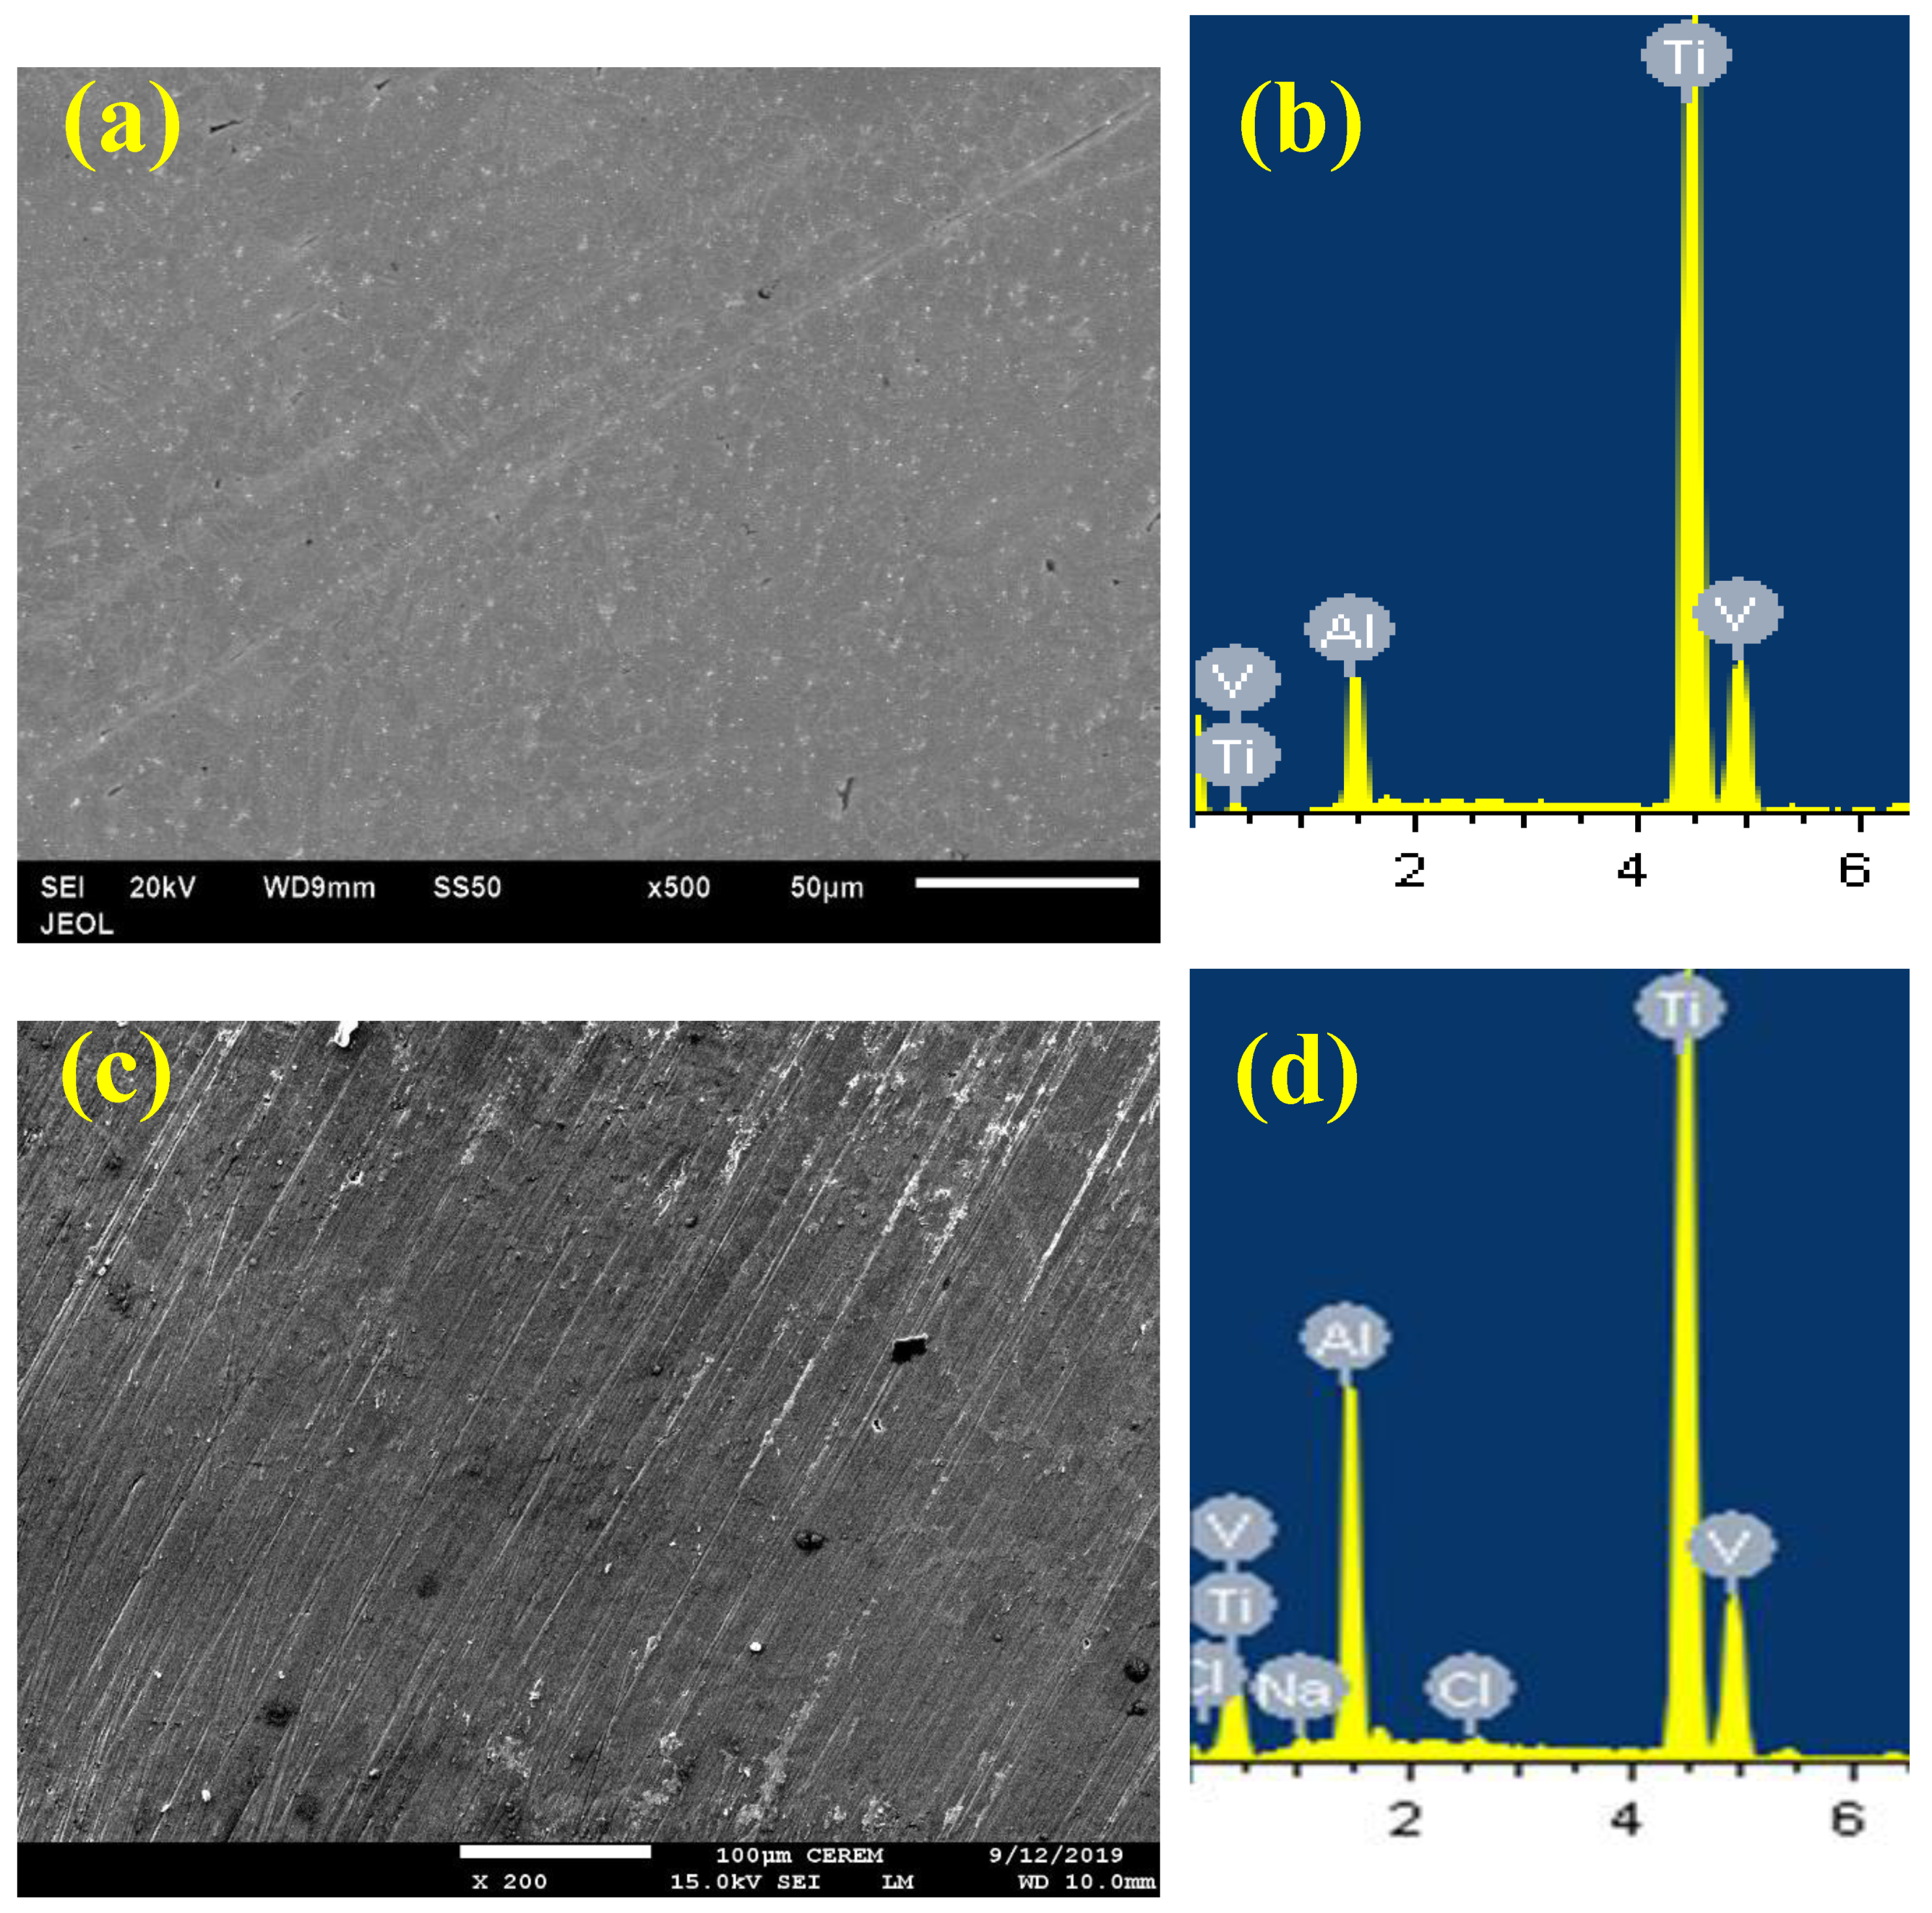
3.5. SEM and EDX Investigations

The SEM images together with EDX investigations were collected after performing the current-time experiments shown in Figure 12. Here, the alloys were exposed for 48 h in the 3.5% NaCl solutions before applying a constant value of potential at 300 mV for 30 min. Figure 12 shows (a) SEM and (b) EDX analysis for the surface of sintered Ti-6%Al alloy before its immersion; (b) SEM and (d) EDX analysis for the surface of the corroded Ti-6%Al alloy that was immersed in 3.5% NaCl solution for 48 h before stepping the potential at 300 mV for 30 min. It is seen that the SEM image for the sintered sample is smooth and has no signs on the occurrence of corrosion because it was not exposed to the test solution. On the other hand, the SEM image for the immersed sample (Figure 12c) has irregular corrosion products on the surface of the alloy, where there is an area that has a thick corrosion product layer and another area has some deposited sodium chloride salt. There are also some pits that appeared on the surface particularly, in the area that has no thick corrosion products. This confirms that the polarization measurements, where the hysteresis loop that appeared on the curve 1 of Figure 4 and the little increase of the current with time in some areas on curve 1 of Figure 11, revealed the occurrence of pitting corrosion. The weight percentages (wt.%) for the elements detected by EDX analysis depicted in Figure 12b were mainly the elements composed of the Ti-6Al alloy, while the wt.% of the corroded sample (Figure 12d) were 46.34% Ti, 30.95% O, 0.13% Al, 11.99% Na, and 10.59% Cl. The presence of this high % of oxygen indicates that the surface of covered with an oxide layer. This was confirmed by the lower % of Ti and Al than its initial % in the alloy. Oxides such as Al2O3 and TiO2 may thus form on the surface of the Ti-6%Al alloy. The white corrosion product seen on the SEM image is most probably a deposited NaCl salt as the wt.% of both Na and Cl are nearly the same.
Figure 13 presents (a) the SEM and (b) the EDX analyses for the surface of sintered Ti-6%Al-4%V alloy before its immersion; (b) SEM and (d) EDX analysis for the surface of the corroded Ti-6%Al-4%V alloy that was immersed in 3.5% NaCl solution for 48 h before stepping the potential at 300 mV for 30 min. It is seen from the SEM images, whether it was immersed (Figure 13a) or not immersed in the test solution (Figure 13c), that the surface of the alloy is not attacked or pitted and seems to be homogeneous. The only difference between the two images is that the immersed sample has formed corrosion products due to the presence of the NaCl solution. The EDX profile analysis was then performed to ensure the composition of the alloy (Figure 13b) and whether corrosion product and/or oxide layers are formed on the surface in case of the immersed alloy (Figure 13d). The wt.% for the pure surface that has no corrosion products and that was not immersed in the chloride solution were almost the same as the main composition of the alloy. On the other hand, the wt.% detected for the elements of the corroded alloy using an EDX profile spectrum that is depicted in Figure 13d were as follows: 48.08% Ti, 30.15% O, 12.54% Al, 8.15% V, 0.62% Na, and 0.46% Cl. Here, the Ti% is lower, while the Al% is higher than expected. This may indicate the enrichment of Al on the surface as a result of its dissolution and then the formation of Al2O3 (reaction 8). The presence of almost double % the V than its actual % in the alloy may also indicate on the formation of V2O5 layer on the surface of the alloy. The formation of all these oxides and the disappearance of pits formation on the surface reflects on the higher corrosion resistance for Ti-6%Al-4%V alloy compared to Ti-6%Al alloy. The disappearance of the white corrosion product layer we have seen in the SEM image of Figure 12 is because the detected % for both Na and Cl were very low. The SEM/EDX investigations thus confirm that the presence of 4% V decreases the severity of corrosion in 3.5% NaCl and that effect is more pronounced after long immersion periods of time.

4. Conclusions

In this work, two titanium base alloys, namely Ti-6%Al alloy and Ti-6%Al-4%V alloy, were manufactured from their powders using the mechanical alloying technique. The XRD method confirmed the homogeneous distribution and the composition of the fabricated alloys. The corrosion in 3.5% NaCl solution of these alloys after 1 h, 24 h, and 48 h exposure was carried out using CPP, EIS, and CCT at 300 mV experiments. The corroded surfaces of the alloys were investigated using SEM micrographs and EDX profile analysis. All electrochemical (CPP, EIS, and CCT) measurements revealed that the presence of 4% V greatly decreased the corrosion of Ti-6%Al alloy via minimizing the values of corrosion current and the rate of this corrosion as well as increasing the values of polarization resistance. This was found to highly increase with prolonging the immersion time from 1 h to 24 h and the maximum resistance against corrosion for the Ti-6%Al alloy and Ti-6%Al-4%V alloy was obtained after their immersion in the 3.5% NaCl solution for 48 h. Moreover, the pitting corrosion was found to decrease with time for the Ti-6%Al-4%V alloy and increase for the Ti-6%Al alloy as revealed by the data of CPP and CCT. The results of SEM and EDX investigations indicated that the corrosion resistance of Ti-6%Al-4%V alloy was higher than the corrosion resistance of Ti-6%Al alloy due to the formation of a mixture of Al2O3, TiO2, and V2O5 on the surface of the alloy.

Author Contributions

Conceptualization, H.S.A., E.-S.M.S., and H.A.E.-S.; methodology, H.S.A., E.-S.M.S., and H.A.E.-S.; validation, H.S.A., E.-S.M.S., and H.A.E.-S.; formal analysis, H.S.A., E.-S.M.S., and H.A.E.-S.; investigation, H.S.A., E.-S.M.S., and H.A.E.-S.; resources, E.-S.M.S.; data curation, H.S.A., E.-S.M.S., and H.A.E.-S.; writing—original draft preparation, E.-S.M.S. and H.S.A.; writing—review and editing, E.-S.M.S.; supervision, E.-S.M.S.; project administration, E.-S.M.S.; funding acquisition, E.-S.M.S. All authors have read and agreed to the published version of the manuscript.

Funding

The authors would like to extend their sincere appreciation to the Deanship of Scientific Research at King Saud University for its funding of this research through the Research Group Project No. RGP-160.

Conflicts of Interest

The authors declare no conflict of interest.

References

  1. Erinosho, M.F.; Akinlabi, E.T.; Pityana, S. Microstructure and corrosion behaviour of laser metal deposited Ti6Al4V/Cu composites in 3.5% sea water. Mater. Today Proc. 2015, 2, 1166–1174. [Google Scholar] [CrossRef]
  2. Da Silva, L.L.G.; Ueda, M.; Silva, M.M.; Codaro, E.N. Corrosion behavior of Ti–6Al–4V alloy treated by plasma immersion ion implantation process. Surf. Coat. Technol. 2007, 201, 8136–8139. [Google Scholar] [CrossRef]
  3. Simka, W.; Sadkowski, A.; Warczak, M.; Iwaniak, A.; Derczd, G.; Michalska, J.; Maciej, A. Characterization of passive films formed on Ti during anodic oxidation. Electrochim. Acta 2011, 56, 8962–8968. [Google Scholar] [CrossRef]
  4. Ahn, H.; Lee, D.; Lee, K.M.; Lee, K.; Baek, D.; Park, S.W. Oxidation behavior and corrosion resistance of Ti–10Ta–10Nb alloy. Surf. Coat. Technol. 2008, 202, 5784–5789. [Google Scholar] [CrossRef]
  5. Zhang, H.; Kou, H.; Yang, J.; Huang, D.; Nan, H.; Li, J. Microstructure evolution and tensile properties of Ti-6.5Al-2Zr-Mo-V alloy processed with thermo hydrogen treatment. Mater. Sci. Eng. A 2014, 619, 274–280. [Google Scholar] [CrossRef]
  6. Pang, J.; Blackwood, D.J. Corrosion of Ti alloys in high temperature near anaerobic seawater. Corros. Sci. 2016, 105, 17–24. [Google Scholar] [CrossRef]
  7. Khalil, K.A.; Sherif, E.S.M.; Nabawy, A.M.; Abdo, H.S.; Marzouk, W.W.; Al-Harbi, H.F. Titanium carbide nanofibers-reinforced aluminum compacts, a new strategy to enhance mechanical properties. Materials 2016, 9, 399. [Google Scholar] [CrossRef]
  8. Narayanan, R.; Seshadri, S.K. Point defect model and corrosion of anodic oxide coatings on Ti–6Al–4V. Corros. Sci. 2008, 50, 1521–1529. [Google Scholar] [CrossRef]
  9. Duarte, L.T.; Biaggio, S.R.; Rocha-Filho, R.C.; Bocchi, N. Surface characterization of oxides grown on the Ti–13Nb–13Zr alloy and their corrosion protection. Corros. Sci. 2013, 72, 35–40. [Google Scholar] [CrossRef]
  10. deAssis, S.L.; Wolynec, S.; Costa, I. Corrosion characterization of Ti alloys by electrochemical techniques. Electrochim. Acta 2006, 51, 1815–1819. [Google Scholar]
  11. Li, Y.; Qu, L.; Wang, F. The electrochemical corrosion behavior of TiN and (Ti,Al)N coatings in acid and salt solution. Corros. Sci. 2003, 45, 1367–1381. [Google Scholar] [CrossRef]
  12. Zhang, L.C.; Attar, H. Selective laser melting of Ti alloys and Ti matrix composites for biomedical applications: A review. Adv. Eng. Mater. 2016, 18, 463–475. [Google Scholar] [CrossRef]
  13. AlOtaibi, A.; Sherif, E.S.M.; Zinelis, S.; AlJabbari, Y. Corrosion behavior of two cp titanium dental implants connected by cobalt chromium metal superstructure in artificial saliva and the influence of immersion time. Int. J. Electrochem. Sci. 2016, 11, 5877–5890. [Google Scholar] [CrossRef]
  14. Koizumi, H.; Takeuchi, Y.; Imai, H.; Kawai, T.; Yoneyama, T. Application of titanium and titanium alloys to fixed dental prostheses. J. Prosthodont. Res. 2019, 63, 266–270. [Google Scholar] [CrossRef]
  15. Sakaguchi, N.; Mitsuo, N.; Akahori, T.; Saito, T.; Furuta, T. Effects of Alloying Elements on Elastic Modulus of Ti-Nb-Ta-Zr System Alloy for Biomedical Applications. Mater. Sci. Forum 2004, 449–452, 1269–1272. [Google Scholar] [CrossRef]
  16. He, C.; Hagiwara, M. Ti alloy design strategy for biomedical applications. Mater. Sci. Eng. C 2006, 26, 14–19. [Google Scholar] [CrossRef]
  17. Yu, S.Y.; Scully, J.R. Corrosion and passivity of Ti-13% Nb-13% Zr in comparison to other biomedical implant alloys. Corrosion 1997, 53, 965–976. [Google Scholar] [CrossRef]
  18. Ho, W. Effect of Omega phase on mechanical properties of Ti-Mo alloys for biomedical applications. J. Med. Biol. Eng. 2008, 28, 47–51. [Google Scholar]
  19. Hussein, A.H.; Gepreel, M.A.-H.; Gouda, M.K.; Hefnawy, A.M.; Kandil, S.H. Biocompatibility of new Ti–Nb–Ta base alloys. Mater. Sci. Eng. C 2016, 61, 574–578. [Google Scholar] [CrossRef]
  20. Niinomi, M. Recent metallic materials for biomedical applications. Metall. Mater. Trans. A 2002, 33, 477. [Google Scholar] [CrossRef]
  21. Afzali, P.; Ghomashchi, R.; Oskouei, R.H. On the corrosion behaviour of low modulus titanium alloys for medical implant applications: A review. Metals 2019, 9, 878. [Google Scholar] [CrossRef] [Green Version]
  22. Mogoda, A.S.; Ahmad, Y.H.; Badawy, W.A. Corrosion behaviour of Ti-6Al-4V alloy in concentrated hydrochloric and sulphuric acids. Appl. Electrochem. 2004, 34, 873–878. [Google Scholar] [CrossRef]
  23. Hrabe, N.; Quinn, T. Effects of processing on microstructure and mechanical properties of Ti-6Al-4V fabricated using electron beam melting (EBM), part 1: Distance from build plate and part size. Mater. Sci. Eng. A 2013, 573, 264–270. [Google Scholar] [CrossRef]
  24. Hrabe, N.; Quinn, T. Effects of processing on microstructure and mechanical properties of Ti-6Al-4V fabricated using electron beam melting (EBM), part 2: Energy input, orientation, and location. Mater. Sci. Eng. A 2013, 573, 271–277. [Google Scholar] [CrossRef]
  25. Amerio, O.N.; Rosenberger, M.R.; Favilla, P.C.; Alterach, M.A.; Schvezov, C.E. Prótesis Valvular Cardíaca Trivalva Asociada a Última Generación de Materiales Hemo-Biocompatibles. Rev. Argent. Cirugía Cardiovasc. 2006, 4, 70–76. [Google Scholar]
  26. Geetha, M.; Singh, A.K.; Asokamani, R.; Gogia, C. Ti based biomaterials, the ultimate choice for orthopedic implants—A review. Prog. Mater. Sci. 2009, 54, 397–425. [Google Scholar] [CrossRef]
  27. Long, M.; Rack, H.J. Titanium alloys in total joint replacement—A materials science perspective. Biomaterials 1998, 19, 1621–1639. [Google Scholar] [CrossRef]
  28. McKay, P.; Mitton, D.B. An Electrochemical Investigation of Localized Corrosion on Titanium in Chloride Environments. Corrosion 1985, 41, 52–62. [Google Scholar] [CrossRef]
  29. Patriona, M.M.; Müller, I.L. An electrochemical study of the crevice corrosion of titanium. J. Braz. Chem. Soc. 1997, 8, 137–142. [Google Scholar] [CrossRef] [Green Version]
  30. Leyens, C.; Peters, M. Titanium and Titanium Alloys; Wiley-VCH: Weinheim, Germany, 2004. [Google Scholar]
  31. Liu, X.; Chu, P.K.; Ding, C. Surface modification of titanium, titanium alloys, and related materials for biomedical applications. Mater. Sci. Eng. R Rep. 2004, 47, 49–121. [Google Scholar] [CrossRef] [Green Version]
  32. Chapala, P.; Kumar, P.S.; Joardar, J.; Bhandari, V.; Acharyya, S.G. Effect of alloying elements on the microstructure, coefficient of friction, in-vitro corrosion and antibacterial nature of selected Ti-Nb alloys. Appl. Surf. Sci. 2019, 469, 617–623. [Google Scholar] [CrossRef]
  33. Vera, M.L.; Ares, A.E.; Rosenberger, M.R.; Lamas, D.G.; Schvezov, C.E. Determination using X-ray reflectometry of the TiO2 coating’s thickness obtained by anodic oxidation. Anales AFA 2009, 21, 174–178. [Google Scholar] [CrossRef]
  34. Diamanti, M.V.; Pedeferri, M.P. Effect of anodic oxidation parameters on the titanium oxides formation. Corros. Sci. 2007, 49, 939–948. [Google Scholar] [CrossRef]
  35. Velten, D.; Biehl, V.; Aubertin, F.; Valeske, B.; Possart, W.; Breme, J. Preparation of TiO2 layers on cp-Ti and Ti-6Al-4V by thermal and anodic oxidation and by sol-gel coating techniques and their characterization. J. Biomed. Mater. Res. 2002, 59, 18–28. [Google Scholar] [CrossRef]
  36. Vera, M.L.; Ares, A.E.; Lamas, D.; Schvezov, C.E. Preparation and characterization of titanium dioxide coating on Ti-6Al-4V by anodic oxidation technique, First results. Anales AFA 2008, 20, 178–183. [Google Scholar]
  37. Alharthi, N.; Sherif, E.S.M.; Abdo, H.S.; Zein El Abedin, S. Effect of nickel content on the corrosion resistance of iron-nickel alloys in concentrated hydrochloric acid pickling solutions. Adv. Mater. Sci. Eng. 2017, 2017, 1893672. [Google Scholar] [CrossRef] [Green Version]
  38. Sherif, E.S.M. Effects of exposure time on the anodic dissolution of Monel-400 in aerated stagnant sodium chloride solutions. J. Solid State Electrochem. 2012, 16, 891–899. [Google Scholar] [CrossRef]
  39. Latief, F.H.; Sherif, E.S.M.; Almajid, A.A.; Junaedi, H. Fabrication of exfoliated graphite nanoplatelets-reinforced aluminum composites and evaluating their mechanical properties and corrosion behavior. J. Anal. Appl. Pyrolysis 2011, 92, 485–492. [Google Scholar] [CrossRef]
  40. Sherif, E.S.M.; Potgieter, J.H.; Comins, J.D.; Cornish, L.; Olubambi, P.A.; Machio, C.N. The beneficial effect of ruthenium additions on the passivation of duplex stainless steel corrosion in sodium chloride solutions. Corros. Sci. 2009, 51, 1364–1371. [Google Scholar] [CrossRef]
  41. ASTM G61-86. Standard Test Method for Conducting Cyclic Potentiodynamic Polarization Measurements for Localized Corrosion Susceptibility of Iron-, Nickel-, or Cobalt-Based Alloys; ASTM International: West Conshohocken, PA, USA, 2014. [Google Scholar]
  42. ASTM G59-97. Standard Test Method for Conducting Potentiodynamic Polarization Resistance Measurements; ASTM International: West Conshohocken, PA, USA, 2014. [Google Scholar]
  43. Badawy, W.A.; Al-Kharafi, F.M.; El-Azab, A.S. Electrochemical behaviour and corrosion inhibition of Al, Al-6061 and Al–Cu in neutral aqueous solutions. Corros. Sci. 1999, 41, 709–727. [Google Scholar] [CrossRef]
  44. Sherif, E.S.M.; Abdo, H.S.; Latief, F.H.; Alharthi, N.H.; El Abedin, S.Z. Fabrication of Ti–Al–Cu new alloys by inductive sintering, characterization, and corrosion evaluation. J. Mater. Res. Technol. 2019, 8, 4302–4311. [Google Scholar] [CrossRef]
  45. Sherif, E.S.M.; Latief, F.H.; Abdo, H.S.; Alharthi, N.H. Electrochemical and spectroscopic study on the corrosion of Ti-5Al and Ti-5Al-5Cu in chloride solutions. Met. Mater. Int. 2019, 25, 1511–1520. [Google Scholar] [CrossRef]
  46. Mazhar, M.M.; Badawy, W.A.; Abou-Romia, M.M. Impedance studies of corrosion resistance of aluminium in chloride media. Surf. Coat. Technol. 1987, 29, 337–345. [Google Scholar]
  47. Sherif, E.M.; Park, S.M. Effects of 1,4-naphthoquinone on aluminum corrosion in 0.50 M sodium chloride solutions. Electrochim. Acta 2006, 51, 1313–1321. [Google Scholar] [CrossRef]
  48. Butt, A.; Hamlekhan, A.; Patel, S.; Royhman, D.; Sukotjo, C.; Mathew, M.T.; Shokuhfar, T.; Takoudis, C. A novel investigation of the formation of titanium oxide nanotubes on thermally formed oxide of Ti-6Al-4V. J. Oral Implantol. 2015, 41, 523–531. [Google Scholar] [CrossRef]
  49. Rinner, M.; Gerlach, J.; Ensinger, W. Formation of Ti oxide films on Ti and Ti6Al4V by O2-plasma immersion ion implantation. Surf. Coat. Technol. 2000, 132, 111–116. [Google Scholar] [CrossRef]
  50. Tomcsanyi, L.; Varga, K.; Bartik, I.; Horanyi, G.; Maleczki, E. Electrochemical study of the pitting corrosion of aluminium and its alloys-II. Study of the interaction of chloride ions with a passive film on aluminium and initiation of pitting corrosion. Electrochim. Acta 1989, 34, 855–859. [Google Scholar] [CrossRef]
  51. Foley, R.T.; Nguyen, T.H. The chemical nature of aluminum corrosion-V. Energy transfer in aluminum dissolution. J. Electrochem. Soc. 1982, 129, 464–467. [Google Scholar] [CrossRef]
  52. Sato, N. The stability of localized corrosion. Corros. Sci. 1995, 37, 1947–1967. [Google Scholar] [CrossRef]
  53. Hunkeler, F.; Frankel, G.S.; Bohni, H. Technical Note: On the Mechanism of Localized Corrosion. Corrosion 1987, 43, 189–191. [Google Scholar] [CrossRef]
  54. Diggle, J.W.; Downie, T.C.; Goulding, C. The dissolution of porous oxide films on aluminium. Electrochim. Acta 1970, 15, 1079–1093. [Google Scholar] [CrossRef]
  55. Badawy, W.A.; El-Basiouny, M.S.; Ibrahim, M.M. Kinetics of the dissolution of phosphoric acid anodized aluminium as revealed from impedance measurements in phosphate media. Indian J. Technol. 1986, 24, 1–6. [Google Scholar]
  56. Wall, F.D.; Martinez, M.A.; Vandenavyle, J.J. Relationship between induction time for pitting and pitting potential for high-purity aluminum. J. Electrochem. Soc. 2004, 151, B354–B358. [Google Scholar] [CrossRef]
  57. Diamanti, M.V.; Bolzoni, F.; Ormellese, M.; Pérez-Rosales, E.A.; Pedeferri, M.P. Characterisation of titanium oxide films by potentiodynamic polarisation and electrochemical impedance spectroscopy. Corros. Eng. Sci. Technol. 2010, 45, 428–434. [Google Scholar] [CrossRef]
Figure 1. X-ray diffraction (XRD) patterns of the Ti-6%Al (upper) and the Ti-6%Al-4%V (bottom) alloys, respectively.
Crystals 10 00181 g001
Figure 2. The polarization curves obtained for (1) Ti-6%Al and (2) Ti-6%Al-4%V alloys after the immersion in 3.5% NaCl solution for 1 h.
Crystals 10 00181 g002
Figure 3. The polarization curves obtained for (1) Ti-6%Al and (2) Ti-6%Al-4%V alloys after their immersions in the chloride solution for 24 h.
Crystals 10 00181 g003
Figure 4. The polarization curves obtained for (1) Ti-6%Al and (2) Ti-6%Al-4%V alloys after their immersions in the chloride solution for 48 h.
Crystals 10 00181 g004
Figure 5. Nyquist plots measured for (1) Ti-6%Al and (2) Ti-6%Al-4%V alloys after immersion in 3.5% NaCl solution for 1 h.
Crystals 10 00181 g005
Figure 6. Nyquist plots measured for (1) Ti-6%Al and (2) Ti-6%Al-4%V alloys after immersion in 3.5% NaCl solution for 24 h.
Crystals 10 00181 g006
Figure 7. Nyquist plots measured for (1) Ti-6%Al and (2) Ti-6%Al-4%V alloys after immersion in 3.5% NaCl solution for 48 h.
Crystals 10 00181 g007
Figure 8. The circuit that fits impedance plots represented in Figure 5, Figure 6 and Figure 7.
Crystals 10 00181 g008
Figure 9. Change of current with time at 300 mV for (1) Ti-6%Al and (2) Ti-6%Al-4%V alloys after immersion in 3.5% NaCl solution for 1 h.
Crystals 10 00181 g009
Figure 10. Change of current with time at 300 mV for (1) Ti-6%Al and (2) Ti-6%Al-4%V alloys after immersion in 3.5% NaCl solution for 24 h.
Crystals 10 00181 g010
Figure 11. Change of current with time at 300 mV for (1) Ti-6%Al and (2) Ti-6%Al-4%V alloys after immersion in 3.5% NaCl solution for 48 h.
Crystals 10 00181 g011
Figure 12. (a) SEM and (b) EDX analysis for the surface of sintered Ti-6%Al alloy before its immersion; (c) SEM and (d) EDX analysis for the surface of the corroded Ti-6%Al alloy that was immersed in 3.5% NaCl solution for 48 h before stepping the potential at 300 mV for 30 min.
Crystals 10 00181 g012
Figure 13. (a) SEM and (b) EDX analysis for the surface of sintered Ti-6%Al-4%V alloy before its immersion; (c) SEM and (d) EDX analysis for the surface of the corroded Ti-6%Al-4%V alloy that was immersed in 3.5% NaCl solution for 48 h before stepping the potential at 300 mV for 30 min.
Crystals 10 00181 g013
Table 1. Polarization data for the Ti alloys after immersion in 3.5% NaCl solution for various periods of time.
Alloy/TimeParameter
βc/mV.dec−1ECorr/mVβa/mV.dec−1jCorr/µA.cm−2Rp/Ω.cm2RCorr/mpy
Ti-6%Al/1 h105−3301304.30587.30.3743
Ti-6%Al-4%V/1 h90−380820.2284800.0192
Ti-6%Al/24 h110−2801251.5416520.1341
Ti-6%Al-4%V/24 h105−3401100.1713,7390.0148
Ti-6%Al/48 h115−3101350.5648210.0487
Ti-6%Al-4%V/48 h115−4001250.1517,3610.0131
Table 2. Impedance parameters for the tested alloys.
Alloy/TimeImpedance Data
RS/Ω cm2QRP1/Ω cm2Cdl/F cm2RP2/Ω cm2
YQ/S*s^nn
Ti-6%Al/1 h15.250.0025730.424400.00322545
Ti-6%Al-4%V/1 h19.910.0001120.736090.000185497
Ti-6%Al/24 h17.820.0023940.434610.00569602
Ti-6%Al-4%V/24 h21.070.0006780.789810.000196185
Ti-6%Al/48 h20.610.0023460.475370.00616743
Ti-6%Al-4%V/48 h24.580.0001260.7742030.000128035

