Abstract
Owing to their superior biocompatibility, titanium and its alloys are often the first choice for implant materials in biomedical applications, especially for dental and bone repairs (orthodontics and prosthodontics). Titanium has low density and shows good mechanical and chemical properties. Although Ti-6Al-4V alloy exhibits excellent corrosion resistance properties, the metal ions released during corrosion are likely to induce aseptic loosening in long-term implantations. In the present study, Ti-6Al-4V alloy was subjected to two specific heat treatments, namely, air cooling and water quenching. The potentiodynamic polarization and electrochemical impedance spectroscopy measurements revealed remarkable improvement in the corrosion resistance properties of the heat-treated specimens. The presence of the β phase is a plausible reason for the improvement. Scanning electron microscopy, X-ray diffraction phase composition analysis, and microstructural characterization were performed to confirm the presence of the β phase.
1. Introduction
Titanium alloys are used in orthopedic applications owing to their good biocompatibility, appropriate mechanical properties, and excellent corrosion resistance [1]. Although pure titanium is a strong material, its mechanical and chemical properties can be further enhanced by the addition of alloying elements. Extensive research into titanium alloy systems in the early 1950s resulted in the discovery of several alloys, the most important of which is Ti-6Al-4V [2]. The presence of nonreactive passive films on the surface of these alloys is an important factor for their corrosion resistance. The corrosion resistance of titanium alloys is superior to that of other implant materials such as stainless steel and alloys based on cobalt–chromium [3,4]. Ti-6Al-4V alloy possesses an exceptional strength to weight ratio and good mechanical properties. The main drawback of metallic biomaterials is their degradation upon interaction with body fluids [5]. Materials for conventional metallic implants are hence selected based on their corrosion resistance, i.e., their ability to generate protective passive films. Ti-6Al-4V alloy shows excellent corrosion resistance due to the thermodynamic stability of TiO2. The formation of various other oxides on the surface of Ti-6Al-4V has also been reported [6]. Although Ti-6Al-4V has several advantages, it suffers from high reactivity. Its surface properties can be improved by various surface treatments. Ti-6Al-4V alloy responds to a variety of heat treatments. In some previous studies [7,8], it was observed that the corrosion resistance properties of Ti-6Al-4V improved with heat treatment, in both the Ringer’s and simulated body fluid (SBF) solutions.
Heat treatment affects the properties of titanium and titanium alloys differently, depending on the composition of the alloying elements and the effects of heat on α–β crystal transformation. There are various types of titanium alloys designed for different purposes, each of which has its own heat treatment cycle and scheme, depending on the composition [9]. Some previously reported works have shown that hot tensile strength increased in water-quenched (WQ) samples relative to the air-cooled (AC) and furnace-cooled samples. However, the differences in wear resistance among all the samples were not significant [10].
Other researchers have reported that the mechanical properties of Ti-6Al-4V alloy, including its impact toughness and microstructure, can be affected by the type of heat treatment and the aging period. They achieved significant improvement in both ultimate tensile and yield strengths through heat treatment at 960 °C for 1 h, followed by water quenching and heat treatment at 500 °C for 4 h and further air cooling. After solution and aging treatments, the obtained microstructure consisted of β-phase matrix and α-phase precipitation. These α- and β-phase alloys had a lamellar structure consisting of fine plexiform needles that improved the chemical and mechanical properties [11]. When the grain size was increased by adjusting the heat treatment conditions, the needle-shaped α′-martensite phase disappeared completely, while both plate-shaped α′-martensite phase and lamellar α + β mixture formed continuously [12]. The corrosion resistance was also influenced by the change in grain size. It was reported in many works that by rapidly cooling Ti-6Al-4V after the solution treatment, it is possible to retain the β phase in the alloy by mitigating the diffusional process. It is also possible to make the β phase undergo martensitic transformation during cooling via thermal transformation. Therefore, it is expected that the mechanical properties of the alloy can be considerably modified by solution treatment at high temperatures in the α + β region followed by rapid cooling [13,14,15]. The corrosion resistance of Ti-6Al-4V can hence be improved by heat treatment. In the present study, Ti-6Al-4V alloy was subjected to two specific heat treatments, namely, air cooling and water quenching, to obtain the β phase. X-ray diffraction (XRD) and scanning electron microscopy (SEM) characterization were performed to identify the phases formed after heat treatment. The electrochemical corrosion behavior of the heat-treated alloys was characterized in Ringer’s solution via potentiodynamic polarization measurements and electrochemical impedance spectroscopy (EIS).
2. Materials and Methods
2.1. Sample Preparation
Commercially available Ti-6Al-4V alloy was obtained from Tata Steel Ltd., Jamshedpur, India. The chemical composition of the as-received alloy is presented in Table 1. The as-received samples were machined as per the requirements of the tests, and properly polished using 120, 180, 1/0, and 2/0 grade emery paper, followed by cleaning with acetone in a sonication bath. The samples were then subjected to further treatment.

Table 1.
Chemical composition of as-received Ti-6Al-4V sample.
2.2. Heat Treatment of Ti-6Al-4V Alloy
Ti-6Al-4V alloy is an α–β mixed phase alloy that responds to various heat treatment processes. In the present study, two heat treatment techniques were used. The samples were heated to 1050 °C in a muffle furnace and put aside for 30 min. After that, the samples were either WQ in the first heat treatment technique or AC in the second.
2.3. Microstructure
Heat-treated (WQ and AC) samples were mirror polished using different grades of emery papers and a cloth polisher using alumina solution. The samples were then etched with Keller’s reagent solution (3 mL hydrochloric acid, 2 mL hydrofluoric acid, 190 mL distilled water, and 5 mL nitric acid) [16]. After etching, the microstructures were observed with an optical microscope (Olympus BX51M, Tokyo, Japan) under 20× magnification. The obtained micrographs for both the WQ and AC samples are shown in Figure 1.
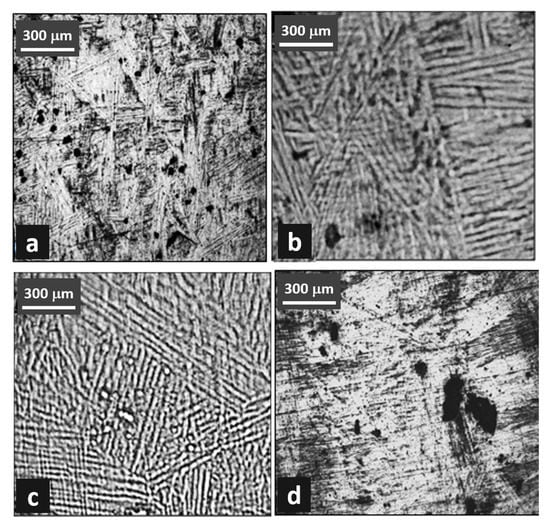
Figure 1.
Microstructure of Ti-6Al-4V alloy. (a,b) water quenched, and (c,d) air cooled.
2.4. XRD Analysis
X-ray diffractometer (D8, BRUKER, Karlsruhe, Germany) was used to identify the different phases in the deposits. The phase analysis, peaks identification and crystallinity determination were performed at a wavelength of 0.154059 nm using Kβ filtered CuKα monochromatic X-ray radiation and a tube current of 15 mA and voltage of 30 kV. The XRD patterns were recorded in the 2θ range from 30° to 80° at a scan speed of 1°/min. The XRD spectra of the heat-treated samples are shown in Figure 2, and the XRD analysis in Table 2.
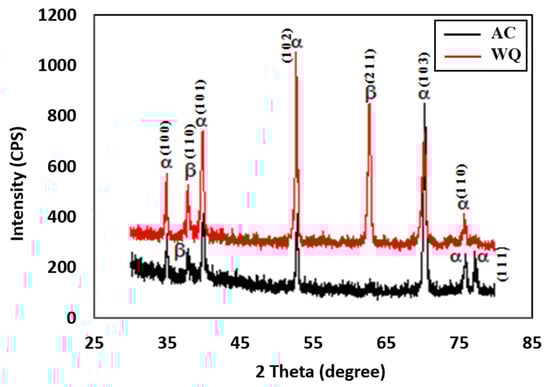
Figure 2.
XRD spectra of WQ and AC samples.
Table 2.
XRD analysis.
2.5. Corrosion Rate Measurement
Electrochemical polarization measurements were performed using a standard corrosion cell on a standard specimen surface (flat metal). The polarization experiments were performed using an Autolab potentiostat (PGSTAT302N, Metrohm, Amsterdam, The Netherlands) with a standard three-electrode system. The three-electrode cell consisted of a graphite counter electrode, reference electrode, and working electrode (specimen). The icorr and Ecorr measurements were performed using Tafel extrapolation technique at a potentiodynamic scan rate of 1 mV/s. All the polarization measurements were performed in Ringer’s solution comprising 8.6 g NaCl, 0.3 g KCl, and 0.33 g CaCl2 in distilled water (these figures represent a 1000 mL, pH 7.0 solution). The polarization curve is given in Figure 3, and the corrosion data in Table 3.
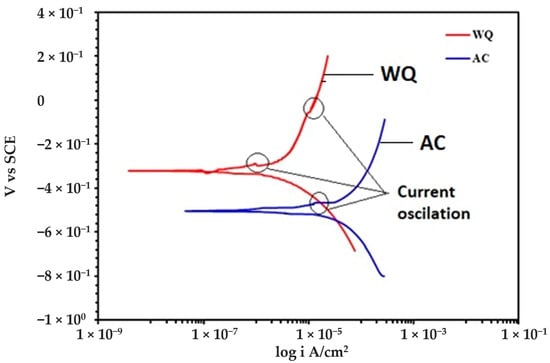
Figure 3.
Potentiodynamic polarization curves of heat-treated Ti-6Al-4V alloys in Ringer’s solution.
Table 3.
Icorr and Ecorr values of heat-treated Ti-6Al-4V alloy in Ringer’s solution.
2.6. Electrochemical Impedance Spectroscopy
A three-electrode corrosion cell attached to the previous Autolab was used for the EIS measuremen ts. An AC voltage of 10 mV root-mean-squared was used to run the impedance experiments, while 1 V DC was used for saturated calomel electrode (SCE) at 10 cycles per decade in the frequency range from 0.01 Hz to 300 kHz. At each frequency, the phase angles and absolute impedance were recorded, and the Bode plots and Nyquist diagrams were obtained. An appropriate equivalent electrical circuit was formed from both the real and imaginary components of the collected impedance data using a simple fit model [17]. In this study, most of the samples conformed to the Constant Phase Element (CPE) model [18]. The polarization resistance (Rp), solution resistance (Ru), capacitance (Yo), and α were obtained from the EIS curves as presented in Figure 4 and Figure 5 and tabulated in Table 4. α is an exponent that is equal to 1 for a capacitor, and less than 1 for a CPE.
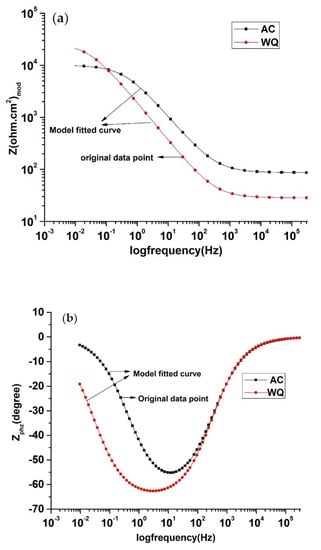
Figure 4.
EIS Bode plot of AC and WQ Ti-6Al-4V alloy in Ringer’s solution: (a) Zmod (Ω.cm2) and (b) Zphz (˚).
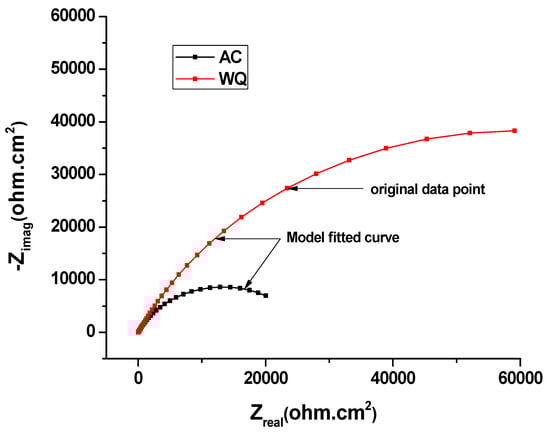
Figure 5.
EIS Nyquist plot of AC and WQ Ti-6Al-4V alloy in Ringer’s solution.
Table 4.
EIS data of heat-treated Ti-6Al-4V alloy in Ringer’s solution.
3. Results and Discussions
Figure 1 shows the optical images of the microstructures in the longitudinal sections of the heat-treated samples. The β grains are nominally equiaxed and have low-curvature boundaries. An acicular and fine intergranular α phase exists within most of the grains, as shown clearly in Figure 1b. There are two type of bands noticed here, the first is made of small equiaxed subgrains (approximately 2 μm), and the other were 20- to 30-μm wide elongated bands. It was hypothesized that the elongated features parallel to the bar axis formed by the rolling and rapid cooling. The solutionized and quenched Ti-6Al-4V alloy produced equiaxed β grains of approximately 50 μm width. The grain boundaries were revealed using aggressive etchant, which formed some corrosion pits on the alloy surface.
The XRD spectra presented in Figure 2 confirm the presence of several α phases and a smaller number of β phases for both samples. The peaks were relatively weaker in the WQ sample. The XRD spectrum of the WQ sample showed several high-intensity peaks corresponding to the (1 0 0), (1 0 1), (1 0 3), (1 0 2), and (1 1 0) planes of the α phase of Ti-6Al-4V, with the most prominent peak at the 2θ angle of approximately 52.82°, corresponding to the (1 0 2) plane. For the β phase, the XRD peaks corresponded to the (1 1 0) and (2 1 1) planes, with the most prominent peak at the 2θ angle of approximately 69.478°, corresponding to the (2 1 1) plane of the WQ sample. For the AC sample, the high-intensity α phase peaks corresponded to the (1 0 0), (1 0 1), (1 0 3), (1 0 2), and (1 1 0) planes, with the most prominent peak at the 2θ angle of approximately 70.46°, corresponding to the (1 0 3) plane. The high-intensity β phase peaks corresponded to the (2 0 0) and (1 1 0) planes, with the most prominent peak at the 2θ angle of approximately 38.388˚, corresponding to the (1 1 0) plane. All the peaks in the XRD spectra of the heat-treated alloys (Figure 3) were similar to those in the Joint Committee on Powder Diffraction Standards (JCPDS) card numbers 44-1294 (α Ti) and 44-1288 (β Ti). Both samples (AC and WQ) hence consisted of α and β phase Ti, although the intensity (% I/I0) of the β phase in the AC sample was much lower compared to the WQ sample. The corrosion resistance of the AC sample was thus lower compared to the WQ sample.
The potentiodynamic curves of the alloy in Ringer’s solution are presented in Figure 3. Both samples (AC and WQ) followed a similar anodic polarization trend. The Ecorr and icorr values obtained from the curves (Figure 3) are tabulated in Table 3. It is evident from the results that the AC sample was more susceptible to corrosion compared to the WQ sample. A small passive region that appeared after the active dissolution region within the potential range from −0.35 to −0.10 V vs. SCE was present. This passive region resulted from the electrochemical dissolution of the alloy surface and the formation of nonstoichiometric titanium oxides that slowed the dissolution process, i.e.,
Ti3+ + xH2O → TiOx + 2xH+ + (2x−3)e−
Both the AC and WQ alloys reached their respective stable passive current densities as the potential increased. The partial stabilization of the passive current densities implies the formation of protective passive films. Small oscillations of the current density were observed in this region, which may be related to the consecutive formation and repassivation of microsized pits, commonly called “metastable pits”. At approximately 1260 mV (SCE), the current density started to increase slowly with the potential. This can be attributed to the solution oxidation (oxygen evolution) that took place via electron transfer across the oxide.
The WQ sample exhibited a lower icorr value (2 × 10⁻⁷ A/cm2). However, there was not much improvement in the Ecorr value (–0.322 V) of the heat-treated sample. Furthermore, the icorr value of the heat-treated Ti-6Al-4V alloy in this work was higher than the values reported in previous studies using Ringer’s solution [19,20]. In those studies, the icorr value improved after heat treatment, while the Ecorr values were not affected. This type of behavior was attributed to the sample microstructure (Figure 1a–d). The microstructure showed a clear lamellar structure, similar to an α–β alloy. This demonstrated the heat treatment enrichment of the β phase that is responsible for the improved corrosion resistance. The positive effect of microstructural features such as β phase in improving the associated electrochemical properties of the alloy was also reported in (Ti-Zr)-1.5Mo-3Sn alloy [21].
The obtained EIS data were modelled on the basis of the CPE circuit shown in the inset of Figure 6. The equivalent circuit of Ru (Rp Y0α) was used. This equivalent circuit provided the best fitting on the basis of the least (Chi-Squared) values for both WQ and AC samples. In the equivalent circuit, Ru and Rp referred to the uncompensated solution resistance of the test electrolyte and the polarization resistance between metal and electrolyte, respectively.
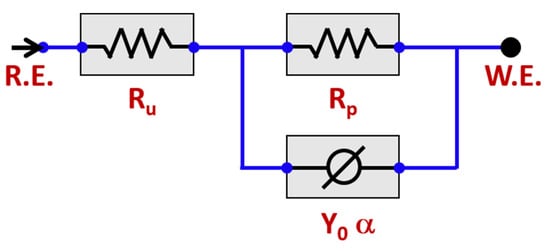
Figure 6.
Equivalent circuit model (ECM) employed to fit the impedance data.
To examine the surface properties of the two samples, EIS was performed (Figure 4). A close examination of the EIS data (Table 4) revealed that the WQ sample exhibited both higher Rp (65.93 kΩ.cm2) and Ru (35.52 kΩ.cm2) values than the AC sample. In both cases, the Nyquist plots were almost semicircular (Figure 5), which is characteristic of a capacitor [22]. In the WQ sample, the semicircle reached 20 kΩ in its mid region, whereas in the AC sample, the top of the semicircle was near 6 kΩ. Moreover, the end of the semicircle of the WQ sample plot reached 60 kΩ on the x-axis. This indicated a higher Rp value in the WQ sample, which was also supported by the obtained EIS value. The Bode magnitude plots of the two samples showed two distinct regions. In the higher frequency region, the Bode magnitude plots exhibited constant log |Z| values and phase angles near 0° with the variation of log(f). This is due to the solution resistance response, and it indicates the good solution resistance of all the samples. In the broad low- and middle-frequency range (1 kHz–100 mHz), the spectra displayed linear slopes of about −1. This is the characteristic response of a capacitive behavior in the surface film [23,24]. In the Bode phase plot (Figure 4b), the phase angles of the samples dropped slightly towards lower values in the low-frequency region because of the surface film resistance contribution to the impedance.
The Nyquist and Bode plots of both samples showed an increase in the low frequency impedance with time. The phase angle in the intermediate frequency region increased with time. This evolution indicated the formation and growth of protective passive films. Moreover, there was a significant increase in the low frequency impedance in the WQ sample. Therefore, the WQ sample offered better conditions for the formation of passive film with better protection. The sample Raman spectra are shown in Figure 7. The WQ sample showed better passive behavior than the AC sample because of the presence of a more stable protective oxide film. The film consisted mainly of TiO2 in the rutile phase. The microstructure of both samples (AC and WQ) consisted mainly of the α and β phases. The XRD intensity (% I/I0) of the β phase in the AC sample was much lower compared to the WQ sample. It is hence plausible that the higher volume fraction of α phase in the AC sample led to its poorer corrosion resistance compared to the WQ sample.
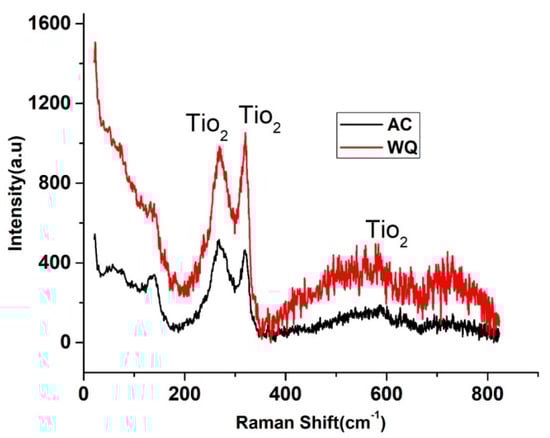
Figure 7.
Raman spectra of WQ (upper) and AC specimens (lower).
The surface morphologies of the AC- and WQ-treated Ti alloy after electrochemical measurement in Ringer’s solution are shown in Figure 8. Many pits were observed over the entire surface of the AC-treated sample, whereas a few were found on the surface of the WQ-treated Ti alloy. Therefore, the AC- and WQ-treated Ti alloy can degrade via pitting and uniform corrosion in Ringer’s solution, which is in good agreement with the polarization data. The pitting corrosion caused defects on the surface, as shown in Figure 8a,b. In general, pitting corrosion occurs in three stages: passivity breakdown, pit initiation, and pit propagation. Penetration and passive film breakdown due to pitting in our samples was observed. As shown in Figure 8, it was observed that in the AC sample, pits are more likely to occur near pits propagating along a groove. As the pits propagated, a honeycomb-like pit structure formed on the alloy surface due to the increasing number and size of the pits. Pit combination tends to develop along the directions of the grooves, resulting in large active cells and the dissolution of the oxide layer. For the WQ sample, flake-type corrosion products were formed.
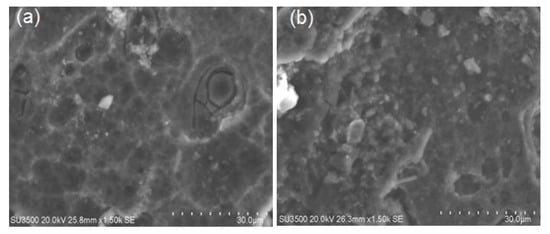
Figure 8.
SEM images of (a) AC and (b) WQ Ti-6Al-4V alloy in Ringer’s solution after potentiodynamic polarization.
Although the entire surface of the sample remained intact, local corrosion damage including cracks and voids were observed, as shown in Figure 7. The local corrosion-induced cracks and voids occurred because of localized passive film deterioration. This destruction of the passive film can cause corrosive solutions to easily invade the interior of the material, resulting in pitting corrosion. Many previous studies reported on corrosion pits in metals and alloys attributed to chemical or physical heterogeneity on the metal surface due to inclusions, second phase particles, flaws, mechanical damage, and dislocations. For instance, the trends observed in our study for pitting corrosion damage were also seen in composite materials [25] where the roughness of the Ti phase resulted in the formation of cracks and pits at the interfacial region.
4. Conclusions
Heat treatment has a positive effect on the corrosion resistance of Ti-6Al-4V alloy. Although there was no improvement in the Ecorr value, heat treatment resulted in a marked improvement in the icorr value. The improvement in corrosion resistance is due to the presence of the β phase. The WQ sample, therefore, has better corrosion resistance compared to the AC sample. The surface property improvement due to the β phase is also supported by the EIS data. The presence of the β phase was confirmed by the XRD phase composition analysis results, which are consistent with the microstructural characterization results.
In addition, the surface morphology of the Ti-6Al-4V alloy after long-term immersion in Ringer’s solution was also investigated by SEM characterization. It was found that, in general, the passive film formed on the surface remained intact, providing significant passivation and corrosion resistance to the substrate.
Author Contributions
Conceptualization, A.H.S., A.S., and H.S.A.; methodology, M.L., J.A.M., A.S., and M.F.I.; validation, A.S., M.L., M.F.I., and A.H.S.; formal analysis, A.S., S.A.R., and M.F.I.; investigation, H.S.A.; resources, A.H.S.; data curation, M.L., S.A.R., and J.A.M.; writing—original draft preparation, A.S., A.H.S., and H.S.A.; writing—review and editing, H.S.A. and A.S.; supervision, H.S.A. and A.H.S.; project administration, A.H.S. and H.S.A.; funding acquisition, A.H.S. All authors have read and agreed to the published version of the manuscript.
Funding
The authors would like to extend their sincere appreciation to the Deanship of Scientific Research at King Saud University for its funding of this research through the Research Group Project No. RG-1439-029.
Conflicts of Interest
The authors declare no conflict of interest.
References
- Jacobs, J.J.; Gilbert, J.L.; Urban, R.M. Corrosion of metal orthopaedic implants. J. Bone Jt. Surg. Ser. A 1998, 80, 268. [Google Scholar] [CrossRef]
- Jon Goldberg, A.; Kuhn, L.T. Biomaterials. In Regenerative Engineering; Laurencin, C., Khan, Y., Eds.; Taylor and Francis Group: Oxfordshire, UK, 2012; p. 30. ISBN 9781482216837. [Google Scholar]
- Aragon, P.J.; Hulbert, S.F. Corrosion of Ti-6Al-4V in simulated body fluids and bovine plasma. J. Biomed. Mater. Res. 1972, 8, 155. [Google Scholar] [CrossRef] [PubMed]
- Mueller, H.J.; Greener, E.H. Polarization studies of surgical materials in ringer’s solution. J. Biomed. Mater. Res. 1970, 1, 4–29. [Google Scholar] [CrossRef] [PubMed]
- López, M.F.; Gutiérrez, A.; Jiménez, J.A. In vitro corrosion behaviour of titanium alloys without vanadium. Electrochim. Acta 2002, 47, 1359–1360. [Google Scholar] [CrossRef]
- Singh, R.; Dahotre, N.B. Corrosion degradation and prevention by surface modification of biometallic materials. J. Mater. Sci. Mater. Med. 2007, 18, 731–732. [Google Scholar] [CrossRef]
- Nikolova, M.P.; Yankov, E.H. Corrosion study of Ti5Al4V and Ti6Al4V in different simulated body fluids. In Materials Design and Applications II; Springer: New York, NJ, USA, 2019; pp. 39–58. [Google Scholar]
- Mareci, D.; Chelariu, R.; Gordin, D.M.; Ungureanu, G.; Gloriant, T. Comparative corrosion study of Ti-Ta alloys for dental applications. Acta Biomater. 2009, 5, 3625–3639. [Google Scholar] [CrossRef]
- Donachie, M.J., Jr. Heat treating titnium and its alloys. In Heat Treating in Titanium: A Technical Guide; ASM International: Cleveland, OH, USA, 2016; pp. 511–534. [Google Scholar]
- El-Hadad, S.; Nady, M.; Khalifa, W.; Shash, A. Influence of heat treatment conditions on the mechanical properties of Ti–6Al–4V alloy. Can. J. Metall. Mater. Sci. 2018, 57, 186–193. [Google Scholar] [CrossRef]
- Liu, W.; Lin, Y.; Chen, Y.; Shi, T.; Singh, A. Effect of Different Heat Treatments on Microstructure and Mechanical Properties of Ti6Al4V Titanium Alloy. Xiyou Jinshu Cailiao Yu Gongcheng/Rare Met. Mater. Eng. 2017, 46, 634–639. [Google Scholar]
- Dai, N.; Zhang, J.; Chen, Y.; Zhang, L.C. Heat Treatment Degrading the Corrosion Resistance of Selective Laser Melted Ti-6Al-4V Alloy. J. Electrochem. Soc. 2017, 146, 428–435. [Google Scholar] [CrossRef]
- Nong, Z.S.; Zhu, J.C.; Yu, H.L.; Lai, Z.H. First principles calculation of intermetallic compounds in FeTiCoNiVCrMnCuAl system high entropy alloy. Trans. Nonferrous Met. Soc. China 2012, 22, 1437–1444. [Google Scholar] [CrossRef]
- Mondal, D.P.; Jha, N.; Badkul, A.; Das, S. Effect of Al-TiB master alloy addition on microstructure, wear and compressive deformation behaviour of aluminum alloys. Trans. Nonferrous Met. Soc. China 2012, 22, 1001–1011. [Google Scholar] [CrossRef]
- Seagle, S.R. Titanium/titanum alloys. Adv. Mater. Process. 1993, 1, 1–6. [Google Scholar]
- Zoltan, K.; David, P. Mechanical properties of Ti-6Al-4V samples produced with additive technology. Mater. Today 2018, 5, 26558–26565. [Google Scholar]
- Boukamp, B.A. A Nonlinear Least Squares Fit procedure for analysis of immittance data of electrochemical systems. Solid State Ionics 1986, 20, 31–44. [Google Scholar] [CrossRef]
- Bisquert, J.; Garcia-Belmonte, G.; Bueno, P.; Longo, E.; Bulhões, L.O.S. Impedance of constant phase element (CPE)-blocked diffusion in film electrodes. J. Electroanal. Chem. 1998, 452, 229–234. [Google Scholar] [CrossRef]
- Niinomi, M. Mechanical properties of biomedical titanium alloys. Mater. Sci. Eng. A 1998, 243, 231–236. [Google Scholar] [CrossRef]
- Popa, M.V.; Vasilescu, E.; Drob, P.; Vasilescu, C.; Drob, S.I.; Mareci, D.; Rosca, J.C.M. Corrosion resistance improvement of titanium base alloys. Quim. Nova 2010, 33, 1892–1896. [Google Scholar] [CrossRef]
- Ijaz, M.F.; Vasilescu, C.; Drob, S.I.; Osiceanu, P.; Marcu, M.; Kim, H.Y.; Miyazaki, S.; Gordin, D.M.; Gloriant, T. Electrochemical characterization of the superelastic (Ti-Zr)-Mo-Sn biomedical alloy displaying a large recovery strain. Mater. Corros. 2017, 68, 1220–1227. [Google Scholar] [CrossRef]
- Heakal, F.E.T.; Awad, K.A. Electrochemical corrosion and passivation behavior of titanium and its Ti-6AL-4V alloy in low and highly concentrated HBr solutions. Int. J. Electrochem. Sci. 2011, 7, 6539–6554. [Google Scholar]
- Loveday, D.; Peterson, P.; Rodgers, B. Evaluation of organic coatings with electrochemical impedance spectroscopy: Part 1: Fundamentals of electrochemical impedance spectroscopy. CoatingsTech 2004, 2, 7. [Google Scholar]
- Shukla, A.K.; Balasubramaniam, R.; Bhargava, S. Properties of passive film formed on CP titanium, Ti-6Al-4V and Ti-13.4Al-29Nb alloys in simulated human body conditions. Intermetallics 2005, 13, 631–637. [Google Scholar] [CrossRef]
- Kobayashi, E.; Wang, T.J.; Doi, H.; Yoneyama, T.; Hamanaka, H. Mechanical properties and corrosion resistance of Ti-6Al-7Nb alloy dental castings. J. Mater. Sci. Mater. Med. 1998, 9, 567–574. [Google Scholar] [CrossRef] [PubMed]


© 2020 by the authors. Licensee MDPI, Basel, Switzerland. This article is an open access article distributed under the terms and conditions of the Creative Commons Attribution (CC BY) license (http://creativecommons.org/licenses/by/4.0/).