Article

Synthesis, Phase Transition, and Optical Studies of Ba2−xSrxZnWO6 (x = 1.00, 1.25, 1.50, 1.75, 2.00) Tungsten Double Perovskite Oxides

by
Yousef A. Alsabah
1,2,
Mohamad S. AlSalhi
3,*,
Eltayeb M. Mustafa
2,
Abdelrahman A. Elbadawi
2,
Sandhanasamy Devanesan
3 and
Mohamed A. Siddig
2,4
1
Department of Physics, Faculty of Education and Applied Science, Hajjah University, Hajjah 00967, Yemen
2
Department of Physics, Faculty of Science and Technology, Al Neelain University, Khartoum 11111, Sudan
3
Department of Physics and Astronomy, College of Science, King Saud University, P.O. Box -2455, Riyadh 11451, Saudi Arabia
4
Department of physics, Faculty of Science, Albaha University, Al-Baha 61008, Saudi Arabia
*
Author to whom correspondence should be addressed.
Crystals 2020, 10(4), 299; https://doi.org/10.3390/cryst10040299
Submission received: 28 February 2020 / Revised: 10 April 2020 / Accepted: 11 April 2020 / Published: 13 April 2020
(This article belongs to the Section Crystal Engineering)

Abstract

:
Ba2−xSrxZnWO6 double perovskite (DP) oxide compounds (x = 1, 1.25, 1.5, 1.75, 2) were successfully created by means of conventional solid-state techniques. The crystal structures of our series were studied using an X-ray diffractometer. The x = 1 compound has a cubic (Fm-3m) crystal structure, the 1 ≤ x ≤ 2 compounds have tetragonal (I4/m) symmetry, and the phase was transferred to monoclinic (P21/n) symmetry for the Sr2ZnWO6 (x = 2) compound. Scanning electron microscopy (SEM) was used to investigate the morphology of the series, showing that the samples had crystallized microstructures. Molecular bonds were investigated using Fourier transform infrared and Raman spectroscopies, which confirmed the double perovskite octahedral geometry for the samples in our series. Furthermore, the octahedral W–O6 anti-symmetric stretching mode was found to occur. The optical properties of the Ba2−xSrxZnWO6 series were studied using Ultraviolet–visible (UV–vis) diffuse reflectance and photoluminescence (PL) spectroscopies. The absorption edge of the samples appeared around the near-violet and visible spectra, between 336–360 nm. The band gap energy was investigated in two ways—using the absorption cutoff and Tauc plots—which increased from 3.52 to 3.7 eV with increasing substitution of Ba2+ by Sr2+. Furthermore, excitation and emission spectra were collected at room temperature. A broad band at 260–360 nm appeared in the PLE spectra for all samples, and the PL spectra of the samples had a band that spread from 320–450 nm.

Graphical Abstract

1. Introduction

Double perovskite oxides are usually produced from alkaline metals at the A and A’ sites and transition metals at the B and B’ sites [1,2,3]. They exist in the solid state and dissolve in solutions such as Cs2AgBiBr6 [3], KLaMnWO6, NaLaMnWO6, NaNdMnWO6, NaTbMnWO6, NaNdCoWO6, NaNdMgWO6 [4], Sr2Ca1−2xEuxNaxMoO6 [5], and Ba2Zn1−xNixWO6 (0 ≤ x ≤ 1) [6], in which, organic perovskites have organic roots as cations such as CH3NH3SnI3 [7] and CH3NH3PbX3 (X = Cl, Br, and I) [8].
In the crystal structure of an AA`BB`O6 double perovskite oxide, the A and A` cations reside in cuboctahedrons, and B and B` are set at the center of an octahedron. They are mostly arranged in a rock salt cubic (Fm-3m) crystal structure, although they can change to another phase structure (depending on the ionic radii of the A and B cations) and adopt distorted orientations, such as the Dion–Jacobson structure or the Ruddlesden–Popper structure [9,10].
The stability and eventual distortion of the structure can be evaluated by using Goldschmidt’s tolerance factor, which is useful in evaluating the types of oxides in the perovskite. Theoretically, the tolerance factor can be used to estimate the type of crystal structure of the materials. In general, for single perovskites with the ABO3 order, the tolerance factor (t) [3,11] can be written as
t = ( r A + r o ) 2 ( r B + r o ) .
Furthermore, the tolerance factor can be calculated for an A2−xA`xBB`O6 double perovskite series using the following equation [12]:
t = ( 1 ( x 2 ) r A ` ) + x 2 r A ` ` + r o 2   ( r B ` 2 + r B ` ` 2 + r o ) ,
where r A`, rA``, rB`, and rB`` are the ionic radii of the A and B sites, and ro is the ionic radius of oxygen. Depending on the value of t, the crystal structure may be diverse: for t > 1.05, the structure is a hexagonal crystal; for 1.05 > t > 1.00, it is a cubic crystal with a space group (Fm-3m). For 1.00 > t > 0.97, it has a tetragonal (I4/m) structure; and for 0.97 > t, a monoclinic (P21/n) or orthorhombic structure is found [13,14].
The tungsten AA`BB`O6 double perovskite oxide includes Ba, Sr, and Ca as cations in the A and A` sites and tungsten with any transition elements as cations in the B and B` sites. Some examples are Ba2MgWO6 and Ba2ZnWO6 [15], Ba2Zn1−xNixWO6 (0 ≤ x ≤ 1) [16], and Sr2BWO6 (B = Ni, Mg) [17].
The importance of double perovskite materials specially tungsten double perovskite oxide has been evidenced by the extent of their applications, such as in magnetic resonance (Sr2FeMoO6) [17], as superconducting materials (Ba2LaZrO5.5) [18] and photocatalytic materials (A2ZnTiO6; A = Pr, Gd) [19], in microwave communication (Ba2Zn1−xCaxWO6 (x = 0–0.4)) [20], in solar light-harvesting cells (La2NiMnO6) [21], and in photovoltaic applications (Ba2Zn1−xNixWO6; 0 ≤ x ≤ 1) [6].
The wide range of double perovskite oxide compounds is due to their multiplicity and ease of preparation. For example, solid-state reactions have been used as the preparation method for Sr2CaWO6, Sr2MgWO6 [22], and Ba2MeWO6 (Me = Mg, Ni, Zn) [23] compounds, while chemical co-precipitation routes have been used for La2CoMnO6 [24] and Sr2Cd1−xCaxWO6 (0 ≤ x ≤ 1) [25] compounds.
In this study, due to the importance of double perovskite oxides in technological applications throughout diverse fields, in order to contribute to their characterization and properties, as well as to demonstrate the structural phase transition in these type of compounds, a conventional solid-state reaction was used to synthesize a Ba2−x SrxZnWO6 series (where x = 1.00, 1.25, 1.50, 1.75, 2.00). We then employed X-ray diffraction (XRD), scanning electron microscopy (SEM), Raman spectroscopy, Fourier transform infrared spectroscopy (FTIR), UV-vis diffuse reflectance spectroscopy, and photoluminescence spectroscopy to characterize the structural and optical properties of the series.

2. Materials and Experimental

2.1. Preparation of Materials

A solid-state interaction route was used to synthesize Ba2xSrxZnWO6 (x = 0, 0.25, 0.50, 0.75, 1). The series was created from BaCO3, SrCO3, WO3, ZnO, and NiO, with high purity (99.99%) Alfa Aesar powders as raw in-house materials. The Ba2−xSrxZnWO6 (x = 0, 0.25, 0.50, 0.75, 1) samples were weighed in stoichiometric ratios, according to the following chemical equation:
( 2 x ) BaCO 3 + xSrCO 3 + ZnO + WO 3   Ba 2 x Sr x ZnWO 6 + 2 CO 2 ,   ( x = 0 ,   0.25 ,   0.50 ,   0.75 ,   1 ) .
As the first step, the starting materials of the sample were intermixed and powdered in an Agate mortar and pestle with the addition of acetone for 2 h. Then, the samples were put in alumina crucibles and calcined in air using a high-temperature furnace (Eurotherm model 2416 temperature controller, Eurotherm, Worthing, UK) at 800 °C for 24 h. Thereafter, the samples were ground, formed into pellets of disk shape, and calcined in air at 1000 °C for 24 h. Finally, the mixture was ground and calcined at 1200 °C in air for 24 h at a rate of 10 °C per minute during the heating and cooling processes. All samples were ground for 2 h and acetone was added to increase the homogeneity in all previous steps.

2.2. Sample Characterization

XRD was used to investigate the purity and crystallinity of the samples after the heating steps [14]. A Bruker (AXS-D8) diffractometer (Karlsruhe, Germany) [26] was used to collect the data at room temperature using the settings 40 kV and 40 mA with Cu-Kα radiation (λ = 1.54 Å) in 2θ (20–80°) geometry at 0.02 steps per minute. The Fullprof program (Version 3.00, June-2015) was utilized as an analyzer program using the Rietveld refinement method to create the crystal structure parameters. Furthermore, the Debye–Scherrer equation [27] was used to find the particle size of the compounds, as follows:
D ( crystalline size ) = 0.94   λ β cos θ ,
where D is the particle size, λ is the wavelength (1.5405 Å), β is the full width at half maximum (FWHM), and θ is the Bragg angle. In order to remove the contribution from instrumental broadening, the FWHM of the main peak of the sample in XRD traces of the sintered bulk sample was subtracted, as described by β = a2 − b2 (where a and b are the measured FWHM of equivalent diffraction lines in the sample, respectively).
The morphology and homogeneity of the Ba2−xSrxZnWO6 (x = 0, 0.25, 0.50, 0.75, 1) series were revealed using a JEOL JSM-6360 high-resolution Scanning Electron Microscope SEM (Stereo-scan LEO 440, Peabody, MA, USA), which included Energy Dispersive X-Ray Analysis (EDX).
A Satellite FTIR Mattson 5000 (wave number range: 400–4000 cm−1) [28] was utilized to determine the transmittance mode of infrared spectra using samples collected during the KBr condensation process. The material to be analyzed was mixed with KBr at a ratio of 1:100 for FTIR investigation.
A Stellar Net-Inc High-Resolution Raman Spectrometer (Tampa, FL, USA, for 200–2200 cm−1 in 785 nm with 4 cm−1 resolution) was used to record the Raman spectra for the Ba2−xSrxZnWO6 (x = 0, 0.25, 0.50, 0.75, 1) series. A Raman Probe was attached to the FC/APC laser and SMA 905 spectrometer, and integrated Raman was used to collect the Raman filters and optics at a working distance from the sample of 4.5 mm, configured for a 785 nm laser.
The UV–vis diffuse reflectance spectra of the Ba2−xSrxZnWO6 (x = 0, 0.25, 0.50, 0.75, 1) series were compiled using a UV–vis spectrophotometer (Shimadzu, UV-2550, Kyoto, Japan), with BaSO4 as a reference, at room temperature. The UV–vis reflectance spectra were determined at the absorption edge and translated into absorbance using the Kubelka–Munk (KM) equation [29].
F ( R ) = α s = ( 1 R ) 2 2 R ,
where F ( R ) is the KM function, α is the absorption coefficient, s is the scattering coefficient, and R is the reflection coefficient.
The band gap of the Ba2−xSrxZnWO6 (x = 1.00, 1.25, 1.50, 1.75, 2.00) series was determined from the edge of the absorbance by means of the Tauc plot, with the help of the following equation:
[ F ( R ) h ν ) ] n = A ( h ν E g ) ,
where h ν is the incident photon energy, A is a proportional constant, E g is the band gap energy, and n takes a value of 2 or 0.5 for direct or indirect transition, respectively.
The photoluminescence of the Ba2−xSrxZnWO6 (x = 1.00, 1.25, 1.50, 1.75, 2.00) series was studied at room temperature using a PerkinElmer LS55 fluorescence spectrometer (Mundelein, IL, USA).

3. Results and Discussion

3.1. XRD

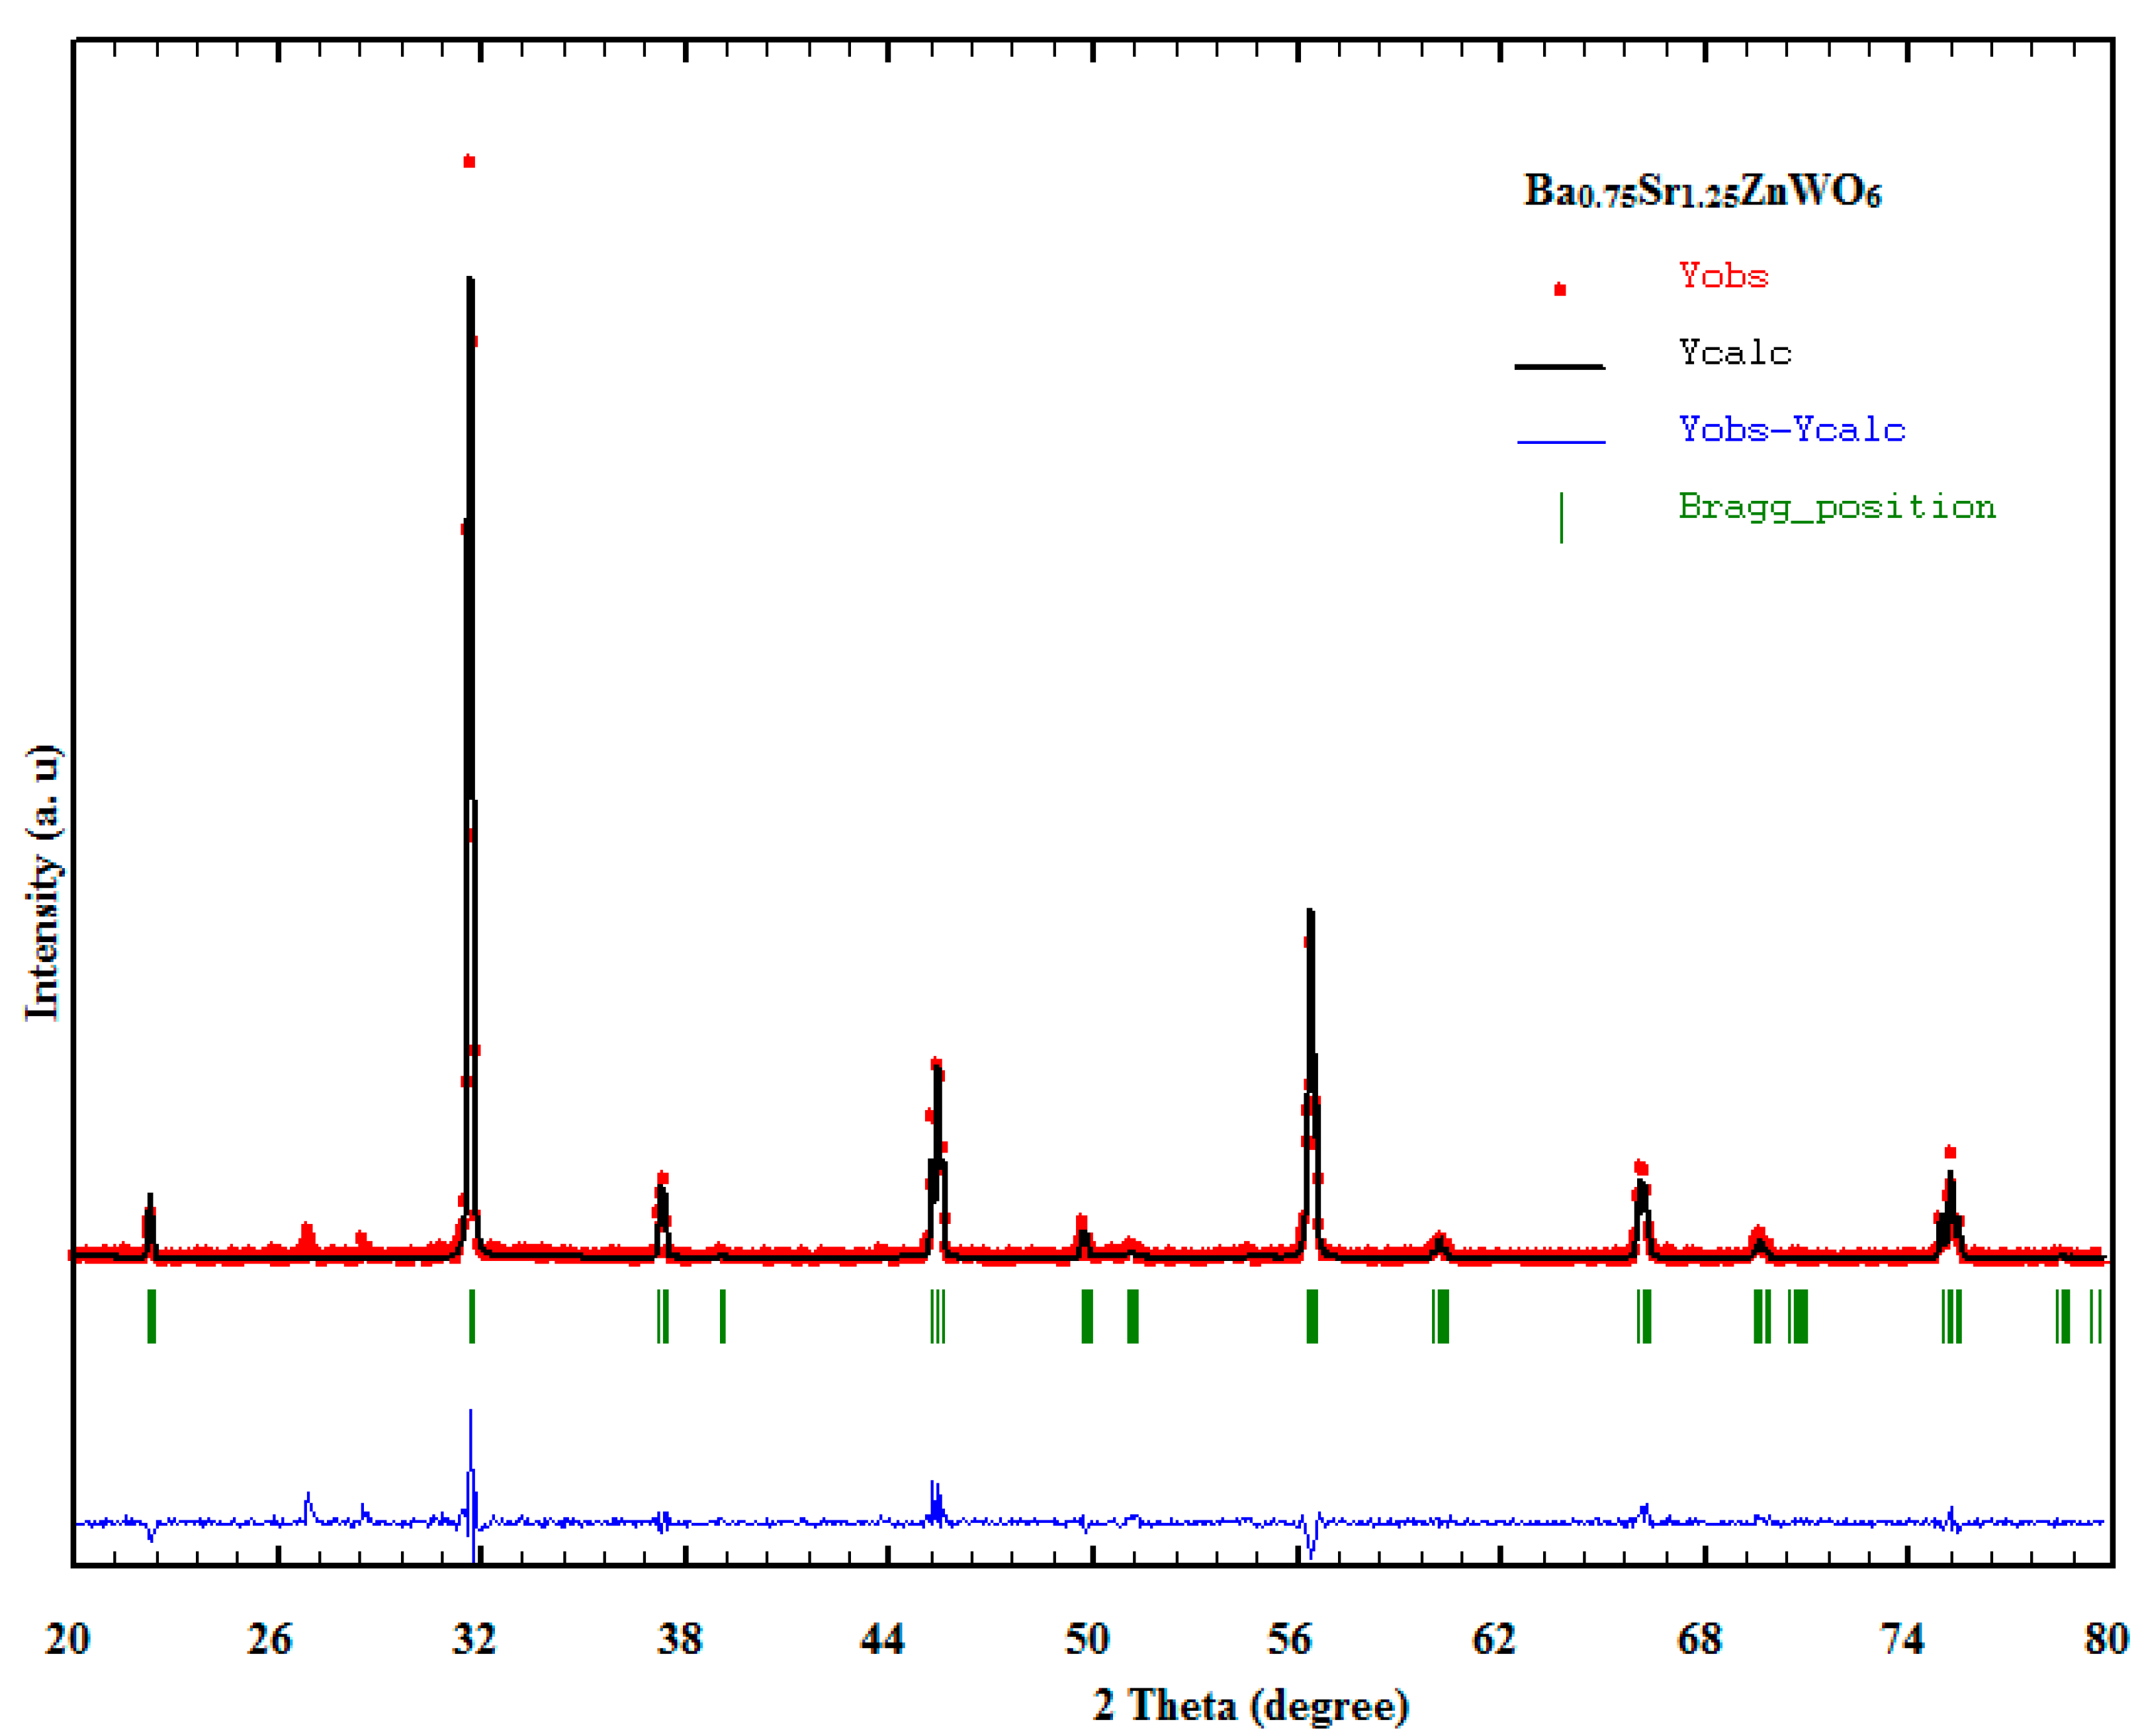
XRD studies are very important in determining a crystal’s structural parameters, such as the lattice crystal, atomic position, lattice parameters, and space group. Studies often refer to the significance of examining a material’s structure, as it governs the other properties of the material [30]. The XRD patterns of the Ba2−xSrxZnWO6 (x = 1.00, 1.25, 1.50, 1.75, 2.00) series, which were created using conventional solid-state reactions, are demonstrated in Figure 1. The BaWO4 and Ba2WO5 phases are found as minor peaks with weak intensities in the XRD pattern, which were ascribed to impurities in the Ba2−xSrxZnWO6 structures around 26° and 28° [31] (indicated in Figure 1 by plus and star signs for BaWO4 and Ba2WO5, respectively). The XRD result of each sample in the series was refined by the Rietveld method, which was applied in the Fullprof program. The Rietveld refinement of the series was observed to be a cubic (Fm-3m) structure for BaSrZnWO6 (x = 1), which transformed into a tetragonal (I4/m) symmetry phase for Ba0.75Sr1.25ZnWO6, Ba0.50Sr1.50ZnWO6 (see Figure 2), and Ba0.25Sr1.75ZnWO6 with compositions in the range of 1 < x < 2. The structure was transformed into a new phase with monoclinic (P21/n) symmetry for Sr2ZnWO6 (x = 2).
The crystalline size was computed from the full width at half maximum (FWHM) at the highest peak of each sample in the series (x = 1, 1.25, 1.50, 1.75, 2.00) using the Scherer equation. The crystalline sizes varied between 57.56 and 84.59 nm for the double perovskite series. The tolerance factor was calculated using equation 2 with ionic radii taking the values 1.45 Å, 0.74 Å, 1.66 Å, 1.21 Å, and 0.74 Å for Sr2+, Zn2+, Ba2+, O2−, and W6+, respectively. The tolerance factor was found to be 0.980 for the cubic crystalline sample when x = 1. In addition, the tolerance factor was found to be between 0.974 and 0.993 for the tetragonal crystalline samples when 1 ≤ x ≤ 2. For the monoclinic sample, the tolerance factor was found to be 0.964 when x = 2.00, in agreement with the SPuDs software and Equation (2). The lattice parameters, tolerance factors, and crystalline sizes of the samples are presented in Table 1. The tolerance factor results were confirmed by the crystal structure determined by XRD refinement (see Figure 3). This indicates that the tolerance factor decreased as the substitution ratio increased, resulting in Ba2+ having an ionic radius that is larger than the Sr2+ ionic radii.
The phase transition for the series is found to occur from cubic to tetragonal and from tetragonal to monoclinic for 1 ≤ x ≤ 2. Manoun et al. [31] found that the phase transition for their samples occurred in similar manner. The difference of our work in terms of preparation process and samples ratios is resulted in different lattice parameters and consequently different unit cell volumes. The unit cell volume is found to decrease gradually with increasing of Sr2+ substituting which is consisted with the lower ionic radius of Sr2+ (1.45 Å) compared to Ba2+ (1.66 Å). In addition, the tetragonal distortion and monoclinic distortion when Ba2+ is completely substituted with Sr2+ is maybe due to the smaller size of Sr2+.
The XRD pattern refinement of samples was carried out by using the cubic (Fm-3 m) crystal, with the starting model taken from a previous study [15]. In this typical model, tungsten (W6+), Zinc (Zn2+), and Barium (Ba2+)/strontium (Sr2+) are located in the 4a (0, 0, 0), 4b (1/2, 1/2, 1/2), and 8c (1/4, 1/4, 1/4) positions, respectively, whereas oxygen (O2−) fills the (0, 0, z) positions. XRD pattern refinement was also carried out using a tetragonal (I4/m) structure, with the starting model taken from previous studies [31,32]. In this model, W6+, Zn2+, and Ba2+/Sr2+ are located at the 2b (0, 0,1/2), 2a (0, 0, 0), and 4d (0, 1/2, 1/4) positions, respectively. There were two crystallographically distinct oxygen atoms (O1(x, y, 0) and O2(0, 0, z)) in the unit cell. For all samples, the refinements of the occupancies of all the atoms revealed no substantial deviations from their stoichiometric standards. Noteworthy residuals of the refinements were acquired, as specified in Table 2.

3.2. SEM and EDX

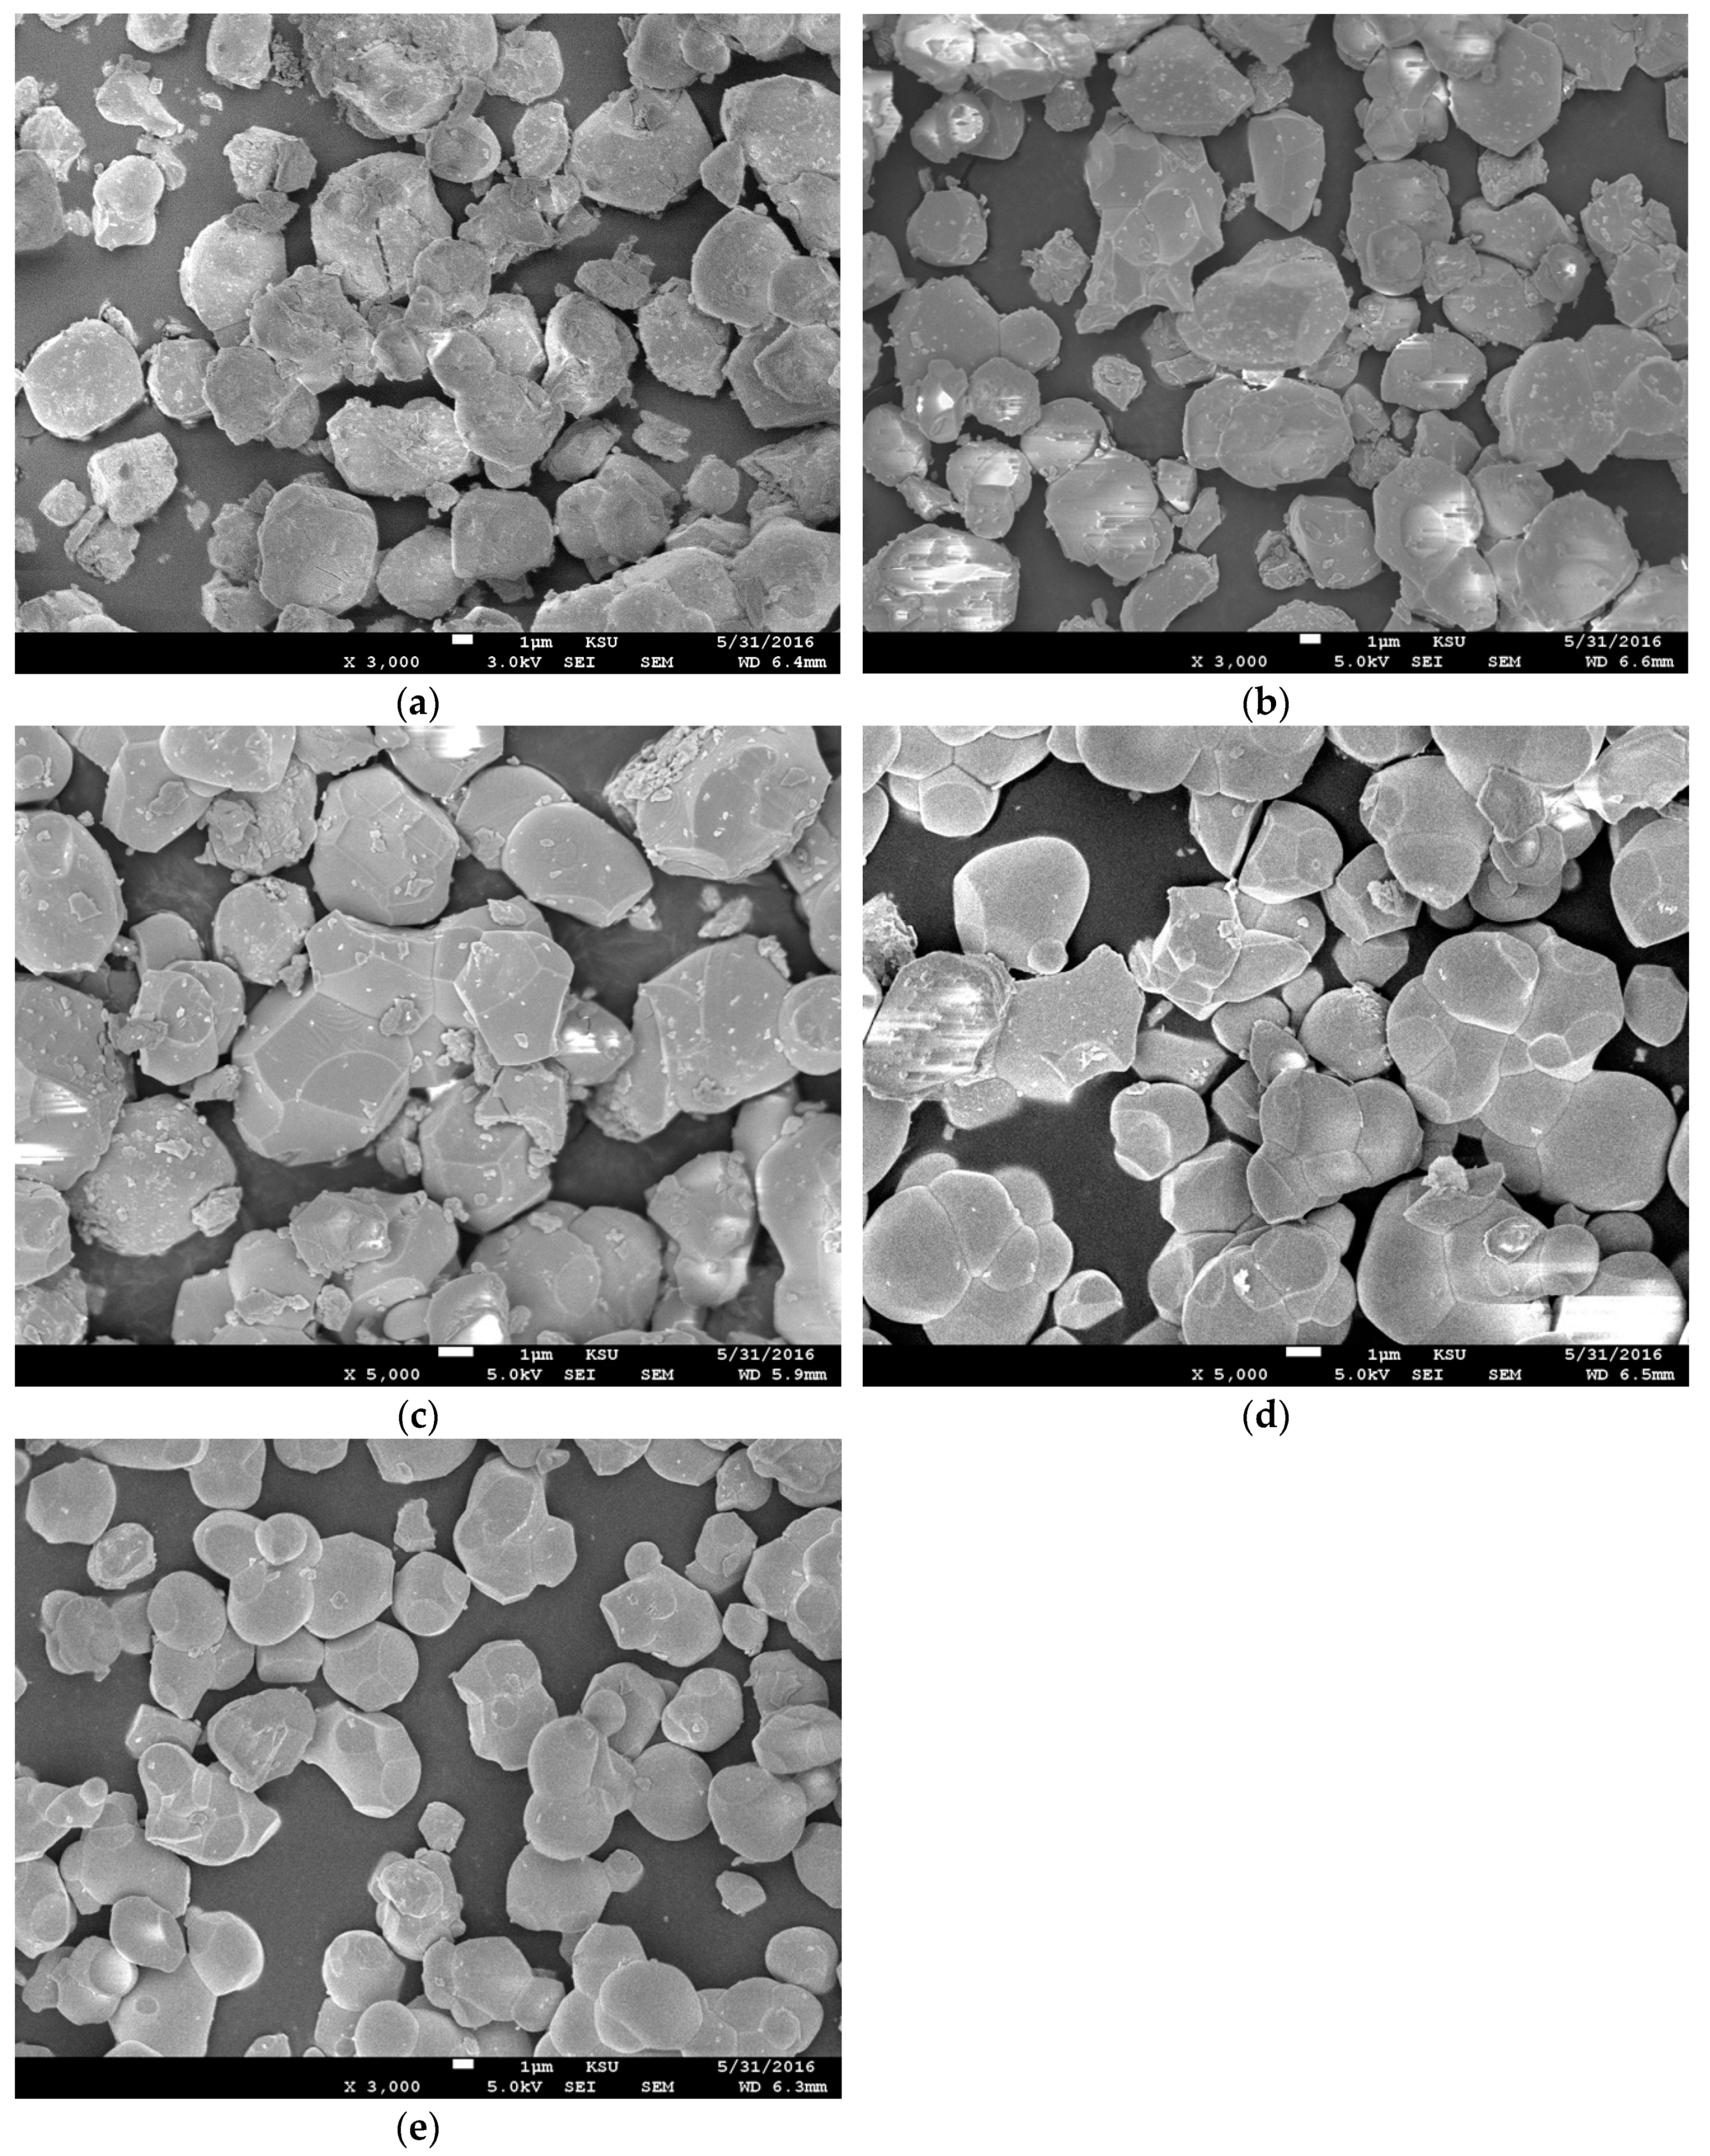
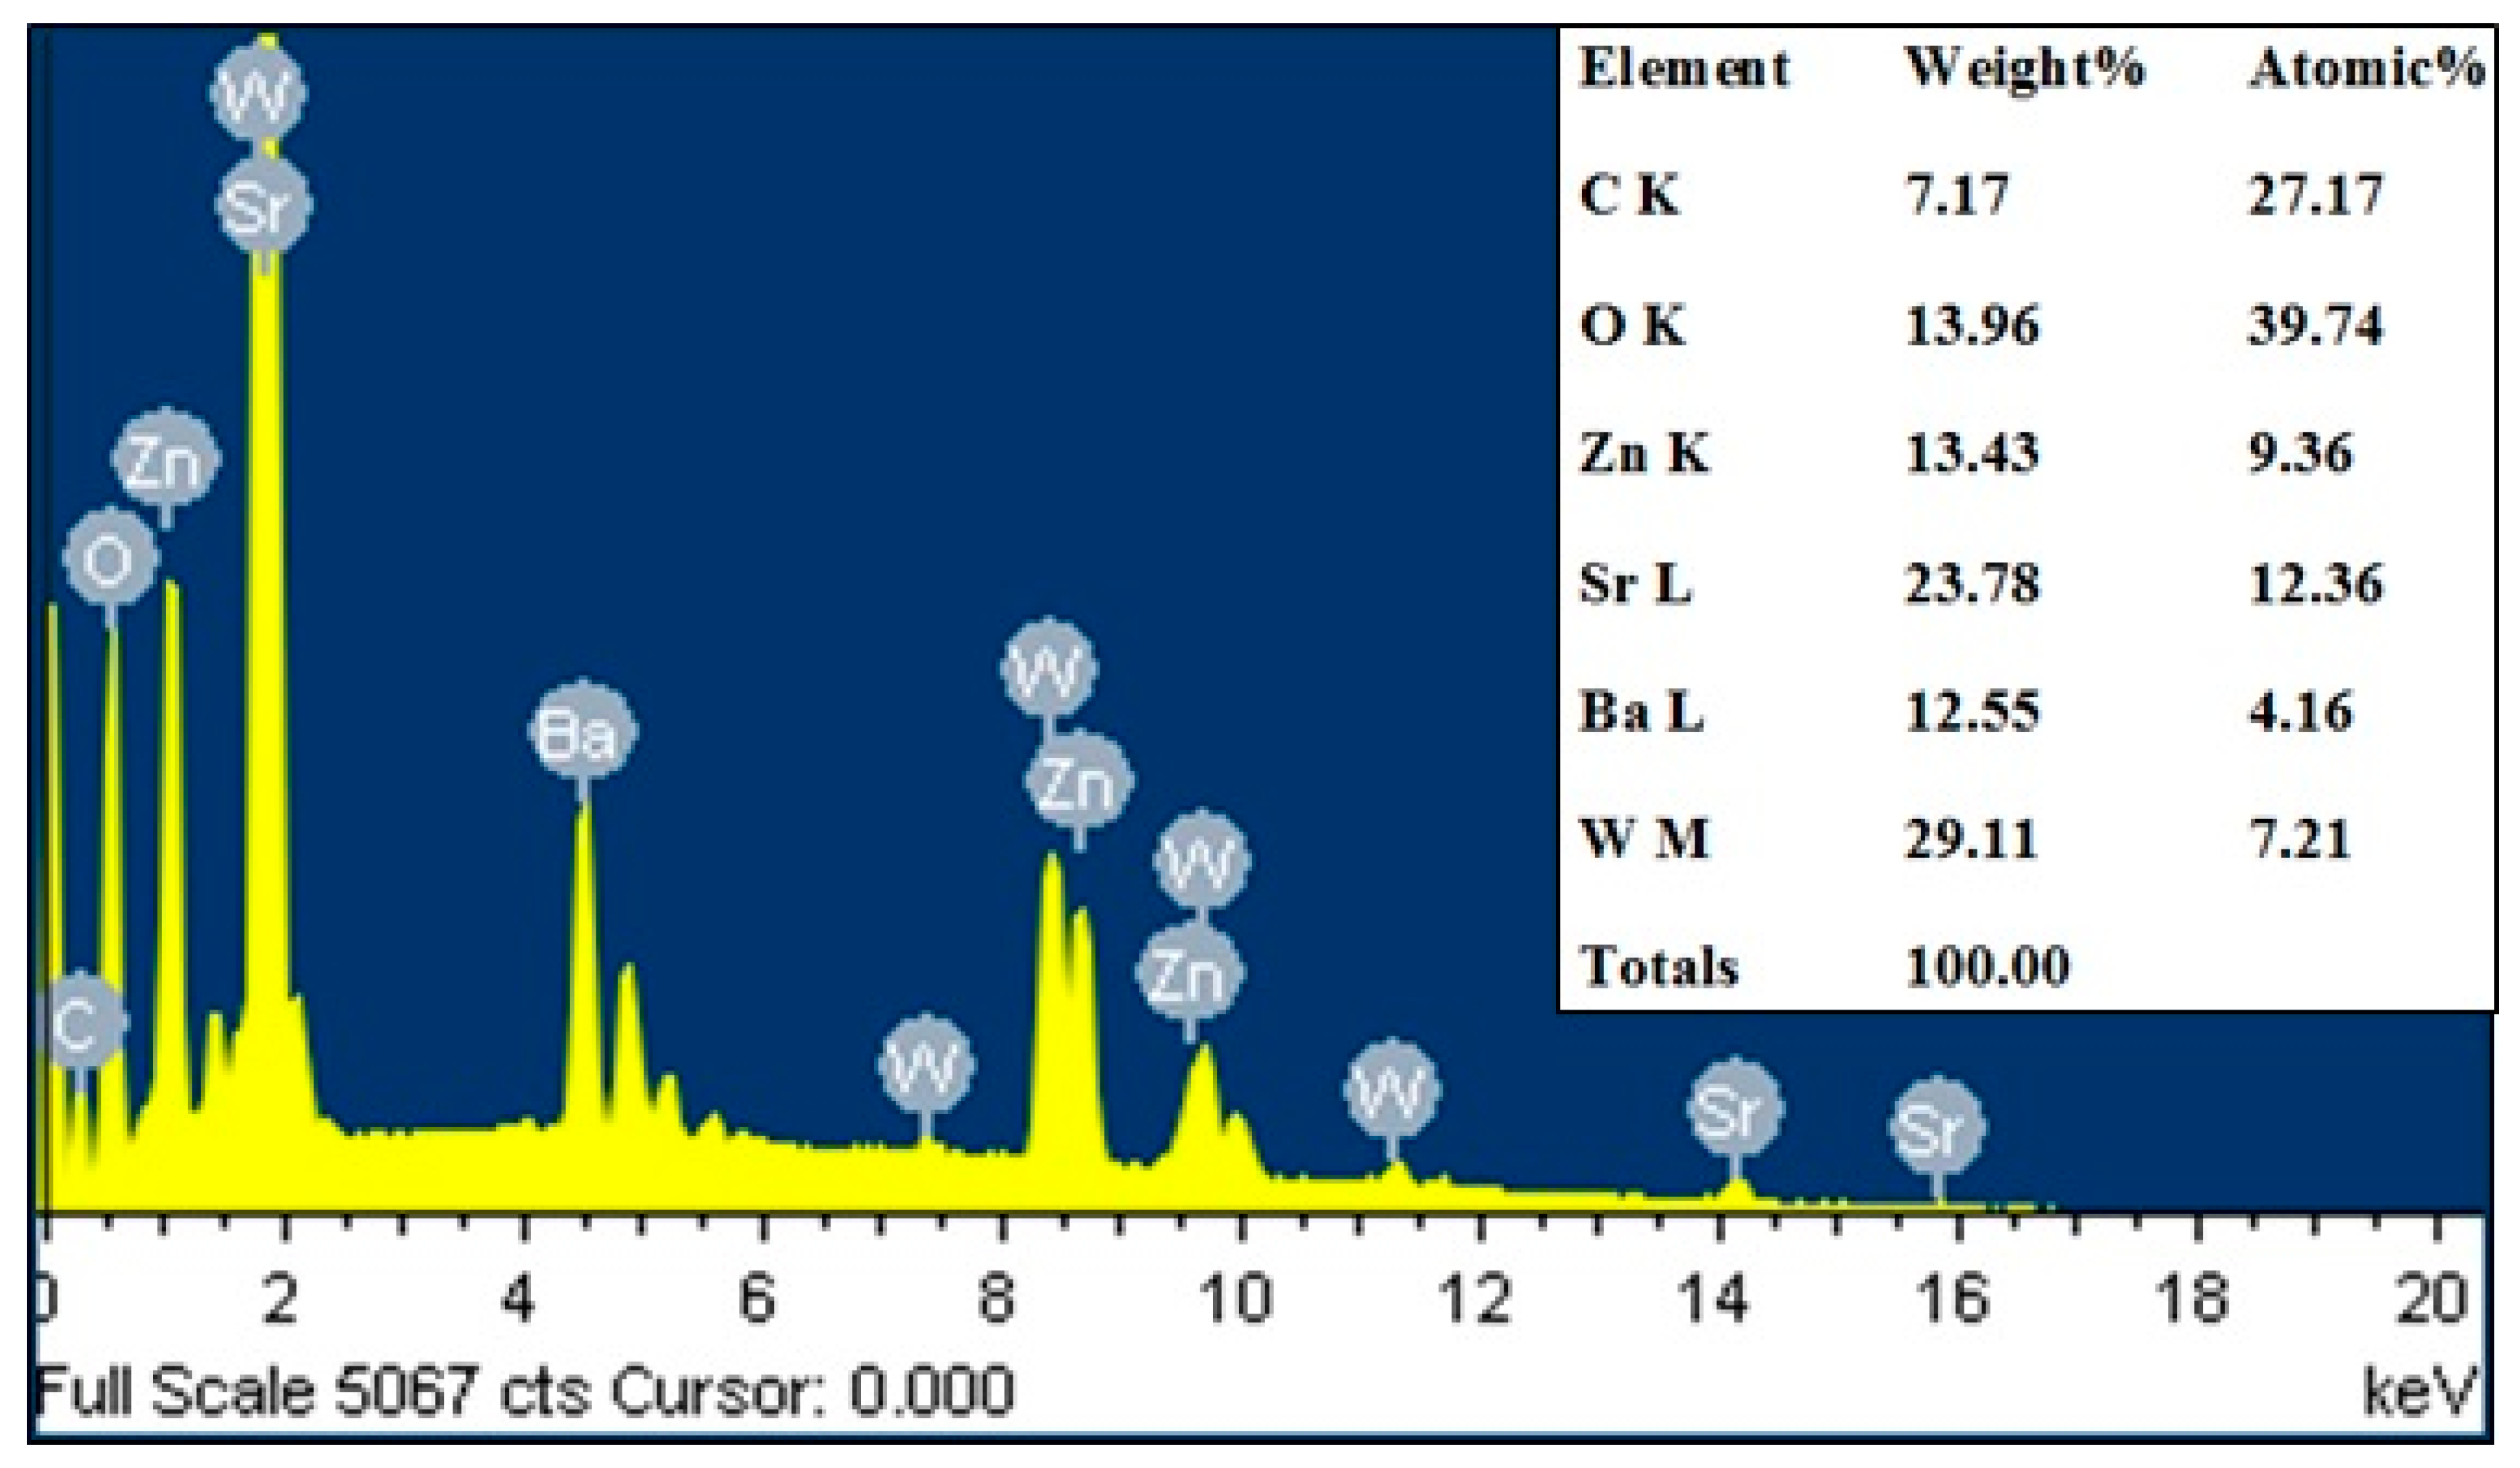
The SEM images of the samples in the series are shown in Figure 4a–e. All samples in the series had similar morphologies and were highly homogeneous with no impurities. Larger particle sizes and particles aggregates in assemblies were observed for all samples; this was caused by the higher temperatures used in the preparation process. Lan et al. [21] showed an identical temperature effect in the morphology of La2NiMnO6 materials. Additionally, the materials in the SEM images were exposed to fine, small fragments that were created during the grinding process in the preparation step. All samples varied in grain size. The grain sizes for BaSrZnWO6, Ba0.75Sr1.25ZnWO6, Ba0.5S0r1.50ZnWO6, Ba0.25Sr1.75ZnWO6, and S2ZnWO6 were 2–7 µm, 2–6 µm, 1.5–6 µm, 1.5–5 µm, and 2–6 µm, respectively. Table 3 shows the EDX results, which were calculated with the help of the SEM data, which confirmed that the samples contained all elements of the raw material inputs. As an example, Figure 5 shows the EDX spectrum for the elements of the Ba0.75Sr1.25ZnWO6 sample.

3.3. FTIR and RAMAN Spectroscopies

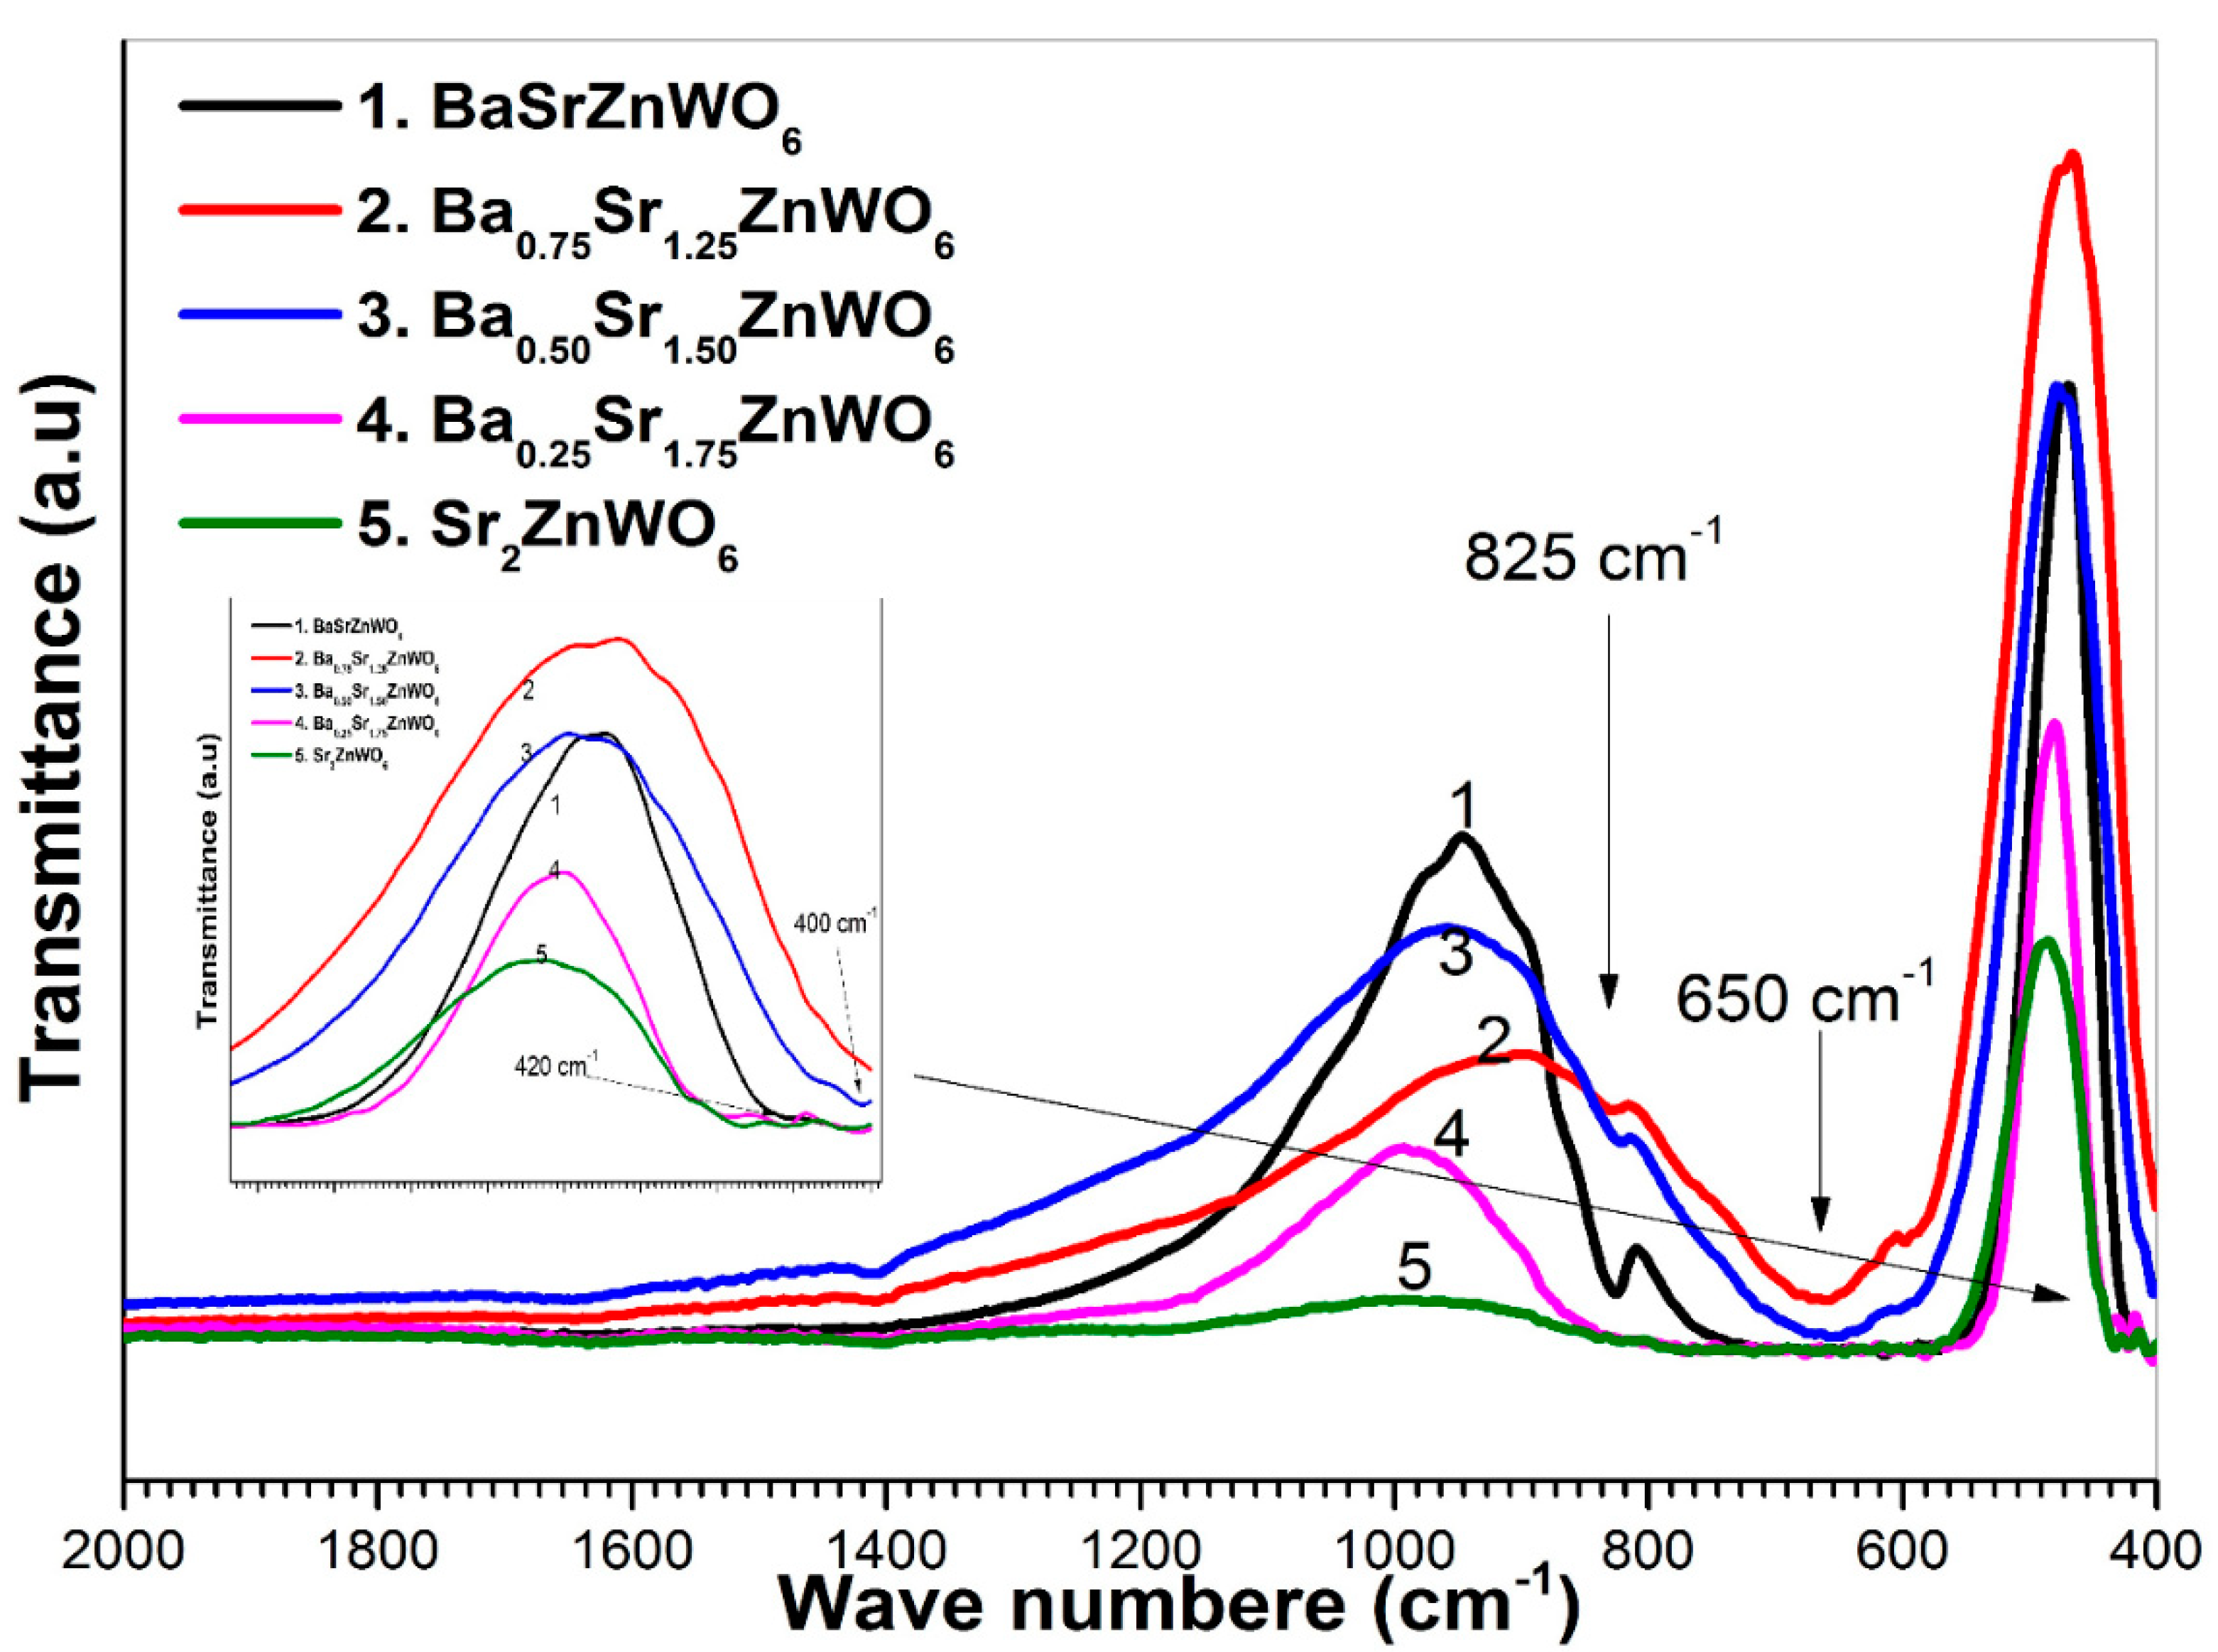
FTIR spectra of the perovskite structure have two distinctive absorption bands in the 850–400 cm−1 area [33]. High-energy, strong, and anti-symmetric stretching of the W–O6 octahedral bond was observed at 620 cm−1; the reason for this is the higher charge of the W6+ cations. Symmetric stretching vibration of the WO6 octahedron appears as a high-intensity band around 825 cm−1. As shown in Figure 6, which shows the transmittance of the series versus the wave number, all samples were confirmed to have molecular bands corresponding to the perovskite oxide form [34].
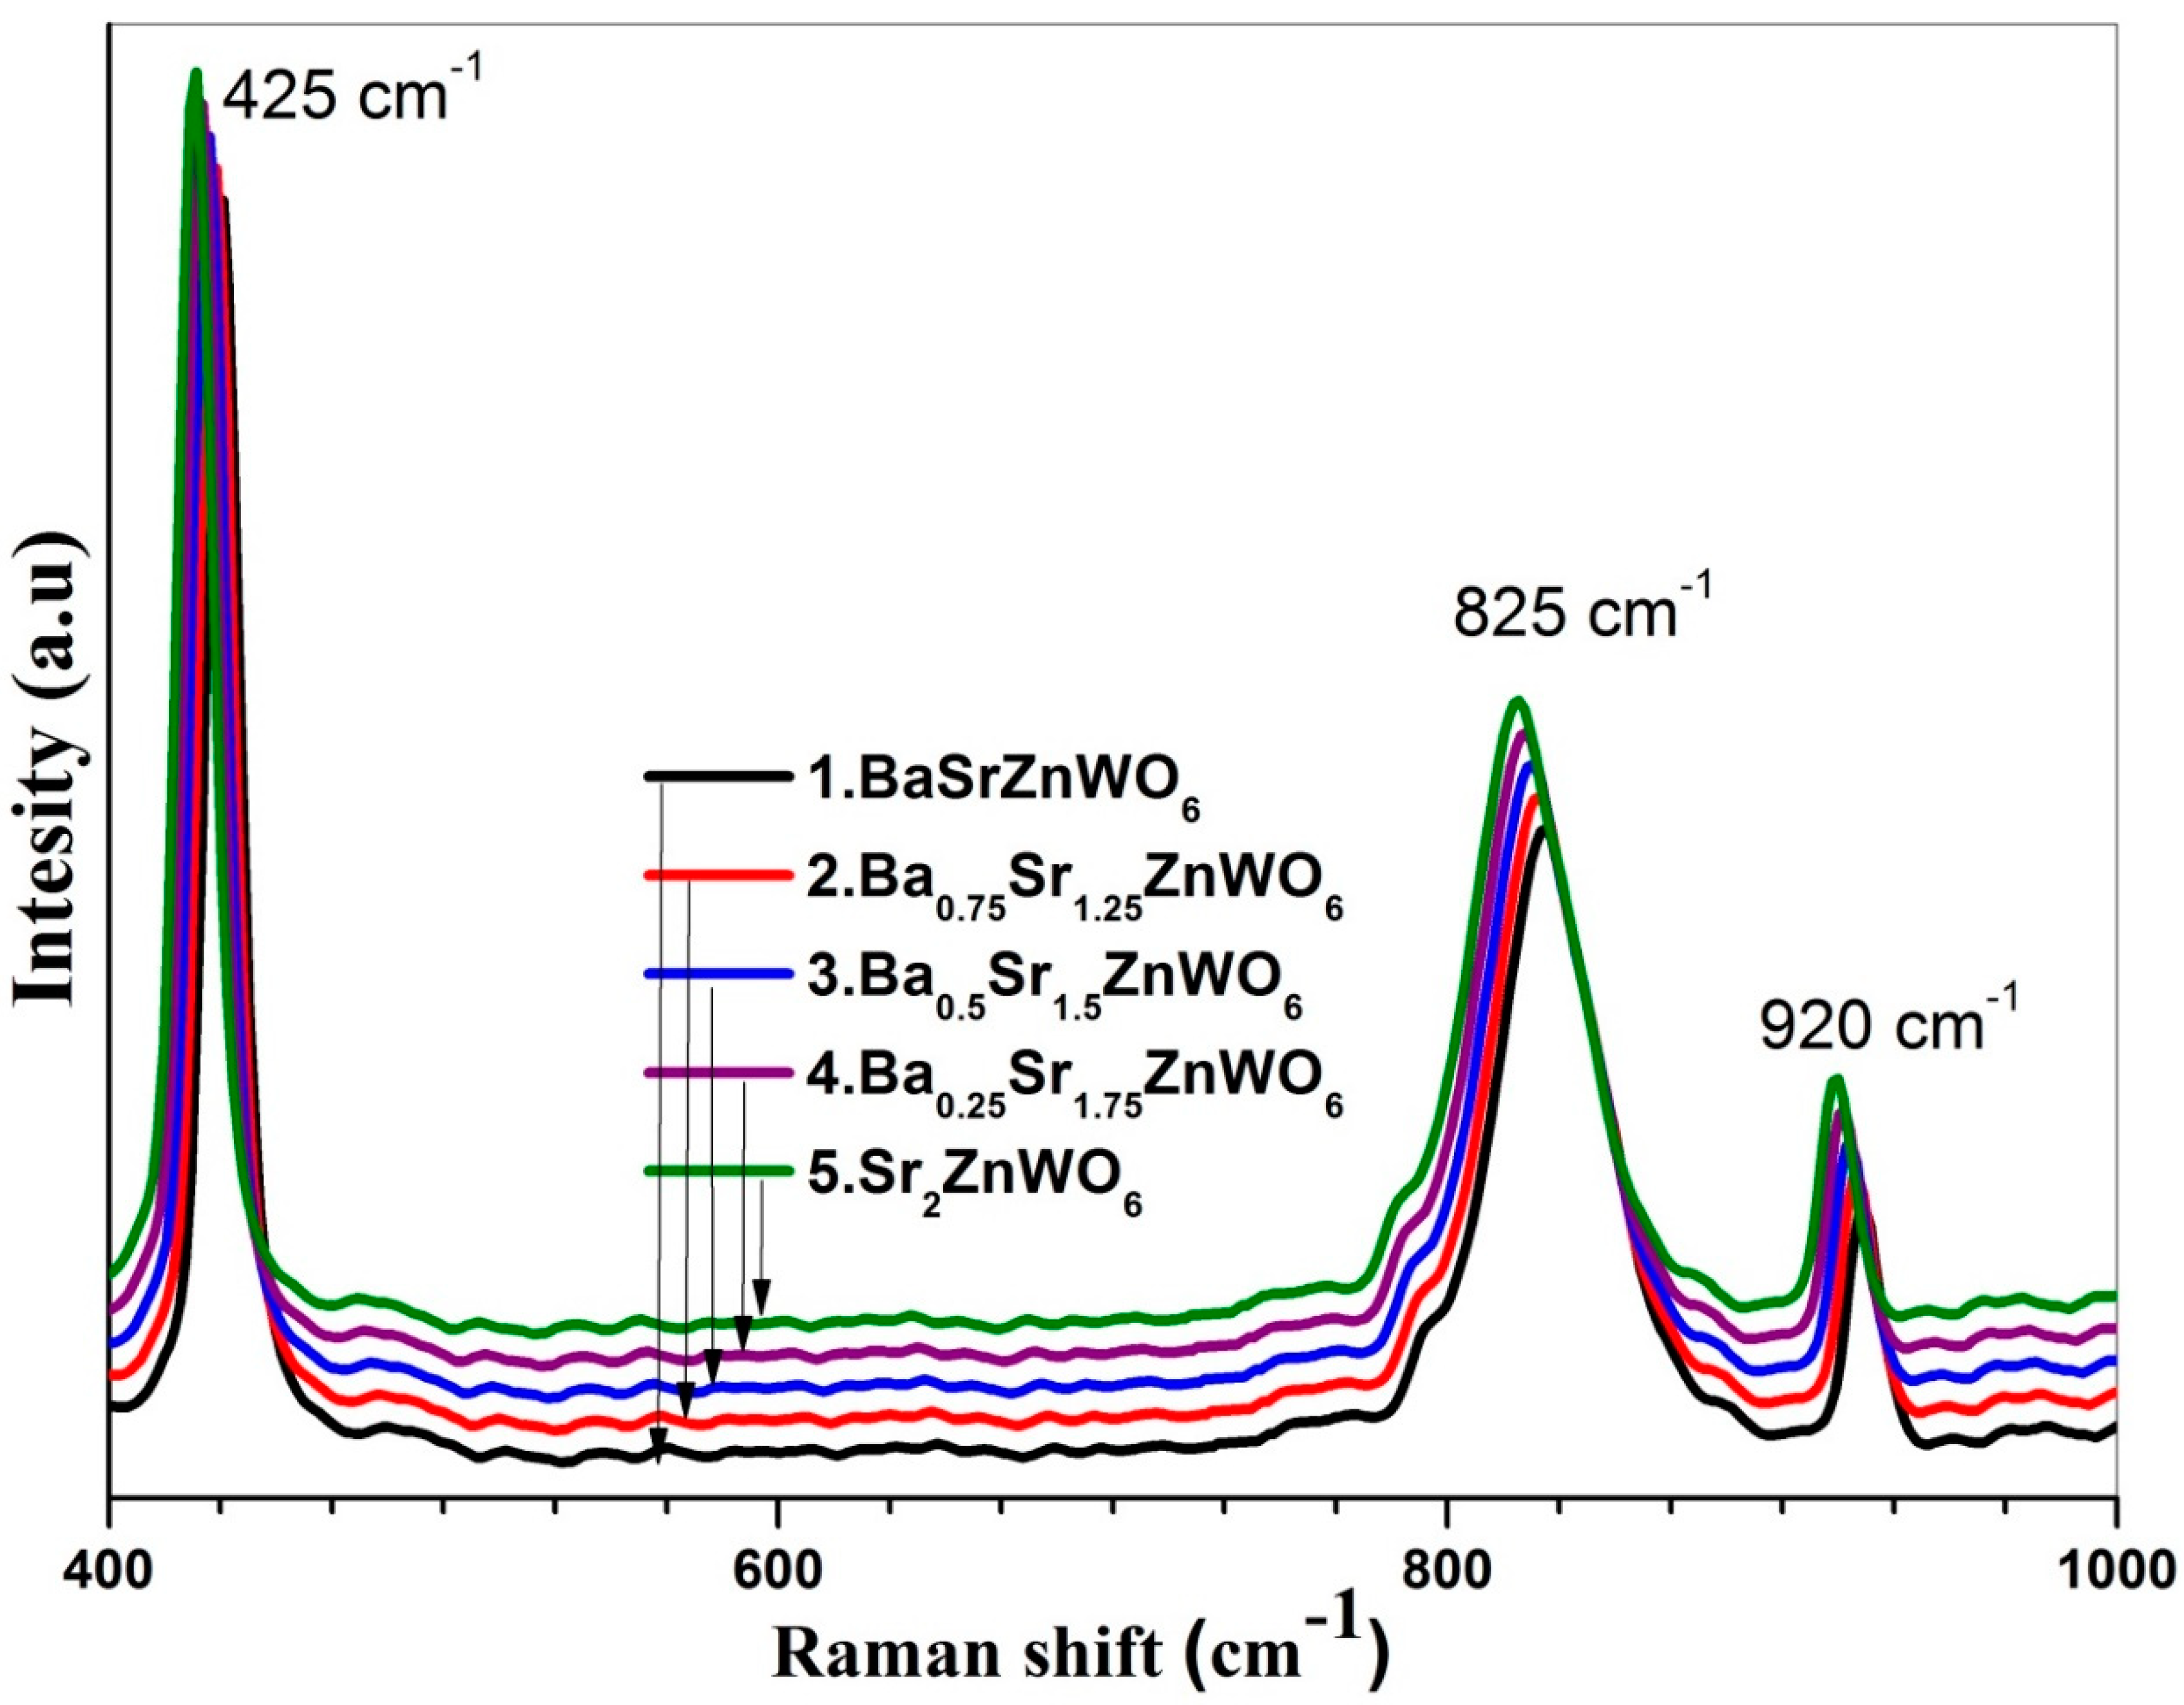
Raman spectra of the studied samples can be observed in Figure 7. The Raman mode of the Ba2−xSrxZnWO6 samples are classified into two types of lattice vibrations: a bending vibration mode (W–O–W) in the 200–500 cm−1 range and a stretching mode (W–O) in the middle of the 700–950 cm−1 range [35,36].
When decreasing Ba2+ from x = 1 to x = 0, the effect of increasing the Sr2+ cations was observed as an increase in both the bending and W–O stretching modes of the bonds. Furthermore, the Raman energy of the series experienced a blue shift, which may be due to Ba2+ having a larger ionic radius (149 Å) than Sr2+ (132 Å).

3.4. UV–Visible Diffuse Reflectance Spectroscopy

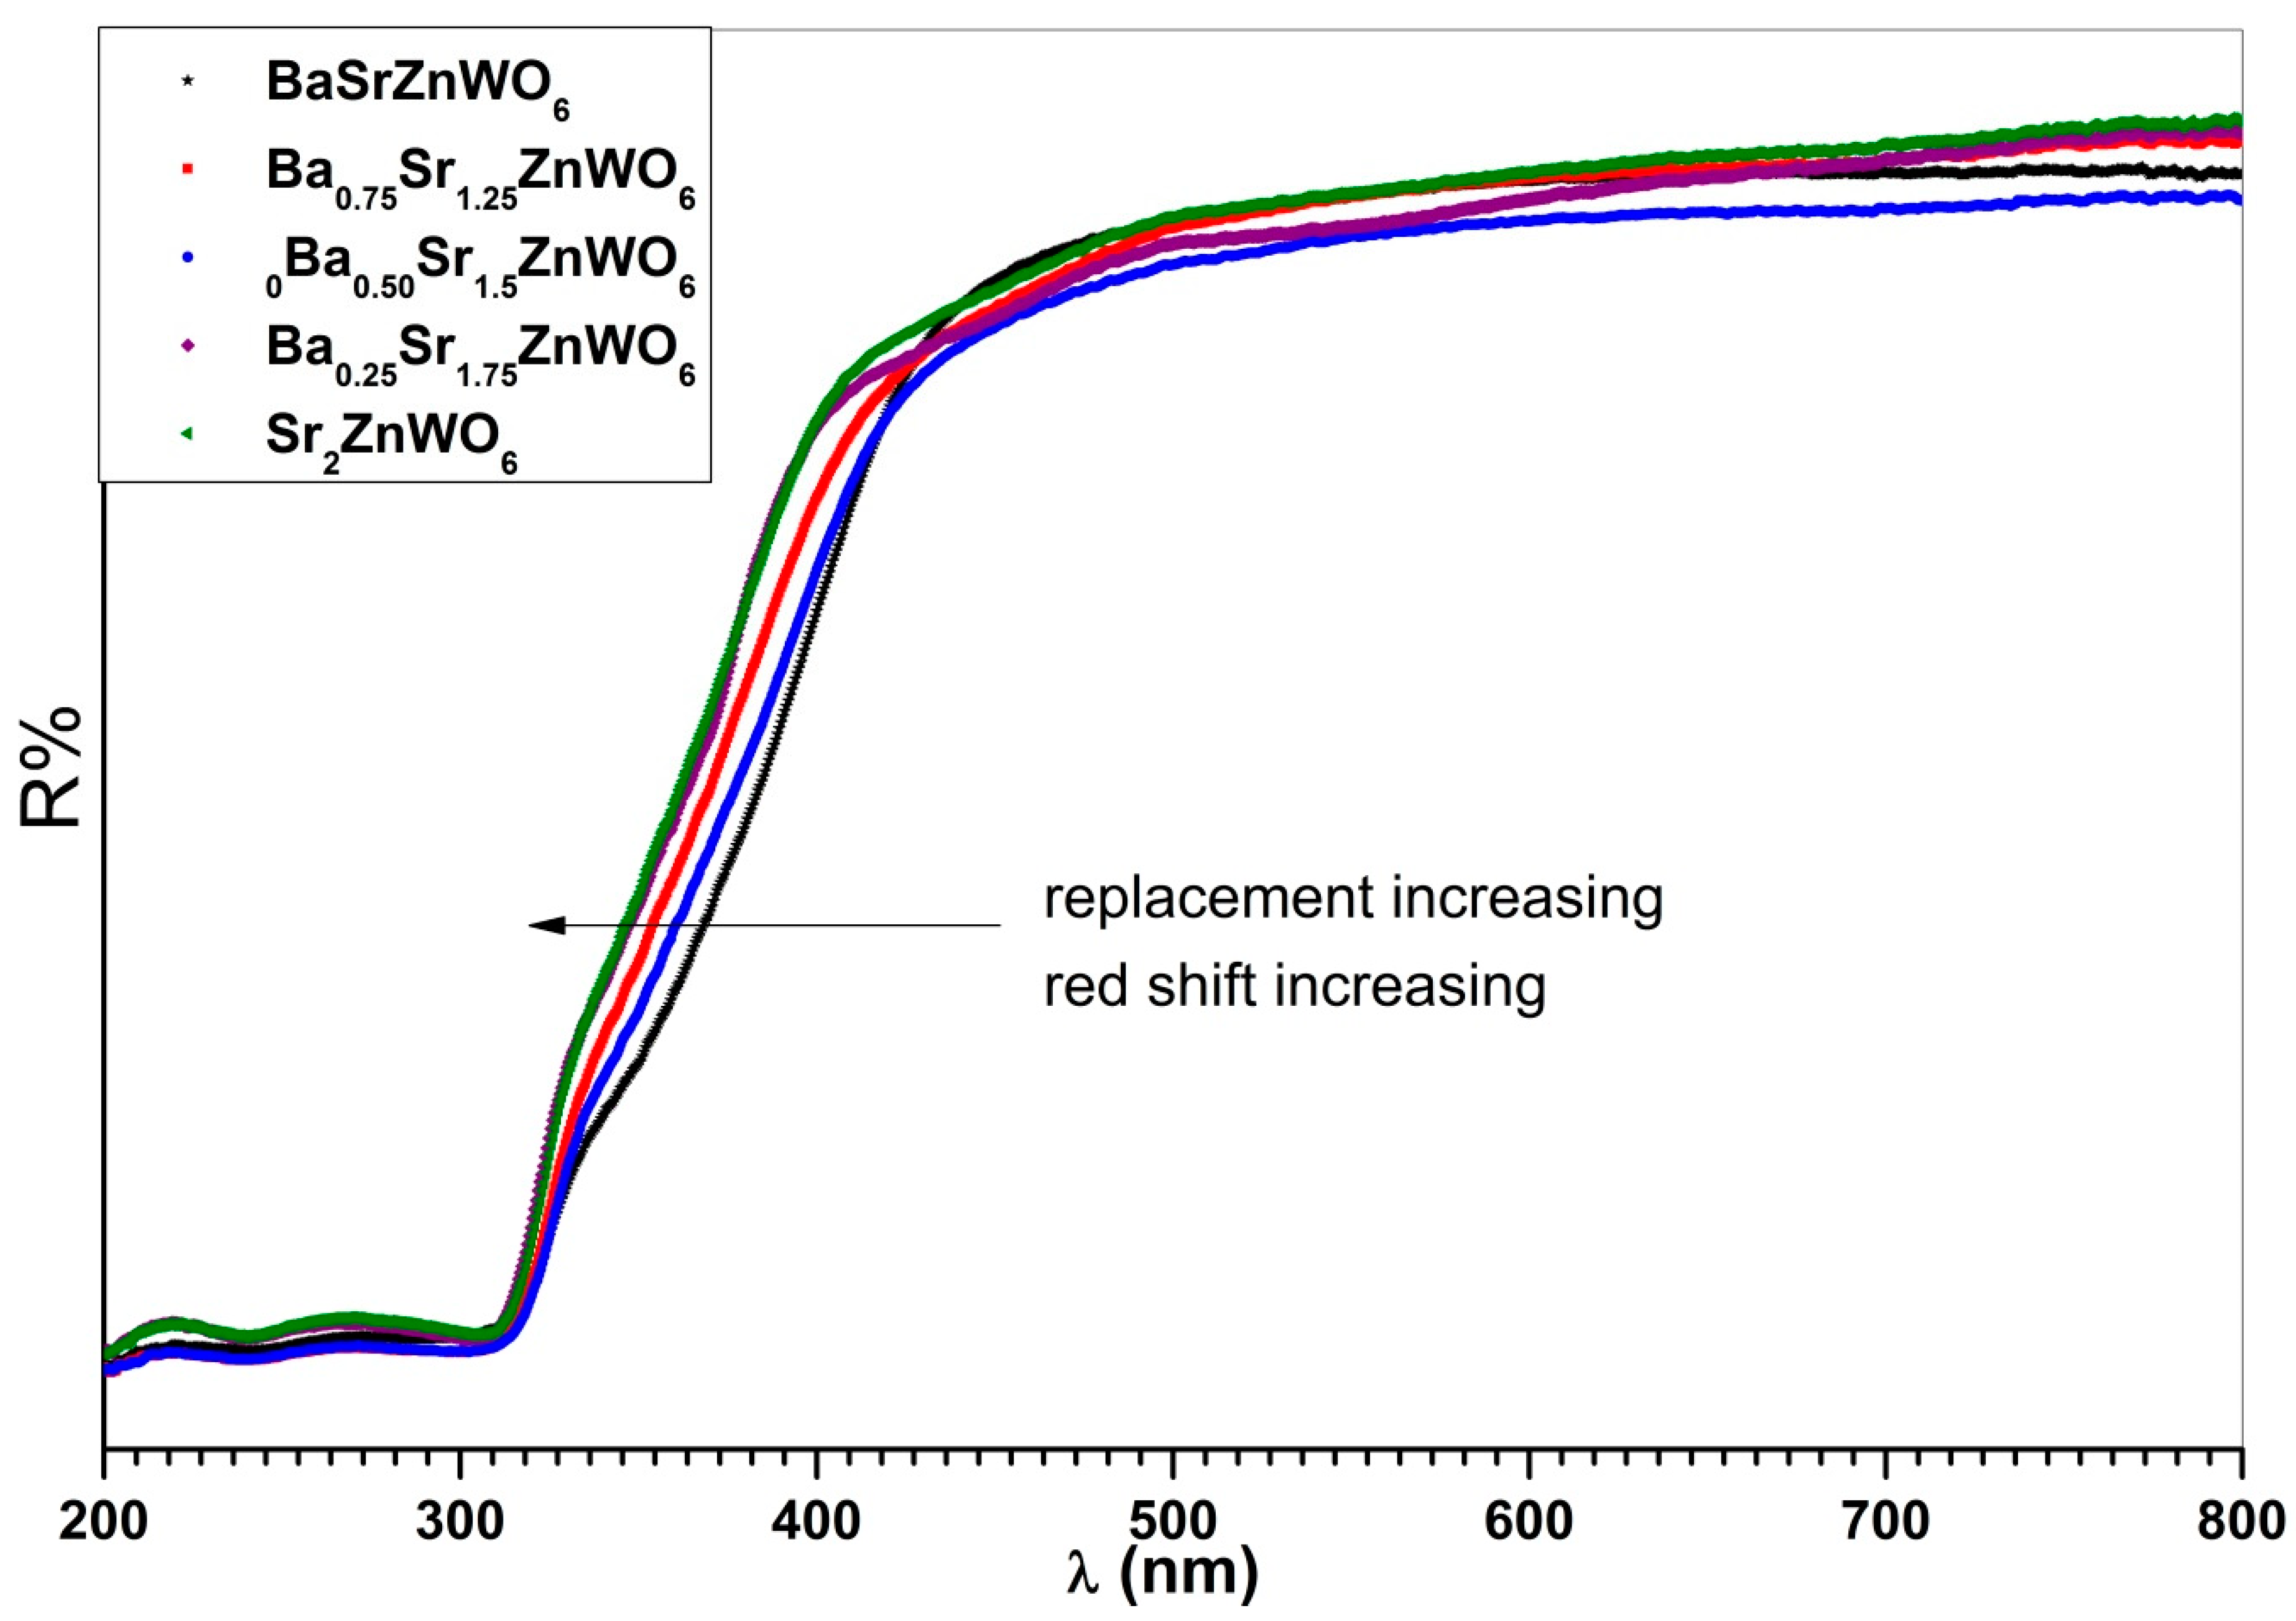
The UV-vis diffuse reflectance spectra in Figure 8 include all samples at room temperature and in the 200–800 nm region. A strong absorption band can be noted between 300 and 450 nm, resulting from the charge transfer transition ( W 6 + O 2 ) in the lattice, that is, from the highest occupied molecular orbital (2p) of oxygen ( O 2 ) to the lowest unfilled molecular orbital (5d) of tungsten ( W 6 + ) [15,37,38]. The absorption band experienced a red shift with the increasing substitution of Barium (Ba2+) with strontium (Sr2+) cations.
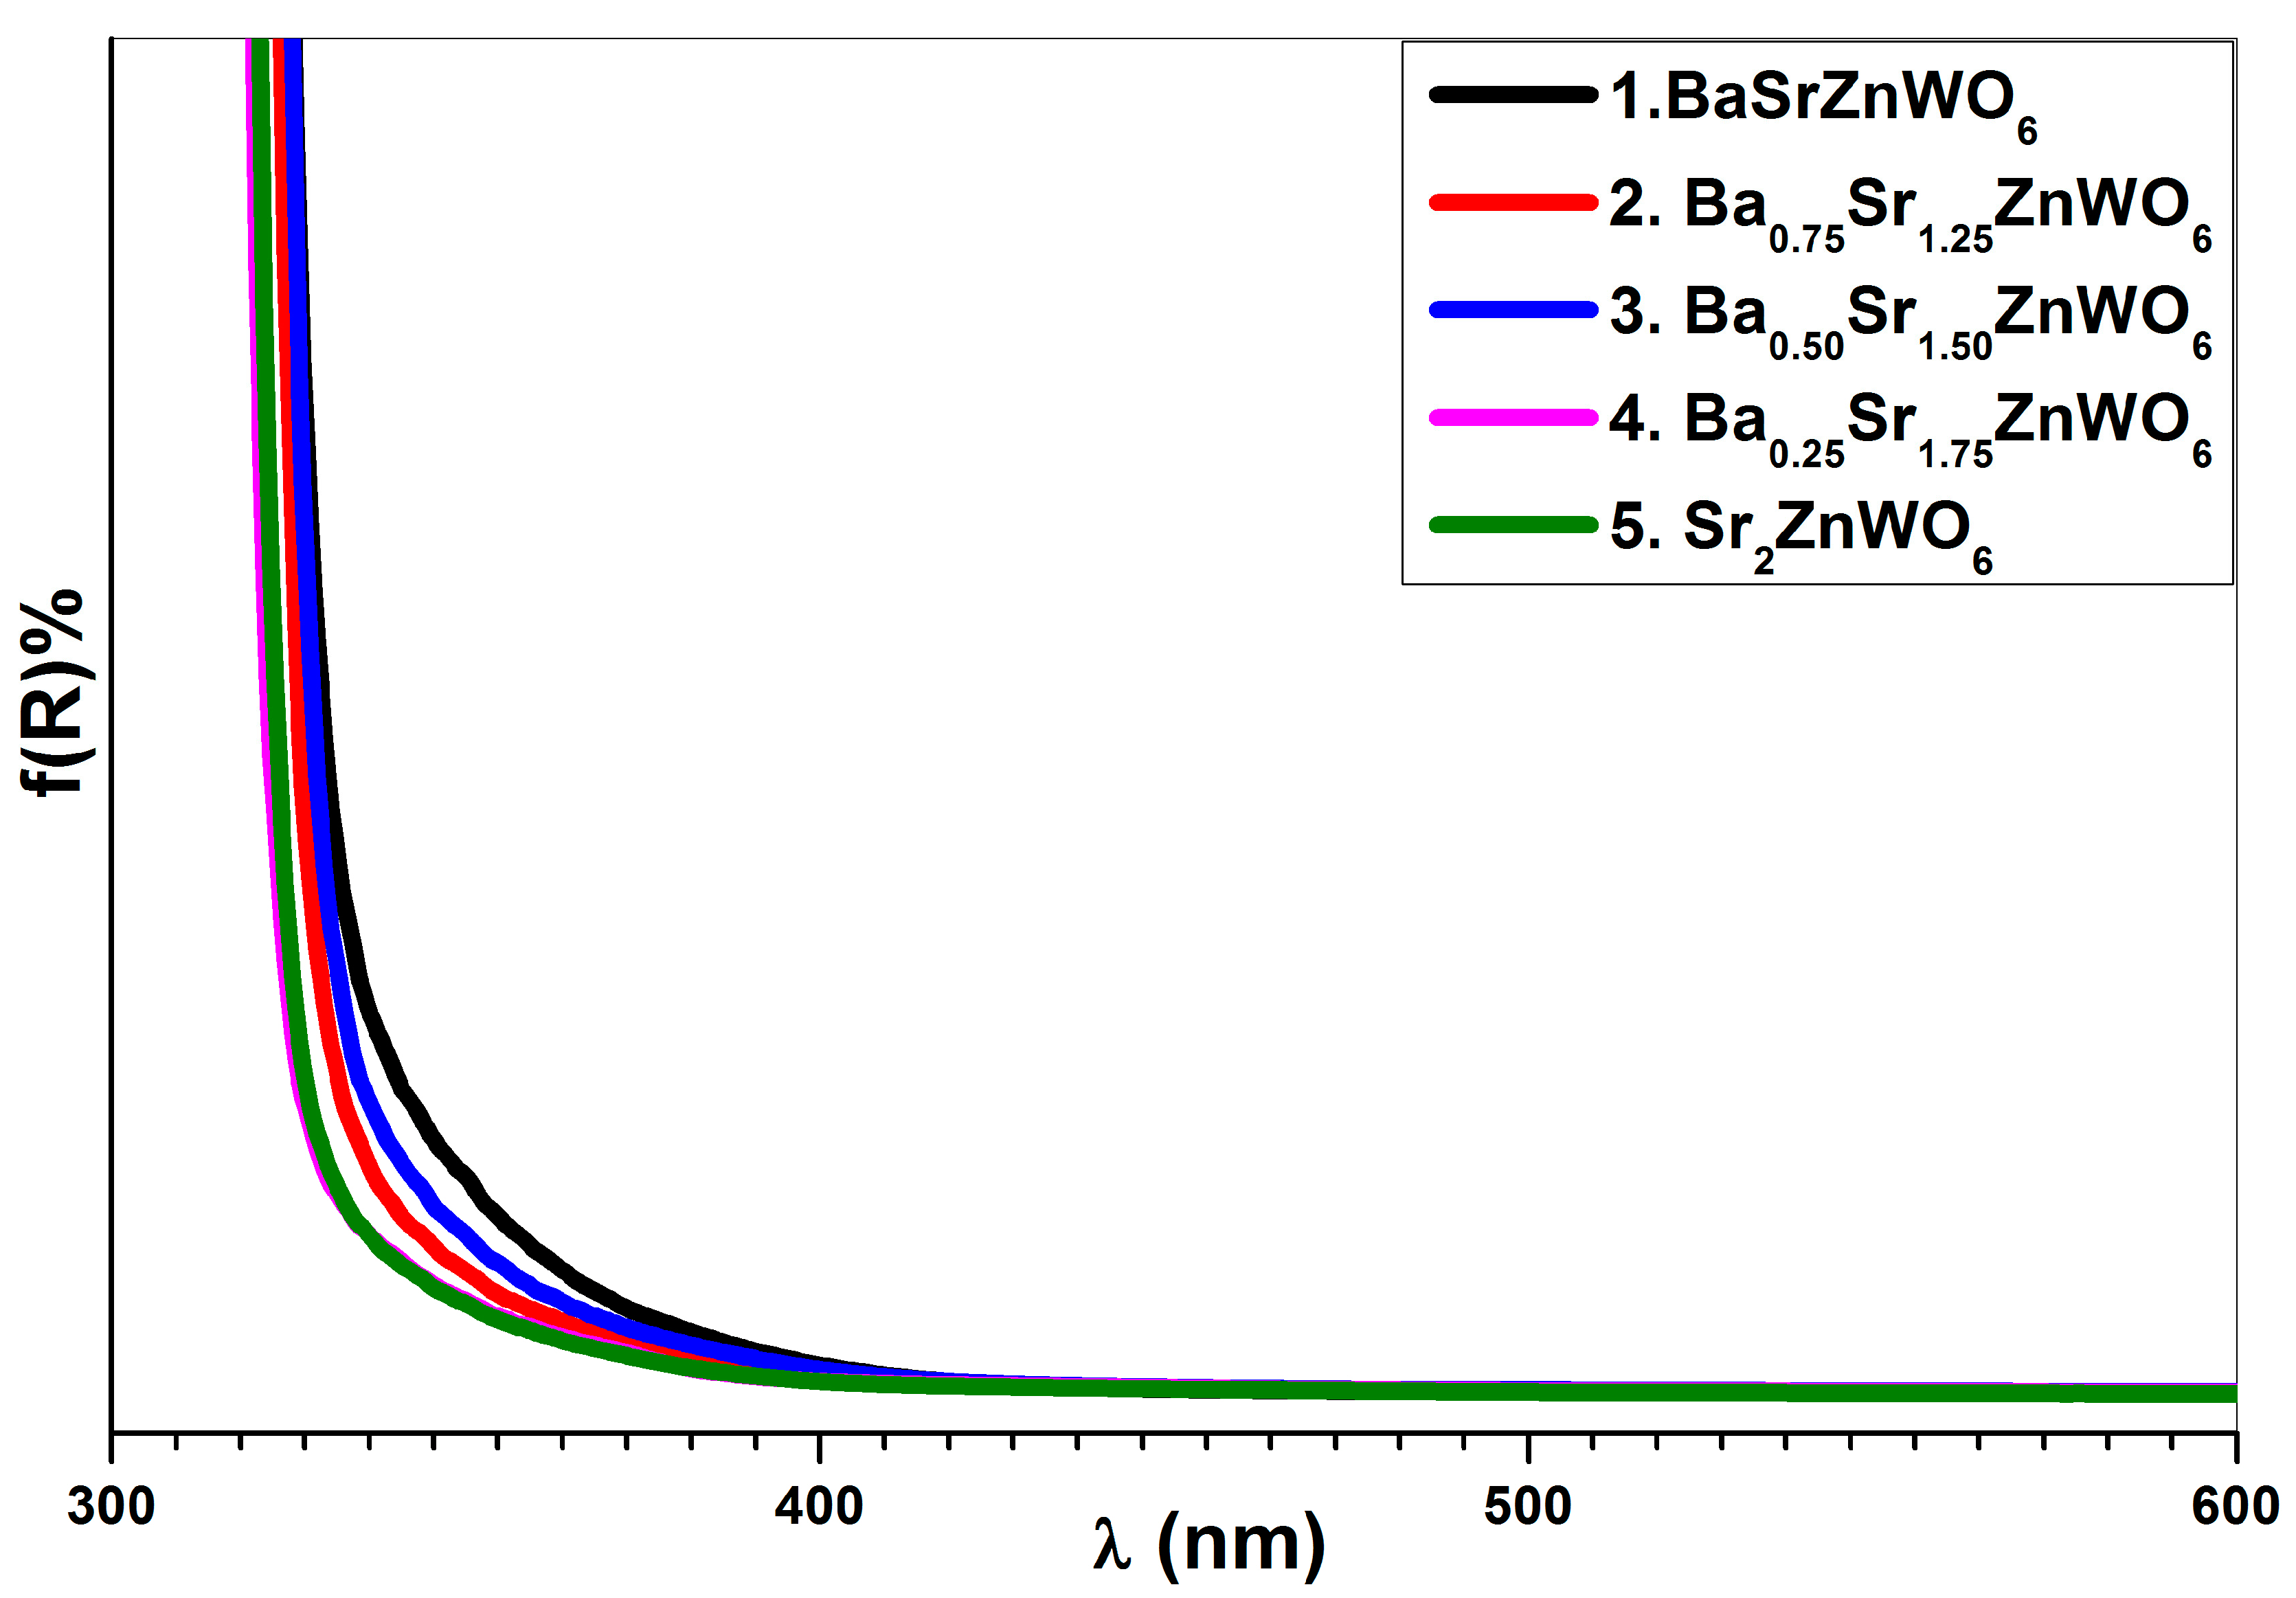
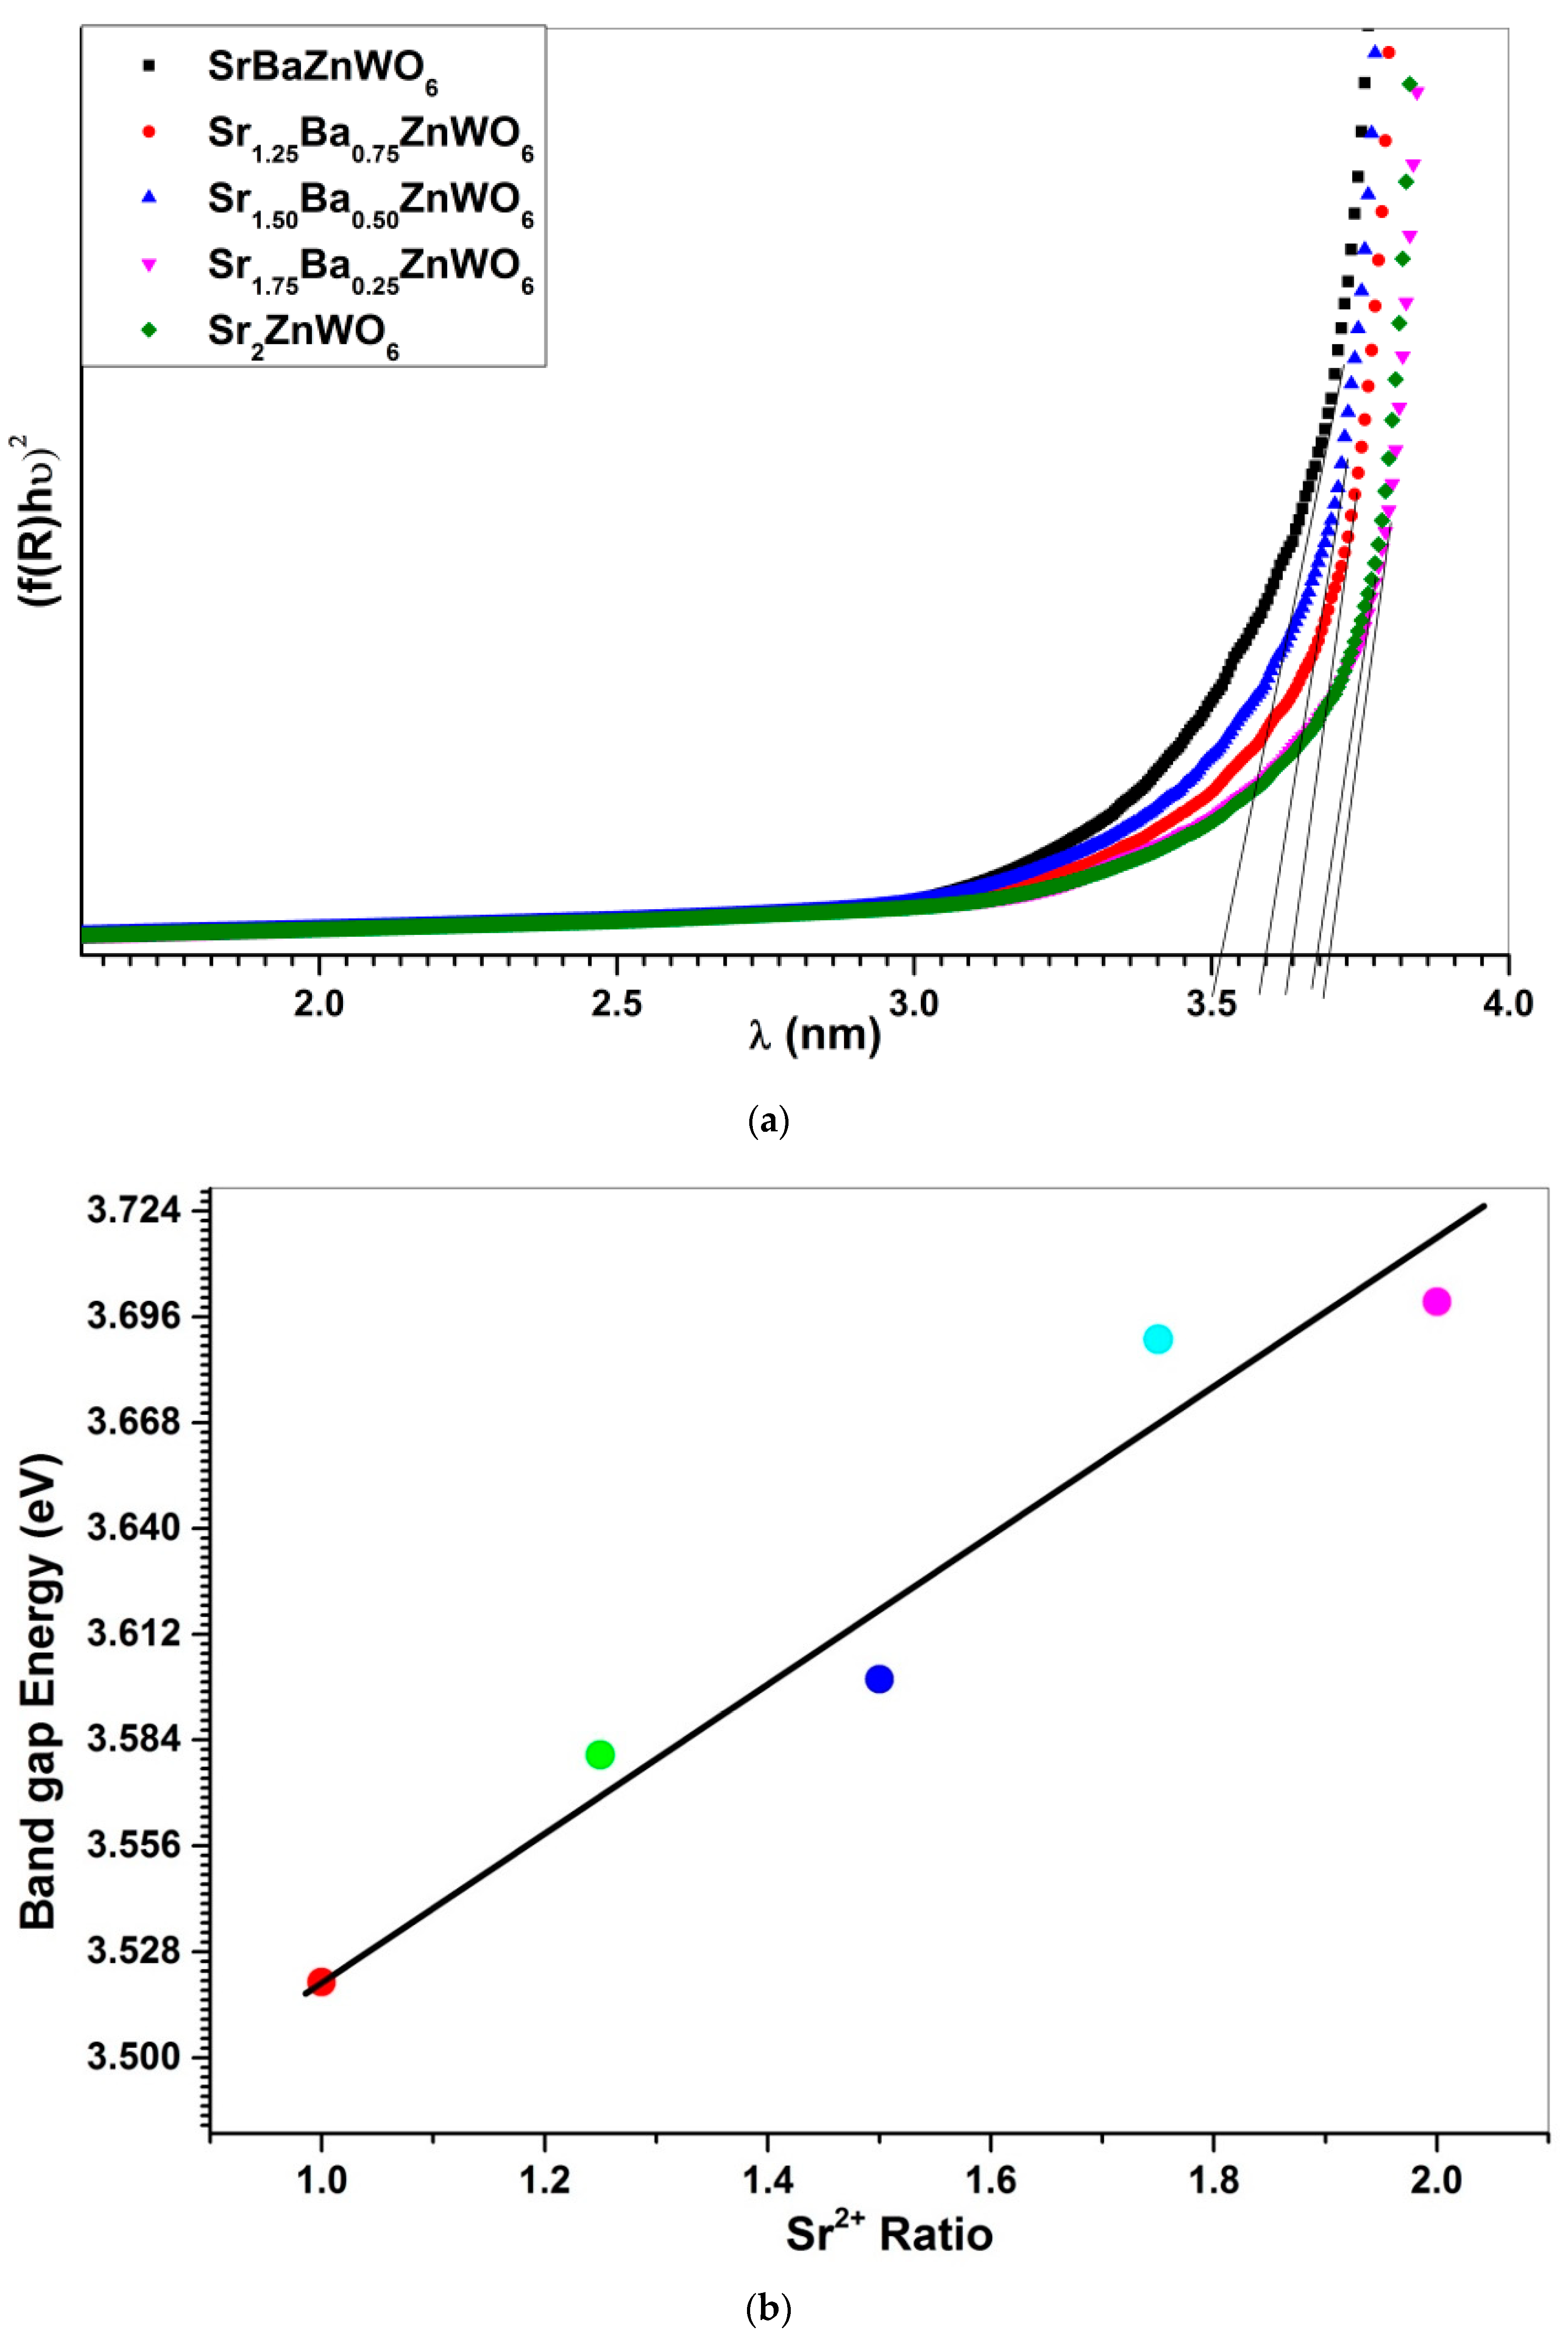
The absorption coefficient was computed for the Ba2−xSrxZnWO6 series, from the UV–vis diffuse reflectance data, using the Kubelka–Munk (KM) function (see Equation (5)). The KM function (absorbance) is related to the wavelength, as shown in Figure 9. The absorbance was used to observe the absorption edge of the samples, which had values of 388, 345, 343, 337, and 326 nm for x = 1, 1.25, 1.50, 1.75, and 2, respectively. The band gap energy of the compounds was computed from the edge of absorption using the relationship Eg = 1240/λ, where λ is the wavelength of the absorption edge and Eg is the band gap energy [39]. Furthermore, the Tauc plot method was utilized to calculate the band gap energy for the compounds [21], as shown in Figure 10a, in accordance with Equation (5). The energy gap of the Ba2−xSrxZnWO6 series increased with increasing substitution of Sr2+ (see Figure 10b). The reason for this may be due to the ionic radii decreasing with the Ba2+/Sr2+ ratio, which may have caused an increase of atomic divergence, sequentially leading to the energy band gap increment.
The band gap energies of all samples are given in Table 4. According to the optical energy gap of the compounds in the series, the materials can be classified as semiconductors [15,40].

3.5. Photoluminescence Spectroscopy

The luminescence values of the Ba2−xSrxZnWO6 double perovskite series were investigated using a PerkinElmer LS55 Fluorescence spectrometer. Ethyl acetone was used as the solvent for powdered samples.
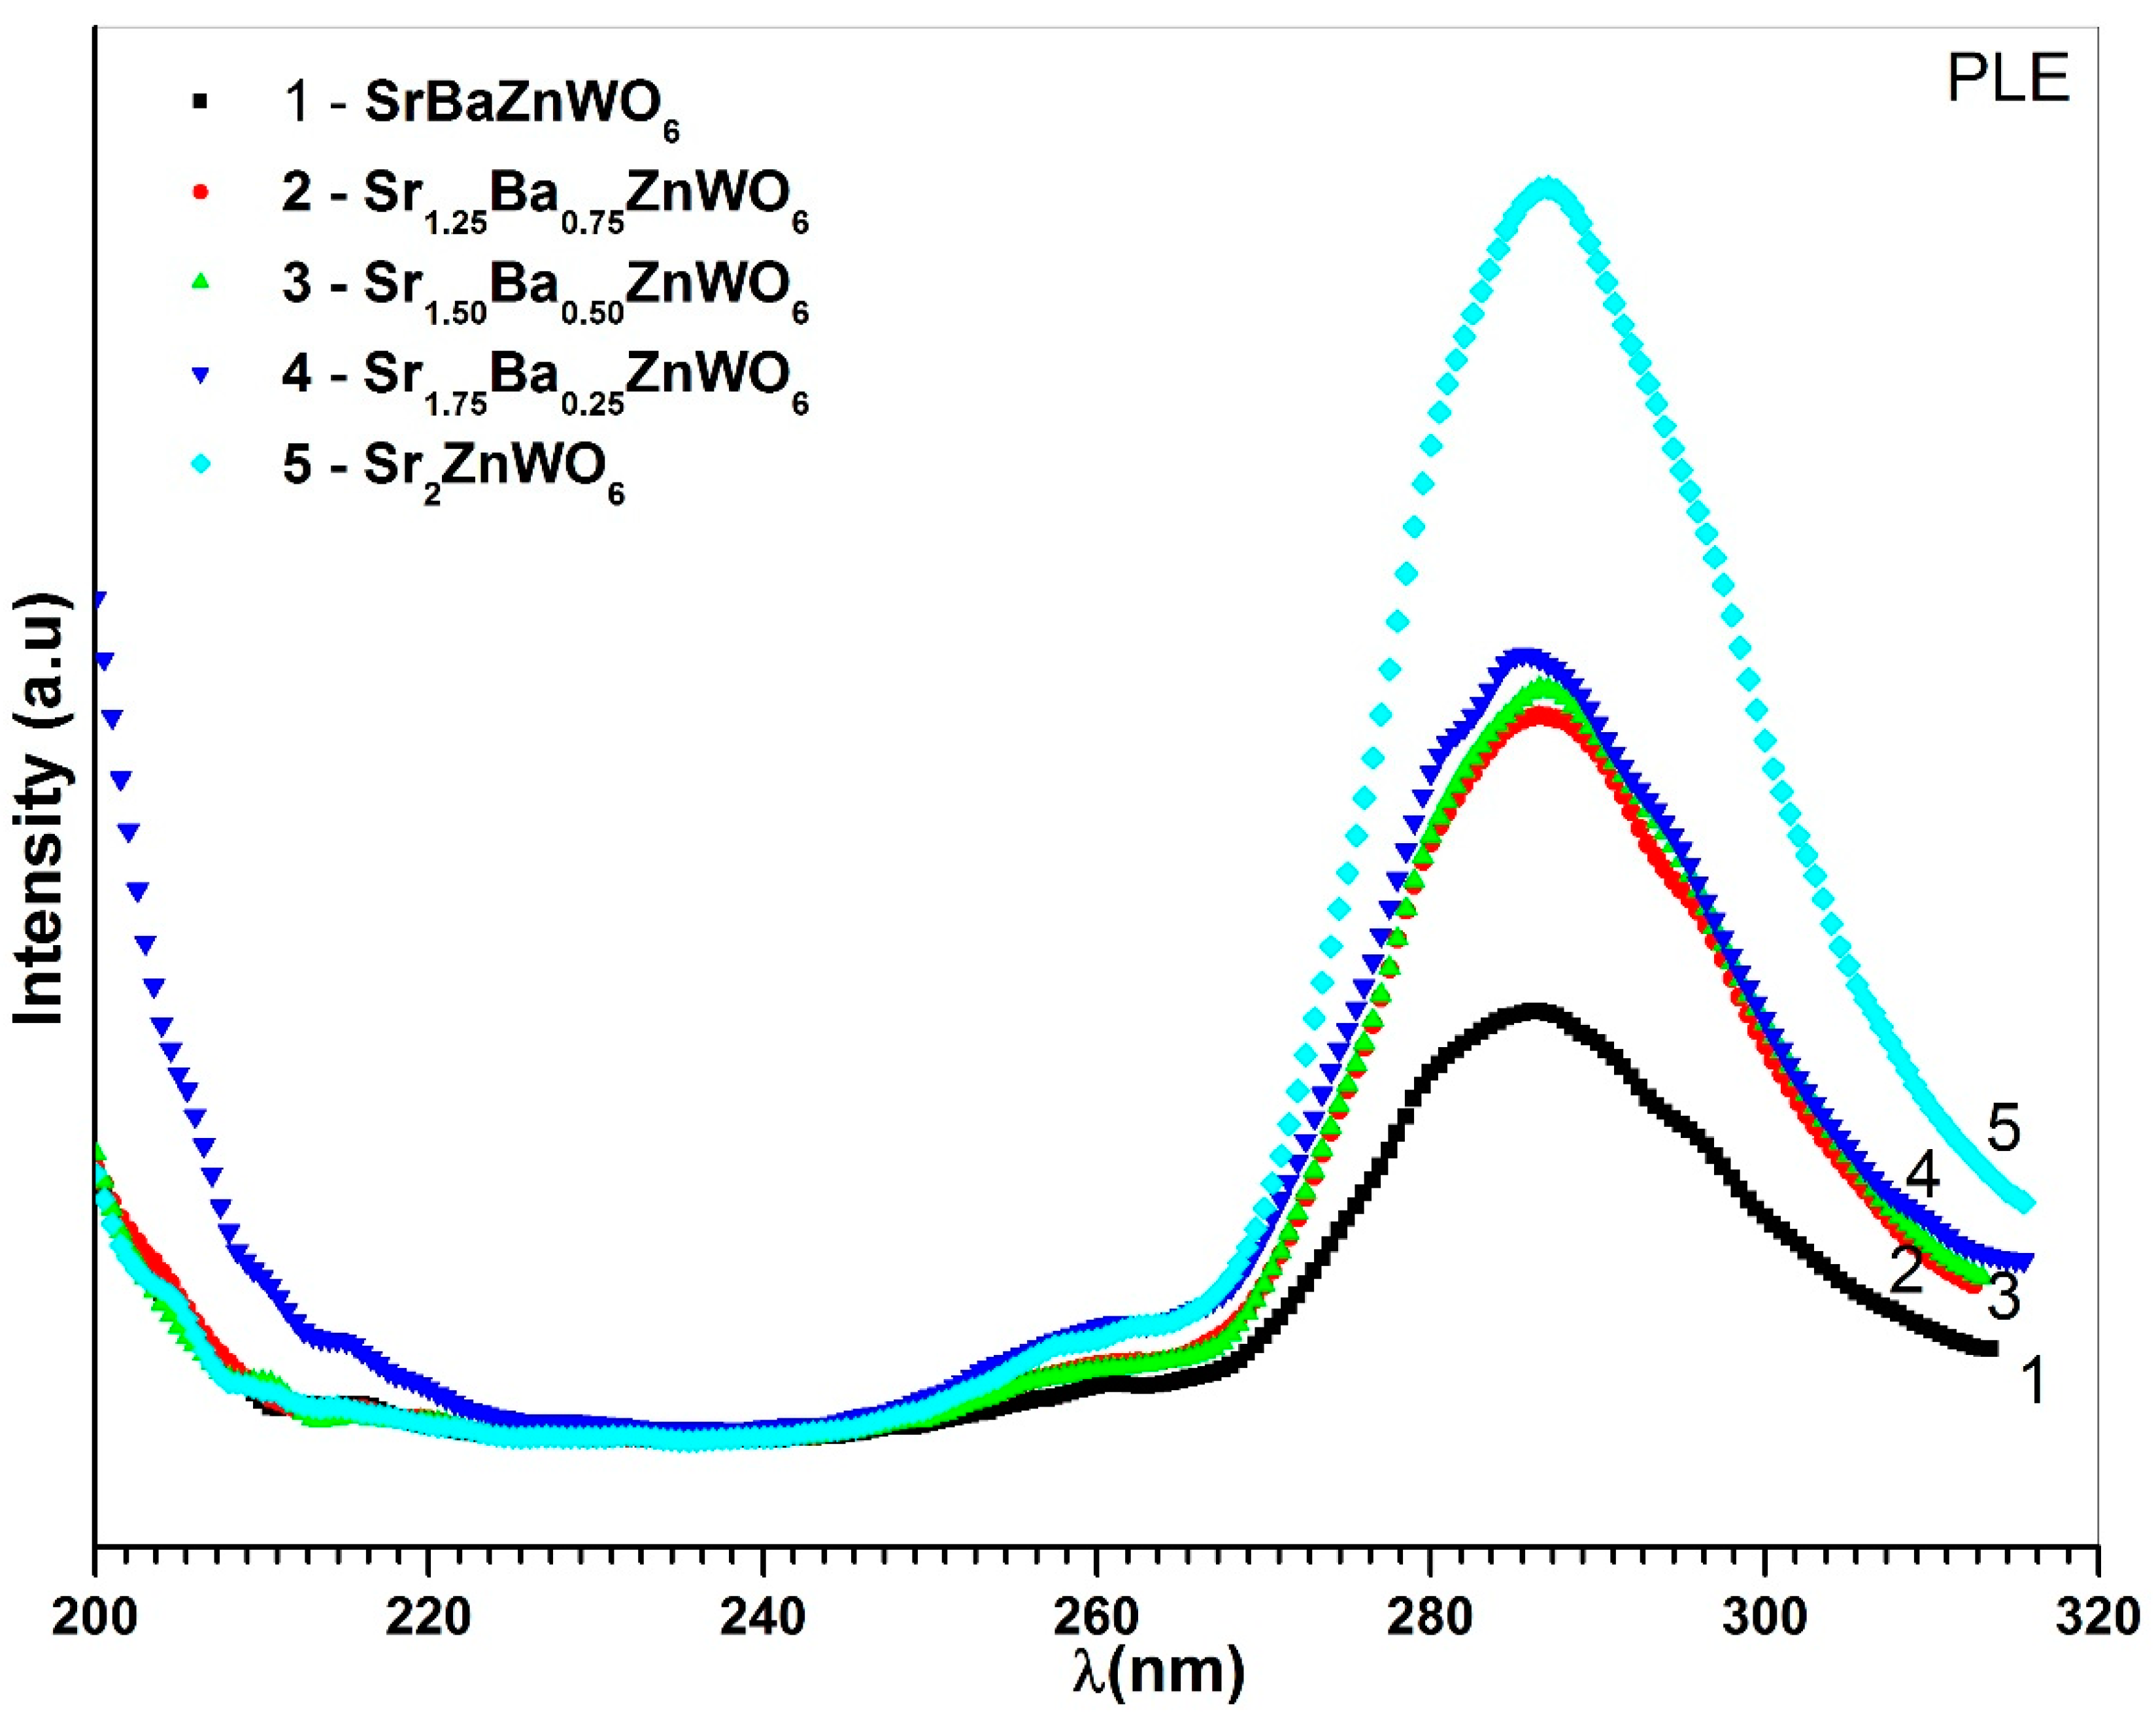
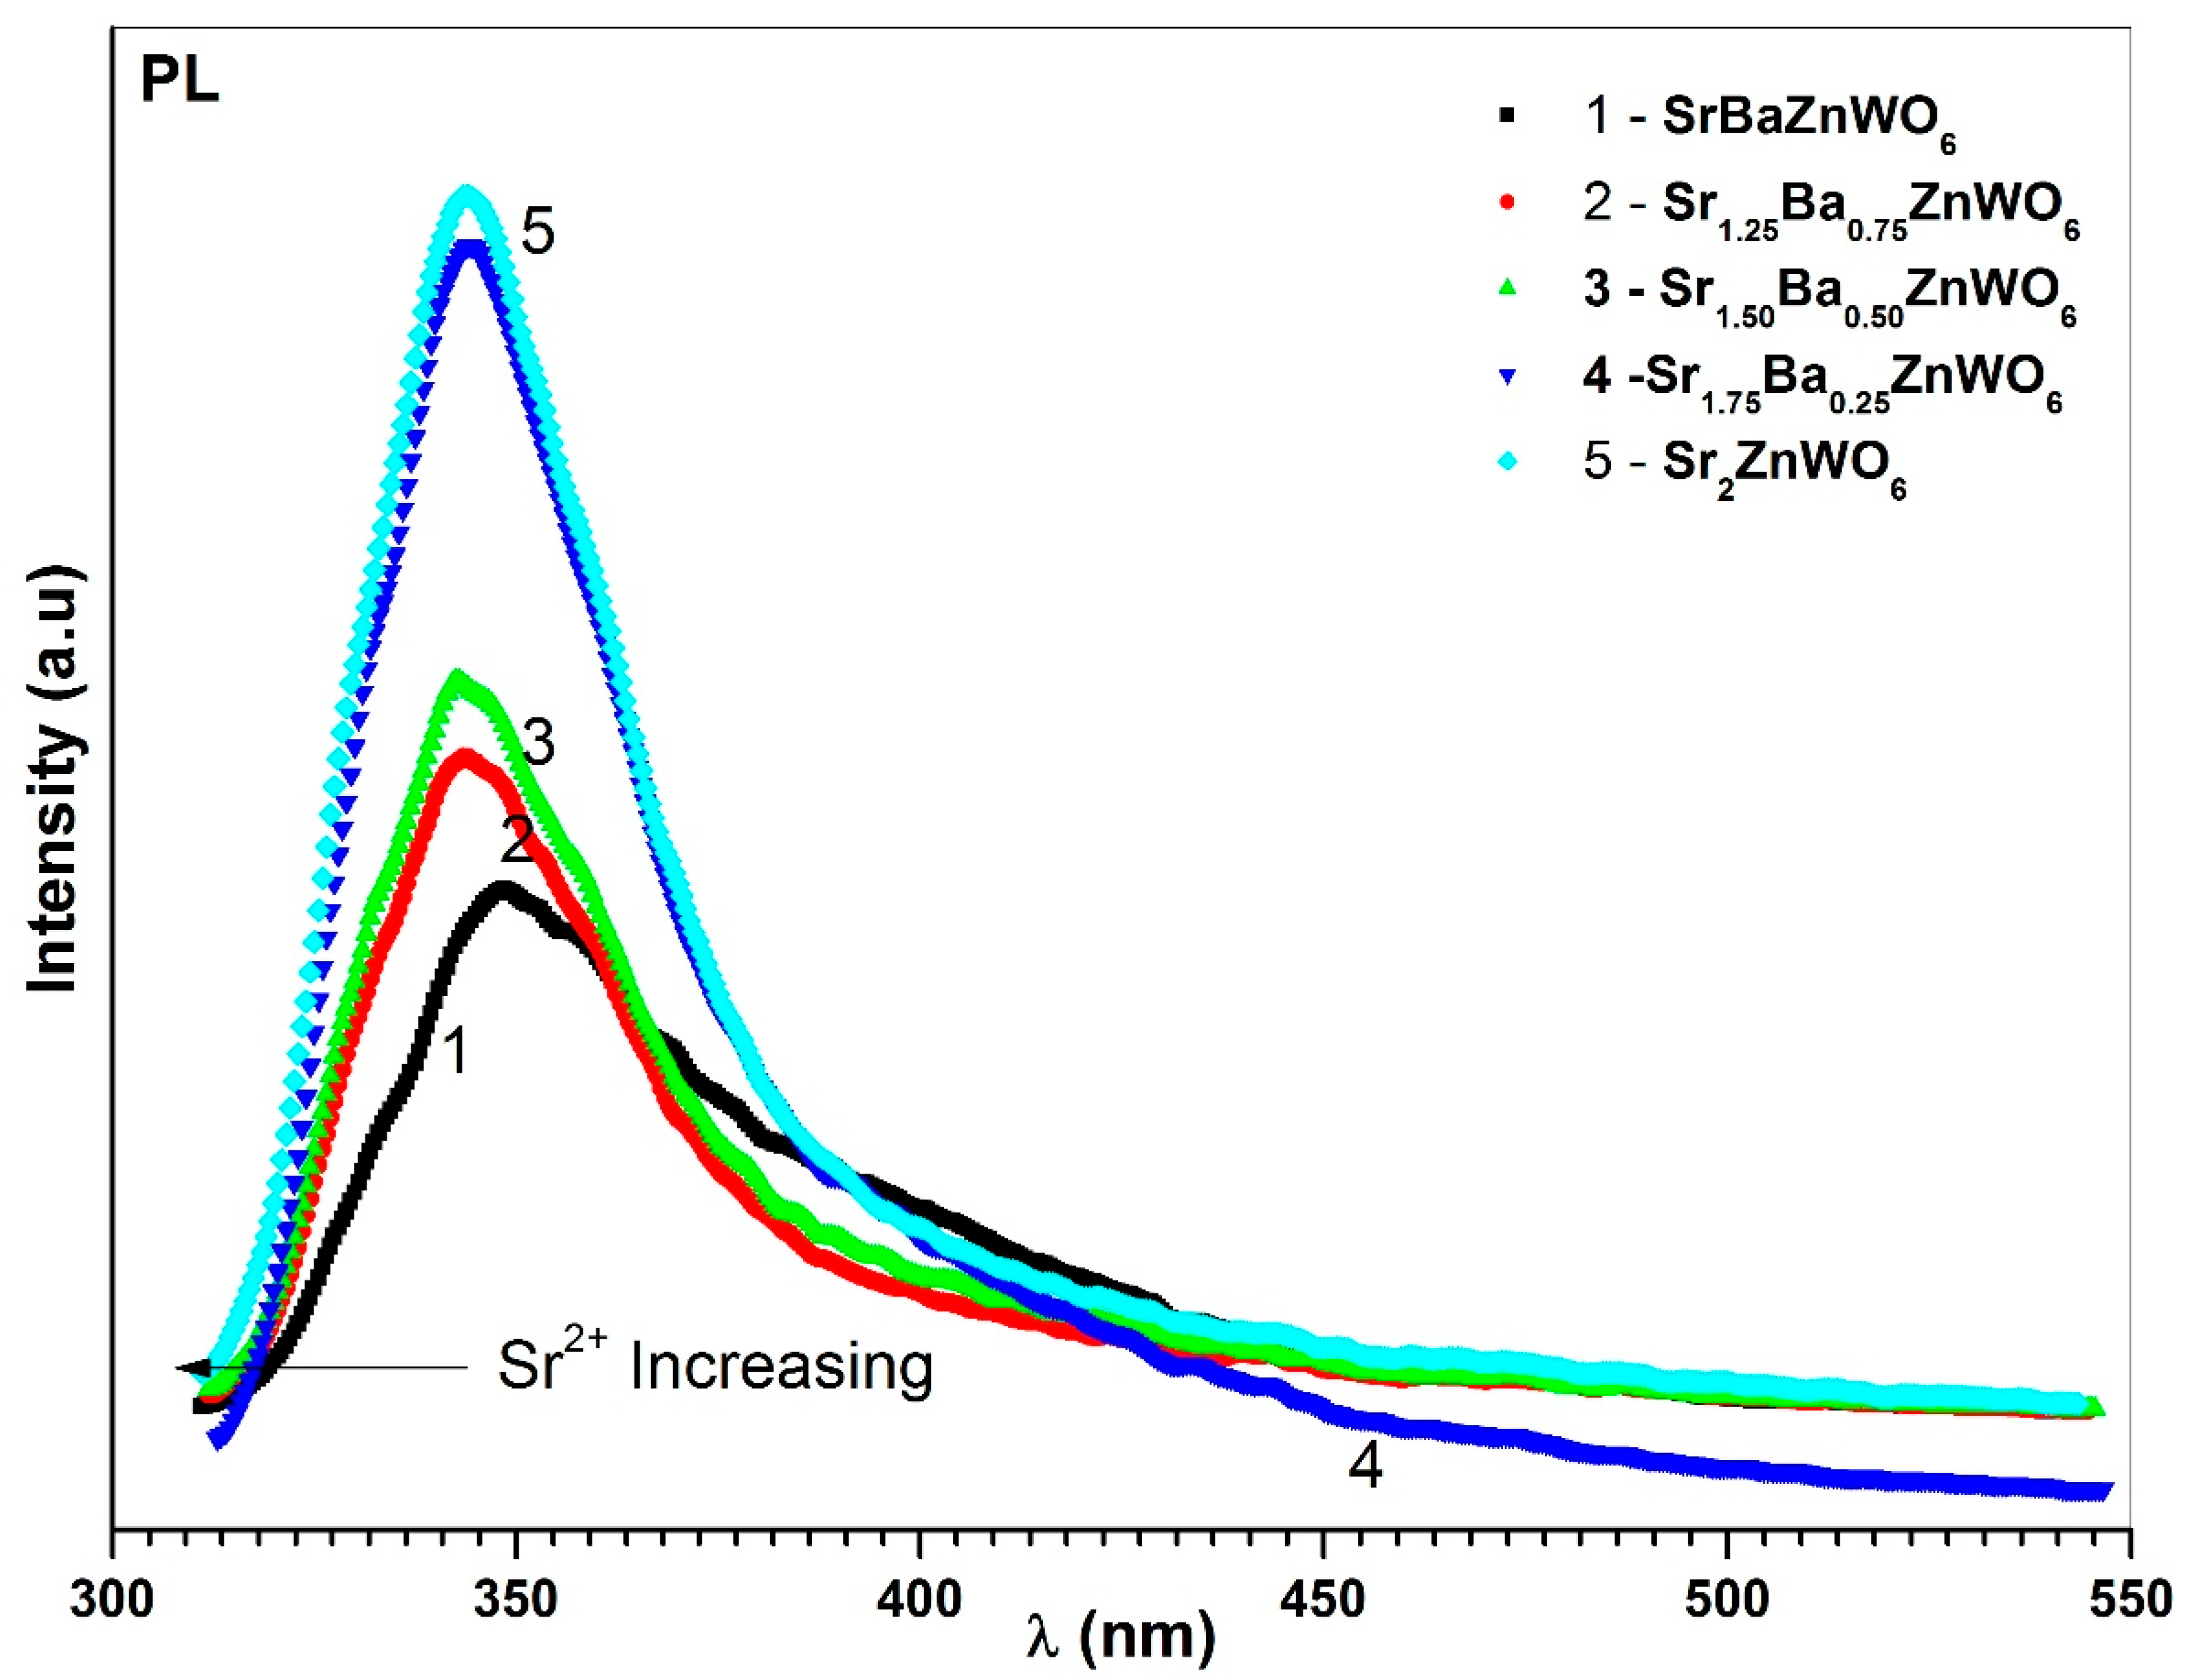
The excitation spectra of the Ba2−xSrxZnWO6 (1.25 ≤ x < 2) series are shown in Figure 11, which were recorded with λem = 342 nm for BaSrZnWO6, λem = 287 nm for Ba0.75Sr1.25 ZnWO6, λem = 342 nm for Ba0.50Sr1.50ZnWO6, λem = 345 nm for Ba0.25Sr1.75 ZnWO6, and λem = 344 nm for Sr2ZnWO6. A broad band was revealed between 260 and 320 nm, which is due to the electronic excitation of the O2− (2p) orbital to W6+ (5d) orbital in octahedral WO6 [36,37]. In addition, the excitation peaks of the DP samples increased with increasing substitution of Ba2+ by Sr2+ cations. Photoluminescence (PL) emission of the DP samples was investigated at λex = 286 nm for BaSrZnWO6, λex = 287 nm for Ba0.75Sr1.25ZnWO6, λex = 287 nm for Ba0.50Sr1.50ZnWO6, λex = 288 nm for Ba0.25Sr1.75ZnWO6, and λex = 285 nm for Sr2ZnWO6. The PL results show that spectral emission was spread between 320 and 450 nm (see Figure 12). Bugaris et al. [15] found a similar result for Ba2ZnWO6, whose emission peak reached its maximum at 539 nm when λ ex = 380   n m . The results here show decreasing intensities at the excitation peaks with an increase in substitution. The PL of BaSrZnWO6 shows that its spectral emission peak is 342 nm with an FWHM of 40 nm. Similarly, Ba0.75Sr1.25ZnWO6, Ba0.50Sr1.50ZnWO6, B01.25Sr1.75ZnWO6, and Sr2ZnWO6 have peaks at 342 nm, 342 nm, 345 nm, and 344 nm, with FWHMs of 45 nm, 40 nm, 40 nm, and 40 nm, respectively.

4. Conclusions

Ba2−xSrxZnWO6 (x = 1, 1.25, 1.50, 1.75, 2) DP samples were prepared successfully by using conventional solid-state reactions. XRD data show that the sample with x = 1 was crystallized in a cubic (Fm-3m) structure, which transformed into a tetragonal (I4/m) phase for samples with 1 ≤ x ≤ 2 and into monoclinic (P21/n) symmetry for samples with x = 2. This was confirmed by the tolerance factor, which was found to be 0.980 for the cubic sample, between 0.970 and 0.985 for the tetragonal (1 ≤ x ≤ 2) samples, and 0.714 for the monoclinic (x = 2) sample. The size of particle was observed to vary between 57.6 and 84.59 nm in the series. The SEM results revealed that the samples had crystallized microstructures with sizes ranging between 1.5 and 7.0 µm. The EDX results confirmed that there were no impurities and that the double peroveskite samples contained the elements of the raw materials only. FTIR and Raman spectroscopy results revealed that the anti-symmetric stretching mode (W–O6) is octahedral around 620 cm−1 and the symmetric stretching vibration appears around 825 cm−1. UV–visible diffuse reflectance confirmed that all samples had a strong absorption band ranging between 300 and 450 nm, which may be due to the charge transfer transition from W6+ to O2− in the lattice from the high orbital (2p) of oxygen to the lowest unfilled orbital (5d) of tungsten (W6+). The band gap energy of the series was found to increase from 3.52 to 3.7 eV with an increase in substitution. The photoluminescence results were calculated at room temperature, while the excitation (PLE) spectra of the series were investigated for different λem. All samples were found to demonstrate a broad band in the range of 260–320 nm, which is a result of the electronic excitation of the O2− (2p) orbital to the W6+ (5d) orbital in the WO6 octahedron. The emission (PL) spectra were found to spread over a range of 320–450 nm for double perovskite samples at different λex.

Author Contributions

Y.A.A., M.S.A., E.M.M., Conceptualization, Methodology, Materials Characterization conceived, designed and performed the experiments. A.A.E., S.D. and M.A.S. performed investigations and data analyses. All authors are provided their scientific efforts during the original draft of manuscript preparation and conceived their support until the acceptance from the journal. All authors have read and agreed to the published version of the manuscript.

Funding

King Saud University, Research Supporting Project, Grant Number (RSP 2019/68).

Acknowledgments

The authors are grateful to the Researchers Supporting Project Number (RSP-2019/68), King Saud University, Riyadh, Saudi Arabia.

Conflicts of Interest

The authors are declaring no conflict of interest.

References

  1. King, G.; Woodward, P. Cation ordering in perovskites. J. Mater. Chem. 2010, 20, 5785–5796. [Google Scholar] [CrossRef]
  2. Knapp, M.C.; Woodward, P. A-site cation ordering in AA′BB′O6 perovskites. J. Solid State Chem. 2006, 179, 1076–1085. [Google Scholar] [CrossRef]
  3. Zelewski, S.; Urban, J.M.; Surrente, A.; Maude, D.K.; Kuc, A.B.; Schade, L.; Johnson, R.D.; Dollmann, M.; Nayak, P.K.; Snaith, H.J.; et al. Revealing the nature of photoluminescence emission in the metal-halide double perovskite Cs2AgBiBr6. J. Mater. Chem. C 2019, 7, 8350–8356. [Google Scholar] [CrossRef]
  4. King, G.; Thimmaiah, S.; Dwivedi, A.; Woodward, P. Synthesis and characterization of new AA′BWO6 perovskites exhibiting simultaneous ordering of A-Site and B-Site cations. Chem. Mater. 2007, 19, 6451–6458. [Google Scholar] [CrossRef]
  5. Xia, Z.; Sun, J.; Du, H.; Chen, D.; Sun, J. Luminescence properties of double-perovskite Sr2Ca1−2xEuxNaxMoO6 red-emitting phosphors prepared by the citric acid-assisted sol–gel method. J. Mater. Sci. 2010, 45, 1553–1559. [Google Scholar] [CrossRef]
  6. Alsabah, Y.A.; AlSalhi, M.S.; Elbadawi, A.A.; Mustafa, E.M. Influence of Zn2+ and Ni2+ cations on the structural and optical properties of Ba2Zn1−xNixWO6 (0 ≤ x ≤ 1) tungsten double perovskites. J. Alloy. Compd. 2017, 701, 797–805. [Google Scholar] [CrossRef]
  7. Hao, F.; Stoumpos, C.C.; Cao, D.H.; Chang, R.P.H.; Kanatzidis, M.G. Lead-free solid-state organic-inorganic halide perovskite solar cells. Nat. Photon. 2014, 8, 489–494. [Google Scholar] [CrossRef]
  8. Qin, P.; Tanaka, S.; Ito, S.; Tetreault, N.; Manabe, K.; Nishino, H.; Nazeeruddin, M.K.; Grätzel, M. Inorganic hole conductor-based lead halide perovskite solar cells with 12.4% conversion efficiency. Nat. Commun. 2014, 5, 3834. [Google Scholar] [CrossRef] [Green Version]
  9. Schaak, R.E.; Mallouk, T.E. Prying apart Ruddlesden− Popper phases: Exfoliation into sheets and nanotubes for assembly of perovskite thin films. Chem. Mater. 2000, 12, 3427–3434. [Google Scholar] [CrossRef]
  10. Uma, S.; Raju, A.R.; Gopalakrishnan, J. Bridging the Ruddlesden–Popper and the Dion–Jacobson series of layered perovskites: Synthesis of layered oxides, A 2–xLa2Ti 3–xNbxO10 (A = K, Rb), exhibiting ion exchange. J. Mater. Chem. 1993, 3, 709–713. [Google Scholar] [CrossRef]
  11. Daniels, L.M. Structures and Properties of Perovskites and Pyrochlores from Hydrothermal Synthesis; University of Warwick: Coventry, UK, 2015. [Google Scholar]
  12. Depianti, J.B.; Orlando, M.; Cavichini, A.; Corrêa, H.P.S.; Rodrigues, V.A.; Passamai, J.L.; O Piedade, E.L.; Belich, H.; Medeiros, E.F.; De Melo, F.C.L. Structural and magnetic investigation of Ca2MnReO6 doped with Ce. Cerâmica 2013, 59, 262–268. [Google Scholar] [CrossRef] [Green Version]
  13. Serrate, D.; De Teresa, J.M.; Ibarra, M.R. Double perovskites with ferromagnetism above room temperature. J. Phys. Condens. Matter 2006, 19, 023201. [Google Scholar] [CrossRef]
  14. Alsabah, Y.A.; Elbadawi, A.A.; Mustafa, E.M.; Siddig, M.A. The effect of replacement of Zn2+ cation with Ni2+ cation on the structural properties of Ba2Zn1–xNixWO6 double perovskite oxides (X= 0, 0.25, 0.50, 0.75, 1). J. Mater. Sci. Chem. Eng. 2016, 4, 61. [Google Scholar]
  15. Bugaris, D.E.; Hodges, J.; Huq, A.; Loye, H.-C.Z. Crystal growth, structures, and optical properties of the cubic double perovskites Ba2MgWO6 and Ba2ZnWO6. J. Solid State Chem. 2011, 184, 2293–2298. [Google Scholar] [CrossRef]
  16. Manoun, B.; Igartua, J.M.; Lazor, P. High temperature Raman spectroscopy studies of the phase transitions in Sr2NiWO6 and Sr2MgWO6 double perovskite oxides. J. Mol. Struct. 2010, 971, 18–22. [Google Scholar] [CrossRef]
  17. Colis, S.; Pourroy, G.; Panissod, P.; Mény, C.; Dinia, A. Correlation between magnetic properties and nuclear magnetic resonance observations in Sr2FeMoO6 double perovskite. J. Magn. Magn. Mater. 2004, 272–276, 2018–2020. [Google Scholar] [CrossRef]
  18. Jose, R.; John, A.M.; James, J.; Nair, K.; Kurian, K.; Koshy, J. Superconducting Bi(2223) films (TC(0) = 110 K) by dip-coating on Ba2LaZrO5.5: A newly developed perovskite ceramic substrate. Mater. Lett. 1999, 41, 112–116. [Google Scholar] [CrossRef]
  19. Zhu, H.; Fang, M.; Huang, Z.; Min, X.; Chen, K.; Guan, M.; Tang, C.; Zhang, L.; Wang, M. Novel chromium doped perovskites A2ZnTiO6 (A = Pr, Gd): Synthesis, crystal structure and photocatalytic activity under simulated solar light irradiation. Appl. Surf. Sci. 2017, 393, 348–356. [Google Scholar] [CrossRef]
  20. Gandhi, A.; Keshri, S. Microwave dielectric properties of double perovskite ceramics. Ceram. Int. 2015, 41, 3693–3700. [Google Scholar] [CrossRef]
  21. Lan, C.; Zhao, S.; Xu, T.; Ma, J.; Hayase, S.; Ma, T. Investigation on structures, band gaps, and electronic structures of lead free La2NiMnO6 double perovskite materials for potential application of solar cell. J. Alloy. Compd. 2016, 655, 208–214. [Google Scholar] [CrossRef]
  22. Gateshki, M.; Igartua, J.M. Crystal structures and phase transitions of the double-perovskite oxides Sr2CaWO6 and Sr2 MgWO6. J. Phys. Condens. Matter 2004, 16, 6639. [Google Scholar] [CrossRef]
  23. Khalyavin, D.D.; Han, J.; Senos, A.M.; Mantas, P.Q. Synthesis and dielectric properties of tungsten-based complex perovskites. J. Mater. Res. 2003, 18, 2600–2607. [Google Scholar] [CrossRef]
  24. Reddy, M.P.; Zhou, X.; Jing, L.; Huang, Q. Microwave sintering, characterization and magnetic properties of double perovskite La2CoMnO6 nanoparticles. Mater. Lett. 2014, 132, 55–58. [Google Scholar] [CrossRef]
  25. Faik, A.; Igartua, J.M.; Pizarro, J.L. Synthesis, structures and temperature-induced phase transitions of the Sr2Cd1−xCaxWO6 (0 ≤ x ≤ 1) double perovskite tungsten oxides. J. Mol. Struct. 2009, 920, 196–201. [Google Scholar] [CrossRef]
  26. Chen, C.; Zhang, H.; Zhang, X.X.; Wang, X.C. Antibacterial and absorbent acrylonitrile-vinylidene chloride copolymer fibres. J. Text. Inst. 2010, 101, 128–134. [Google Scholar] [CrossRef]
  27. Grothe, H.; Tizek, H.; Waller, D.; Stokes, D.J. The crystallization kinetics and morphology of nitric acid trihydrate. Phys. Chem. Chem. Phys. 2006, 8, 2232–2239. [Google Scholar] [CrossRef]
  28. Kavitha, V.T.; Jose, R.; Ramakrishna, S.; Wariar, P.R.S.; Koshy, J. Combustion synthesis and characterization of Ba2NdSbO6 nanocrystals. Bull. Mater. Sci. 2011, 34, 661–665. [Google Scholar] [CrossRef] [Green Version]
  29. Wei, H.-J.; Xing, D.; Wu, G.-Y.; Jin, Y.; Gu, H.-M. Optical properties of human normal small intestine tissue determined by Kubelka-Munk method in vitro. World J. Gastroenterol. 2003, 9, 2068–2072. [Google Scholar] [CrossRef]
  30. Elbadawi, A.A.; Yassin, O.; Siddig, M.A. Effect of the cation size disorder at the A-Site on the structural properties of SrAFeTiO6 double perovskites (A = La, Pr or Nd). J. Mater. Sci. Chem. Eng. 2015, 3, 21–29. [Google Scholar]
  31. Manoun, B.; Ezzahi, A.; Benmokhtar, S.; Ider, A.; Lazor, P.; Bih, L. X-ray diffraction and Raman spectroscopy studies of temperature and composition induced phase transitions in Ba2−xSrxZnWO6 (0 ≤ x ≤ 2) double perovskite oxides. J. Alloy. Compd. 2012, 533, 43–52. [Google Scholar] [CrossRef]
  32. Zhou, Q.; Kennedy, B.J.; Elcombe, M.M. Composition and temperature dependent phase transitions in Co–W double perovskites, a synchrotron X-ray and neutron powder diffraction study. J. Solid State Chem. 2007, 180, 541–548. [Google Scholar] [CrossRef]
  33. Mostafa, M.; Ata-Allah, S.; Youssef, A.; Refai, H. Electric and AC magnetic investigation of the manganites La0.7Ca0.3Mn0.96In0.04xAl(1−x)0.04O3; (0.0 ≤ x ≤ 1.0). J. Magn. Magn. Mater. 2008, 320, 344–353. [Google Scholar] [CrossRef]
  34. Elbadawi, A.; Yassin, O.; Gismelseed, A.A. Effect of the internal pressure and the anti-site disorder on the structure and magnetic properties of ALaFeTiO6 (A = Ca, Sr, Ba) double perovskite oxides. J. Magn. Magn. Mater. 2013, 326, 1–6. [Google Scholar] [CrossRef]
  35. Rodrigues, J.; Bezerra, D.; Hernandes, A. Calculation of the optical phonons in ordered Ba2MgWO6 perovskite using short-range force field model. J. Raman Spectrosc. 2018, 49, 1822–1829. [Google Scholar] [CrossRef]
  36. Diao, C.-L. First-principle calculation and assignment for vibrational spectra of Ba (Mg 1/2 W 1/2) O 3 microwave dielectric ceramic. J. Am. Ceram. Soc. 2013, 96, 2898–2905. [Google Scholar] [CrossRef]
  37. Xiao, N.; Shen, J.; Xiao, T.; Wu, B.; Luo, X.; Li, L.; Wang, Z.; Zhou, X.-J. Sr2CaWxMo1−xO6:Eu3+, Li+: An emission tunable phosphor through site symmetry and excitation wavelength. Mater. Res. Bull. 2015, 70, 684–690. [Google Scholar] [CrossRef]
  38. Xu, D.; Yang, Z.; Sun, J.; Gao, X.; Du, J. Synthesis and luminescence properties of double-perovskite white emitting phosphor Ca3WO6:Dy3+. J. Mater. Sci. Mater. Electron. 2016, 27, 8370–8377. [Google Scholar] [CrossRef]
  39. Chen, F.; Zeng, G.; Yang, Q.; Li, X.; Zeng, G. Facile synthesis of visible-light-active BiOI modified Bi2MoO6 photocatalysts with highly enhanced photocatalytic activity. Ceram. Int. 2016, 42, 2515–2525. [Google Scholar] [CrossRef]
  40. Kittel, C. Introduction to solid state physics. Am. J. Phys. 1967, 35, 547–548. [Google Scholar] [CrossRef] [Green Version]
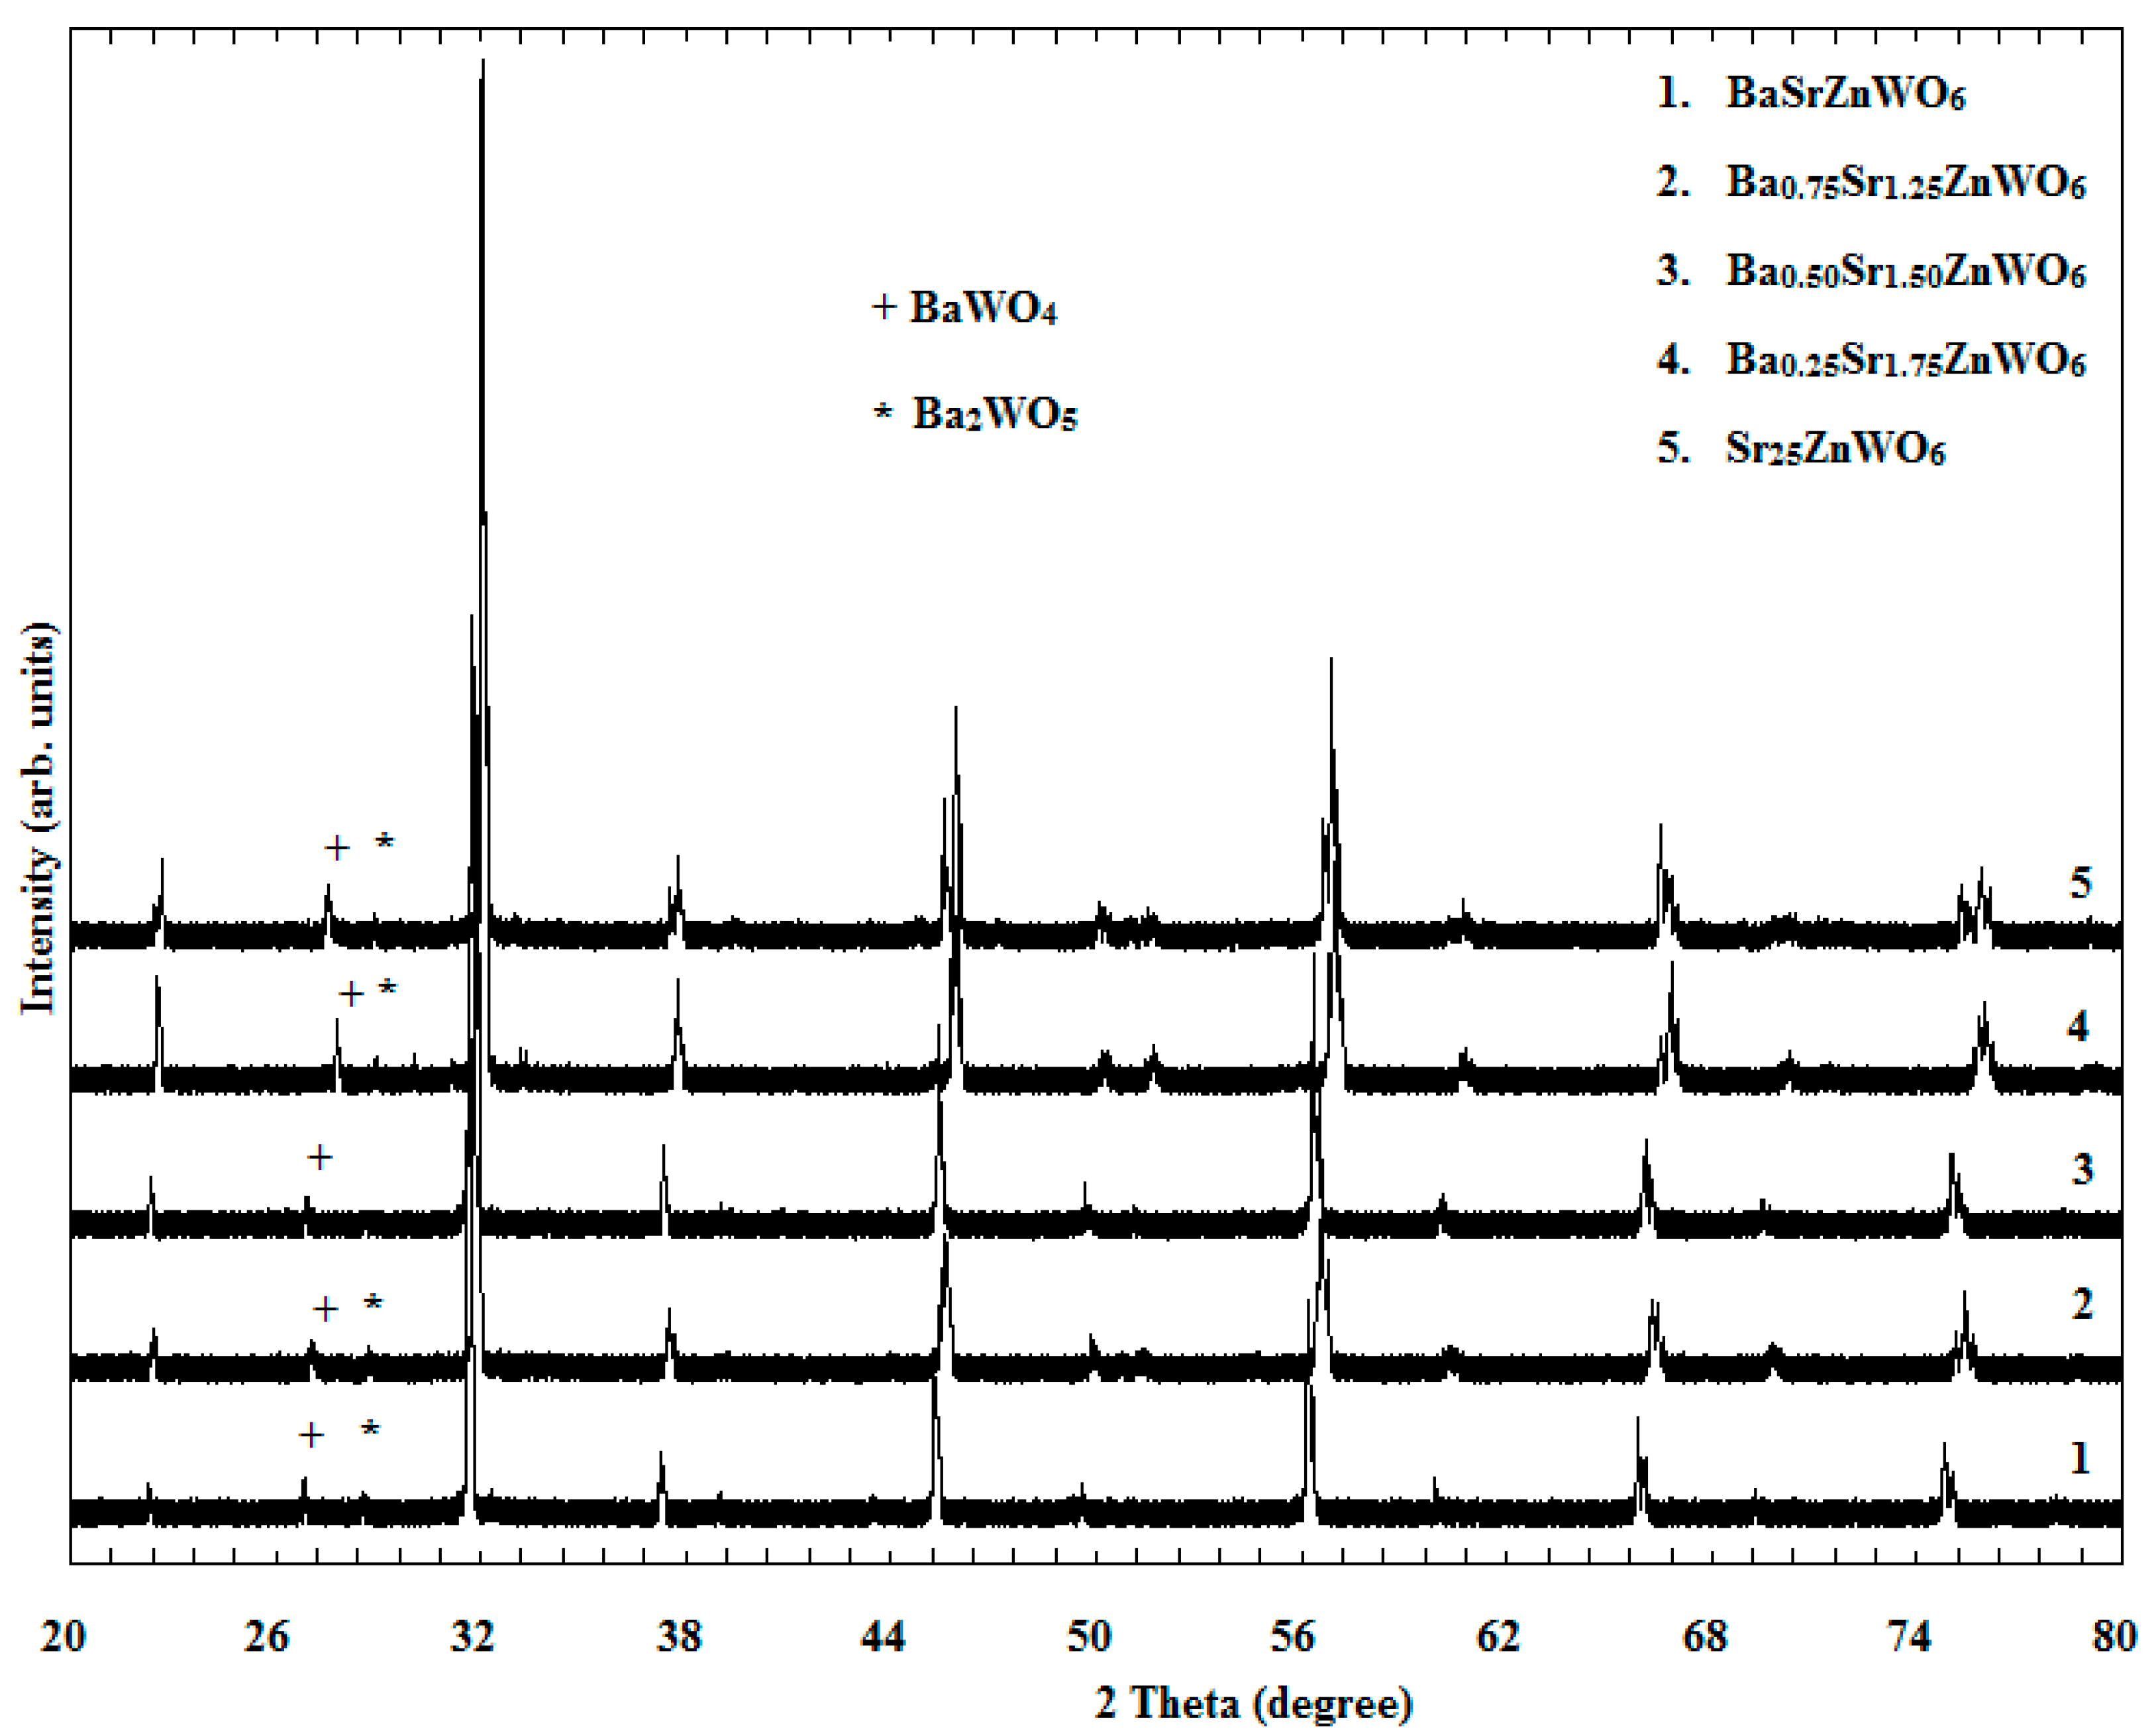
Figure 1. X-ray powder diffraction of the Ba2−x SrxZnWO6 (x = 1, 1.25, 1.50, 1.75, 2) double perovskite series.
Crystals 10 00299 g001
Figure 2. Rietveld refined XRD pattern of the Ba0.75 Sr1.25ZnWO6 sample.
Crystals 10 00299 g002
Figure 3. The relationship between the tolerance factor and the ratio of substitution.
Crystals 10 00299 g003
Figure 4. (ae) SEM images of Ba2−xSrxZnWO6 (x= 1, 1.25, 1.50, 1.75, 2) double perovskite series samples.
Crystals 10 00299 g004
Figure 5. EDX result of the Ba1.75Sr0.25ZnWO6 sample.
Crystals 10 00299 g005
Figure 6. FTIR transmittance spectra of the Ba2−xSrxZnWO6 (x = 1, 1.25, 1.50, 1.75, 2) double perovskite series.
Crystals 10 00299 g006
Figure 7. Raman shift spectra of the Ba2−xSrxZnWO6 (x = 1, 1.25, 1.50, 1.75, 2) double perovskite series.
Crystals 10 00299 g007
Figure 8. Diffuse reflection spectra for the Ba2−xSrxZnWO6 (x = 1, 1.25, 1.50, 1.75, 2) double perovskite series.
Crystals 10 00299 g008
Figure 9. Absorbance (KM function) as a function of wavelength for the Ba2−xSrxZnWO6 (x = 1, 1.25, 1.50, 1.75, 2) double perovskite series.
Crystals 10 00299 g009
Figure 10. (a) Tauc plot depicting the energy band gap in the Ba2−xSrxZnWO6 (x = 1, 1.25, 1.50, 1.75, 2) double perovskite series; (b) The relationship between band gap energy and ratio of Sr2+.
Crystals 10 00299 g010
Figure 11. PLE of the Ba2−xSrxZnWO6 (x = 1, 1.25, 1.50, 1.75, 2) double perovskite series.
Crystals 10 00299 g011
Figure 12. PL of the Ba2−xSrxZnWO6 (x = 1, 1.25, 1.50, 1.75, 2) double perovskite series.
Crystals 10 00299 g012
Table 1. Unit cell parameters, tolerance factors, and crystalline sizes of the Ba2−xSrxZnWO6 (x = 1, 1.25, 1.50, 1.75, 2.00) double perovskite series.
CompositionBaSrZnWO6Ba0.75Sr1.25ZnWO6Ba0.50Sr1.50ZnWO6Ba0.25Sr1.75ZnWO6Sr2ZnWO6
ProgramFullprofFullprofFullprofFullprofFullprof
λKα1 (Å) 1.5406 Å1.5406 Å1.5406 Å1.5406 Å1.5406 Å
Atom number66666
2θ Range (°)20–8020–8020–8020–8020–80
Step scan0.020.020.020.020.02
Zero point (° 2θ) 0.2056200.1964400.1815200.1988300.296540
Caglioti parametesU
V
W
0.016(9)0.330(9)0.006(9)0.199(3)0.096(1)
0.005(7)-0.235(8)0.003(8)−0.089(3)−0.079(2)
0.010(1)0.077(1)0.003(1)0.002(1)0.017(1)
χ 2 1.441.651.451.551.61
RB7.520278.443755.081927.620288.54376
RF9.408138.629356.605799.508148.72936
Crystal StructureCubic TetragonalTetragonalTetragonalMonoclinic
Space groupFm-3mI 4/mI 4/mI 4/mP21/n
a (Å)8.039(1)5.642(2)5.667(1)5.610(1)5.639(1)
b (Å)8.039(1)5.642(2)5.667(1)5.610(1)5.636(1)
C (Å)8.039(1)8.011(3)8.020(2)7.951(1)7.944(1)
α (Å)9090909090
β (Å)9090909090.315
γ (Å)9090909090
V (Å3)519.600(8)255.077(8)257.580(7)250.262(6)252.557(4)
Tolerance factor (T)1.0020.9930.9830.9740.964
Crystalline size (D) (nm3)84.5959.5361.6471.3857.56
Table 2. Atom coordinates of Ba2−xSrxZnWO6 double perovskite series (x = 1.25, 1.50, 1.75, 2) following Rietveld refinement of x-ray powder diffraction.
AtomXYZB (Å2)Occ
BaSrZnWO6
Ba2+0.250(3)0.250(3)0.250(6)0.691(2)0.250
Sr2+0.250(3)0.250(3)0.250(4)0.691(3)0.250
Zn2+0.500(8)0.500(4)0.500(3)1.055(4)0.250
W6+0.0000.0000.0000.365(3)0.250
O12−0.0000.0000.248(2)1.400(2)1.000
O22−0.0000.0000.248(9)0.600(6)0.500
Ba0.75Sr1.25ZnWO6
Ba12+0.0000.500(3)0.250(2)1.857(3)0.188
Ba22+0.0000.500(4)0.250(3)1.857(5)0.313
Zn2+0.0000.0000.0000.992(4)0.250
W6+0.0000.0000.500(3)0.187(3)0.250
O12−0.319(4)0.227(3)0.0001.770(4)1.000
O22−0.0000.0000.258(2)1.770(4)0.500
Ba0.50Sr1.50ZnWO6
Ba2+0.0000.500(2)0.250(3)0.600(4)0.125
Sr2+0.0000.500(2)0.250(2)0.600(4)0.375
Zn2+0.0000.0000.0001.900(4)0.250
W6+0.0000.0000.500(3)0.941(3)0.250
O12−0.332(7)0.213(3)0.0000.800(3)1.000
O22−0.0000.0000.251(5)0.800(7)0.500
Ba0.25Sr1.75ZnWO6
Ba2+0.0000.500(2)0.250(3)1.868(4)0.063
Sr2+0.0000.500(5)0.250(4)1.868(7)0.438
Zn2+0.0000.0000.0000.161(4)0.250
W6+0.0000.0000.500(3)0.140(6)0.250
O12−0.330(2)0.202(2)0.0001.666(3)1.000
O22−0.0000.0000.363(2)1.298(3)0.500
Sr2ZnWO6
Sr22+0.008(4)0.515(2)0.250(7)0.577(2)0.500
Zn2+0.0000.0000.0000.402(3)0.250
W6+0.500(1)0.500(4)0.0000.402(3)0.250
O12−0.267(4)0.018(3)0.003(3)1.000(4)0.500
O22−0.250(4)−0.006(3)−0.009(4)1.000(4)0.500
O22−−0.051(3)0.250(2)0.117(4)1.000(6)0.500
Table 3. The EDX results for the Ba2−xSrxZnWO6 (x = 1, 1.25, 1.50, 1.75, 2.00) double perovskite series samples.
ElementsX = 1.00X = 1.25X = 1.50X = 1.75X = 2.00
Weight %Atomic %Weight %Atomic %Weight %Atomic %Weight %Atomic %Weight %Atomic %
C K9.2932.757.1727.179.3233.7110.8234.7743.3273.24
O K14.5838.6113.9639.7412.9335.1215.5937.6013.2416.80
Zn K11.267.3013.439.3615.039.9914.058.3018.865.86
Sr L16.157.8123.7812.3618.999.4229.5413.0110.792.50
Ba L2.881.3412.554.1617.615.570.370.102.090.31
W M21.046.4929.117.2126.136.1829.626.2211.701.29
Totals100.0 100.00 100.00 100.00 100.00
Table 4. Band gap energy (according to absorption edge and Tauc plot for direct transition) for the Ba2−xSrxZnWO6 (x = 1, 1.25, 1.50, 1.75, 2.00) double perovskite series.
X RatioX = 1X = 1.25X = 1.50X = 1.75X = 2
Cut-off wavelength (nm)388345343337326
Eg (eV) by cutoff wavelength3.443.593.613.673.8
Eg (eV) by Tauc plot3.503.583.603.693.7