Article

Microstructure, Texture, and Strength Development during High-Pressure Torsion of CrMnFeCoNi High-Entropy Alloy

1
Institute of Solid State and Materials Physics, Technische Universität Dresden, D-01062 Dresden, Germany
2
Department of Materials Physics, Eötvös University, H-1117 Budapest, Hungary
3
Materials Performance Centre, School of Materials, The University of Manchester, Manchester M13 9PL, UK
4
Department of Materials Science, Chair of Materials Physics, Montanuniversität Leoben, A-8700 Leoben, Austria
5
Erich Schmid Institute of Materials Science, Austrian Academy of Sciences, 8700 Leoben, Austria
6
Materials Science and Technology Division, Oak Ridge National Laboratory, Oak Ridge, TN 37831, USA
7
Department of Materials Science and Engineering, University of Tennessee, Knoxville, TN 37996, USA
*
Author to whom correspondence should be addressed.
Crystals 2020, 10(4), 336; https://doi.org/10.3390/cryst10040336
Submission received: 27 March 2020 / Revised: 19 April 2020 / Accepted: 20 April 2020 / Published: 24 April 2020
(This article belongs to the Special Issue Crystal Plasticity)

Abstract

:
The equiatomic face-centered cubic high-entropy alloy CrMnFeCoNi was severely deformed at room and liquid nitrogen temperature by high-pressure torsion up to shear strains of about 170. Its microstructure was analyzed by X-ray line profile analysis and transmission electron microscopy and its texture by X-ray microdiffraction. Microhardness measurements, after severe plastic deformation, were done at room temperature. It is shown that at a shear strain of about 20, a steady state grain size of 24 nm, and a dislocation density of the order of 1016 m−2 is reached. The dislocations are mainly screw-type with low dipole character. Mechanical twinning at room temperature is replaced by a martensitic phase transformation at 77 K. The texture developed at room temperature is typical for sheared face-centered cubic nanocrystalline metals, but it is extremely weak and becomes almost random after high-pressure torsion at 77 K. The strength of the nanocrystalline material produced by high-pressure torsion at 77 K is lower than that produced at room temperature. The results are discussed in terms of different mechanisms of deformation, including dislocation generation and propagation, twinning, grain boundary sliding, and phase transformation.

1. Introduction

High-entropy alloys (HEAs) represent a new class of single-phase multi-element (≥5) solid solution alloys with near-equiatomic concentrations of the individual elements [1]. In some cases, due to the large number of constituent elements the contribution of configurational entropy to the Gibbs free energy is high enough to suppress compound formation and phase separation. Among the wide variety of reported HEAs with simple crystal structures, such as face-centered cubic (FCC), body-centered cubic (BCC), and hexagonal close-packed (HCP), the most thoroughly investigated alloy is the quinary equiatomic FCC HEA CrMnFeCoNi [2] often referred to as Cantor alloy. This alloy is stable as an FCC single-phase solid solution at high temperatures above about 1073 K [3,4], but decomposes into several different metallic and intermetallic phases during annealing at intermediate temperatures [4,5,6]. Application of hydrostatic pressure at room temperature (RT) transforms it to the HCP structure, see recent review [7]. The transformation is sluggish and occurs over a large pressure range. During depressurization part of the HCP phase transforms back to FCC. The back-transformation is suppressed up to a high annealing temperature. Although the onset pressure of the HCC phase transformation reported in the literature varies much, some trends are evident and may account for the large scatter. With decreasing hydrostaticity, i.e., increasing deviatoric stress, the onset pressure decreases, while for decreasing grain size it increases. These results are in agreement with finite-temperature ab initio calculations showing that the HCP structure is energetically favored at low temperatures [8,9,10].
In the FCC solid-solution state the Cantor alloy exhibits certain noteworthy mechanical properties, including simultaneous strength and ductility increase with decreasing temperature leading to outstanding fracture toughness at cryogenic temperatures, see recent review [11]. To unravel the deformation mechanisms of these advanced alloys numerous investigations of microstructure and texture have been carried out on polycrystalline samples deformed by tension, wire drawing, swaging, compression, rolling, and high-pressure torsion (HPT), for a recent review see [12]. It is found that at RT and below, above a certain stress (equivalently strain) in addition to dislocation slip mechanical twinning contributes to deformation. Twinning is more pronounced at cryogenic temperatures. There is texture formation during deformation, but its intensity is quite low. The observed dislocation dissociation and texture are typical of medium/low stacking fault energy (SFE) metals and alloys.
The present paper extends recent work of the authors on microstructure and texture development of CrMnFeCoNi HEA processed by HPT at RT [13]. Here a similar detailed study was conducted at liquid nitrogen temperature (LNT, 77 K). Moreover, the microhardness of the HPT deformed materials was measured at RT. Emphasis is put on the differences in microstructure, texture and strength observed for the two HPT deformation temperatures.

2. Experimental

The CrMnFeCoNi HEA was synthesized from high-purity elements (>99.9 wt.%) by arc melting and drop casting under pure argon atmosphere into cylindrical molds (diameter: 25.4 mm, length: 127 mm). The drop-cast ingots were encapsulated in evacuated quartz ampules and homogenized for 48 h at 1200 °C. Discs with a radius r = 4 mm and an initial thickness ti ≈ 0.8 mm were cut from the cast and homogenized ingots and deformed by HPT [14]. During HPT the shear strain along the radius is approximately given by γ = 2πrn/<t>, where n is the number of rotations (Rot n) and <t> = (ti + tf)/2 with tf = final thickness. With this approximation the maximum error in shear strain is less than 15%. HPT under a quasi-hydrostatic pressure of 7.8 GPa was conducted at RT and LNT at a nominal speed of 0.2 rotations/min yielding a maximum initial shear strain rate of 10−1 s−1 at the outer radius. The initial grain size was several hundred micrometers, while the saturation microstructure after HPT at RT was estimated by transmission electron microscopy to consist of grains with a size of about 50 nm. During HPT at RT the alloy does not decompose as confirmed by 3D atom probe tomography [4].
To investigate the microstructure, X-ray diffraction (XRD) measurements were carried out in a special high-resolution diffractometer dedicated to line-profile-analysis using Cu Kα1 radiation, for details see [13,15]. The measurements are done along the radius of the HPT discs, i.e., at positions where the shear strains are different. The line profiles are evaluated by using the convolutional multiple whole profile (CMWP) procedure [16]. The measured diffraction pattern is matched by the theoretically calculated and convoluted profile functions accounting for the effects of size, distortion, planar defects and instrumental effects, while the background is determined separately. Because of the double-crystal high resolution diffractometer used, the instrumental effect is neglected [15]. The parameters obtained by using the CMWP method characterizing the substructure are the area average crystallite (subgrain) size <x>area, dislocation density ρ, dislocation character q (edge versus screw), dislocation arrangement parameter M = Re ρ (Re = effective outer cut-off radius of dislocations), twin density β (number of twin boundary planes within hundred {111} lattice planes parallel to the twin boundary) and average distance between adjacent twin boundaries dTw = 100 d{111}/β. The M parameter is closely related to the dipole character of the dislocation arrangements [16]. In plastic deformation there are usually equal numbers of plus and minus dislocations, where the plus-minus pairs form dislocation dipoles. When the two dislocations in the pairs are close or far from each other the dipole character is strong or weak and the corresponding M parameter close to unity or considerably larger than one, respectively. The CMWP procedure can handle more than one phase [16]. This option is used to evaluate the dislocation, size and planar defect parameters in the FCC and HCP phases at the same time. The two separate phases are identified unequivocally by indexing and using the non-overlapping peaks in the evaluation process. The overlapping peaks are also evaluated as two separate peaks, where the intensities are given according to the volume fractions of the two phases deduced from the non-overlapping peaks.
In addition, standard bright-field images and diffraction patterns were taken with a JEOL 2100F image-side CS-corrected transmission electron microscope (JEOL Ltd., Tokyo, Japan) at an acceleration voltage of 200 kV. Specimen preparation for transmission electron microscopy (TEM) was done by conventional electropolishing.
In order to resolve the local texture of the deformed discs along the radial direction, i.e., as a function of increasing shear strain from the middle to the edge of the disc, two-dimensional X-ray micro-diffraction was performed using the system D8 Discover (BRUKER AXS GmbH, Karlsruhe, Germany). The system is equipped with an Euler cradle including x-y-z-stage, a laser-video adjustment system, a low-power micro-focus X-ray tube IμS (Cu Kα radiation, spot size about 100 μm) and a two-dimensional detector VÅNTEC 2000. The intensities of the measured Debye-Scherrer rings were integrated along their curvature to calculate the pole figures (200, 220, and 111) on a 5° × 5° grid. For calculation of the orientation distribution function (ODF) with these pole figures Multex 3 [17] and LaboTex software [18] were used. The Euler angles given are in the Bunge notation [19] with crystal and sample reference systems defined as x‖ shear direction, y‖ shear plane normal and z‖ transverse direction yielding an ODF representation appropriate for simple shear [20]. The textures are represented by φ2 = 45° ODF-sections, which for FCC metals contain all major shear components.
Vickers hardness (HV0.5) values were measured at RT using a Zwick/Roell-ZHμ-Indentec microhardness tester (Zwick/Roell GmbH & Co. KG, Ulm, Germany). The measurements were done along the radius of the disc-shaped samples from the center to the edge, i.e., as a function of shear strain. The hardness values presented here correspond to those radial positions where the XRD measurements were made.

3. Results

The most striking feature observed by XRD is the phase transformation from FCC to HCP at LNT (Figure 1). Unfortunately, the XRD pattern at LNT is not suitable to quantitatively estimate the volume fraction of the HCP phase. A very rough estimate made by comparing the intensities of non-overlapping HCP and FCC peaks yields a volume fraction of about 30%. To overcome this problem, diffraction of high-energy synchrotron radiation and Rietveld analysis is under way.
The results of the CMWP analysis show that during HPT of CrMnFeCoNi HEA a very fast refinement of the FCC microstructure takes place. The crystallite size (<x>area) after HPT at RT and 77 K reaches a very low steady-state value of 24 nm after a shear strain of about 20 (Figure 2). Simultaneously, the dislocation density saturates at 3 × 10¹⁶ m−2 (Figure 3a). Surprisingly, it is lower for HPT at 77 K (1016 m−2). The dislocation character q, after HPT at RT, changes from near edge-type (qedge = 1.4) to near screw-type (qscrew = 2.4) and then slightly decreases to 2, which is the saturation value after HPT at 77 K (Figure 3b). The dipole character M is quite weak (M > 1) and after HPT at RT saturates at about 6 (Figure 3c). It is even weaker after HPT at 77 K, about twice as large. The twin density after HPT at RT reaches a maximum value of 2% at γ ≈ 20 (Figure 4a) leading to a mean twin separation distance dTw smaller than <x>area for 10 < γ < 60 (Figure 4b). After HPT at 77 K instead of twinning a phase transformation from FCC to HCP is observed (Figure 1 and Figure 5a). There are clear diffraction peaks of the HCP phase ((100) and (101)) found in the X-ray diffractogram (Figure 1) and the TEM diffraction pattern (Figure 5b). Unfortunately, the HCP diffraction spots cannot be selected separately to locally identify the HCP phase by dark-field imaging. However, in comparison with high resolution TEM images of CrFeCoNi and CrCoNi medium-entropy alloys (MEAs) [21,22] tensile tested at cryogenic temperatures the lamellar features observed may be reasonably attributed to the HCP phase. The spotty TEM diffraction pattern for HPT at LNT in comparison to that at RT [4] indicates that with decreasing temperature deformation becomes more heterogeneous. It should be mentioned that despite of differences in the production of the starting HEA material resulting in different grain sizes and probably slightly different textures, and differences in HPT parameters (sample size, hydrostatic pressure, rotation speed), the steady-state crystallite sizes and dislocation and twin densities as well as microhardness values reported agree quite well with those of the present study, both for HPT at RT [23,24] and LNT [23]. An exception are the results given in [25], where evidently the steady-state has not been reached.
The texture observed after HPT is the typical shear texture observed in FCC metals and alloys. Because of the initial coarse-grain structure the texture measured by micro-diffraction is statistically reliable only after a shear strain of about 5. As shown in Figure 6a, the texture of CrMnFeCoNi HEA after HPT at RT is quite weak (below 2.5 mrd). The main texture components developed by dislocation slip and mechanical twinning are {111}<112> (A1*/A2*) and {112}<110> (B/ B ¯ ), with (B/ B ¯ ) dominating (Figure 6b). With increasing twinning activity the volume fraction of these components decreases. When twinning ceases texture intensity initially increases but then decreases again at high shear strains. The texture is less developed after HPT at 77 K.
The Vickers hardness measured at RT increases with shear strain and saturates at about the same strain level as the crystallite size and dislocation density (Figure 7). The saturation hardness is about 500 HV and 450 HV for samples HPT-deformed at RT and 77 K, respectively. Reasons for this anomalous strength behaviour are discussed below.

4. Discussion

4.1. Microstructure Development

The strong grain refinement of the FCC HEA during HPT at RT is correlated to the high mechanical twinning activity in the medium SFE (≤30 mJm−2 [8,26,27]) alloy [11]. Based on TEM investigations a mechanism of fast grain refinement via primary and secondary twinning has been proposed by Wang et al. [28] for brass. Primary twins by accumulation of a high density of dislocations evolve into curved high angle grain boundaries from which secondary twins are emitted. The emission of secondary twins further refines the grains and transforms the elongated grains into equiaxed nanograins. At a certain shear strain twinning ceases, may be because grain boundary sliding takes over as the deformation mechanism. A supporting indication of this is the further randomization of texture [29,30]. The generally low texture strength may be also caused by twinning. In addition to twinning, in CrFeCoNi MEA Wu et al. [31] observed nanobands and attributed the significant grain refinement to concurrent nanoband subdivision and deformation twinning. Instead of mechanical twinning, during HPT at LNT a strain-induced phase transformation takes place. Nano HCP lamellae seem to have a similar effect on grain refinement as twin lamellae. Surprisingly, despite of phase transformation and in particular the 220 °C lower HPT temperature, the steady state crystallite size in the FCC phase is not smaller than that after HPT at RT. Reasons for this finding may be: (i) dynamic recrystallization, and/or (ii) static recrystallization/grain growth, and/or (iii) back-transformation of part of the HCP phase to FCC during pressure release, heating up to RT, and storage at this temperature. All these processes depend on purity of the material, SFE, temperature and degree of deformation, and annealing temperature. A clear distinction between dynamic and static behaviour can be only made by in-situ studies. Evidence for process (ii) has been provided for pure metals HPT-deformed at cryogenic temperature (100 K) [32], but also for Cr26Mn20Fe20Co20Ni14 HPT deformed at LNT [33]. This HEA has a low SFE (3.5 mJm−2) and a moderate melting temperature Tm = 1557 K. Thus, HPT at LNT (homologous temperature T/Tm = 0.05) leads to an increased stored energy of deformation promoting “self-annealing” at RT (T/Tm = 0.19). In contrast, the SFE of the Cantor alloy is much higher (see above) and therefore, “self-annealing” is less likely and so far to the best of our knowledge has not been reported for this alloy. Moreover, neither in the Cantor alloy nor in other HEAs nothing is known yet about process (iii).
It is also surprising that the dislocation density after HPT at LNT is lower than that after HPT at RT. A plausible reason would be recovery during “self-annealing”, as was found for Cr26Mn20Fe20Co20Ni14 [33] in combination with a lowering of the microhardness. However, the same effect has not been observed for the Cantor alloy [23]. Therefore, it has been suggested, that the shear produced by the deformation-induced HCP phase formation leads to a reduction in strain and, thus, to a reduction in dislocation density in the FCC phase.
The medium SFE of the Cantor alloy leads to widely dissociated dislocations (screws: 4 nm, edges: 6 nm) [26]. After relatively low compressive strains at 77 K, dislocations with long screw segments and large kinks having mixed character are seen on the {111} planes suggesting that the mobilities of edge and screw dislocations are not significantly different [26]. Here, we also find that during HPT at RT and 77 K the dislocation character tends to become more screw-like with increasing shear strain taking a value of q ≈ 2 at large shear strain. It is somewhat surprising that the steady-state dipole character of dislocations observed is low and becomes even lower at LNT (RT: M ≈ 5; 77 K: M ≈ 12). This may be caused by the wide dislocation dissociation suppressing thermally activated edge dislocation climb and screw dislocation cross slip.
Hydrostatic pressure applied to the Cantor alloy stabilizes the HCP structure [7]. To transform the FCC phase to HCP a certain onset pressure is necessary depending on hydrostaticity and grain size. On the one hand, by using different media to apply pressure, the onset pressure at RT decreases from 22.1 GPa (helium) to 6.9 (silicone oil) and 2.2–6.6 GPa (amorphous boron), i.e., with increasing non-hydrostaticity [34,35] (see also effect on iron [36]). On the other hand, for a given medium, silicone oil, decreasing the grain size from 5 μm to about 0.01 μm increases the onset pressure from 6.9 to 12.3 GPa [35]. As the FCC to HCP martensitic transformation takes place by slip of 1/6 <112> partial dislocations on every second {111} plane [37], it is surprising, that in the present case under high shear stress, HPT at RT under a pressure of 7.8 GPa did not lead to the transformation. The reason may be the fast grain refinement into the nano range suppressing the transformation similar to deformation twinning [38]. However, lowering the HPT temperature to 77 K, i.e., lowering the SFE [8,10], favours the transformation at the pressure applied.

4.2. Texture Formation

The brass-type texture in shear at RT with strong B/ B ¯ components agrees with results of texture simulations on HPT samples of nanocrystalline Pd-10at.%Au alloy [39] and rolling of nanocrystalline Ni-18.7at.%Fe alloy [40] despite the much lower SFE of the Cantor alloy. These simulations strongly suggest that nanoplasticity is determined by slip of partial dislocations emitted from the grain boundaries also leading to twinning. Twinning may have led to the almost equal intensities of the twinning related A1* and A2* shear components. Recent simulations also show that grain boundary sliding leads to randomization of the texture while maintaining the texture signature [29,30]. Thus, grain boundary sliding in the nano-grained HEA during RT-HPT may have led to the weak texture observed.
The texture after HPT at LNT is characterized by many low intensity maxima spread almost randomly in the ODF (Figure 6a). This may be caused by the heterogeneous deformation at LNT indicated by the spotty TEM diffraction pattern of Figure 5b. According to the discussion above, recrystallization by “self-annealing” may be excluded.

4.3. Strength Development

The enormous grain refinement during HPT of the Cantor alloy leads to a nanocrystalline material with a crystallite size of about 24 nm and a dislocation density of the order of 1016 m−2. These values are comparable to those of nanocrystalline Pd-10at.%Au produced by a bottom–up technique (consolidation of inert gas condensated powder) and subjected to HPT [39]. In that case grain coarsening from an initial crystallite size of 16 nm led to a higher steady-state value, while the high initial dislocation density decreased to a lower steady-state value. Thus, HPT leads to a steady-state microstructure by either grain refinement or grain coarsening. In the following, we will pursue the issue of which mechanisms determine the strength of the nanocrystalline Cantor alloy measured by microhardness at RT.
The transition from grain size softening to grain size hardening takes place at a grain size of about 20 nm [39]. From the microhardness of 510 HV a maximum stress σmax ≈ 10 HV/3 = 1.7 GPa for the RT HPT-deformed material (Figure 7) can be estimated, which represents about the maximum strength achievable at RT in the polycrystalline Cantor alloy. This value is about 1/20 of the theoretical strength σthMTG/2π, with the shear modulus G = 79 GPa [26] and the Taylor factor MT = 3.07 for a random orientation distribution. In the case of nanocrystalline Pd-10at.%Au a slightly higher value 1/15 was measured [39]. The strength determined here from microhardness is about 15% lower than that measured in tension (1.95 GPa [4]) and compression (2.0 GPa [41]). This discrepancy may be due to the generally used formula for conversion of microhardness to strength, but does not change the conclusions drawn below.
For the material deformed by HPT at LNT the strength at RT (1.5 GPa) is about 10% lower than for that deformed by HPT at RT. Scheriau et al. [42] made a similar observation for a modified 316L austenitic steel. To search for the reason, it is necessary to look for the differences in texture and microstructure after HPT at the two temperatures. The texture is quite weak, almost random, after large-strain HPT at RT and LNT. Therefore, the small texture difference observed may not account for the strength anomaly. With regard to microstructure the estimate of the crystallite size is about the same, while the dislocation density is lower and the dipole character is weaker after HPT at LNT compared to HPT at RT. In addition, based on TEM and texture investigations the microstructure is quite inhomogeneous. The large scatter in local nanohardness measured by Podolskiy et al. [23] supports this statement. Moreover, the material consists of a certain volume fraction of HCP phase after HPT at LNT. In an HEA of different composition (Cr20Mn6Fe34Co34Ni6), which is prone to the same phase transformation, compression of micro pillars shows that the HCP phase is harder than the FCC one [43]. This also explains the higher strength measured for the dual phase alloy Cr10Mn30Fe50Co10 [44]. Here, this harder phase cannot be responsible for the lower strength measured, rather it may have indirectly led to the inhomogeneous microstructure with lower average dislocation density in the FCC phase evidently determining the strength anomaly. However, the inhomogeneity of the microstructure may be just a low temperature effect. For more speculations about the strength anomaly and special experiments to prove its existence under in-situ HPT conditions, the reader is referred to the recent work of Podolskiy et al. [23].
For the nanocrystalline Cantor alloy, as dislocation sources in the nanograins are unlikely, the strength may be determined either by nucleation of full dislocations and/or partial dislocations at grain boundaries (i), or by propagation of the dislocations through the nano grains and getting absorbed by the opposing grain boundary. In the latter case, the dislocations experience lattice friction (ii), and interac with solutes (iii), remnant dislocations (iv), SFs, twin boundaries, and HCP lamellae (v). The resulting yield stresses for mechanisms (i) and (iv) are approximately given by the following equations:
Full dislocation emission [45]:
σ L = M T G b d
Partial dislocation emission [45]:
σ P = M T ( α 1 α γ S F b + 1 3 G b d )
Dislocation passing [46]:
σ ρ = M T G b 2 π ρ
With b = b (1/2 <110>) = 0.255 nm [26], α = d/δ (δ b 2 12 π G γ S F = 18 b equilibrium dislocation splitting [45]), γSF = 30 mJ/m2 SFE [26], for the grain size d = 24 nm and ρ = 3 × 10¹⁶/m2 at RT the equations above yield σL = 2.6 GPa, σP = 1.1 GPa, and σρ = 1.7 GPa. The friction stress (Peierls stress at 0 K) has been estimated by density functional theory calculations to be σF = MF 0.178 GPa = 0.546 GPa [47]. Due to thermally activated kink formation it is negligible at RT [41]. The solid solution strengthening at 0 K is σSS ≈ 0.4 GPa [41]. Due to thermal activation the stress contribution at RT is negligible, too [41]. The density of SFs and twin lamellae is low at RT due to nano grain size (Figure 4). Consequently, their strengthening effect can be neglected. Hence, the stress for propagation of dislocations at RT is σρ ≈ 1.7 GPa. For the material that is HPT-deformed at LNT, because of a lower dislocation density, only the interaction stress of dislocations σρ changes to 1.2 GPa. Moreover, there is an additional contribution from the interaction of dislocations with HCP lamellae. Comparing these values with σmax it is concluded that the yield stress of the nanocrystalline Cantor alloy at RT is predominantly determined by dislocation–dislocation interaction. A similar conclusion has been drawn by Podolskiy et al. [23] and Heczel et al. [24]. Moreover, Podolskiy et al. [23] argued that the smaller strength at cryogenic HPT processing can be understood as an indirect consequence of the shear-induced FCC to HCP martensitic phase transformation. This transformation provides a significant part of the shear strain, which must not be supplied by dislocation activity in the FCC phase and, thus, may allow for a reduction in dislocation density. The corresponding reduction of Taylor hardening is almost equal to the reduction in macroscopic strength so that other contributions to it appear to be negligible. To study the effect of the FCC to HCP martensitic phase transformation on the strength of the Cantor alloy in more detail, HPT at different pressures at LNT producing different volume fractions of HCP phase is under way.
The strengthening mechanism of the nanocrystalline Cantor alloy differs from that of nanocrystalline Pd-10at.%Au alloy, where the strength is mainly determined by the emission of full and partial dislocations from grain boundaries [39]. However, the effect of partial dislocation slip on texture development is the same. This also holds for grain boundary sliding as a strain contributing mechanism for grain sizes at the transition to grain boundary softening.
Apparently, the classical strength approach describes quite well the results on nanoplasticity presented here. However, considering all structure and strength phenomena taking place in HEAs and austenitic steels during severe plastic deformation at different temperatures and thermal treatments, there is no conclusive picture yet [4,23,33,42,48]. This requires in-depth studies.

5. Conclusions

Based on investigations of microstructure, texture and strength on the HPT-deformed prototype CrMnFeCoNi HEA the following conclusions are drawn:
(1)
HPT at RT and LNT leads to strong grain refinement of this HEA. Severe mechanical twinning at RT and martensitic phase transformation from FCC to HCP structure at LNT in addition to dislocation slip may cause this.
(2)
Correlated with a steady-state grain size in the nano range is a high remnant dislocation density. These dislocations are predominantly screw-type and show a weak dipole character due to a wide dissociation into Shockley partials. HPT at LNT leads to an inhomogeneous microstructure with a lower dislocation density compared to HPT at RT.
(3)
The weak texture developed at RT is a dominant brass-type shear texture indicating that the deformation during SPD mainly occurs by partial dislocation slip accompanied by twinning and grain boundary sliding. Due to an inhomogeneous deformation at LNT coupled with phase transformation the texture becomes almost random.
(4)
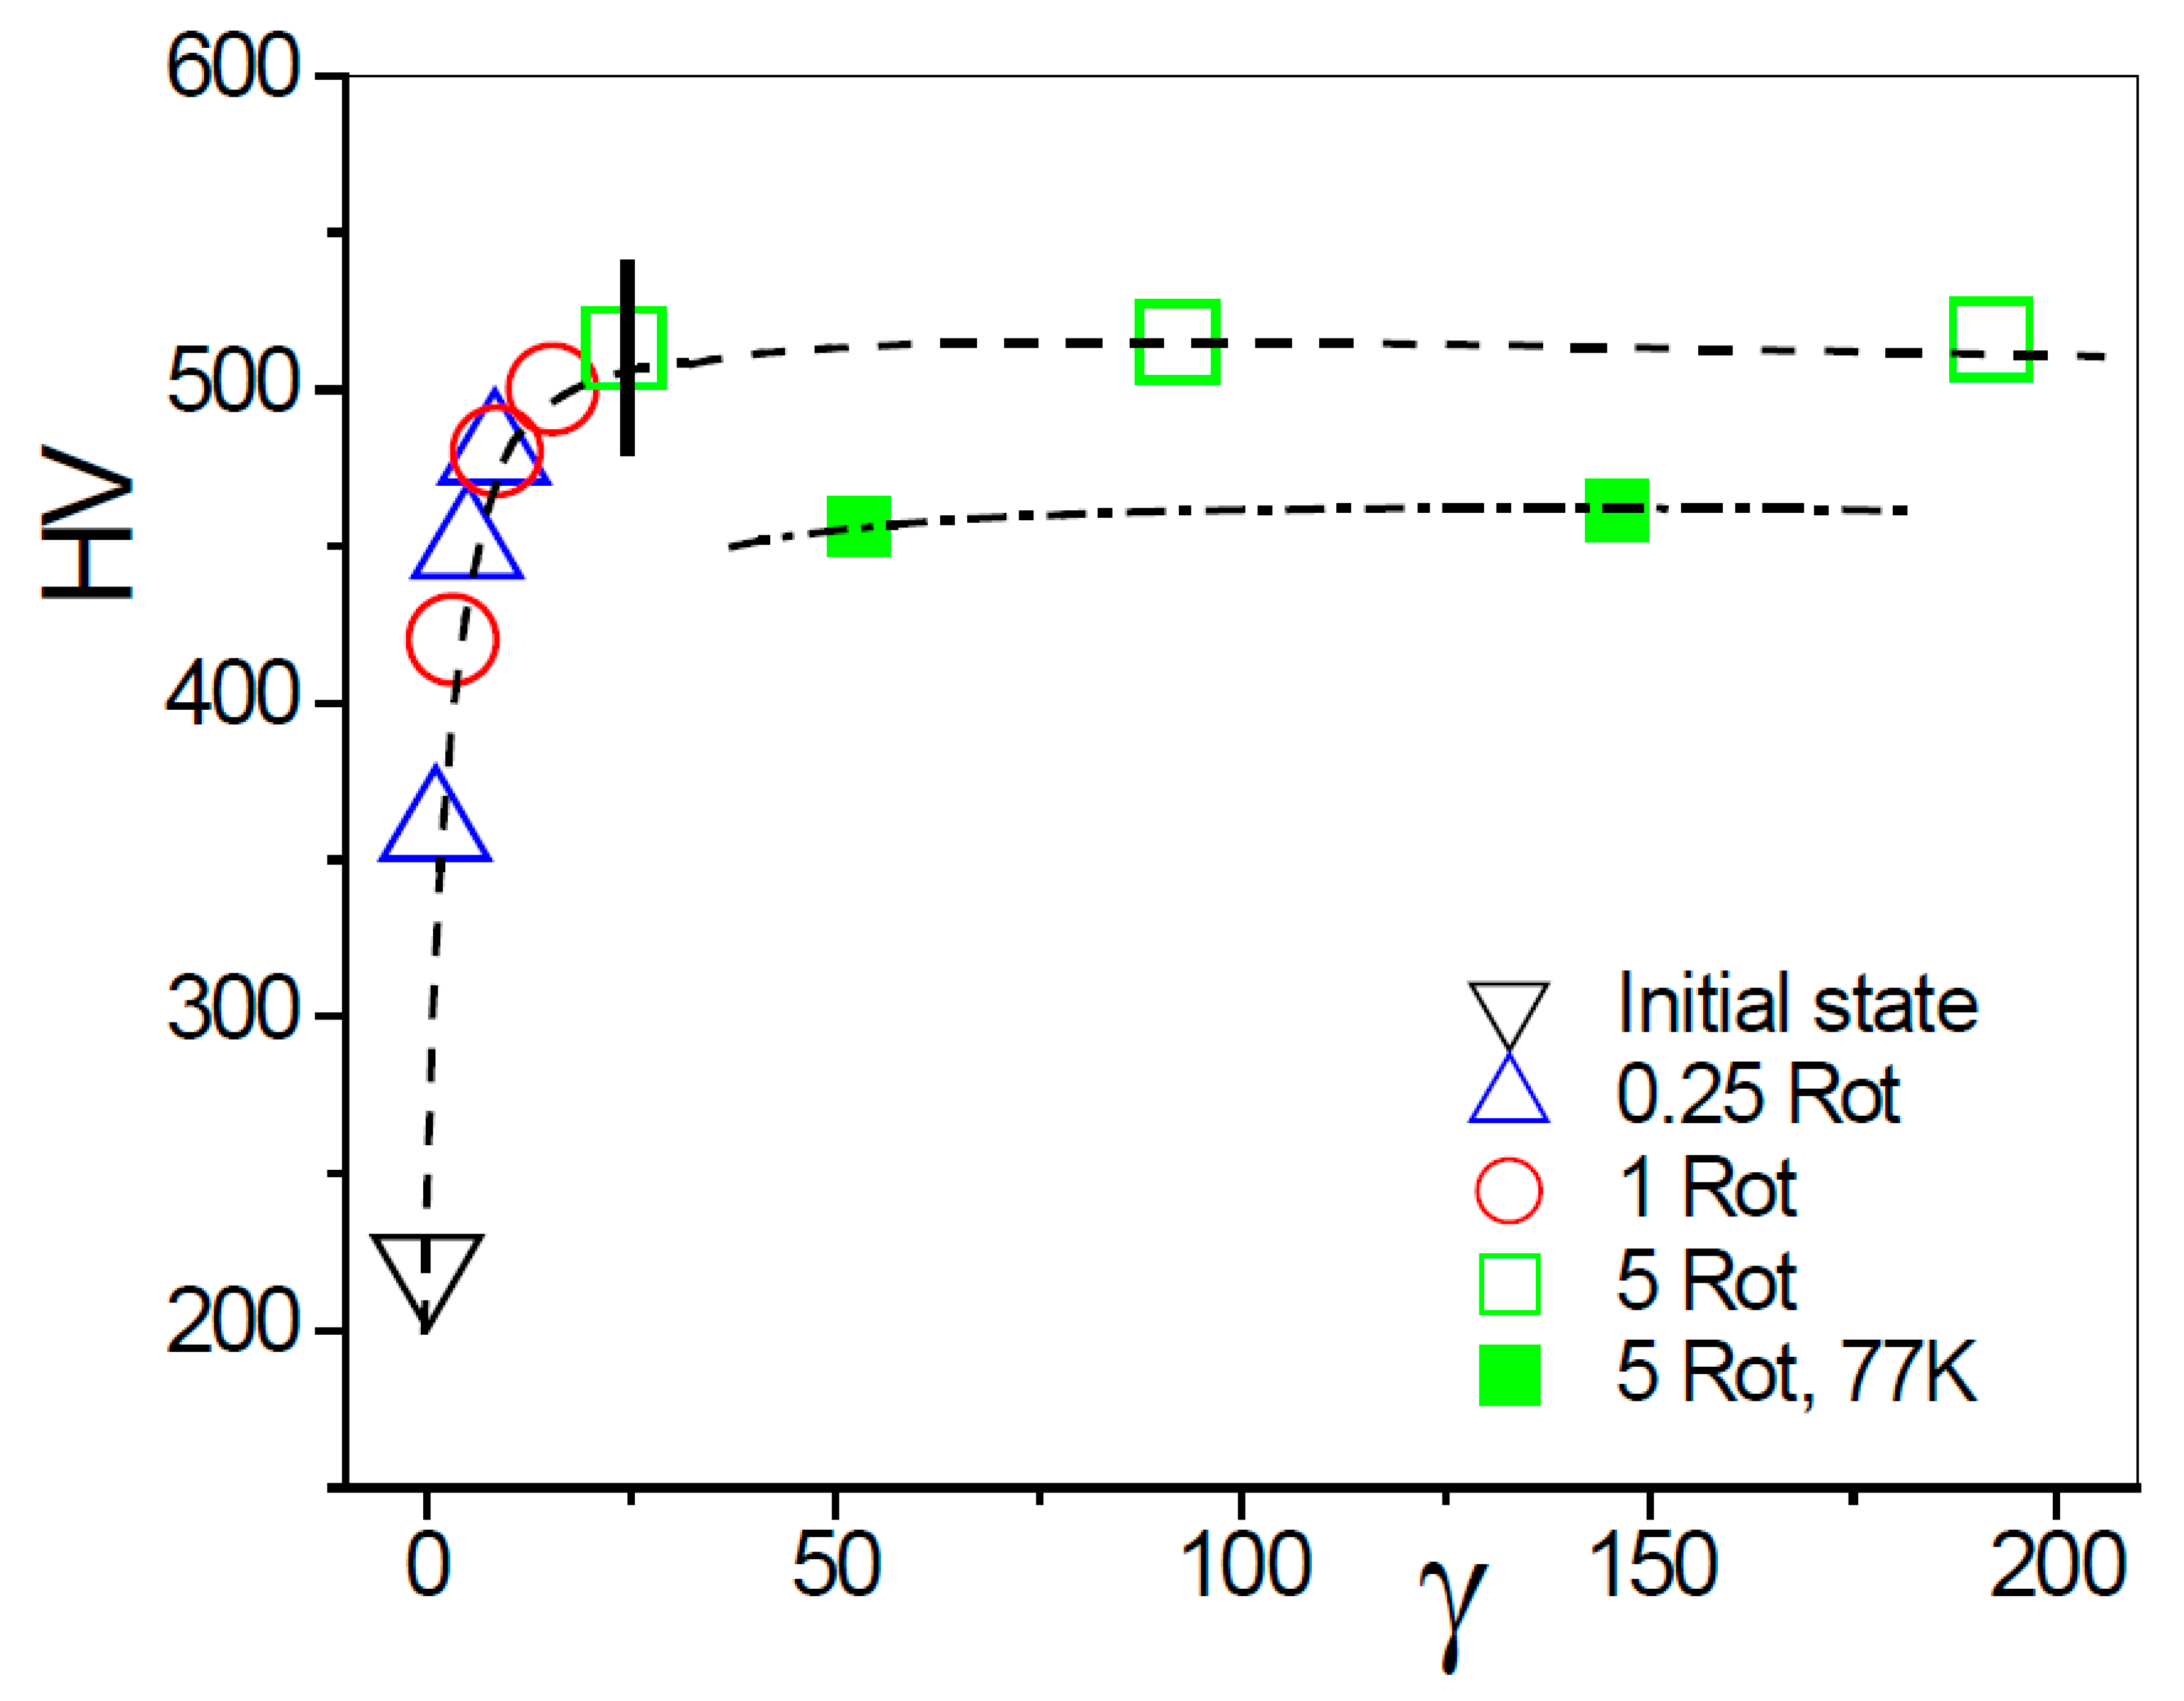
The strength of the nanocrystalline HEA is mainly controlled by dislocation–dislocation interaction. For the material HPT-deformed at LNT with a lower dislocation density there is an additional contribution from HCP lamellae which act as further dislocation barriers.

Author Contributions

Conceptualization, W.S., T.U., A.H., R.P. and E.P.G.; methodology, W.S., T.U. and A.H.; software, T.U.; validation, formal analysis, A.P., E.O., B.J., T.U. and A.H.; investigation, A.P., E.O., B.J., B.V. and A.H.; writing—review and editing, W.S., T.U., A.H., R.P. and E.P.G.; supervision, W.S., T.U., A.H. and R.P.; funding acquisition, A.H. and R.P. All authors have read and agreed to the published version of the manuscript.

Funding

This research was funded by European Research Council (ERC), grant number 340185 USMS, Austrian Science Fund (FWF), project number P26729-N19 and Open Access Funding by the Publication Fund of the TU Dresden.

Acknowledgments

Funding for this work (R.P.) has been provided by the European Research Council under ERC Grant Agreement No. 340185 USMS and by the Austrian Science Fund (FWF) in the framework of research project P26729-N19 (A.H. and B.V.). E.P.G. is supported by the U.S. Department of Energy, Office of Science, Basic Energy Sciences, Materials Sciences and Engineering Division.

Conflicts of Interest

The authors declare no conflict of interest.

Notice of Copyright

This manuscript has been co-authored by UT-Battelle, LLC under Contract No. DE-AC05-00OR22725 with the U.S. Department of Energy. The United States Government retains and the publisher, by accepting the article for publication, acknowledges that the United States Government retains a non-exclusive, paid-up, irrevocable, worldwide license to publish or reproduce the published form of this manuscript, or allow others to do so, for United States Government purposes. The Department of Energy will provide public access to these results of federally sponsored research in accordance with the DOE Public Access Plan (http://energy.gov/downloads/doe-public-access-plan).

References

  1. Yeh, J.W.; Chen, S.K.; Lin, S.J.; Gan, J.Y.; Chin, T.S.; Shun, T.T.; Tsau, C.H.; Chang, S.Y. Nanostructured high-entropy alloys with multiple principal elements: Novel alloy design concepts and outcomes. Adv. Eng. Mater. 2004, 6, 299–303. [Google Scholar] [CrossRef]
  2. Cantor, B.; Chang, I.T.H.; Knight, P.; Vincent, A.J.B. Microstructural development in equi atomic multicomponent alloys. Mater. Sci. Eng. A 2004, 375–377, 213–218. [Google Scholar] [CrossRef]
  3. Otto, F.; Yang, Y.; Bei, H.; George, E.P. Relative effects of enthalpy and entropy on the phase stability of equiatomic high-entropy alloys. Acta Mater. 2013, 61, 2628–2638. [Google Scholar] [CrossRef] [Green Version]
  4. Schuh, B.; Mendez-Martin, F.; Völker, B.; George, E.P.; Clemens, H.; Pippan, R.; Hohenwarter, A. Mechanical properties, microstructure and thermal stability of a nanocrystalline CoCrFeMnNi high-entropy alloy after severe plastic deformation. Acta Mater. 2015, 96, 258–268. [Google Scholar] [CrossRef] [Green Version]
  5. Otto, F.; Dlouhy, A.; Pradeep, K.G.; Kubenova, M.; Raabe, D.; Eggeler, G.; George, E.P. Decomposition of the single-phase high-entropy alloy CrMnFeCoNi after prolonged anneals at intermediate temperatures. Acta Mater. 2016, 112, 40–52. [Google Scholar] [CrossRef] [Green Version]
  6. Pickering, E.J.; Munoz-Moreno, R.; Stone, H.J.; Jones, N.G. Precipitation in the equiatomic high-entropy alloy CrMnFeCoNi. Scr. Mater. 2016, 113, 106–109. [Google Scholar] [CrossRef]
  7. Zhang, F.; Lou, H.; Cheng, B.; Zeng, Z.; Zeng, Q. High-pressure induced phase transitions in high-entropy alloys: A review. Entropy 2019, 21, 239. [Google Scholar] [CrossRef] [Green Version]
  8. Huang, S.; Li, W.; Lu, S.; Tian, F.; Shen, J.; Holmström, E.; Vitos, L. Temperature dependent stacking fault energy of FeCrCoNiMn high entropy alloy. Scr. Mater. 2015, 108, 44–47. [Google Scholar] [CrossRef]
  9. Ma, D.; Grabowski, B.; Körmann, F.; Neugebauer, J.; Raabe, D. Ab initio thermodynamics of the CoCrFeMnNi high entropy alloy: Importance of entropy contributions beyond the configurational one. Acta Mater. 2015, 100, 90–97. [Google Scholar] [CrossRef]
  10. Zhao, S.; Stocks, G.M.; Zhang, Y. Stacking fault energies of face-centered cubic concentrated solid solution alloys. Acta Mater. 2017, 134, 334–345. [Google Scholar] [CrossRef]
  11. George, E.P.; Curtin, W.A.; Tasan, C.C. High entropy alloys: A focused review of mechanical properties and deformation mechanisms. Acta Mater. 2020, 188, 435–474. [Google Scholar] [CrossRef]
  12. Sathiaraj, G.D.; Pukenas, A.; Skrotzki, W. Texture formation in face-centered cubic high-entropy alloys. J. Alloy. Compd. 2020, 826, 15183. [Google Scholar] [CrossRef]
  13. Skrotzki, W.; Pukenas, A.; Joni, B.; Odor, E.; Ungar, T.; Hohenwarter, A.; Pippan, R.; George, E.P. Microstructure and texture evolution during severe plastic deformation of CrMnFeCoNi high-entropy alloy. IOP Conf. Ser. Mater. Sci. Eng. 2017, 194, 012028. [Google Scholar] [CrossRef] [Green Version]
  14. Pippan, R.; Scheriau, S.; Hohenwarter, A.; Hafok, M. Advantages and limitations of HPT: A review. Mater. Sci. Forum 2008, 584–586, 16–21. [Google Scholar] [CrossRef]
  15. Ungar, T.; Ott, S.; Sanders, P.G.; Borbely, A.; Weertman, J.R. Dislocations, grain size and planar faults in nanostructured copper determined by high resolution X-ray diffraction and a new procedure of peak profile analysis. Acta Mater. 1998, 46, 3693–3699. [Google Scholar] [CrossRef]
  16. Ribarik, G.; Joni, B.; Ungar, T. Global optimum of microstructure parameters in the CMWP line-profile-analysis method by combining Marquardt-Levenberg and Monte-Carlo procedures. J. Mater. Sci. Technol. 2019, 35, 1508–1514. [Google Scholar] [CrossRef] [Green Version]
  17. Multex Manual; Multex 3; Bruker AXS GmbH: Karlsruhe, Germany, 2008.
  18. Pawlik, K. Determination of the orientation distribution function from pole figures in arbitrarily defined cells. Phys. Stat. Sol. B 1986, 134, 477–483. [Google Scholar] [CrossRef]
  19. Bunge, H.-J. Zur Darstellung allgemeiner Texturen. Z. Met. 1965, 56, 872–874. [Google Scholar]
  20. Toth, L.S.; Molinari, A. Tuning a self consistent viscoplastic model by finite element results—I. Modeling. Acta Metall. Mater. 1994, 42, 2453–2458. [Google Scholar] [CrossRef]
  21. Miao, J.; Slone, C.E.; Smith, T.M.; Niu, C.; Bei, H.; Ghazisaeidi, M.; Pharr, G.M.; Mills, M.J. The evolution of the deformation substructure in a Ni-Co-Cr equiatomic solid solution alloy. Acta Mater. 2017, 132, 35–48. [Google Scholar] [CrossRef]
  22. Lin, Q.; Liu, J.; An, X.; Wang, H.; Zhang, Y.; Liao, X. Cryogenic-deformation-induced phase transformation in an FeCoCrNi high-entropy alloy. Mater. Res. Lett. 2018, 6, 236–243. [Google Scholar] [CrossRef] [Green Version]
  23. Podolskiy, A.V.; Shapovalov, Y.O.; Tabachnikova, E.D.; Tortika, A.S.; Tikhonovsky, M.A.; Joni, B.; Odor, E.; Ungar, T.; Maier, S.; Rentenberger, C.; et al. Anomalous evolution of strength and microstructure of high-entropy alloy CoCrFeNiMn after high-pressure torsion at 300 and 77 K. Adv. Eng. Mater. 2020, 22, 1900752. [Google Scholar] [CrossRef] [Green Version]
  24. Heczel, A.; Kawasaki, M.; Labar, J.L.; Jang, J.; Langdon, T.G.; Gubicza, J. Defect structure and hardness in nanocrystalline CoCrFeMnNi high-entropy alloy processed by high-pressure torsion. J. Alloy. Compd. 2017, 711, 143–154. [Google Scholar] [CrossRef] [Green Version]
  25. Zherebtsov, S.; Stepanov, N.; Ivanisenko, Y.; Shaysultanov, D.; Yurchenko, N.; Klimova, M.; Salishchev, G. Evolution of microstructure and mechanical properties of a CoCrFeMnNi high-entropy alloy during high-pressure torsion at room and cryogenic temperatures. Metals 2018, 8, 123. [Google Scholar] [CrossRef] [Green Version]
  26. Okamoto, N.L.; Fujimoto, S.; Kambara, Y.; Kawamura, M.; Chen, Z.M.; Matsunshita, H.; Tanaka, K.; Inui, H.; George, E.P. Size effect, critical resolved shear stress, stacking fault energy, and solid solution strengthening in the CrMnFeCoNi high-entropy alloy. Sci. Rep. 2016, 6, 35836. [Google Scholar] [CrossRef] [PubMed]
  27. Yeh, J.W. Physical metallurgy of high-entropy alloys. JOM 2015, 67, 2254–2261. [Google Scholar] [CrossRef]
  28. Wang, Y.B.; Liao, X.Z.; Zhao, Y.H.; Lavernia, E.J.; Ringer, S.P.; Horita, Z.; Langdon, T.G.; Zhu, Y.T. The role of stacking faults and twin boundaries in grain refinement of a Cu-Zn alloy processed by high-pressure torsion. Mater. Sci. Eng. A 2010, 527, 4959–4966. [Google Scholar] [CrossRef]
  29. Zhao, Y.; Toth, L.S.; Massion, R.; Skrotzki, W. Role of grain boundary sliding in texture evolution for nanoplasticity. Adv. Eng. Mater. 2017, 20, 1–9. [Google Scholar] [CrossRef]
  30. Toth, L.S.; Skrotzki, W.; Zhao, Y.; Pukenas, A.; Braun, C.; Birringer, R. Revealing grain boundary sliding from textures of a deformed nanocrystalline Pd-Au alloy. Materials 2018, 11, 190. [Google Scholar] [CrossRef] [Green Version]
  31. Wu, W.; Song, M.; Ni, S.; Wang, J.; Liu, Y.; Liu, B.; Liao, X. Dual mechanisms of grain refinement in a FeCoCrNi high-entropy alloy processed by high-pressure torsion. Sci. Rep. 2017, 7, 46720. [Google Scholar] [CrossRef] [Green Version]
  32. Edalati, K.; Cubero-Sesin, J.M.; Alhamidi, A.; Mohamed, I.F. Influence of severe plastic deformation at cryogenic temperature on grain refinement and softening of pure metals: Investigation using high-pressure torsion. Mater. Sci. Eng. A 2014, 613, 103–110. [Google Scholar] [CrossRef]
  33. Moon, J.; Qi, Y.; Tabachnikova, E.; Estrin, Y.; Choi, W.-M.; Joo, S.-H.; Lee, B.-J.; Podolskiy, A.; Tikhonovsky, M.; Kim, H.S. Microstructure and mechanical properties of high-entropy alloy Co20Cr26Fe20Mn20Ni14 processed by high-pressure torsion at 77 K and 300 K. Sci. Rep. 2018, 8, 11074. [Google Scholar] [CrossRef] [PubMed]
  34. Zhang, F.; Wu, Y.; Lou, H.B.; Zeng, Z.D.; Prakapenka, V.B.; Greenberg, E.; Yan, J.Y.; Okasinski, J.S.; Liu, X.J.; Liu, Y.; et al. Polymorphism in a high-entropy alloy. Nat. Commun. 2017, 8, 15687. [Google Scholar] [CrossRef] [PubMed] [Green Version]
  35. Zhang, F.; Lou, H.; Chen, S.; Chen, X.; Zeng, Z.; Yan, J.; Zhao, W.; Wu, Y.; Lu, Z.; Zeng, Q. Effects of non-hydrostaticity and grain size on pressure-induced phase transformation of the CoCrFeMnNi high-entropy alloy. J. Appl. Phys. 2018, 124, 115901. [Google Scholar] [CrossRef] [Green Version]
  36. Von Bergen, N.; Boehler, R. Effect of non-hydrostaticity on the—Transition in iron. High Press. Res. 1990, 6, 133–140. [Google Scholar]
  37. Yang, X.-S.; Sun, S.; Ruan, H.-H.; Shi, S.-Q.; Zhang, T.Y. Shear and shuffling accomplishing polymorphic fcc γ→hcp ε→bct α martensitic phase transformation. Acta Mater. 2017, 136, 347–354. [Google Scholar] [CrossRef]
  38. Wu, S.W.; Wang, G.; Yi, J.; Jia, Y.D.; Hussain, I.; Zhai, Q.J.; Liaw, P.K. Strong grain-size effect on deformation twinning of an Al0.1CoCrFeNi high-entropy alloy. Mater. Res. Lett. 2017, 5, 276–283. [Google Scholar] [CrossRef] [Green Version]
  39. Skrotzki, W.; Eschke, A.; Joni, B.; Ungar, T.; Toth, L.S.; Ivanisenko, Y.; Kurmanaeva, L. New experimental insight into the mechanisms of nanoplasticity. Acta Mater. 2013, 61, 7271–7284. [Google Scholar] [CrossRef]
  40. Li, L.; Ungar, T.; Toth, L.S.; Skrotzki, W.; Wang, J.D.; Ren, J.; Choo, H.; Fogarassy, Z.; Zhou, X.Z.; Liaw, P.K. Shear-coupled grain growth and texture development in a nanocrystalline Ni-Fe alloy during cold rolling. Metall. Mat. Trans. A 2016, 47, 6632–6644. [Google Scholar] [CrossRef]
  41. Podolskiy, A.V.; Schafler, E.; Tabachnikova, E.D.; Tikhonovsky, M.A.; Zehetbauer, M.J. Thermally activated deformation of nanocrystalline and coarse grained CoCrFeNiMn high entropy alloy in the temperature range 4.2–350 K. Low Temp. Phys. 2018, 44, 1245–1253. [Google Scholar] [CrossRef]
  42. Scheriau, S.; Zhang, Z.; Kleber, S.; Pippan, R. Deformation mechanisms of modified 316L austenitic steel subjected to high pressure torsion. Mater. Sci. Eng. A 2011, 528, 2776–2786. [Google Scholar] [CrossRef]
  43. Chen, S.; Oh, H.S.; Gludovatz, B.; Kim, S.J.; Park, E.S.; Zhang, Z.; Ritchie, R.O.; Yu, Q. Real-time observations of TRIP-induced ultrahigh strain hardening in a dual-phase CrMnFeCoNi high-entropy alloy. Nat. Commun. 2020, 11, 826. [Google Scholar] [CrossRef] [PubMed] [Green Version]
  44. Li, Z.; Pradeep, K.G.; Deng, Y.; Raabe, D.; Tasan, C.C. Metastable high-entropy dual-phase alloys overcome the strength-ductility trade-off. Nature 2016, 534, 227–231. [Google Scholar] [CrossRef] [PubMed]
  45. Asaro, R.S.; Suresh, S. Mechanistic models for the activation volume and rate sensitivity in metals with nanocrystalline grains and nano-scale twins. Acta Mater. 2005, 53, 3369–3382. [Google Scholar] [CrossRef]
  46. Seeger, A. Handbuch Der Physik; Springer: Berlin/Heidelberg, Germany, 1958; Volume VII/2. [Google Scholar]
  47. Patriarca, L.; Ojha, A.; Sehitoglu, H.; Chumlyakov, Y.I. Slip nucleation in single crystal FeNiCoCrMn high entropy alloy. Scr. Mater. 2016, 112, 54–57. [Google Scholar] [CrossRef]
  48. Renk, O.; Hohenwarter, A.; Eder, K.; Kormout, K.S.; Cernay, J.M.; Pippan, R. Increasing the strength of nanocrystalline steels by annealing: Is segregation necessary? Scr. Mater. 2015, 95, 27–30. [Google Scholar] [CrossRef] [Green Version]
Figure 1. Typical X-ray diffractograms after high-pressure torsion (HPT) at room temperature (293 K) and 77 K (shear strain γ ≈ 130) clearly showing the phase transformation at 77 K.
Crystals 10 00336 g001
Figure 2. Grain size <xarea> after HPT at RT (open symbols) and at 77 K (filled symbols) versus shear strain γ.
Crystals 10 00336 g002
Figure 3. (a) Dislocation density ρ, (b) dislocation character q, and (c) dislocation arrangement parameter M versus shear strain γ. Open and filled symbols refer to HPT at RT and 77 K, respectively.
Crystals 10 00336 g003
Figure 4. (a) Twin density β and (b) average distance between adjacent twin boundaries dTw versus shear strain γ after HPT at RT.
Crystals 10 00336 g004
Figure 5. (a) Bright-field transmission electron microscopy (TEM) image representing the microstructure in the steadystate regime after HPT at liquid nitrogen temperature (LNT, 77 K), (b) corresponding diffraction pattern clearly showing 100 and 101 diffraction spots belonging to the hexagonal close-packed (HCP) phase (indicated by circle and arrows in red).
Crystals 10 00336 g005
Figure 6. (a) Texture after HPT at RT and 77 K represented as φ2 = 45° orientation distribution function (ODF)-sections at different shear strains γ. Intensities are given in multiples of a random orientation distribution. The key figure shows the main texture components (for component designation see table) that develop during simple shear of face-centered cubic (FCC) metals. (b) Volume fraction of texture components (15° spread from ideal positions) after HPT at RT versus shear strain γ.
Crystals 10 00336 g006
Figure 7. Microhardness measured at RT of samples HPT-deformed at RT (open symbols) and 77 K (filled symbols) versus shear strain γ.
Crystals 10 00336 g007

