Article

Investigation of the Blistering and Exfoliation Mechanism of GaAs Wafers and SiO2/Si3N4/GaAs Wafers by He+ and H+ Implantation

1
Institute of Advanced Technology on Semiconductor Optics & Electronics, Institute of Laser Engineering, Beijing University of Technology, Beijing 100124, China
2
College of Microelectronics, Beijing University of Technology, Beijing 100124, China
*
Authors to whom correspondence should be addressed.
Crystals 2020, 10(6), 520; https://doi.org/10.3390/cryst10060520
Submission received: 2 June 2020 / Revised: 11 June 2020 / Accepted: 15 June 2020 / Published: 17 June 2020

Abstract

:
The thermally activated blistering and exfoliation of GaAs wafers and SiO2/Si3N4/GaAs wafers after H+ and He+ implantation is systematically investigated. Surface morphologies and microscopic defects are detected and analyzed by various measurements, such as optical microscopy (OM), atomic force microscopy (AFM), and transmission electron microscopy (TEM). Blistering and exfoliation are obtained on the surfaces of the GaAs and SiO2/Si3N4/GaAs wafers by either the exclusive implantation of 5 × 10¹⁶ He+/cm2 alone or by co-implantation of 0.5 × 10¹⁶ He+/cm2 and 4 × 10¹⁶ H+/cm2. Our experimental results show that the blistering and exfoliation of the SiO2/Si3N4/GaAs layer occurred when the concentration of He+ was relatively low, where fewer dislocations and nanocavities were created near the interface between the Si3N4 and GaAs layers.

1. Introduction

Composite semiconductor materials have been widely used in many kinds of microelectronic and optoelectronic devices, such as laser diodes, high-frequency transistors, light-emitting diodes, and so on [1,2,3]. In most cases, it is necessary that the epitaxial layers of such devices be grown on lattice-mismatched substrates [4]. At present, relatively large-area (up to 150 mm in diameter) and high-quality bulk GaAs substrates are available [5]. However, these wafers are much more expensive than Si wafers [6]. Therefore, the epitaxy of GaAs-based devices is often grown on cheap substrates [7]. Because of lattice mismatch, heteroepitaxial growth on foreign substrates usually gives rise to extended, mismatch-induced, stress-relieving defects, which are detrimental to the performance and life of these devices [8]. Based on the development of the Smart CutTM technology and wafer bonding process [9], composite wafers are gradually becoming more promising, by reducing device costs and simultaneously providing a high-quality structural substrate [10,11,12]. The composite wafers can not only be quite inexpensive, but greatly reduce the defect density of epitaxial layers.
The layer transfer process generally plays an important role in the fabrication of composite wafers, and can be achieved by optimizing implantation parameters such as implantation fluence, flux, and actual implantation temperature [13,14,15,16]. Tong et al. [17] were the first to underline the importance of temperature during ion implantation and pointed out that the implantation temperature window for GaAs was about 160–250 °C. Radu et al. [18] found that it was difficult to obtain blisters and craters in GaAs with only H+ implantation. However, in the case of exclusive He+ implantation and He+ + H+ co-implantation, blistering and exfoliation appeared on the GaAs surface. Webb et al. [19] investigated the influence of implantation flux and temperature on the smart-cut process; with the increment of flux, the area of exfoliation and mean size of blisters both increased. Woo et al. [20] studied the blistering and exfoliation kinetics of GaAs (100) wafers implanted with H+ and He+. They showed that the optimum implantation temperature lies in the 120–160 ℃ interval. Therefore, it can be concluded that the exfoliation and blistering of the GaAs wafer require the participation of He+ and H+. However, most studies only focus on the blistering and exfoliation of the GaAs wafer.
In this paper, both SiO2 and Si3N4 are used as intermediate insulation layers to pave the way for the fabrication of GaAs-on-insulator wafers. The evolution of surface morphology in the GaAs wafer and SiO2/Si3N4/GaAs wafer after post-implantation annealing without bonding to the handle wafer is systematically analyzed. According to the results of cross-sectional TEM, the origin of blister formation is located and the mechanism of blisters formation is also comprehensively explained.

2. Experiments

In this experiment, four samples, denoted A, B, C, and D, were prepared using semi-insulating (100) oriented GaAs (Freiberger Compound Materials, Saxony, Germany) as the substrate. Sample A was implanted with only 25 keV, 5 × 10¹⁶ He+/cm2, while Sample B was co-implanted with 25 keV, 5 × 10¹⁵ He+/cm2 and 15 keV, 4 × 10¹⁶ H+/cm2. These two samples were set as reference points to see if the blistering and exfoliation could occur on the surface of the GaAs wafer under two kinds of implantation conditions. For Sample C and Sample D, a 200 nm Si3N4 layer followed by a 600 nm SiO2 layer using plasma-enhanced chemical vapor deposition (PECVD) was firstly deposited on the GaAs substrate to form SiO2/Si3N4/GaAs composite wafers. Sample C was implanted with only 300 keV, 5 × 10¹⁶ He+/cm2. Sample D was co-implanted with 300 keV, 5 × 10¹⁵ He+/cm2 and 160 keV, 4 × 10¹⁶ H+/cm2. The specific implantation parameters are listed in Table 1. Note that the axis of the incident ion beam was tilted 7° off relative to the normal axis of the GaAs surface before implantation in order to minimize the channeling effect. According to the calculation results of SRIM [21], the relationship between ion concentration and implantation depth at room temperature in the SiO2/Si3N4/GaAs samples is shown in Figure 1. After implantation, the GaAs wafer and SiO2/Si3N4/GaAs wafer were cut into smaller samples and subjected to furnace annealing at 300 °C in a flow of N2 for 1 h.
An Olympus OM (Olympus, Shibuya-ku, Japan) was used to detect blister cavities, while the morphology of craters and blisters was characterized by a Bruker AFM (Bruker, Santa barbara, CA, USA) in tapping mode. JEM-2100 cross-sectional TEM (JEOL, Otemachi, Japan) under out-of-Bragg and out-of-focus conditions was used to image bubbles and micro-cracks in the SiO2/Si3N4/GaAs samples [22]. Before TEM observations, the samples were thinned to less than 100 nm by a TESCAN LYRA3 FIB (Focused Ion Beam)–SEM (Scanning Electron Microscope) (TESCAN, Libusina trida, Czech Republic) to meet the observation requirements of TEM.

3. Results and Discussion

3.1. Ion Implantation into the GaAs Wafer

Figure 2 shows the surface morphology of the GaAs wafer after 300 °C annealing for 1 h. Figure 2a,b shows the surface morphology of Samples A and B, as detected by OM, and Figure 2c,d shows the corresponding AFM images, respectively. Surface features such as blisters and craters were clearly observed in two samples. According to the calculation results of SRIM, the implantation depths of He+ and H+ were 167 nm and 146 nm in the GaAs wafer, respectively. As shown in Figure 2c,d, the average depths of the craters in Samples A and B were 172 nm and 153 nm, which were consistent with the calculated results. The mean diameter of the blisters and average size of the craters were 2.4 μm and 3.5 μm in Sample A, and 2.2 μm and 3.2 μm in Sample B, respectively. The diameter and size of the blisters and craters on the surface of Sample A were larger than those on the surface of Sample B. Moreover, the densities of the craters and blisters on the surface of Sample A were also higher than those of Sample B.

3.2. Ion Implantation into the SiO2/Si3N4/GaAs Wafer

Figure 3a shows the OM image of the surface morphology of Sample C. Some ring-shaped blisters were observed with a mean diameter of 60 μm. Severe exfoliation was obtained on the surface. However, the surface morphology of Sample D was more complex after annealing, as shown in Figure 3b. No craters, but many blisters with the different sizes appeared on the surface. The blisters tended to grow and coalesce with those adjacent to them. Compared to the surface morphologies of Samples A and B, as shown in Figure 2, the diameter of the blisters and the size of the craters in Samples C and D were relatively larger. The critical radius of surface blisters was proportional to the depth of ion implantation [23].
Cross-sectional TEM measurements were carried out for Samples C and D to analyze the involved mechanism for the observed exfoliation and blisters. As shown in Figure 4a, a well-defined defect band was created at a depth range of 400 to 620 nm from the surface in the sample C. The position of the defect band was approximately consistent with the projected range of He+ calculated by SRIM. The band mainly consisted of isolated cavities and dislocation-like defects. As shown in Figure 4b, the cavities, regarded as high-pressure He bubbles, usually behaved like spherical shapes and had sizes ranging from 4 to 30 nm with a mean diameter of 15 nm. The bubbles and dislocations in the GaAs layer evolved into a complex synergistic effect during the He+ implantation process [24]. When He+ was implanted into the initially defect-free matrix, the He+ and vacancies resulting from the lattice dislocation attracted each other. The vacancies and their clusters may have been the nucleation sites for the bubbles [25]. With the accumulation of extra He+, the pressure of bubbles also increased accordingly. The pressure was relieved through the formation of platelet-like dislocations, as shown in Figure 4c,d. In our work, He+ was implanted at 300 keV, which made the distribution of He+ deeper and broader. During the 300 °C annealing process, more isolated He+ located in the lattice or trapped at the point defects was able to move into the bubbles, which augmented the compressive stress in the damaged zone and weakened the bond strength in the damaged layer. However, no micro-cracks appeared in the damaged zone, which indicates that the exfoliation that appeared on the surface of Sample C was not from the GaAs layer. Besides this, no cavities or defects were observed in any other regions.
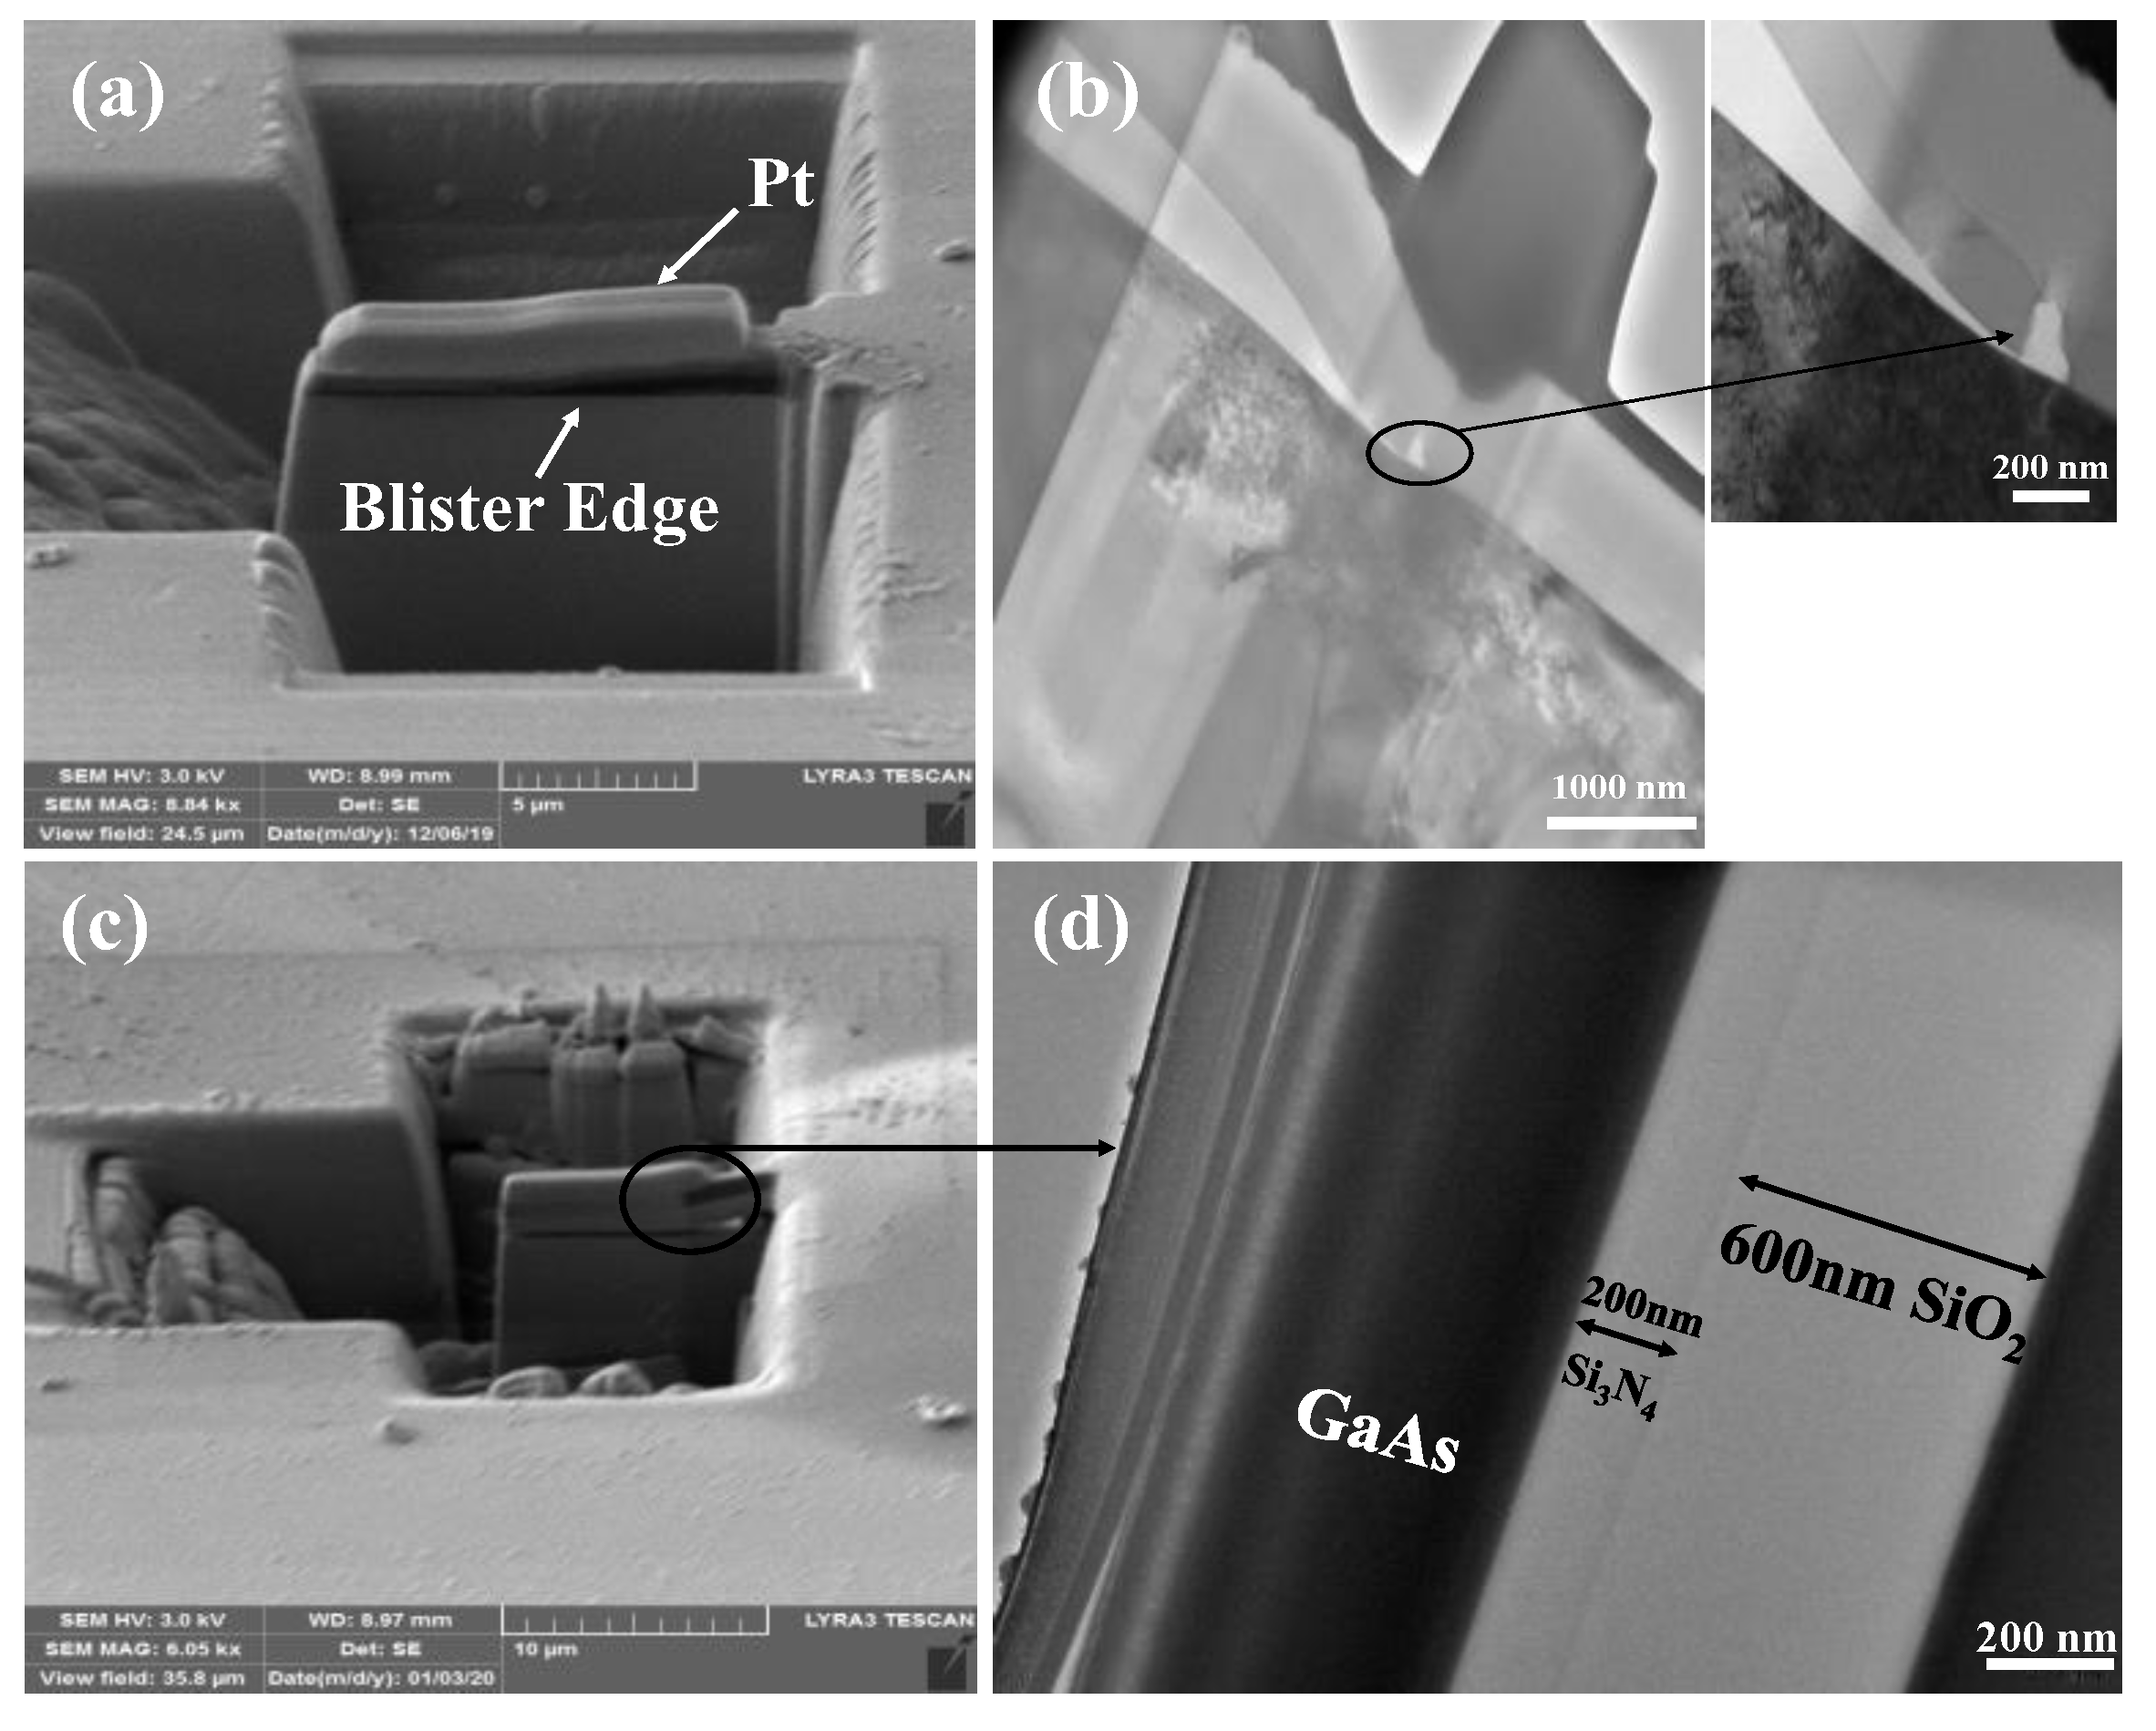
As shown in Figure 5, before cutting the edge of the blister, Pt was deposited on the edge of the blister to protect the surface of Samples C and D from ion beam damage. As shown in Figure 5b, the blister in Sample C did not occur in the GaAs layer, but rather in the above Si3N4 layer. The formation of blisters was attributed to the fracture of the Si3N4 layer. However, the blisters bulging from the Si3N4 layer were not what we wanted. We wanted the exfoliation from the depth position of the He+ projected range.
As shown in Figure 5c, the blister on the surface of Sample D was cut by the FIB. When the cross section of the sample was observed, obvious voids and cracks were recognized at the edge of the blister. The cross-sectional TEM image of the edge of the blister showed that the blistered layer mainly consisted of a 600 nm SiO2 layer, a 200 nm Si3N4 layer, and a more than 600 nm-thick GaAs layer. It was totally different from the image of Sample C, where the blistered layer was only composed of a 600 nm SiO2 layer and a 200 nm Si3N4 layer. As shown in Figure 5d, a thin film of GaAs layer separated from the bulk GaAs substrate was tightly bonded to the Si3N4 and SiO2 layers. In addition, it was found that the thickness of the GaAs layer in the blister was larger than that in the damaged zone. During annealing, the rapid expansion of the blisters inevitably broke the lattice order of the GaAs layer at the implantation depth, which made the GaAs layer split in a more disorderly way and caused burrs at the edge of the GaAs layer.
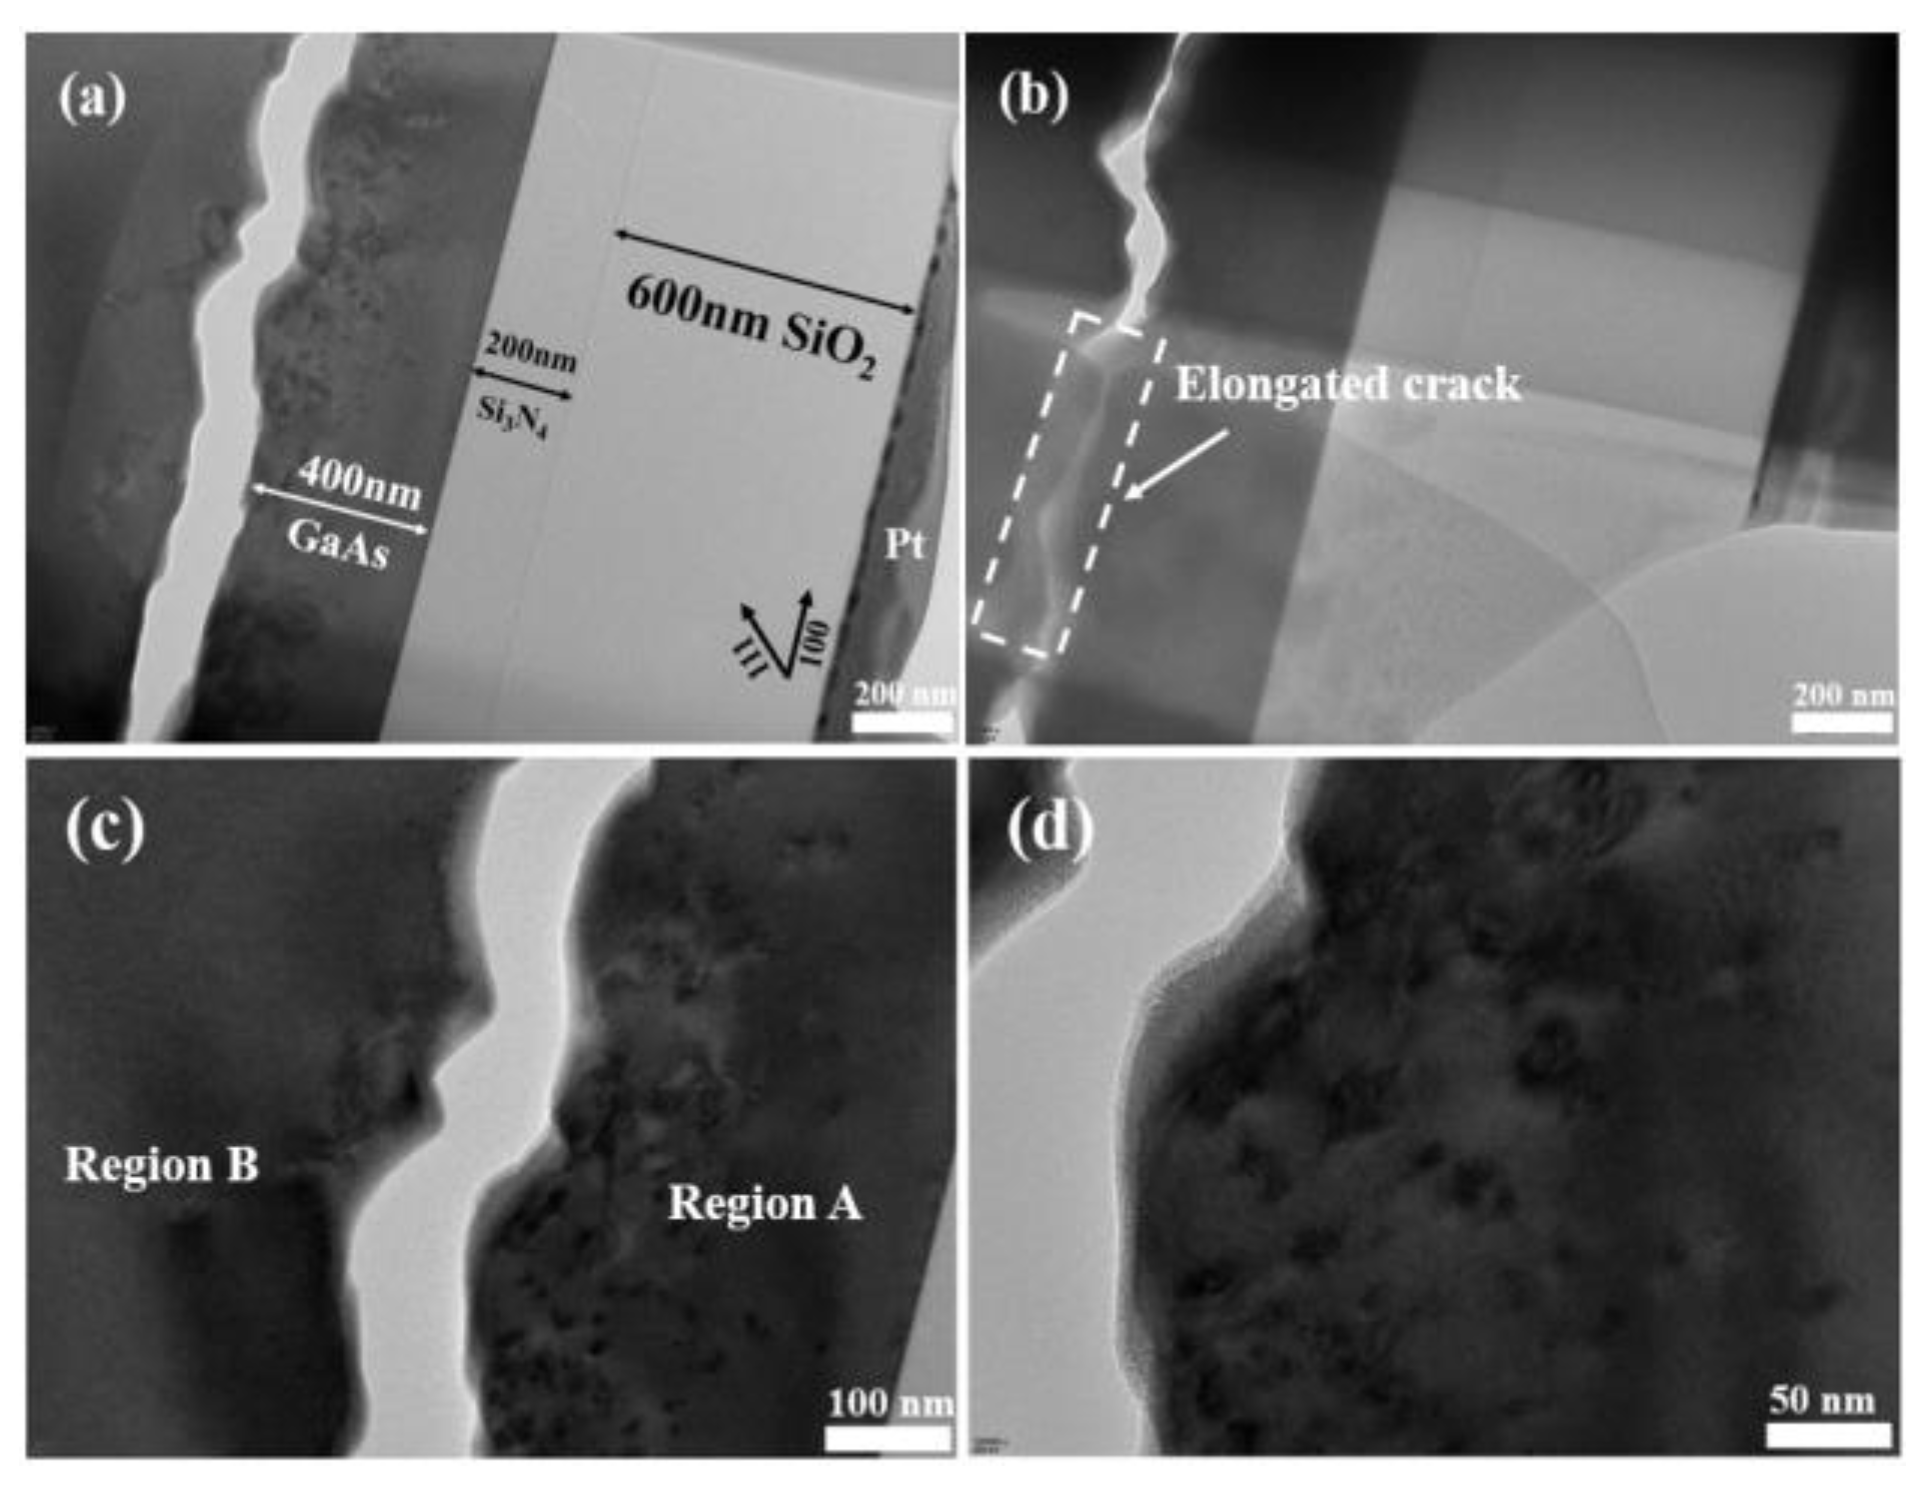
As shown in Figure 6, the cross-sectional morphology in Sample D, sequentially co-implanted with He+ and H+, was different from that in Sample C. The sample showed significant cracks at the implantation depth after 300 °C annealing for 1 h, as shown in Figure 6a. The width of the gap formed in the damaged zone was approximately 100 nm. However, as shown in Figure 6b, the elongated crack (larger than 600 nm) was not completely separated in some areas. As shown in Figure 6c,d, a closer observation of the damaged layer can reveal all kinds of defect microstructures. Two families of platelets, {100} and {111}, both appeared at the projected range of He+ and H+. Besides this, isolated spherical cavities with diameters of 4–10 nm were also detected. Moreover, relatively few defect microstructures occurred in Region B. Most cracks and cavities were mainly distributed in Region A. After He+ implantation, vacancies and defects were created at the projected depth range of He+. He+ co-precipitated with the vacancies to form bubbles. When H+ was implanted into the SiO2/Si3N4/GaAs wafer, H+ preferentially reacted with the vacancies and formed into an H-terminated internal surface, which was used to trap H2 and increase the internal pressure. According to our TEM observations in Figure 6, the cracks were mainly distributed at the bottom of the damaged layer. The edge profile of GaAs in Region A was just like a microscopically zigzagging path, but parallel to the interface of the Si3N4 layer on the whole.
When only He+ was implanted into the sample, the exfoliation and blisters that appeared on the surface only consisted of the SiO2 and Si3N4 layers. However, in the case of the co-implantation of He+ and H+, the dose of H+ was greater than that of He+. H+ played a major role in the entire process of blistering and exfoliation. Combined with the calculation results shown in Figure 7, it can be found that the vacancies and defects caused by He+ were more than those caused by H+ under the same number of ion implantations. In Figure 7a,b, target displacement refers to the number of atoms knocked off their target sites; target vacancies indicates the number of vacancies in the target sites; and replacement collisions refer to instances where a target atom was knocked out, before being replaced in the lattice [7]. During the simulation, 10,000 ions were set to bombard the surface of the sample. The exclusive implantation of H+ gave rise to 13 target displacements, 13 target vacancies, and 0 replacement collisions. The exclusive implantation of He+ alone caused 170 target displacements, 166 target vacancies, and 5 replacement collisions in the SiO2/Si3N4/GaAs sample. For the Si3N4 layer, the maximum values for target displacements, target vacancies, and replacement collisions in the Si3N4 layer caused by H+ and He+ were 1.6 × 10⁻⁴, 1.55 × 10⁻⁴, 6.8 × 10⁻⁵ and 0.0145, 0.014, 5.56 × 10⁻⁴ ions/Angstrom, respectively. Energy to recoils, as shown in Figure 7c,d, indicates the energy absorbed by Si and N atoms. Compared with the exclusive implantation of H+ alone, the energy absorbed by Si atoms and N atoms in the sample implanted with only He+ was much higher. The maximum values of energy absorbed by single Si and N atoms were 0.35 eV/Angstrom and 0.27 eV/Angstrom, respectively. Moreover, the Si and N atoms that absorbed the maximum energy were located in the interface of the Si3N4 and GaAs layers. After obtaining the energy, the Si and N atoms were no longer stable and they wanted to get rid of the original constraints. In addition, after implantation, the ions’ profile was calculated as shown in Figure 1. Comparing Figure 1a,b, more He+ remained in the Si3N4 layer than H+ after implantation. During 300 °C annealing for 1 h, He+ close to the interface of the Si3N4 and GaAs layers accumulated and co-precipitated with vacancies to form cavities. These cavities were further coalesced and formed bubbles, which created a gap between the Si3N4 and GaAs layers. More H+ were implanted into the GaAs layer and less into the Si3N4 layer. Therefore, with regards to the co-implantation of H+ and He+, the ion implantation of H+ as the main part could play an effective role in the exfoliation of the SiO2/Si3N4/GaAs layer.

4. Conclusions

In summary, we investigated the surface morphology and defect microstructures of a GaAs wafer and a SiO2/Si3N4/GaAs wafer after the implantation of H+ and He+. The experimental results showed that both the implantation of He+ alone and the co-implantation of H+ and He+ can give rise to the exfoliation and blistering of the GaAs wafer and the SiO2/Si3N4/GaAs wafer. According to the calculation of the SRIM, more He+ can stay in the Si3N4 layer than H+. Moreover, during the implantation process, defects such as vacancies and dislocations caused by the implantation of He+ were more numerous than those caused by the implantation of H+ in the Si3N4 layer. After 300 °C annealing for 1 h, the blisters in the sample implanted with only He+ stemmed from the Si3N4 layer and the blisters in the sample co-implanted with H+ and He+ stemmed from the inside of the GaAs layer. By comparison, the implantation of more H+ was beneficial to the blisters and exfoliation of the SiO2/Si3N4/GaAs layer.

Author Contributions

R.H., T.L., and C.L. conceived and designed the experiments; R.H. and J.L. performed the experiments; R.H. and Z.W. analyzed the data; R.H. wrote the paper. All authors have read and agreed to the published version of the manuscript.

Funding

This study was supported by the National Nature Science Foundation of China (Grant No.61505003, 61674140) and the Beijing education commission project (SQKM201610005008).

Acknowledgments

The authors wish to thank Engineer Luo for his assistance for high energy ion implantation.

Conflicts of Interest

The authors report no conflict of interest.

References

  1. Kang, D.; Young, J.L.; Lim, H.; Klein, W.E.; Chen, H.; Xi, Y.; Gai, B.; Deutsch, T.G.; Yoon, J. Printed assemblies of GaAs photoelectrodes with decoupled optical and reactive interfaces for unassisted solar water splitting. Nat. Energy 2017, 2, 1–9. [Google Scholar] [CrossRef]
  2. Hu, Y.; Liang, D.; Mukherjee, K.; Li, Y.; Zhang, C.; Kurczveil, G.; Huang, X.; Beausoleil, R.G. III/V-on-Si MQW lasers by using a novel photonic integration method of regrowth on a bonding template. Light Sci. Appl. 2019, 8, 93. [Google Scholar] [CrossRef] [PubMed]
  3. Geum, D.M.; Park, M.S.; Lim, J.Y.; Yang, H.D.; Song, J.D.; Kim, C.Z.; Yoon, E.; Kim, S.H.; Choi, W.J. Ultra-high-throughput Production of III-V/Si Wafer for Electronic and Photonic Applications. Sci. Rep. 2016, 6, 1–10. [Google Scholar] [CrossRef] [PubMed] [Green Version]
  4. Singh, R.; Christiansen, S.H.; Moutanabbir, O.; Gösele, U. The phenomenology of ion implantation-induced blistering and thin-layer splitting in compound semiconductors. J. Electron. Mater. 2010, 39, 2177–2189. [Google Scholar] [CrossRef]
  5. Chang, Y.; Zhang, M.; Deng, C.; Men, C.; Chen, D.; Zhu, L.; Yu, W.; Wei, X.; Di, Z.; Wang, X. Fabrication of high-quality GaAs-on-insulator via ion-cut of epitaxial GaAs/Ge heterostructure. Appl. Surf. Sci. 2015, 346, 46–49. [Google Scholar] [CrossRef]
  6. Woo, H.J.; Choi, H.W.; Kim, G.D.; Kim, J.K.; Hong, W.; Lee, H.R. Hydrogen ion implantation mechanism in GaAs-on-insulator wafer formation by ion-cut process. AIP Conf. Proc. 2006, 308, 308–312. [Google Scholar]
  7. Saha, U.; Devan, K.; Ganesan, S. A study to compute integrated dpa for neutron and ion irradiation environments using SRIM-2013. J. Nucl. Mater. 2018, 503, 30–41. [Google Scholar] [CrossRef]
  8. Shi, F.F.; Chang, K.L.; Hsieh, K.C. Interface morphology, chemistry and dislocation structures of wafer-bonded compound semiconductors. J. Phys. D Appl. Phys. 2009, 42, 085310. [Google Scholar] [CrossRef]
  9. Bruel, M. Silicon on insulator material technology. Electron. Lett. 1995, 31, 1201–1202. [Google Scholar] [CrossRef]
  10. Akatsu, T.; Plössl, A.; Scholz, R.; Stenzel, H.; Gösele, U. Wafer bonding of different III–V compound semiconductors by atomic hydrogen surface cleaning. J. Appl. Phys. 2003, 8, 3856–3862. [Google Scholar] [CrossRef] [Green Version]
  11. Stner, È.; Breitenstein, O.; Scholz, R.; Reiche, M.; Ka, G. Compound semiconductor interfaces obtained by direct wafer bonding in hydrogen or forming gas. J. Mater. Sci. Mater. Electron. 2002, 3, 593–595. [Google Scholar]
  12. Liang, D.I.; Fang, A.W.; Park, H.; Reynolds, T.O.M.E.; Warner, K.; Oakley, D.C.; Bowers, J.E. Low-Temperature Strong SiO2-SiO2 Covalent Wafer Bonding for III–V Compound Semiconductors-to-Silicon Photonic Integrated Circuits. J. Electron. Mater. 2008, 37, 1552–1559. [Google Scholar] [CrossRef]
  13. Radu, I.; Szafraniak, I.; Scholz, R.; Alexe, M.; Gösele, U. Low-temperature layer splitting of (100) GaAs by He+H coimplantation and direct wafer bonding. Appl. Phys. Lett. 2003, 82, 2413–2415. [Google Scholar] [CrossRef]
  14. Dearnaley, G. Ion implantation. Nature 1975, 256, 5520. [Google Scholar] [CrossRef]
  15. Daghbouj, N.; Li, B.S.; Karlik, M.; Declemy, A. 6H-SiC blistering efficiency as a function of the hydrogen implantation fluence. Appl. Surf. Sci. 2019, 466, 141–150. [Google Scholar] [CrossRef]
  16. Telychko, M.; Mutombo, P.; Ondráček, M.; Hapala, P.; Bocquet, F.C.; Kolorenč, J.; Vondráček, M.; Jelínek, P.; Švec, M. Achieving high-quality single-atom nitrogen doping of graphene/SiC(0001) by ion implantation and subsequent thermal stabilization. ACS Nano 2014, 8, 7318–7324. [Google Scholar] [CrossRef]
  17. Tong, Q.Y.; Huang, L.J.; Gösele, U.M. Transfer of semiconductor and oxide films by wafer bonding and layer cutting. J. Electron. Mater. 2000, 29, 928–932. [Google Scholar] [CrossRef]
  18. Radu, I.; Szafraniak, I.; Scholz, R.; Alexe, M.; Gösele, U. GaAs on Si heterostructures obtained by He and/or H implantation and direct wafer bonding. J. Appl. Phys. 2003, 94, 7820–7825. [Google Scholar] [CrossRef]
  19. Webb, M.; Jeynes, C.; Gwilliam, R.M.; Tabatabaian, Z.; Royle, A.; Sealy, B.J. The influence of the ion implantation temperature and the flux on smart-cut© in GaAs. Nucl. Instrum. Methods Phys. Res. Sect. B Beam Interact. Mater. Atoms 2005, 237, 193–196. [Google Scholar] [CrossRef]
  20. Woo, H.J.; Choi, H.W.; Kim, G.D.; Kim, J.K.; Kim, K.J. Blistering/exfoliation kinetics of GaAs by hydrogen and helium implantations. Surf. Coat. Technol. 2009, 203, 2370–2374. [Google Scholar] [CrossRef]
  21. Biersack, J.P.; Ziegler, J.F. The Stopping and Range of Ions in Solids. Ion Implant. Sci. Technol. 1984, 1, 51–108. [Google Scholar]
  22. Cherkashin, N.; Daghbouj, N.; Darras, F.X.; Fnaiech, M.; Claverie, A. Cracks and blisters formed close to a silicon wafer surface by He-H co-implantation at low energy. J. Appl. Phys. 2015, 118, 245–301. [Google Scholar] [CrossRef] [Green Version]
  23. Mitani, K.; Gösele, U.M. Formation of interface bubbles in bonded silicon wafers: A thermodynamic model. Appl. Phys. A Solids Surf. 1992, 54, 543–552. [Google Scholar] [CrossRef]
  24. Follstaedt, D.M.; Myers, S.M.; Barbour, J.C.; Petersen, G.A.; Reno, J.L.; Dawson, L.R.; Lee, S.R. Formation of cavities in GaAs and InGaAs. Nucl. Instrum. Methods Phys. Res. Sect. B Beam Interact. Mater. Atoms. 2000, 160, 476–498. [Google Scholar] [CrossRef]
  25. Daghbouj, N.; Li, B.S.; Callisti, M.; Sen, H.S.; Karlik, M.; Polcar, T. Microstructural evolution of helium-irradiated 6H–SiC subjected to different irradiation conditions and annealing temperatures: A multiple characterization study. Acta Mater. 2019, 181, 160–172. [Google Scholar] [CrossRef]
Figure 1. Ion concentration as a function of implantation depth in Samples C (b) and D (a).
Crystals 10 00520 g001
Figure 2. Surface morphology images of Samples A and B after 300 °C annealing for 1 h. (a) Surface morphology of Sample A; (b) Surface morphology of Sample B; (c) AFM image of the local surface morphology in Sample A; (d) AFM image of the local surface morphology in Sample B.
Crystals 10 00520 g002
Figure 3. The surface morphology of blisters and craters in Samples C (a) and D (b) after 300 °C annealing for 1 h.
Crystals 10 00520 g003
Figure 4. Cross-sectional TEM images of Sample C. (a) An overall cross-sectional morphology of Sample C; (b) Partial morphology of the damage zone; (c) Dislocation-like defects; (d) Enlarged view of dislocation-like defects and bubbles.
Crystals 10 00520 g004
Figure 5. Cross-sectional diagram of blister in Samples C and D. (a) Schematic diagram of blister edge cut by FIB (focused ion beam) in Sample C; (b) Cross-sectional diagram of blister in sample C; (c) Schematic diagram of blister edge cut by FIB (focused ion beam) in Sample D; (d) Cross-sectional diagram of blister in sample D.
Crystals 10 00520 g005
Figure 6. Cross-sectional TEM images of Sample D. (a) An overall cross-sectional morphology of Sample D; (b) Partial micro-cracks of the damaged zone; (c) Dislocation-like defects; (d) A close view of dislocation-like defects.
Crystals 10 00520 g006
Figure 7. Damage due to H+ and He+ implantation into the SiO2/Si3N4/GaAs wafer calculated by SRIM. (a) Vacancies and defects caused by implantation with only H+ into the SiO2/Si3N4/GaAs wafer; (b) Vacancies and defects caused by implantation with only He+ into the SiO2/Si3N4/GaAs wafer; (c) The energy absorbed by N and Si atoms in the Si3N4 layer when only H+ was implanted; (d) The energy absorbed by N and Si atoms in the Si3N4 layer when only He+ was implanted.
Crystals 10 00520 g007
Table 1. Implantation parameters for the four samples.
Sample No.MaterialsHe+ Dose
(1016/cm2)
H+ Dose
(1016/cm2)
He+ Implantation
Energy (keV)
H+ Implantation
Energy (keV)
AGaAs525
BGaAs0.542515
CSiO2/Si3N4/GaAs5300
DSiO2/Si3N4/GaAs0.54300160