Abstract
In this work, the effects of silver (Ag) nanoparticles on the melting behavior, isothermal crystallization kinetics, and morphology of polyoxymethylene (POM) were studied. It was found that the melting peak temperature (Tm) and the crystallization temperature (TC) of POM/Ag nanocomposites shifted to higher temperature with the content of Ag nanoparticles increased. In addition, the isothermal crystallization kinetics of POM/Ag nanocomposites were determined by Avrami and Lauritzen-Hoffman models. The results of crystallization half-time (t0.5), reciprocal of crystallization half-time (τ0.5), Avrami exponent (n), and Avrami rate constant (k) showed that low loading of Ag nanoparticles (≤1 wt%) accelerated the crystallization rate of POM. However, when the content of Ag nanoparticles reached 2 wt%, they aggregated together and restrained crystallization of POM. Meanwhile, the results of nucleation parameter (Kg) and surface free energy of folding (δe) revealed that Ag nanoparticles reduced the energy need to create a new crystal surface, leading to faster crystallization. Moreover, the crystallization activation energies (∆E) were determined using the Arrhenius model, which suggested that Ag nanoparticles induced the heterogeneous nucleation by lowing the ∆E. Furthermore, polarized light microscopy results indicated Ag nanoparticles generated a great amount of nucleation sites and led to the formation of smaller spherulites.
1. Introduction
Polyoxymethylene (POM), also referred to as polyacetal or polyformaldehyde, is a semi-crystalline thermoplastic polymer [1,2]. It is well known that POM can be prepared in two main forms as copolymers and homopolymers. POM homopolymers have good fatigue strength and high durability but are not easy to process. In contrast, POM copolymers have good chemical durability and thermal stability, and are easy to process [3]. POM is one of the most widely used engineering thermoplastics in many areas of application such as agriculture, automobiles, the mechanical industry, and electromechanical equipment [4,5,6], which is due to its high tensile strength and rigidity, excellent wear and friction, and solvent resistance [7,8,9]. On one hand, the physical properties of POM are governed by the crystallization [10]. On the other hand, the crystallization behavior of POM depends on its supramolecular structure [11,12]. However, POM has a linear molecular chains as (-CH2-O-)n structure which leads to high crystallinity, which limits its application [13,14,15]. Therefore, many studies have reported on the effect of additives on the crystallization performance of POM [16]. For instance, Durmus et al. [17] investigated the effects of methyl-polyhedral oligomeric silsesquioxanes (methyl-POSS) on the isothermal crystallization behavior of POM. It was found that the addition of 2 wt% of methyl-POSS increased the reciprocal of crystallization half-time (τ0.5) of POM (0.133 min−1) approximately six fold, which demonstrated that methyl-POSS accelerated the crystallization rate of POM. The effects of poly(ethylene oxide) (PEO) on the crystallization and orientation of POM were studied by Tan et al. [18]. They pointed out that the melting point (161.3 J/g) and the crystallinity (50.7%) of POM were reduced by the addition of PEO. In addition, they also declared that PEO significantly decreased the spherulite size of POM. One interesting study on the crystallinity and crystal morphology of POM nanocomposite containing octakis((3-glycidoxypropyl) dimethylsiloxy) octasilsesquioxane (GPOSS) was performed by Czarnecka-Komorowska et al. [19]. It was shown that GPOSS reduced the spherulite size (48 µm) of POM, and increased the crystallization growth rate and the crystallinity degree (72%) of POM due to the heterogeneous nucleation of GPOSS. Jiao et al. [20] studied the effect of tributyl(octyl)phosphonium bis(trifloromethane-sulfonyl) imide (TBOP-TFSI) on the crystallization behaviors of POM. It was found that small amounts (0.5 wt%) of TBOP-TFSI could facilitate the nucleation of POM. Furthermore, they also declared that TBOP-TFSI decreased hemi-crystalline time (t0.5 = 2.4 min) and increased crystallinity (51.3%) of POM.
The synthesis and properties of Ag nanoparticles have attracted widespread attention owing to their unique volume effects, surface effects, and quantum size [21,22], as well as their high conductivity [23,24], excellent catalytic activities [25,26], and broad antiviral and antibacterial properties [27,28]. Meanwhile, nanocomposites containing Ag nanoparticles have widely been applied in a variety of areas [29] such as flexible supercapacitor electrodes [30], solar energy harvesting [31], catalytic degradation of organic dyes [32], wound healing [33], and so on. Rangraz et al. [34] anchored Ag nanoparticles on the selenium-doped graphitic carbon nitride (Se-g-C3N4) to fabricate the Se-g-C3N4/Ag nanocomposites and investigated its catalytic activities. They demonstrated that the Se-g-C3N4/Ag nanocomposites could be a novel, robust, recoverable and effective catalyst for the hydrogenation of nitroarene compounds. In addition, Shi et al. [35] investigated the effects of Ag loading and crystallization temperature on the crystallization behavior of polypropylene (PP). They found that the PP/Ag nanocomposites had higher crystallization rate (t0.5 = 18.1 s) and lower Avrami exponent (2.30 ≤ n ≤ 2.84) than that for PP (t0.5 = 20.2 s, 2.53 ≤ n ≤ 2.94), which indicated that the Ag nanoparticles increased amount of nucleation sites and crystallization rate of PP owing to the heterogeneous nucleation. Furthermore, Makvandi et al. [36] synthesized thermosensitive and injectable hydrogels containing corn silk extract-nanosilver (CSE-Ag), and demonstrated that as-synthesized CSE-Ag nanocomposites could promote high bone differentiation of mesenchymal stem cells (MSCs) and act a potential scaffold for bone tissue regeneration. Therefore, the combination of Ag nanoparticles and POM to prepare POM/Ag nanocomposites is one of the meaningful studies.
In our previous work, we successfully synthesized Ag nanoparticles with a monolayer of surfactants composed of oleic acid and n-propylamine, and the average size of Ag nanoparticles was approximately 10 nm, with a narrow size distribution. Meanwhile, the Ag nanoparticles gave rise to a better compatibility with POM and could be well dispersed in the POM matrix [37].
In this work, a simple melting processing method was used to prepare POM/Ag nanocomposites, as shown in Figure 1. To illustrate the dispersion and compatibility of Ag nanoparticles in POM, the micromorphology of POM/Ag nanocomposites were observed by transmission electron microscopy (TEM). In addition, differential scanning calorimetry (DSC) and polarized light microscopy (PLM) were employed to further study the effects of Ag nanoparticles content on the melting behavior, isothermal crystallization kinetics and morphology of POM.
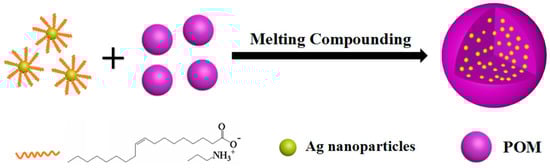
Figure 1.
Synthesis procedure of polyoxymethylene (POM)/silver (Ag) nanocomposites.
2. Experimental
2.1. Materials
Polyoxymethylene (POM) was obtained by Yunnan, Yuntianhua Co., Ltd., Shanghai, China. The melt flow index of POM is 2.5 g/10 min at 230 °C with a standard weight of 2.16 kg, and the density of POM is 1.40 g/cm3. Silver nitrate (99.8%), oleic acid (99%), anhydrous ethanol (99.7%), n-propylamine (98%), and ascorbic acid (99.7%) were purchased from Sinopharm Chemical Reagent Co., Ltd., Shanghai, China.
2.2. Synthesis of Ag Nanoparticles
The silver nitrate was reduced by ascorbic acid to prepare Ag nanoparticles, under the stability of oleic acid and n-propylamine. Therefore, the as-synthesized Ag nanoparticles were coated with a monolayer of surfactants consisting of oleic acid and the n-propylamine. In addition, the detailed preparation process and characterization of the Ag nanoparticles can be found in a previously published paper [37].
2.3. Preparation of POM/Ag Nanocomposites
POM/Ag nanocomposites were prepared by melting processing method in a torque rheometer. The mixing process has continued for 10 min at 190 °C, and the roller speed was 60 rpm. In addition, POM and Ag nanoparticles were both dried in vacuum oven overnight at 80 °C prior to melt processing to get rid of moisture. Furthermore, the compositions of POM/Ag nanocomposites were listed in Table 1.

Table 1.
The compositions of POM/Ag nanocomposites.
2.4. Transmission Electron Microscopy (TEM)
The dispersion of Ag nanoparticles in POM was investigated using TEM (Tecnai G2 F30, FEI, Hillsboro, OR, USA). All TEM samples preparation process: POM/Ag nanocomposites were cut by ultrathin slicer (Artos 3D, Shanghai, China) and placed onto an amorphous carbon-coated copper grid. The size of the Ag nanoparticles was analyzed using Image J software.
2.5. Differential Scanning Calorimetry (DSC)
The DSC measurements of POM/Ag nanocomposites were performed on a DSC 204F1 (Netzsch, Selb, Germany) to determine the crystallization and melting runs of POM/Ag nanocomposites. The complete procedure mainly included melting-crystallization runs and isothermal crystallization runs, as follows:
(a) In melting-crystallization runs, POM/Ag nanocomposites weighing about 6–8 mg were heated from 30 °C to 200 °C in an aluminum crucible with a heating rate of 10 °C/min and maintained at 200 °C for 5 min to erase the thermal history, then cooled from 200 °C to 30 °C with a cooling rate of 10 °C/min. After completion of the melt-crystallization process, samples were kept at 30 °C for 5 min. Then the samples were heated again from 30 °C to 200 °C with the heating rate of 10 °C/min. The second melting and the first cooling curves were recorded.
(b) In isothermal crystallization runs, we referred to the isothermal crystallization experiment performed by Durmus et al. [17]. Before the isothermal crystallization experiment, we observed the isothermal crystallization time of POM/Ag nanocomposites at the Tcry (130 °C, 135 °C 140 °C and 145 °C) by polarized light microscopy (PLM) with a hot stage. It was found that the isothermal crystallization time of POM/Ag nanocomposites at the Tcry was less than 30 min. POM/Ag nanocomposites weighing about 6–8 mg were heated from 30 °C to 200 °C in an aluminum crucible with a heating rate of 10 °C/min and maintained at 200 °C for 5 min to erase the thermal history, then cooled from 200 °C to the isothermal crystallization temperature (Tcry) (130 °C, 135 °C, 140 °C and 145 °C) with a cooling rate of 100 °C/min and maintained at Tcry for 30 min. The first cooling curve was recorded.
Furthermore, the degree of crystallinity (XC) was calculated by the Equation (1):
where ∆Hm is the enthalpy of second melting endotherms of POM/Ag nanocomposites, ∆ is the enthalpy of melting of 100% crystalline form of polymer, and α is the weight fraction of Ag nanoparticles. The ∆ value of POM is 326 J/g [38].
2.6. Polarized Light Microscopy (PLM)
The isothermal crystallization morphologies of POM/Ag nanocomposites were observed using PLM (Axio Imager A2, Zeiss, Shanghai, China) equipped with a digital camera (Axiocam Mrc 5, Zeiss, Shanghai, China). All POM/Ag nanocomposites were firstly melted at 200 °C and maintained for 5 min to eliminate the thermal history. Subsequently, the temperature of the sample was rapidly reduced to 140 °C with cooling rate of 100 °C/min and maintained at 140 °C for 30 min. The photographs of POM/Ag nanocomposites were then taken.
3. Results and Discussion
3.1. Morphology of POM/Ag Nanocomposites
The TEM images of POM/Ag nanocomposites are given in Figure 2. It was found that Ag nanoparticles easily aggregated together in POM. In addition, when the content of Ag nanoparticles was low (≤1 wt%), it was difficult to observe larger-size clusters of Ag nanoparticles, and most of the clusters of Ag nanoparticles were smaller than 200 nm. At the same time, the clusters of Ag nanoparticles separated from each other. However, when the content of Ag nanoparticles increased to 2 wt%, it easily formed the larger-size clusters of Ag nanoparticles (≥200 nm). This result proved that when the content of Ag nanoparticles was low (≤1 wt%), the monolayer surfactants on the surface of Ag nanoparticles had a strong effect and passivated the surface of Ag nanoparticles, which effectively inhibited the large-scale agglomeration of Ag nanoparticles. However, when the content of Ag nanoparticles reached 2 wt%, they would be easily aggregated together due to monolayer surfactants of Ag nanoparticles with weak effect, which resulted in poor dispersion of Ag nanoparticles in POM. This result was consistent with the analysis result of SEM images of POM/Ag nanocomposites in the previous paper [37].
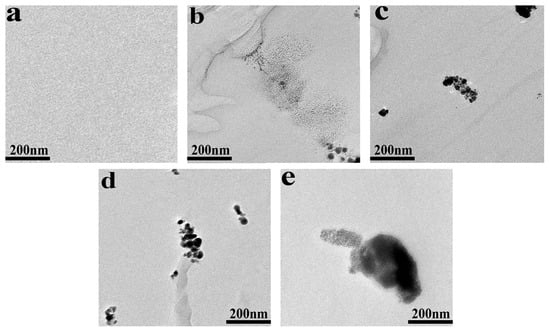
Figure 2.
Transmission electron microscopy (TEM) images of POM/Ag nanocomposites with different Ag nanoparticles contents: (a) 0, (b) 0.1, (c) 0.5, (d) 1 and (e) 2 wt%.
3.2. Melting and Crystallization Behavior of POM/Ag Nanocomposites
The melting and crystallization behavior of POM/Ag nanocomposites at the heating/cooling rate of 10 °C/min are shown in Figure 3a,b, respectively, and the DSC parameters are given in Table 2. As seen in Figure 3a, the melting behavior and range of POM/Ag nanocomposites were similar. It was clear that the endothermic peaks appearing between 160 °C and 175 °C could be assigned to the melting process of POM crystals. On one hand, as shown in Figure 3a, it was found that the melting peak temperature (Tm) of POM/Ag nanocomposites shifted to higher temperature with content of Ag nanoparticles increased, which indicated that Ag nanoparticles significantly affected the melt behavior of POM to some extent [39]. On the other hand, it was found the enthalpy of second melting endotherms (∆Hm) and the degree of crystallinity (XC) of POM/Ag nanocomposites first increased, then decreased as the content of Ag nanoparticles increased (Figure 3b,c). This could be attributed to the fact that the efficient heterogeneous nucleation of Ag nanoparticles could accelerate the crystallization rate of POM, which increased the degree of crystallinity of POM to a higher level, when the amount of Ag nanoparticles of POM/Ag nanocomposites was low (≤1 wt%) [37]. However, when the amount of Ag nanoparticles increased to 2 wt%, the Ag nanoparticles easily aggregated together to form a lot of large clusters in the POM matrix, which could affect the heterogeneous nucleation of Ag nanoparticles and restrained crystallization of POM to some degree [37].
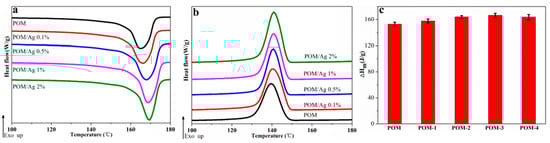
Figure 3.
(a) Second melting endotherms, (b) crystallization exotherms and (c) the enthalpy values of melting in the second heating run of POM/Ag nanocomposites at the heating/cooling rate of 10 °C/min.
Table 2.
Differential scanning calorimetry (DSC) parameters of POM/Ag nanocomposites at the heating/cooling rate of 10 °C/min.
3.3. Isothermal Crystallization Kinetics of POM/Ag Nanocomposites
Figure 4 shows the complete isothermal crystallization process of POM/Ag nanocomposites, and the times for isothermal crystallization of POM/Ag nanocomposites are given in Table 3. It was found that the crystallization exotherms of POM/Ag nanocomposites became flatter and the time for isothermal crystallization process increased with the increasing of crystallization temperature (Figure 4). In addition, as shown in Figure 4a and Table 3, it was clear that the time for isothermal crystallization of POM was about 7.74 ± 0.2 min at 145 °C. However, the POM/Ag nanocomposites crystallized for approximately 5–6 min at 145 °C (Figure 4b–e). Simultaneously, the time for isothermal crystallization of POM/Ag nanocomposites at other crystallization temperatures (130 °C, 135 °C, 140 °C) were also illustrated that the Ag nanoparticles accelerated the isothermal crystallization rate of the POM. What’s more, as the content of Ag nanoparticles increased, the time for isothermal crystallization of POM/Ag nanocomposites first decreased, then increased. Meanwhile, the time for isothermal crystallization of POM-3 was shortest. For instance, it only took about 2.53 min for POM-3 to fully crystallize at 130 °C, whereas the time for the isothermal crystallization process of other POM/Ag nanocomposites were more than 2.53 min at 130 °C. Therefore, this result also demonstrated that when the content of Ag nanoparticles was less than 1 wt%, the Ag nanoparticles enhanced the isothermal crystallization rate of POM due to the efficient heterogeneous nucleation. However, when the content of Ag nanoparticles increased to 2 wt%, the Ag nanoparticles easily aggregated together, which had a certain inhibitory effect on crystallization process of POM. The effect of Ag nanoparticles on isothermal crystallization of POM/Ag nanocomposites was in good accordance with that of Ag nanoparticles on non-isothermal crystallization of POM/Ag nanocomposites [37].
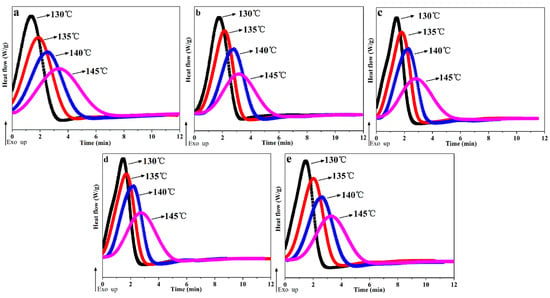
Figure 4.
Isothermal crystallization exotherms for POM/Ag nanocomposites: (a) POM, (b) POM-1, (c) POM-2, (d) POM-3 and (e) POM-4.
Table 3.
The time for isothermal crystallization of POM/Ag nanocomposites.
3.3.1. Avrami Model Analysis of POM/Ag Nanocomposites
The Avrami model [40] is used to describe the isothermal crystallization rates of POM/Ag nanocomposites, as shown in Equation (2):
where Xt is the relative degree of crystallinity as a function of time, n is the Avrami exponent, which is also a constant depends on the nucleation mechanism and crystal growth, and t is the time for isothermal crystallization process. The k is the Avrami rate constant, which associate with nucleation and growth rate of crystal.
In addition, the Xt can be calculated by the Equation (3):
where H(t) is the crystallization enthalpy during the infinitesimal time interval (dt), dH/dt is the heat flow rate, ∆Ht is the heat enthalpy. ∆H∞ is the total heat enthalpy in the crystallization process. The plots of Xt versus t for POM/Ag nanocomposites were shown in Figure 5a–e. It was found that all curves had the characteristic sigmoidal shape with time increased. In the first one, the first non-linear part of the curves was considered to be the induction and nucleation step in entire crystallization process of POM/Ag nanocomposites. For the next one, the linear part of the curves was seen as primary crystallization step in entire crystallization process. Finally, the second non-linear part of the curves was considered as crystallization termination step owing to the spherulites of POM/Ag nanocomposites impingement in the late stage of entire crystallization process. In addition, the curves of POM/Ag nanocomposites shifted to the right when the crystallization temperature increased. This result suggested that the rate of nucleation decreased with the increase of temperature, which resulted in the decrease of crystallization rate of POM/Ag nanocomposites. Furthermore, it was found that the time for isothermal crystallization of POM/Ag nanocomposites first decreased, then increased, as the content of Ag nanoparticles increased. It also implied that the isothermal crystallization rate of POM were accelerated by the small amount of Ag nanoparticles (≤1 wt%) due to the efficient heterogeneous nucleation. However, when the content of Ag nanoparticles increased to 2 wt%, they easily aggregated, which affected the crystallization process of POM.
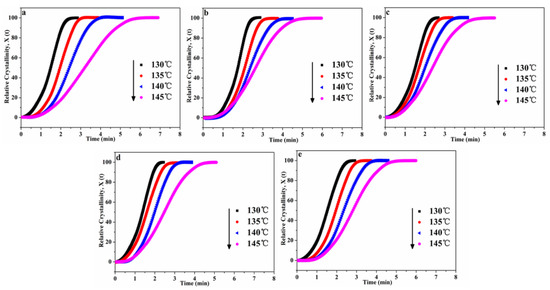
Figure 5.
Relative degree of crystallinity (Xt) as a function of time (t) for POM/Ag nanocomposites: (a) POM, (b) POM-1, (c) POM-2, (d) POM-3 and (e) POM-4.
Meanwhile, the crystallization half-time (t0.5) of POM/Ag nanocomposites can be directly obtained from Figure 5 and are given in Table 4. It was clearly shown that the t0.5 values of POM/Ag nanocomposites decreased with the Tcry increased. In addition, comparing the t0.5 values of POM/Ag nanocomposites at the same crystallization temperature (Tcry = 145 °C), it was found that the crystallization rate of POM/Ag nanocomposites kept to the following order: POM-3 (≈2.464 min) > POM-2 (≈2.513 min) > POM-4 (≈2.574 min) > POM-1 (≈2.766 min) > POM (≈3.426 min). This result proved that smaller amounts (≤1 wt%) of Ag nanoparticles acted as heterogeneous nucleating agents of POM and accelerated the isothermal crystallization rate of POM. However, when the amount of Ag nanoparticles increased to 2 wt%, Ag nanoparticles aggregated together and restrained crystallization of POM. Meanwhile, the reciprocal of crystallization half-time (τ0.5 = 1/t0.5) was employed to quantitatively compare the isothermal crystallization rates of POM/Ag nanocomposites. The plots of τ0.5 versus Tcry of POM/Ag nanocomposites are shown in Figure 6, and the τ0.5 values are given in Table 4. It was shown that the τ0.5 values of POM/Ag nanocomposites first increased, then decreased when the content of Ag nanoparticles increased. This result proved that when the content of Ag nanoparticles was less than 1 wt%, Ag nanoparticles enhanced the crystallization rate of POM owing to the heterogeneous nucleation effect. However, when the content of Ag nanoparticles increased to 2 wt%, a certain inhibitory action appeared in the crystallization process of POM, which was due to the aggregation of the Ag nanoparticles.
Table 4.
Parameters of Avrami analysis for POM/Ag nanocomposites.
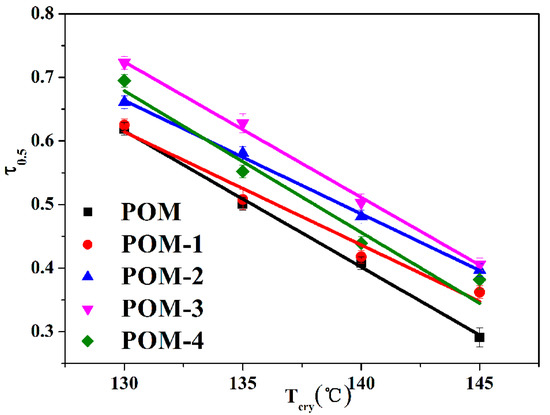
Figure 6.
Plots of τ0.5 versus Tcry for POM/Ag nanocomposites.
In addition, Equation (2) can be taken in the double-logarithmic form to obtain Equation (4):
The plots of ln(−ln(1−Xt)) versus ln(t) are shown in Figure 7. Moreover, the plots of n and k versus Tcry are shown in Figure 8a,b, respectively. In addition, the n and k values are given in Table 4. It can be seen in Figure 8a that the n values of POM were less than that of POM/Ag nanocomposites, which demonstrated that Ag nanoparticles increased the amount of effective nucleation sites owing to the nucleation effect of Ag nanoparticles. Meanwhile, it was clear from Figure 8b that the k values of POM/Ag nanocomposites decreased when the Tcry increased from 130 °C to 145 °C, which suggested that the crystallization rate of POM/Ag nanocomposites decreased with increasing temperature. In addition, it was shown that the k values first decreased, then increased when the content of Ag nanoparticles increased. This result demonstrated that when the content of Ag nanoparticles was less than 1 wt%, the Ag nanoparticles enhanced the crystallization rate of POM. However, when the content of Ag nanoparticles reached 2 wt%, they restrained the crystallization process of POM, which was due to the interaction between Ag nanoparticles and POM chains.
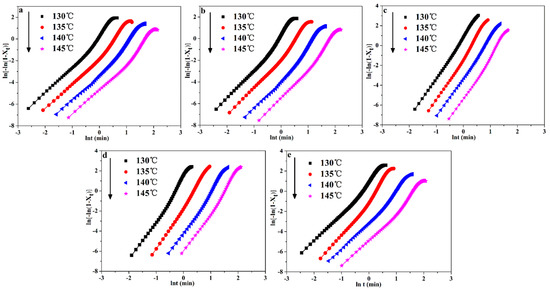
Figure 7.
Plots of ln(−ln(1−Xt)) as a function of ln(t) for POM/Ag nanocomposites: (a) POM, (b) POM-1, (c) POM-2, (d) POM-3 and (e) POM-4.
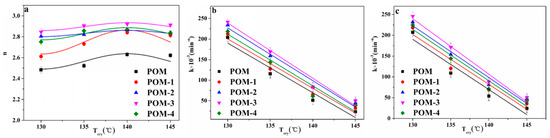
Figure 8.
(a) Avrami exponent (n), (b) experimental Avrami rate constant (k), and (c) theoretical Avrami rate constant (k) of POM/Ag nanocomposites.
The theoretical k was estimated by the well-fitting logarithmic representation of Equation (5):
The plots of theoretical k versus Tcry are shown in Figure 8c, and theoretical k values list in Table 4. It was seen that the theoretical k values first decreased, then increased when the content of Ag nanoparticles increased, which was in good accordance with the result of the experimental k values.
3.3.2. Lauritzen-Hoffman Model Analysis of POM/Ag Nanocomposites
The Lauritzen-Hoffman model, also referred to Lauritzen-Hoffman secondary nucleation theory, was used to determine the spherulitic growth rate (G) during the isothermal crystallization process of POM/Ag nanocomposites. The Lauritzen-Hoffman model defined three different crystallization regimes based on the relationships between the rate of secondary nucleation (i) and the lateral growth rate of spherulite (g). In regime I, this is i << g. In addition, i is on the order of g in regime II. However, this is i >> g in regime III [17]. In addition, it can be used to calculate G of POM/Ag nanocomposites by using the isothermal crystallization data, as shown in Equation (6) [41]:
where G0 is a pre-exponential factor; TC is the crystallization temperature and R is the ideal gas constant. U* is the activation energy necessary for the macromolecules to diffuse to the crystal phase in the melting state, which was obtained by Equation (7). f is a corrective factor, which is f = 2TC/(TC−T0 m). T∞ is a hypothetical temperature below which the molecular chain ceases motion, which is commonly defined as (Tg−30) K. ∆T = T0 m−TC is the supercooling temperature. Kg is the nucleation parameter, which relate to the fold and lateral surface energies. Equation (6) can be linearized as the Equation (8) by performing the logarithmic transformation.
where C1 = 4120 cal mol−1, C2 = 51.6 K. Kg and G0 can be acquired from the slope and intercept of the Equation (8), respectively. In addition, the G(τ0.5) values are also used in Equation (8). The Lauritzen-Hoffman model plots of POM/Ag nanocomposites are given in Figure 9, and Kg values list in Table 5.
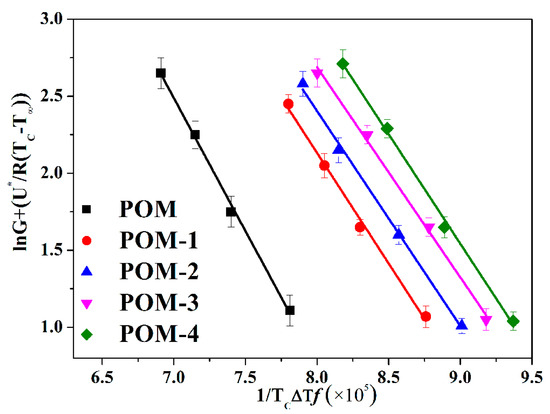
Figure 9.
Lauritzen-Hoffman model plots of POM/Ag nanocomposites.
Table 5.
Lauritzen-Hoffman model parameters of POM/Ag nanocomposites.
As shown in Figure 9, it was clear that the slopes trend of POM/Ag nanocomposites was the same, which indicated that it did not appear regime transition in the isothermal crystallization process of POM/Ag nanocomposites when the isothermal crystallization temperature increased. What’s more, two processes of crystal growth of the polymer were described in detail by the Lauritzen-Hoffman secondary nucleation theory [42]. First of all, the first stem deposited on the growing crystal surface (secondary nucleation). Secondly, subsequent stems attached to the chain of the crystal surface (surface spreading process). It was clear that the spherulites’ growth process of POM/Ag nanocomposites depended on the rate of secondary nucleation and the rate of surface spreading process. Therefore, the Ag nanoparticles of POM/Ag nanocomposites could act as the nucleating center of POM and create the crystal interfaces, which reduced the spherulite nucleus size of POM and accelerated the crystallization process of POM. In addition, it was found that Kg values of POM/Ag nanocomposites were smaller than that of POM, which proved that the addition of Ag nanoparticles reduced the energy need to create a new crystal surface, which accelerated the crystallization rate of POM. Simultaneously, it was shown that the Kg values of POM/Ag nanocomposites first decreased, then increased when the content of Ag nanoparticles increased, and the Kg value of POM-3 was smallest. This result demonstrated that when the content of Ag nanoparticles were less than 1 wt%, the Ag nanoparticles reduced the nucleation energy of POM and enhanced the crystallization rate of POM owing to the heterogeneous nucleation effect. However, when the content of Ag nanoparticles increased to 2 wt%, they easily aggregated together and decreased the amount of nucleating centers and new crystal surfaces, which had a certain inhibitory action on the crystallization process of POM.
In the isothermal crystallization process of POM/Ag nanocomposites, Kg, an isothermal crystallization kinetic parameter, is related to the energy need for the formation of nuclei owing to the heterogeneous nucleation of Ag nanoparticles. In addition, Kg can be calculated by Equation (9):
where b0 is the thickness of the stem added on the substrate, n is the variable constant of the crystallization process, δ is the lateral surface free energy, δe is the surface free energy of folding, kB is the Boltzman constant, ∆Hf is the melting enthalpy per unit volume of crystals. n value is equal to 4 at high temperature and low temperature, and n value is equal to 2 at intermediate temperatures [17]. In addition, the lateral surface free energy (δ) is calculated by Equation (10) [42]:
where a0 and b0 are both the unit cell parameters of POM, and a0b0 corresponds to the chain cross-section in the POM crystal. Therefore, δe can be calculated by using the determined Kg values and the crystal parameters (n = 4, b = 0.447 nm, kB = 1.38 × 10⁻²³ J/K, ∆Hf = 3.55 × 10⁸ J/m3 and δ = 14.7 × 10⁶ J/m2) [43], which are listed in Table 5. It is well known that when δe values are larger, the energy need for the chain folding onto the nucleus surface is higher. In addition, it was found that the δe values of the POM/Ag nanocomposites decreased in the order of POM (1.02 J/m2) > POM-4 (0.93 J/m2) > POM-1 (0.92 J/m2) > POM-2 (0.88 J/m2) > POM-3 (0.87 J/m2). This result proved that the addition of Ag nanoparticles reduced the surface free energy of folding (δe) and accelerated the crystallization rate of POM.
Furthermore, the addition of Ag nanoparticles reduced the surface free energy of folding (δe), which could increase the amount of effective crystal nucleus (N). Therefore, the N values of POM/Ag nanocomposites can be calculated using Equation (11), as follows:
the N values of POM/Ag nanocomposites are given in Table 5. It was obvious that the addition of Ag nanoparticles increased the number of effective crystal nuclei of POM. This result demonstrated that Ag nanoparticles reduced the surface free energy of folding (δe) owing to the heterogeneous nucleation, which increased number of effective crystal nuclei and enhanced the crystallization rate of POM.
3.3.3. Isothermal Crystallization Activation Energy Analysis of POM/Ag Nanocomposites
The isothermal crystallization activation energy (∆E) of POM/Ag nanocomposites can be determined by using the crystallization rate constant (k) of Avrami parameter [44]. Therefore, the ∆E values can be calculated by the Arrhenius equation, as follows:
where R is the ideal gas constant, k0 is a pre-exponential factor and TC is the crystallization temperature. Equation (12) is taken in the linearized form to obtain Equation (13).
The fitted lines of 1/nlnk versus 1/TC for POM/Ag nanocomposites are shown in Figure 10, and the r values and ∆E values are given in Table 6. It was found that the ∆E values of POM/Ag nanocomposites were less than that of POM (−65.14 ± 0.12 kJ/mol). This result indicated that the isothermal crystallization activation energy was reduced by Ag nanoparticles due to the heterogeneous nucleation [45]. It is well known that the magnitude of activation energy (|∆E|) related to energy need for the motion of polymer chains during the transformation from the melt into the crystalline state, and higher |∆E| values, mean that this transformation needs to release more energy [46]. It was shown that the |∆E| values of POM/Ag nanocomposites (POM-1 ≈ 70.81 kJ/mol, POM-2 ≈ 74.14 kJ/mol, POM-3 ≈ 74.21 kJ/mol, POM-4 ≈ 74.39 kJ/mol) were larger than that of POM (≈65.14 kJ/mol). This result demonstrated that when the amount of Ag nanoparticles increased, they easily aggregated and inhibited the movement of macromolecular chains of POM, which restrained the isothermal crystallization process of the POM.
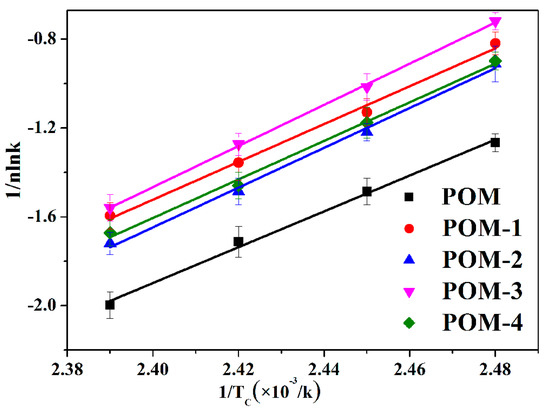
Figure 10.
Plots of 1/nlnk versus 1/TC for the POM/Ag nanocomposites.
Table 6.
Isothermal crystallization activation energy of POM/Ag nanocomposites.
3.4. Morphology of POM/Ag Nanocomposites
The isothermal crystallization behavior results of POM/Ag nanocomposites are further supported by the PLM study. Figure 11 compares the spherulite morphology of POM/Ag nanocomposites, which was used to investigate the effect of the Ag nanoparticles on the isothermal crystallization behavior of POM. As seen in Figure 11a, in POM there were a few nuclei and spherulites with dimensions of the order of approximately 100 μm, and the interface between the spherulites was clearly visible. In addition, Figure 11b–d shown that POM/Ag nanocomposites exhibited a drastic reduction in the size of spherulites as compared to POM. Meanwhile, the amount of spherulites increased with no clear distinction between the interfaces of adjacent spherulites owing to heterogeneous nucleation of Ag nanoparticles. These results also implied Ag nanoparticles generated a large number of nuclei and effective nucleation sites. Furthermore, the nucleation density could affect the crystallization process of polymer [47]. Therefore, the large amount of crystal nuclei led to the formation of smaller spherulites in the limited space of POM. However, when the content of Ag nanoparticles increased to 2 wt%, the Ag nanoparticles easily aggregated and reduced heterogeneous nucleation of Ag nanoparticles, which reduced amount of effective nucleation sites. Furthermore, as seen in Figure 11e, it was clear that the spherulite size of POM became larger and the interface between the spherulites became more visible due to agglomeration of Ag nanoparticles.
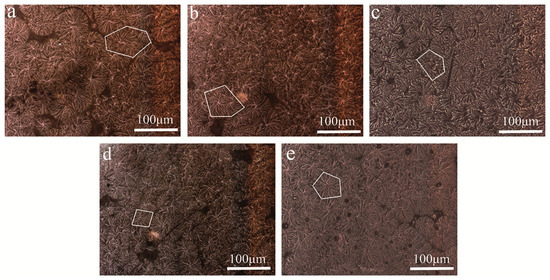
Figure 11.
PLM photographs of POM/Ag nanocomposites: (a) POM, (b) POM-1, (c) POM-2, (d) POM-3 and (e) POM-4. (The white parts indicate spherulites).
4. Conclusions
In this work, we prepared POM/Ag nanocomposites using a simple melting compounding route. The dispersion and size of Ag nanoparticles in POM was investigated using transmission electron microscopy (TEM). It indicated that when the content of Ag nanoparticles was low (≤1 wt%), the clusters of Ag nanoparticles were smaller than 200 nm and were separated from each other owing to the monolayer surfactants on the surface of Ag nanoparticles. However, when the content of Ag nanoparticles reached 2 wt%, they easily aggregated to form the larger-size clusters of Ag nanoparticles (≥200 nm), which resulted in poor dispersion of Ag nanoparticles in POM. In addition, the isothermal crystallization process and melting behavior of POM/Ag nanocomposites were investigated by differential scanning calorimetry (DSC). It was found that as the content of Ag nanoparticles increased, the degree of crystallinity (XC) of POM/Ag nanocomposites first increased, then decreased, and the XC of POM/Ag nanocomposites with 1 wt% Ag nanoparticles was largest. Furthermore, the isothermal crystallization kinetics of POM/Ag nanocomposites were studied by the Avrami model. On one hand, it was found that the t0.5 values of POM/Ag nanocomposites (Tcry = 145 °C) kept to the following order: POM-3 (≈2.464 min) > POM-2 (≈2.513 min) > POM-4 (≈2.574 min) > POM-1 (≈2.766 min) > POM (≈3.426 min). On the other hand, the n values of POM were less than that of POM/Ag nanocomposites. Meanwhile, Lauritzen-Hoffman secondary nucleation theory described the crystal growth of POM as two processes. It was found that the nucleation parameter (Kg) of POM/Ag nanocomposites were smaller than that of POM (≈2.48 × 10⁵ K2). Similarly, the surface free energy of folding (δe) values decreased in the order of POM (≈1.02 J/m2) > POM-4 (≈0.93 J/m2) > POM-1 (≈0.92 J/m2) > POM-2 (≈0.88 J/m2) > POM-3 (≈0.87 J/m2). These results proved that addition of Ag nanoparticles accelerated the crystallization rate of POM. Furthermore, it was clearly seen that the ∆E values of POM/Ag nanocomposites (POM-1 ≈ −70.81 kJ/mol, POM-2 ≈ −74.14 kJ/mol, POM-3 ≈ −74.21 kJ/mol, POM-4 ≈ −74.39 kJ/mol) were less than that of POM (≈−65.14 kJ/mol). However, the |∆E| values of POM/Ag nanocomposites were larger than that of POM. It revealed that when the amount of Ag nanoparticles was low (≤1 wt%), they reduced the isothermal crystallization activation energy and accelerated the crystallization rate of POM. However, when the content of Ag nanoparticles increased to 2 wt%, they aggregated together and inhibited the movement of the POM molecular chain, which reduced the effect of heterogeneous nucleation of Ag nanoparticles. In short, this study demonstrated that Ag nanoparticles could effectively be used to control the isothermal crystallization and melting behavior of POM by balancing the competition between POM molecular chain restriction and heterogeneous nucleation activity.
Author Contributions
Conceptualization, M.M.; methodology, L.W. and H.H.; formal analysis, Y.L. (Yang Liu); resources, Y.L. (Yongli Liu); data curation, X.Z. and G.Q.; writing—original draft preparation, Y.Z.; writing—review and editing, M.M. and Y.L. (Ying Li). All authors have read and agreed to the published version of the manuscript.
Funding
This research was funded by the Marine S & T Fund of Shandong Province for Pilot National Laboratory for Marine Science and Technology (Qingdao) (2018SDKJ0304-5), National Science Foundation of China (31672699), and Shanghai Sailing Program (18YF1429700).
Conflicts of Interest
The authors declare no conflict of interest.
References
- Andrzejewski, J.; Skórczewska, K.; Kloziński, A. Improving the toughness and thermal resistance of polyoxymethylene/poly(lactic acid) blends: Evaluation of structure-properties correlation for reactive processing. Polymers 2020, 12, 307. [Google Scholar] [CrossRef] [PubMed]
- Nguyen, T.C.; Tran, T.M.; Trinh, A.T.; Nguyen, A.H.; Dam, X.T.; Vu, Q.T.; Tran, D.L.; Nguyen, D.T.; Le, T.G.; Thai, H. Polyoxymethylene/silica/polylactic acid-grafted polyethylene glycol nanocomposites: Structure, morphology, and mechanical properties and ozone and UV durability. RSC Adv. 2020, 10, 2691–2702. [Google Scholar] [CrossRef]
- Fang, X.; Wyatt, T.; Shi, J.; Yao, D. Fabrication of high-strength polyoxymethylene fibers by gel spinning. J. Mater. Sci. 2018, 53, 11901–11916. [Google Scholar] [CrossRef]
- Kuciel, S.; Bazan, P.; Liber-Kneć, A.; Gądek-Moszczak, A. Physico-mechanical properties of the poly(oxymethylene) composites reinforced with glass fibers under dynamical loading. Polymers 2019, 11, 2064. [Google Scholar] [CrossRef]
- Yang, J.; Yang, W.; Wang, X.; Dong, M.; Liu, H.; Wujcik, E.K.; Shao, Q.; Wu, S.; Ding, T.; Guo, Z. Synergistically toughening polyoxymethylene by methyl methacrylate-butadiene-styrene copolymer and thermoplastic polyurethane. Macromol. Chem. Phys. 2019, 220, 1800567. [Google Scholar] [CrossRef]
- Zhang, W.; Xu, X.; Wang, H.; Wei, F.; Zhang, Y. Experimental and numerical analysis of interfacial bonding strength of polyoxymethylene reinforced cement composites. Constr. Build. Mater. 2019, 207, 1–9. [Google Scholar] [CrossRef]
- Bazan, P.; Kuciel, S.; Nykiel, M. Characterization of composites based on polyoxymethylene and effect of silicone addition on mechanical and tribological behavior. Polym. Eng. Sci. 2019, 59, 935–940. [Google Scholar] [CrossRef]
- Li, J.H.; Wang, Y.T.; Wang, X.D.; Wu, D.Z. Development of Polyoxymethylene/polylactide blends for a potentially biodegradable material: Crystallization kinetics, lifespan prediction, and enzymatic degradation behavior. Polymers 2019, 11, 1516. [Google Scholar] [CrossRef]
- Guo, X.; Zhang, J.; Huang, J. Poly(lactic acid)/polyoxymethylene blends: Morphology, crystallization, rheology, and thermal mechanical properties. Polymer 2015, 69, 103–109. [Google Scholar] [CrossRef]
- Lguchi, M. Memoir: A polymer whisker-the needle-shaped single crystal of polyoxymethylene. Polymer 2019, 168, 255–268. [Google Scholar] [CrossRef]
- Jasiurkowska-Delaporte, M.; Rozwadowski, T.; Juszyńska-Gałązka, E. Kinetics of non-isothermal and isothermal crystallization in a liquid crystal with highly ordered smectic phase as reflected by differential scanning calorimetry, polarized optical microscopy and broadband dielectric spectroscopy. Crystals 2019, 9, 205. [Google Scholar] [CrossRef]
- Abushammala, H.; Mao, J. Impact of the Surface Properties of cellulose nanocrystals on the crystallization kinetics of poly(butylene succinate). Crystals 2020, 10, 196. [Google Scholar] [CrossRef]
- Tomara, G.N.; Karahaliou, P.K.; Psarras, G.C.; Georga, S.N.; Krontiras, C.A.; Siengchin, S.; Karger-Kocsis, J. Dielectric relaxation mechanisms in polyoxymethylene/polyurethane/layered silicates hybrid nanocomposites. Eur. Polym. J. 2017, 95, 304–313. [Google Scholar] [CrossRef][Green Version]
- Kunnan Singh, J.S.; Ching, Y.C.; Abdullah, L.C.; Ching, K.Y.; Razali, S.; Gan, S.N. Optimization of mechanical properties for polyoxymethylene/glass fiber/polytetrafluoroethylene composites using response surface methodology. Polymers 2018, 10, 338. [Google Scholar] [CrossRef]
- Yu, C.; Xie, Q.; Bao, Y.; Shan, G.; Pan, P. Crystalline and spherulitic morphology of polymers crystallized in confined systems. Crystals 2017, 7, 147. [Google Scholar] [CrossRef]
- Hu, R.R.; Gao, E.L.; Xu, Z.P.; Liu, L.Q.; Wang, G.R.; Zhu, H.W.; Zhang, Z. Hierarchical-structure-dependent high ductility of electrospun polyoxymethylene nanofibers. J. Appl. Polym. Sci. 2018, 136, 47086. [Google Scholar] [CrossRef]
- Durmus, A.; Kasgoz, A.; Ercan, N.; Akın, D.; Sanlı, S. Effect of polyhedral oligomeric silsesquioxane (POSS) reinforced polypropylene (PP) nanocomposite on the microstructure and isothermal crystallization kinetics of polyoxymethylene (POM). Polymer 2012, 53, 5347–5357. [Google Scholar] [CrossRef]
- Tan, C.B.; Bai, S.B.; Wang, Q. The crystallization morphology evolution of polyoxymethylene/poly(ethylene oxide) blend micropart prepared under microinjection molding conditions. J. Appl. Polym. Sci. 2014, 131, 40538. [Google Scholar] [CrossRef]
- Czarnecka-Komorowska, D.; Sterzynski, T. Effect of polyhedral oligomeric silsesquioxane on the melting, structure, and mechanical behavior of polyoxymethylene. Polymers 2018, 10, 203. [Google Scholar] [CrossRef]
- Jiao, Q.; Chen, Q.; Wang, L.; Chen, H.; Li, Y. Investigation on the crystallization behaviors of polyoxymethylene with a small amount of ionic liquid. Nanomaterials 2019, 9, 206. [Google Scholar] [CrossRef]
- Liang, Z.; Tian, Q.; Zhang, H.; Hu, J.; He, P.; Li, H.; Bao, S.; Wang, P.; Huang, H.; Song, F. Exploring the adsorption mechanism of tetracene on Ag(110) by STM and dispersion-corrected DFT. Crystals 2020, 10, 13. [Google Scholar] [CrossRef]
- Cao, L.; Liao, B.; Wu, X.; Li, C.; Huang, G.; Cheng, N. Hot Deformation behavior and microstructure characterization of an Al-Cu-Li-Mg-Ag alloy. Crystals 2020, 10, 416. [Google Scholar] [CrossRef]
- Li, Z.Q.; Wang, X.L.; Yin, Z.K.; Zhao, J.L.; Song, M.; Wu, Z.G.; Li, H.Y.; Wang, X.X. Ag nanoparticles decorated N/S dual-doped graphene nanohybrids for high-performance asymmetric supercapacitors. Carbon 2020, 161, 726–735. [Google Scholar] [CrossRef]
- Abdalla, J.T.; Wang, J.; Wang, D. Effect of Ag/rGO on the optical properties of plasmon-modified SnO2 composite and its application in self-powered UV photodetector. Crystals 2019, 9, 648. [Google Scholar] [CrossRef]
- Qi, L.B.; Zhang, K.M.; Qin, W.; Hu, Y.X. Highly efficient flow-through catalytic reduction of methylene blue using silver nanoparticles functionalized cotton. Chem. Eng. J. 2020, 388, 124252. [Google Scholar] [CrossRef]
- Silvestri, D.; Waclawek, S.; Venkateshaiah, A.; Krawczyk, K.; Sobel, B.; Padil, V.V.T.; Cernik, M.; Varma, R.S. Synthesis of Ag nanoparticles by a chitosan-poly(3-hydroxybutyrate) polymer conjugate and their superb catalytic activity. Carbohyd. Polym. 2020, 232, 115806. [Google Scholar] [CrossRef] [PubMed]
- Martínez Espinosa, J.C.; Carrera Cerritos, R.; Ramírez Morales, M.A.; Sánchez Guerrero, K.P.; Silva Contreras, R.A.; Macías, J.H. Characterization of silver nanoparticles obtained by a green route and their evaluation in the bacterium of pseudomonas aeruginosa. Crystals 2020, 10, 395. [Google Scholar] [CrossRef]
- Zare, E.N.; Makvandi, P.; Borzacchiello, A.; Tay, F.R.; Ashtari, B.; Padil, V.V.T. Antimicrobial gum bio-based nanocomposites and their industrial and biomedical applications. Chem. Commun. 2019, 55, 14871–14885. [Google Scholar] [CrossRef]
- Liao, G.F.; Fang, J.S.; Li, Q.; Li, S.H.; Xu, Z.S.; Fang, B.Z. Ag-Based nanocomposites: Synthesis and applications in catalysis. Nanoscale 2019, 11, 7062–7096. [Google Scholar] [CrossRef]
- Guan, X.; Cao, L.; Huang, Q.; Kong, D.; Zhang, P.; Lin, H.; Li, W.; Lin, Z.; Yuan, H. Direct writing supercapacitors using a carbon nanotube/Ag nanoparticle-based ink on cellulose acetate membrane paper. Polymers 2019, 11, 973. [Google Scholar] [CrossRef]
- Dhiman, M. Plasmonic nanocatalysis for solar energy harvesting and sustainable chemistry. J. Mater. Chem. A 2020, 8, 10074–10095. [Google Scholar] [CrossRef]
- Mei, S.X.; Pan, M.W.; Gao, S.S.; Song, S.F.; Wang, J.; Liu, G. Organic–inorganic bimetallic hybrid particles with controllable morphology for the catalytic degradation of organic dyes. New J. Chem. 2020, 44, 8366–8378. [Google Scholar] [CrossRef]
- Makvandi, P.; Ali, G.W.; Sala, F.D.; Abdel-Fattah, W.I.; Borzacchiello, A. Biosynthesis and characterization of antibacterial thermosensitive hydrogels based on corn silk extract, hyaluronic acid and nanosilver for potential wound healing. Carbohyd. Polym. 2019, 223, 115023. [Google Scholar] [CrossRef] [PubMed]
- Rangraz, Y.; Nemati, F.; Elhampour, A. Selenium-doped graphitic carbon nitride decorated with Ag NPs as a practical and recyclable nanocatalyst for the hydrogenation of nitro compounds in aqueous media. Appl. Surf. Sci. 2020, 507, 145164. [Google Scholar] [CrossRef]
- Shi, Y.; Sun, B.; Zhou, Z.; Wangatia, L.M.; Chen, L.; Zhu, M. Polypropylene nanocomposites based on synthetic organic-soluble Ag nanocrystals with prominent β-nucleating effect: Quiescent crystallization and melting behavior. J. Macromol. Sci. Phys. 2012, 51, 2505–2518. [Google Scholar] [CrossRef]
- Makvandi, P.; Ali, G.W.; Sala, F.D.; Abdel-Fattah, W.I.; Borzacchiello, A. Hyaluronic acid/corn silk extract based injectable nanocomposite: A biomimetic antibacterial scaffold for bone tissue regeneration. Mater. Sci. Eng. C 2020, 107, 110195. [Google Scholar] [CrossRef]
- Zeng, Y.C.; Liu, Y.; Wang, L.M.; Huang, H.L.; Zhang, X.; Liu, Y.L.; Min, M.H.; Li, Y. Effect of silver nanoparticles on the microstructure, non-isothermal crystallization behavior and antibacterial activity of polyoxymethylene. Polymers 2020, 12, 424. [Google Scholar] [CrossRef]
- Kumar, G.; Neelakantan, N.R.; Subramanian, N. Polyacetal and thermoplastic polyurethane elastomer toughened polyacetal: Crystallinity and fracture mechanics. J. Mater. Sci. 1995, 30, 1480–1486. [Google Scholar] [CrossRef]
- Ouladsmane, M.; Saeed, W.S.; Al-Odayni, A.-B.; Ahmed, A.Y.B.H.; Alghamdi, A.A.; Al-Kahtani, A.; Aouak, T. Non isothermal crystallization kinetics and isothermal decomposition of poly(ethylene-co-vinylalcohol/poly(D,L-lactic-co-glycolic acid) blend. Crystals 2020, 10, 425. [Google Scholar] [CrossRef]
- Avrami, M.J. Kinetics of phase change. I general theory. J. Chem Phys. 1939, 7, 1103–1112. [Google Scholar] [CrossRef]
- Chen, Y.H.; Ranganathan, P.; Chen, C.W.; Lee, Y.H.; Rwei, S.P. Effect of bis (2-Aminoethyl) adipamide/adipic acid segment on polyamide 6: Crystallization kinetics study. Polymers 2020, 12, 1067. [Google Scholar] [CrossRef] [PubMed]
- Lauritzen, J.L.; Hoffman, J.D. Extension of theory of growth of chain-folded polymer crystals to large undercoolings. J. Appl. Phys. 1973, 44, 4340–4352. [Google Scholar] [CrossRef]
- Hoffman, J.D. Regime III crystallization in melt-crystallized polymers: The variable cluster model of chain folding. Polymer 1983, 24, 3–26. [Google Scholar] [CrossRef]
- Grigoras, V.C. Aliphatic copolyamide nanocomposites: Isothermal crystallization and crystalline morphology induced by clays. Thermochim. Acta. 2019, 675, 77–83. [Google Scholar] [CrossRef]
- Deng, Y.; He, M.Y.; Li, J.H. Non-isothermal crystallization behavior of polyethylene glycol/expanded vermiculite form-stable composite phase change material. Mater. Lett. 2019, 234, 17–20. [Google Scholar] [CrossRef]
- Wang, Z.Q.; Hu, G.S.; Zhang, J.T.; Xu, J.S.; Shi, W.B. Non-isothermal crystallization kinetics of nylon 10T and nylon 10T/1010 copolymers: Effect of sebacic acid as a third comonomer. Chin. J. Chem. Eng. 2017, 25, 963–970. [Google Scholar] [CrossRef]
- Zhu, B.; Li, W.; Song, J.; Wang, J. Structure and properties of polypropylene/polyolefin elastomer/organic montmorillonite nanocomposites. J. Macromol. Sci. B 2019, 58, 73–87. [Google Scholar] [CrossRef]


© 2020 by the authors. Licensee MDPI, Basel, Switzerland. This article is an open access article distributed under the terms and conditions of the Creative Commons Attribution (CC BY) license (http://creativecommons.org/licenses/by/4.0/).