Article

Single-Shot Electro-Optic Sampling on the Temporal Structure of Laser Wakefield Accelerated Electrons

Kansai Photon Science Institute, National Institutes for Quantum and Radiological Science and Technology (QST), 8-1-7 Umemidai, Kizugawa-City, Kyoto 619-0215, Japan
*
Author to whom correspondence should be addressed.
Crystals 2020, 10(8), 640; https://doi.org/10.3390/cryst10080640
Submission received: 6 July 2020 / Revised: 21 July 2020 / Accepted: 22 July 2020 / Published: 24 July 2020
(This article belongs to the Special Issue Development of High Intensity Crystal Laser and Its Applications)

Abstract

:
Particle acceleration driven by a high power Ti: sapphire laser has invoked great interest worldwide because of the ultrahigh acceleration gradient. For the aspect of electron acceleration, electron beams with energies over GeV have been generated using the laser wakefield acceleration mechanism. For the optimization of the electron generation process, real-time electron parameter monitors are necessary. One of the key parameters of a high energy particle beam is the temporal distribution, which is closely related with the timing resolution in a pump-probe application. Here, we introduced the electro-optic sampling method to laser wakefield acceleration. Real-time multibunch structures were observed. Careful calculations on the physical processes of signal generation in an electro-optic crystal were performed. Discussions of the methodology are elaborated in detail.

1. Introduction

Chirped pulse amplification (CPA) [1], which was awarded the 2018 Nobel Prize in physics, is a revolutionary technology for the generation of high power lasers. Recently, Ti: Sapphire lasers with a duration of tens of femtoseconds (fs) and power of up to petawatt (PW) [2] are used for the high energy density study worldwide. By focusing a high power laser to a spot size of a micrometer, the intensity exceeds 1022 W/cm2 [3] with the J-KAREN-P laser [4] in the Kansai Photon Science Institute (KPSI), National Institutes for Quantum and Radiological Science and Technology (QST), Japan. With such an ultrahigh intensity, the electron motion become ultrarelativistic and very interesting physics have been studied [5,6].
One of the most attractive applications of such ultrashort intense lasers is the laser-driven particle acceleration. The ponderomotive force of an intense laser pulse can be used to create plasma waves with large amplitude. In 1979, a concept of laser electron accelerator was proposed by T. Tajima and J. Dawson [7]. By the incidence of an ultrashort high power laser to an underdense plasma, a plasma wave will be created in the wake of the driver laser. Electrons trapped in the wake wave can be accelerated to GeV within several centimeters, corresponding to an acceleration gradient three orders of magnitudes greater than that of conventional accelerators. This is the so-called laser wakefield acceleration (LWFA). In the last decade, electron beams with an energy of 8 GeV [8], relative energy spread of 0.4% [9], bunch duration of 1.7 fs (rms) [10], and a single bunch charge of 0.3 nC [11] were achieved separately. The rapid development of LWFA attracted great attention in both the high power laser society and the accelerator community. Such a compact acceleration regime is of great significance for the construction of a small-size collider [12] or a table-top X-ray-free electron laser [13]. Since the electron bunch duration in LWFA is only tens of femtoseconds, LWFA is considered to have potential for applications of ultrafast pump-probe studies.
In a pump-probe experiment, the temporal resolution is mainly limited by the pulse duration and jitter of the probe. The temporal properties of the secondary radiation sources from LWFA are basically considered to be the same with the electron bunches. At present, due to the nonlinear process of laser plasma interaction, the electron pointing, divergence, and energy have large fluctuations shot by shot. Thus, the single-shot capability of an electron temporal monitor is very important. In the previous studies of LWFA, the electron bunch durations were measured mostly by analyzing the coherent transition radiation (CTR) when the electron passes through a metal–vacuum (or plasma–vacuum) boundary [10,14,15]. Although electron bunch duration down to femtosecond was demonstrated, such measurements were conducted either with many shots of accumulation or at the sacrifice of electron quality by inserting a metal radiator. Besides, the emission timing information was difficult to be achieved. For the optimization of electron parameters and thus the time resolution in pump-probe applications, real-time nondestructive electron temporal monitors are necessary for LWFA.
Electro-optic (EO) sampling is a convenient technique widely used in terahertz (THz) research [16]. This method was introduced to accelerator research for the single-shot nondestructive temporal measurement [17,18,19,20,21,22]. By setting an EO crystal aside from the electron beam path, the Coulomb field of the electron bunch acts as an external DC field and induces the Pockels effect. When a probe laser propagates through the crystal simultaneously, birefringence occurs and the electron temporal information can be recorded from the polarization rotation of the probe. By setting a relative angle between the probe laser and the electron path, the electron longitudinal distribution can be coded transversely to the probe laser profile. This so-called EO spatial decoding technique [22] is simple and efficient for detecting the electron bunch timing.
For the determination of the electron emission timing, we, for the first time to the best of our knowledge, introduced the EO spatial decoding technique to LWFA [23]. In this article, we focus on the detailed elaboration on the methodology of this technique when applied to LWFA. Careful calculations on the physical processes of signal generation are performed. The factors related with the limitation of the temporal resolution are pointed out. We hope this study is useful for the construction of a table-top electron accelerator and related ultrafast pump-probe experiments.
This paper is organized as follows. The general concept of EO sampling is elaborated in Section 2. A special case when applying the EO spatial decoding to LWFA and observed results in the experiment are presented in Section 3.1 and Section 3.2. Detailed discussions on optimizing the EO method for LWFA are included in Section 3.3, which includes how to improve the resolution of EO method to measure femtosecond electron bunches from LWFA (Section 3.3.1), how the fluctuation of energies and bunch durations of electrons affect the timing measurement (Section 3.3.2), and how the longitudinal expansion of an electron bunch responds more for the signal weakening than the transverse expansion when the measurement was performed far from the gas jet (Section 3.3.3). Discussion and summary are presented in Section 4.

2. Materials and Methods

We mainly discuss crystals with a zinc blende structure, such as zinc telluride (ZnTe) and gallium phosphide (GaP). Such crystals are isotropic if no external DC field is applied. The Coulomb field of an electron bunch is radially polarized. Yet, at the detection point (in the crystal) with a distance aside the electron path, the Coulomb field can be considered as linearly polarized. For an EO sampling set-up, the crystals are cut with a (110) surface. The [−1, 1, 0] optical axis is aligned parallel with the Coulomb field polarization. The probe laser passing through the crystal has polarization in the same plane formed by the crystal [−1, 1, 0] optical axis and the electron beam path. In this case, the probe laser components parallel and orthogonal to the optical axis will experience different refractive indexes, which results in a phase retardation between each other. When the probe laser exits the crystal, the polarization becomes elliptical, as shown in Figure 1a. A maximum retardation is calculated as Γ m = n 0 3 r 41 E T H z ω d / c [21], where n 0 is the refractive index of the probe laser in the crystal, r 41 is the EO coefficient, E T H z is the Coulomb field that resides in THz range, ω 0 is the frequency of the probe laser, d is the crystal thickness, and c is the vacuum light speed. For EO spatial decoding, the probe incident angle on the crystal surface is θ p . For a conventional accelerator, the measurement is performed far from the cathode and equivalent to a free electron case. The Coulomb field can be considered perpendicular to the electron path (as shown in Figure 1b) with a broadening angle of 1 / γ , while E = ( γ 1 ) m e c 2 is the electron energy. A temporal mapping relationship is widely used [21,22]:
c Δ τ = Δ ξ tan θ p
where Δ τ is the real timing difference and Δ ξ is the signal displace observed by a charge coupled device (CCD).

3. Results

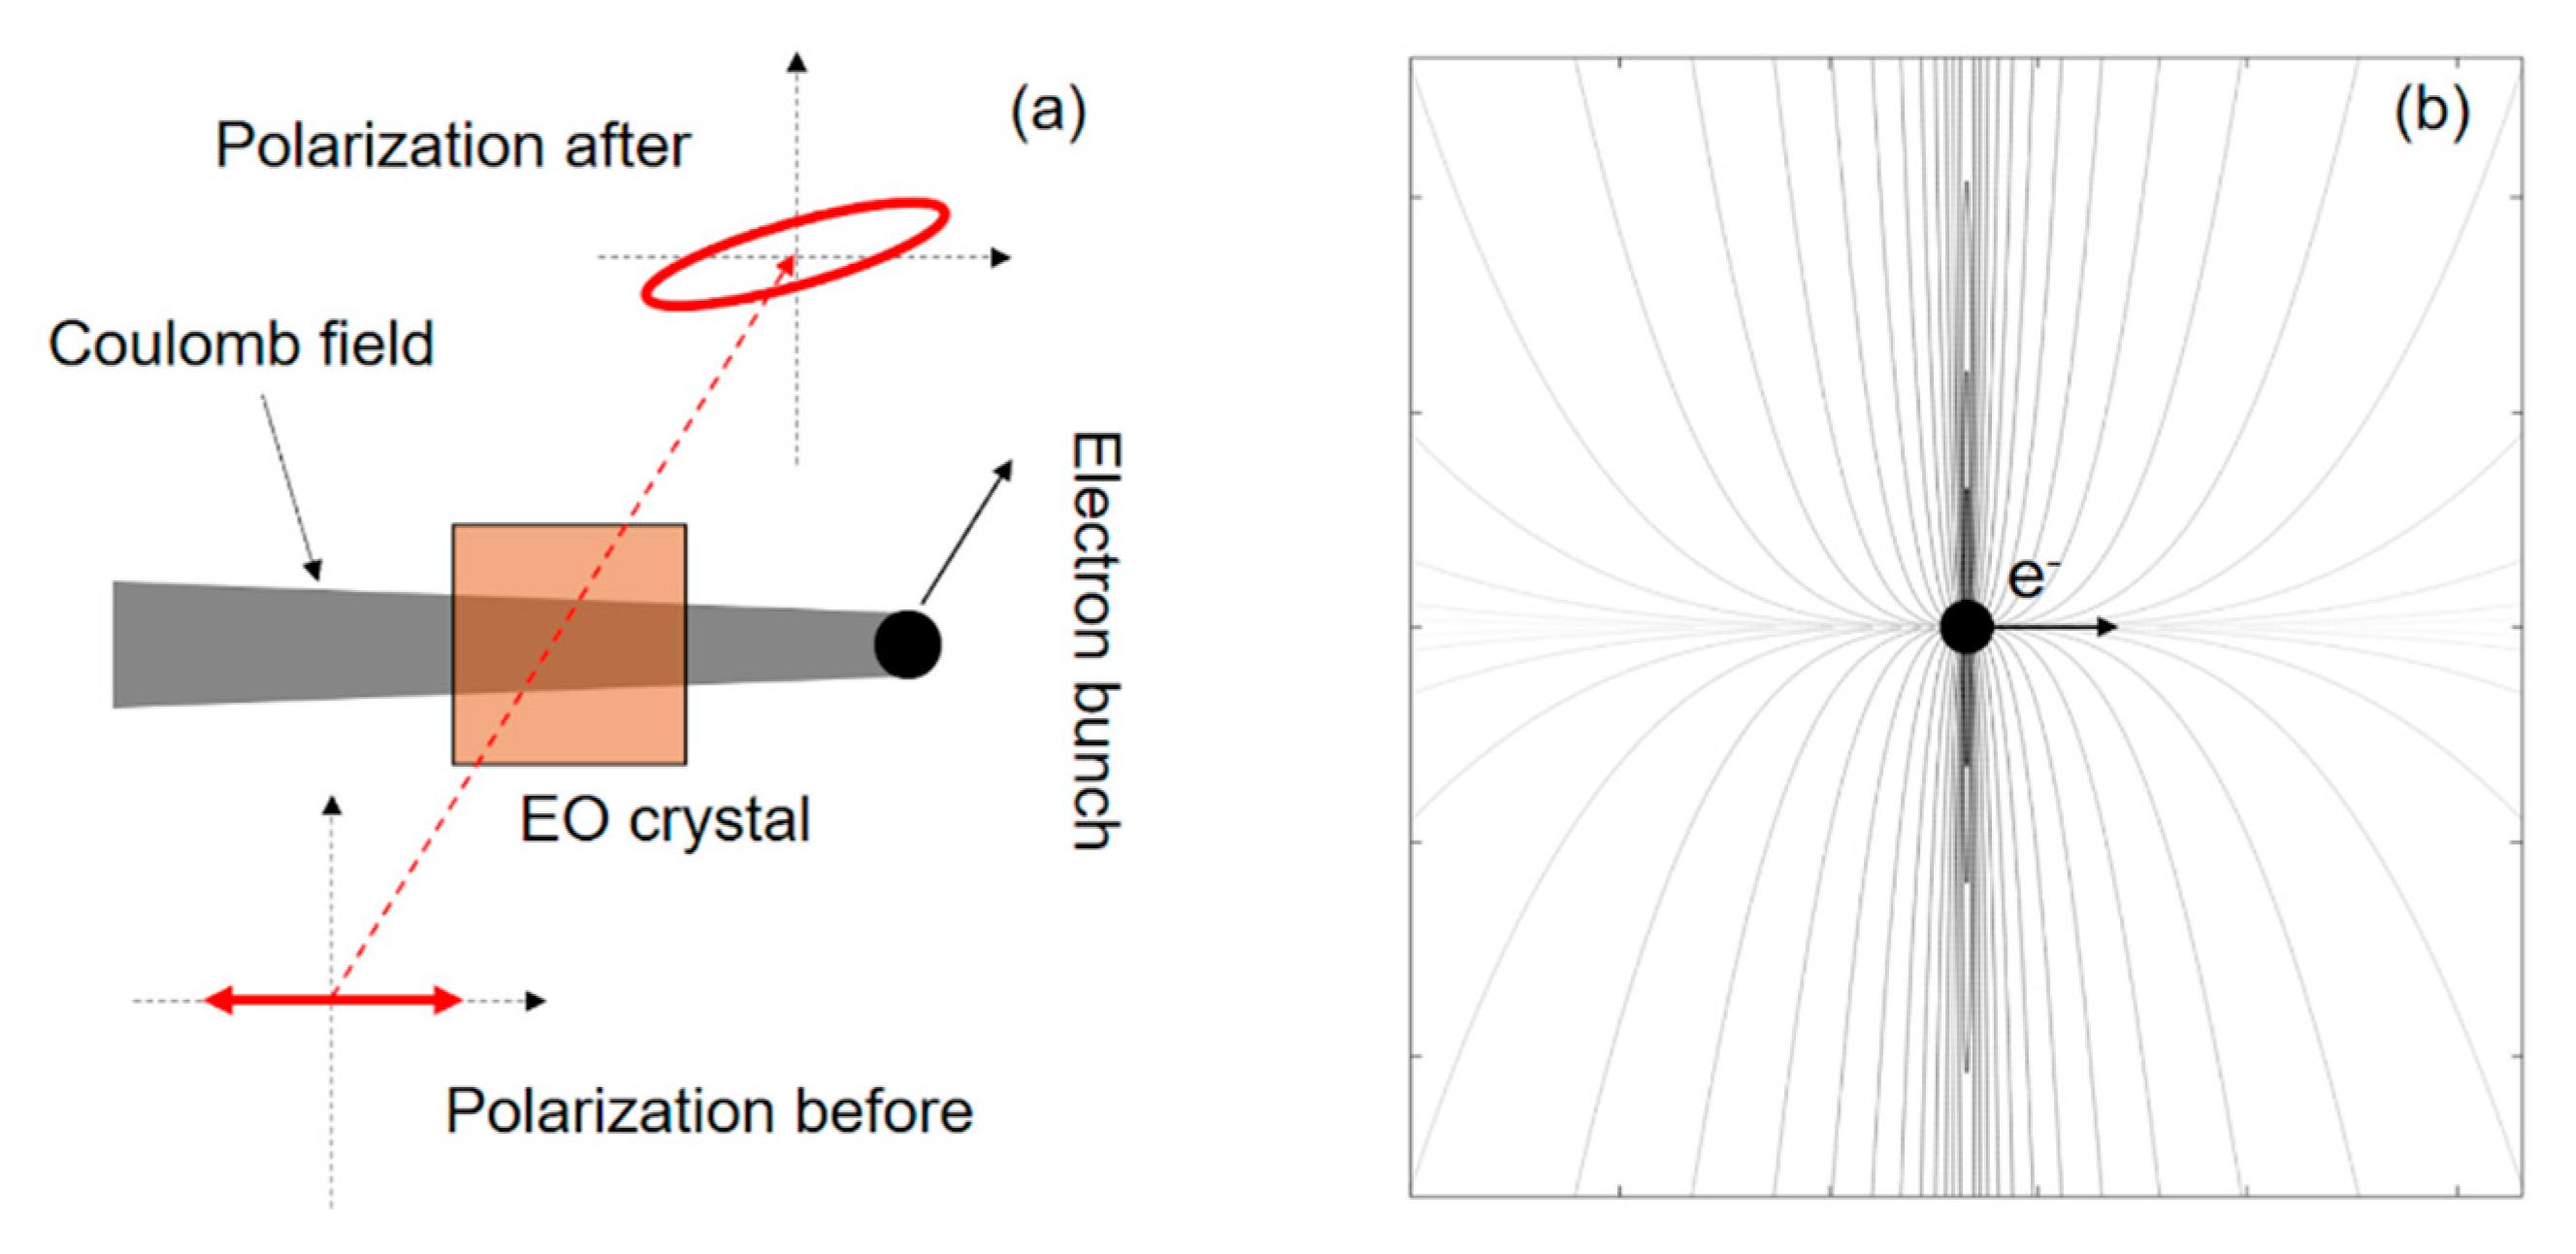
3.1. EO Spatial Decoding Scheme in LWFA

When applying the EO spatial decoding method to LWFA, one should keep in mind that there is always a high power driver laser. The transmission light may cause damage to the EO crystal if the setting is at an improper position. In the beginning, to avoid damage, we put the crystal 1.5 m downstream from the target. Due to the unstable pointing, divergence, and existing energy spread of the electron beam, the signal was not observed. Then, we put the crystal in a place very close to the target and outside of the emission cone of the driver laser, as shown in Figure 2a. In this case, we succeeded in observing the EO signal.
Field information cannot propagate with a speed larger than c . When the electron is emitted from a plasma, due to the shielding effect, the Coulomb field will have a spherical front. A numerical calculation of Coulomb field lines is illustrated in the inset of Figure 2a. With such a shape, Formula (1) is no longer applicable. For this special case, we derived a nonlinear temporal mapping formula [23]: c Δ τ = Δ ξ tan θ p + L cos θ s L cos θ s 1 2 sin θ s cos θ s     cos θ p Δ ξ L + cos 2 θ s cos 2 θ p   Δ ξ 2 L 2     , where L is the longitudinal distance downstream from the target and θ s is the incident angle of the signal field on the crystal surface around the detection point.
In a case where the timing scale of the investigated problem is much smaller than L / c , the Coulomb field can be considered as a plane wave obliquely incident on the crystal, as shown in Figure 2b. The nonlinear temporal mapping relationship can be simplified [23] to:
c Δ τ = ( 1 + sin θ s sin θ p ) tan θ p Δ ξ

3.2. Multibunch Observation via the EO Spatial Decoding

When a laser with moderate intensity is incident to a plasma, the linear plasma wave is formed in the wake of the laser and extends a distance of hundreds of micrometers. Here, moderate intensity means the laser normalized vector potential a 0 1 , where a 0 2 8.6 × 10 10 [ λ 0 ( μ m ) ] 1 / 2 I ( W / c m 2 ) . For an uncontrolled condition such as self-injection [24], the electrons can be trapped by the plasma wave in multiple buckets. Such a phenomenon is quite frequently observed in simulations. However, the real-time experimental observation is not easy.
Our first experiment applying EO spatial decoding technique in LWFA was performed by using a 4 TW laser. The 40 fs laser was focused by an F/20 off-axis parabola to a peak intensity of 7 × 10¹⁷ W/cm2, corresponding to a normalized vector potential of a 0 0.57 . A conical gas nozzle with an orifice diameter of 3 mm was used for relativistic electron beam generation. During the experiment, helium (He) and nitrogen (N2) gases were used. Since the laser had a moderate intensity, for the self-injection case when using He, electron beams were not observed with plasma densities less than 2.2 × 1019 cm−3. For the EO spatial decoding, we placed a GaP crystal 2.2 mm downstream from the exit of the gas jet. The detection point had a transverse distance of 1.5 mm aside from the electron beam path. The inner edge of the crystal was 1 mm away from the laser axis to avoid damage.
With the EO spatial decoding technique, we easily observed the multibunch structures. A double bunch structure was observed in correspondence with the electron energy spectrum in a single shot. As shown in Figure 3, the electron had two peaks in the energy spectrum. Correspondingly, there were two timing peaks with a gap of 270 fs, which suggested there were at least two bunches injected in different buckets of the wake wave. The data shown in Figure 3 were achieved at a plasma density of 3.1 × 1019 cm−3 when using He gas. The timing scale was calculated with Formula (2). The relative zero timing was determined by using nitrogen gas when electron beams were generated via the ionization-injection regime [25]. This result demonstrated the capability of the EO spatial decoding technique as a real-time electron timing monitor for LWFA.

3.3. Timing Resolution of an EO Sampling

The signal generation process is related with the co-propagation of the probe laser and the THz field inside the EO crystal. Field distortions always exist because of the absorption and dispersion. Since the Coulomb field has an opening angle of 1 / γ , the resolution is also related to the electron energy. The signal generation calculation is separated in two steps. First, the Coulomb field shape is calculated at the detection point. Second, the THz field propagation is calculated together with the probe laser inside the crystal. The Coulomb field at a distance r aside from the electron path can be estimated by a convolution E T H z = ( E r Q ) ( γ , r , t ) [21], where E r ( t ) = e 4 π ε 0 γ r ( r 2 + γ 2 v 2 t 2 ) 3 / 2 is the field temporal profile from a single electron and Q ( t ) is the electron bunch charge distribution. For simplicity, we use Gaussian charge profiles in this paper. The phase retardation is calculated by integration:
Γ = n 0 3 λ 0 A ( ω ) E T H z ( ω ) r 41 ( ω ) e i ω t × 0 d exp [ i ( n ( ω ) c 1 v g ) ω z ] · exp [ κ ( ω ) c ω z ] d z d ω
In Formula (3), there are several frequency domain variables: N ( ω ) = n ( ω ) + i κ ( ω ) is the complex refractive index of the EO crystal in THz range; r 41 ( ω ) is the electro-optic coefficient; A ( ω ) is the attenuation factor; d is the crystal thickness; and n 0 and λ 0 are the refractive index and wavelength of the probe laser. In a spatial decoding process, the probe laser has a relative angle with the THz field inside the crystal; thus, the smearing issue should be considered [26]. Although such a smearing or walk-off issue does not affect the resolution of the electron emission timing monitoring, we realized that to achieve a better resolution for bunch duration measurement, the probe laser should propagate in the same direction with the Coulomb field. In the following discussion, we simply consider a general colinear propagation case with an infinitely short probe laser for explaining: (1) the physical resolution limit causes by the dispersion of the crystal and phase mismatch between probe laser and THz field, and how to challenge the temporal resolution at fs level; (2) how the parameters of electron bunch itself would affect a timing measurement; and (3) how longitudinal expansion of an electron bunch responds more for the signal weakening than the transverse expansion.

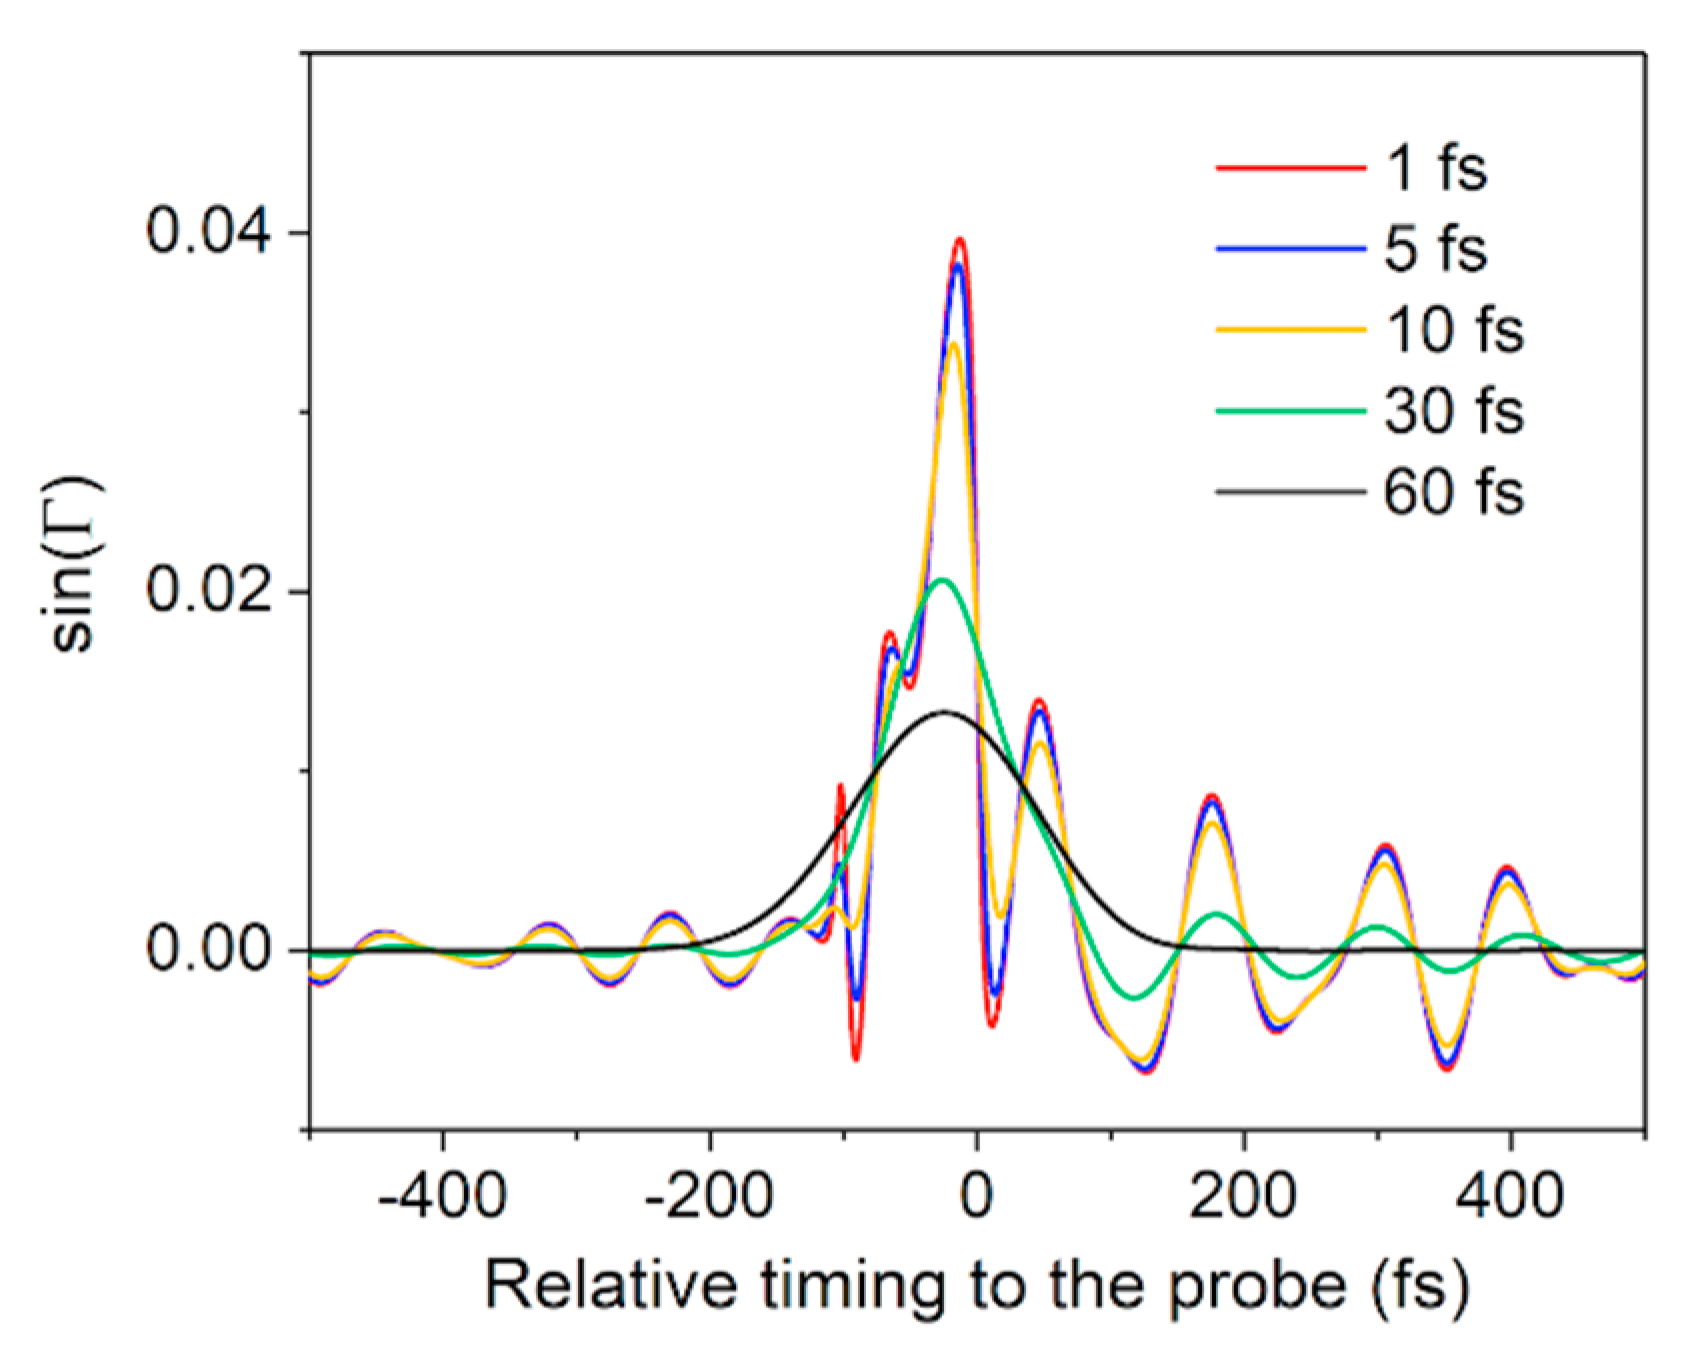
3.3.1. EO Signal Distortion after Propagation through the EO Crystal

To improve the resolution of a bunch duration measurement, the geometry must be chosen for minimized smearing of the signal. Also, a balanced detection is recommended because the signal itself is almost proportional to the Coulomb field strength. Here, we calculate a 20 pC, 500 MeV electron bunch with pulse durations of 1, 5, 10, 30, and 60 fs. In a balanced detection where the difference between electric field components with orthogonal polarizations are measured [27], the signal strength is proportional to sin ( Γ ) . Originally, the bunch profiles are set to be Gaussian. The calculated results are plotted in Figure 4. Due to the special complex values of N ( ω ) , A ( ω ) , and r 41 ( ω ) of the EO crystal, the signals are distorted compared with the original Gaussian distribution. For electron bunches with duration larger than 60 fs, the detected signal almost maintains the original shape. For the durations <10 fs, the signal is severely distorted and the original pulse duration is not directly achievable. Such oscillations in the picture resulted from the high frequency part of the field, with frequencies over the lowest transverse optical (TO) lattice oscillation frequency (5.3 THz for ZnTe and 11 THz for GaP) [21]. The oscillation patterns shown in Figure 4 vary for different original bunch durations. By precisely measuring the oscillations in the EO signal and the high frequency properties of the crystal, it possible to retrieve the original bunch profile. Measuring the electron bunch duration at 10 fs level via EO sampling is quite challenging but of great significance. In the future, new types of crystals with wider frequency response and minimum phase mismatch will be investigated.

3.3.2. Factors Determining the Timing Resolution in a Cross-Polarizer Set-Up in LWFA

For the time monitoring of the electron bunch, a cross-polarizer set-up is often used. Such a set-up is simple and has high signal–noise ratio. In this case, the signal intensity is proportional to sin 2 ( Γ / 2 ) . Although some information of the original bunch shape is lost, it does not affect the time monitoring, which only checks the peaks of the signals. For the aspect of experimental set-up, the resolution of the timing measurement is limited by the jitter between the driver laser and probe laser and the EO signal imaging system. For the aspect of the electron parameter, we found that when changing the electron bunch energy or original bunch duration, the EO signal timing shifted. A calculation is performed assuming a 50 μm GaP crystal. The detection point has a transverse distance of 1.5 mm to the electron beam path. Electron bunches with energies of 1 GeV, 100 MeV, and 1 MeV, and original bunch duration from 1 fs to 500 fs are calculated, as shown in Figure 5a. The peak timing of the signal fluctuates. The reason for the fluctuation is the variation of the incident THz field. When the duration of the THz field changes, the frequency domain distribution E T H z ( ω ) is different. Since the refractive index N ( ω ) changes drastically with different frequencies, the average phase velocity of the THz pulse inside the crystal differs with different incident field durations. While E T H z = ( E r Q ) ( γ , r , t ) , both the original duration and energy of the electron bunch play important roles.
Let us discuss the limit of the timing detection in this scheme. The traces in Figure 5a indicate that to have a small fluctuation in the timing measurement, either lower energy or longer bunch duration is necessary. A differentiation of the relative timing with respect to the electron bunch duration is illustrated in Figure 5b. In an LWFA experiment, the electron bunch duration might fluctuate from several fs to few tens of fs. For the 10 MeV level electron bunch, signal fluctuation is not a big issue. However, if the electron energy fluctuates in a wide range from MeV to GeV, to achieve femtosecond accuracy on the timing measurement, an electron bunch with duration of ~30 fs is recommended (the differentiation of the relative timing with respect to the electron duration in Figure 5b is near zero). Judging from Figure 5a, in a wide range of electron bunch durations, the largest timing difference varies from 16.7 to 1.1 fs when the electron energy changes from 1 GeV to 10 MeV. If the research issue does not have requirements at femtosecond level, the discussion in this subsection is not a big matter.

3.3.3. Effect of Electron Divergence and Elongation on the Observed Signal Intensity

At a meter downstream from the target, we have not observed the EO signal in the experiment. The electron beam divergence and energy spread resulted in a large beam diameter and long pulse duration at a distance of a meter. Here, we discuss which one is the main factor. The profiles of the Coulomb field at the detection point are calculated, as shown in Figure 6. The charge profile is assumed to have a two-dimensional distribution: q ( r , t ) exp ( r 2 σ t 2 ) · exp ( t 2 σ r 2 ) . For the transverse spatial occupation, the electrons are counted within a radius of σ r . Two set of calculations were performed with fixed bunch duration and fixed transverse size. The electron bunches have energy of 100 MeV and charge of 20 pC. For a polarizer pair with an extinction ratio of 1.25 × 10⁻⁵ and GaP crystal thickness of 50 μm, a Coulomb field strength of 10 6   V/m is necessary to generate observable signals. In Figure 6a, we find that by changing the electron beam transverse size for two orders of magnitudes, the electric field strength at the detection point changed very little. The reason is simple—even for a larger size, part of the electrons become farther from the detection point, but the rest of them become closer. The difference in the propagation distances of different transverse parts of the beam is at the level of a few μm for an electron beam with divergence of a few mrad. Thus, the overall increase of bunch duration can be ignored. In Figure 6b, we find that the electric field strength changes drastically with different electron bunch duration. For an elongated bunch duration of 500 fs, the field peak strength is below 5 × 10⁵ V/m. For such a weak field, the signal is difficult to observe when using a 50 μm GaP crystal. This calculation indicates that, to detect signals in LWFA, the bunch elongation should be avoided at the measurement point. The elongation is caused by a large relative energy spread because of the dispersion in a drift space and the space-charge effect of an electron bunch. This requires that the energy spread of the beam should be minimized and the electron energy should be sufficiently high.
The test of this EO method with GeV-class beams using high-peak power laser J-KAREN-P is underway at KPSI, QST. By using a high power laser, such as J-KAREN-P, with a controlled injection method [28], it is possible to generate a high energy electron beam with a small energy spread. With such electron bunches, we expect to achieve an EO signal even at a distance far from the source.

4. Concluding Remarks and Future Prospects

EO sampling will hopefully become a powerful tool for real-time nondestructive monitoring on the electron temporal profile in LWFA. The electron arrival timing and temporal multibunch structure can be easily observed simultaneously with the electron charge and energy spectra. When using this method, the factors that limit the timing resolution should be kept in mind. An enhanced resolution can be achieved by properly choosing the set-up geometry, electron energy range, crystal species, crystal thickness, etc. For the future, new materials with wider frequency response and small phase mismatch should be investigated for the optimization of the temporal resolution to 10 fs level. This study could be helpful for the realizing a real-time electron temporal monitor in LWFA and related pump-probe applications.

Author Contributions

K.H. conducted the numerical calculations; K.H., H.K., M.M., Y.H., N.N., and M.K. performed the experiment; M.K. conceived the research. All authors have read and agreed to the published version of the manuscript.

Funding

This work was funded by the ImPACT Program of the Council for Science, Technology and Innovation (Cabinet Office, Government of Japan) and the JST-Mirai Program Grant No. JPMJMI17A1, Japan.

Acknowledgments

We acknowledge T. Z. Esirkepov, J. K. Koga, and A. S. Pirozhikov for fruitful discussions and encouragements from T. Hosokai, Y. Sano, and N. Kumagai.

Conflicts of Interest

The authors declare no conflict of interest.

References

  1. Strickland, D.; Mourou, G. Compression of amplified chirped optical pulses. Opt. Commun. 1985, 56, 219–221. [Google Scholar] [CrossRef]
  2. Danson, C.; Hillier, D.; Hopps, N.; Neely, D. Petawatt class lasers worldwide. High Power Laser Sci. Eng. 2015, 3. [Google Scholar] [CrossRef]
  3. Pirozhkov, A.S.; Fukuda, Y.; Nishiuchi, M.; Kiriyama, H.; Sagisaka, A.; Ogura, K.; Mori, M.; Kishimoto, M.; Sakaki, H.; Nicholas, P.D.; et al. Approaching the diffraction-limited, bandwidth-limited Petawatt. Opt. Express 2017, 25, 20486–20501. [Google Scholar] [CrossRef] [PubMed]
  4. Kiriyama, H.; Alexander, S.P.; Nishiuchi, M.; Fukuda, Y.; Ogura, K.; Sagisaka, A.; Miyasaka, Y.; Sakaki, H.; Nicholas, P.D.; Kondo, K.; et al. Status and progress of the J-KAREN-P high intensity laser system at QST. High Energy Density Phys. 2020. [Google Scholar] [CrossRef]
  5. Dover, N.P.; Nishiuchi, M.; Sakaki, H.; Kondo, K.; Alkhimova, M.A.; Faenov, A.Y.; Hata, M.; Iwata, N.; Kiriyama, H.; Koga, J.K.; et al. Effect of Small Focus on Electron Heating and Proton Acceleration in Ultrarelativistic Laser-Solid Interactions. Phys. Rev. Lett. 2020, 124. [Google Scholar] [CrossRef] [PubMed] [Green Version]
  6. Pirozhkov, A.S.; Esirkepov, T.Z.; Pikuz, T.A.; Faenov, A.Y.; Ogura, K.; Hayashi, Y.; Kotaki, H.; Ragozin, E.N.; Neely, D.; Kiriyama, H.; et al. Burst intensification by singularity emitting radiation in multi-stream flows. Sci. Rep. 2017, 7, 1–10. [Google Scholar] [CrossRef]
  7. Tajima, T.; Dawson, J.M. Laser electron accelerator. Phys. Rev. Lett. 1979, 43, 267–271. [Google Scholar] [CrossRef] [Green Version]
  8. Gonsalves, A.J.; Nakamura, K.; Daniels, J.; Benedetti, C.; Pieronek, C.; Raadt, T.C.H.; Steinke, S.; Bin, J.H.; Bulanov, S.S.; Tilborg, J.V.; et al. Petawatt laser guiding and electron beam acceleration to 8 GeV in a laser-heated capillary discharge waveguide. Phys. Rev. Lett. 2019, 122. [Google Scholar] [CrossRef] [Green Version]
  9. Wang, W.T.; Li, W.T.; Liu, J.S.; Zhang, Z.J.; Qi, R.; Yu, C.H.; Liu, J.Q.; Fang, M.; Qin, Z.Y.; Wang, C.; et al. High-brightness high-energy electron beams from a laser wakefield accelerator via energy chirp control. Phys. Rev. Lett. 2016, 117. [Google Scholar] [CrossRef]
  10. Lundh, O.; Lim, J.; Rechatin, C.; Ammoura, L.; Ben-Ismaïl, A.; Davoine, X.; Gallot, G.; Goddet, J.-P.; Lefebvre, E.; Malka, V.; et al. Few femtosecond, few kiloampere electron bunch produced by a laser-plasma accelerator. Nat. Phys. 2011, 7, 219–222. [Google Scholar] [CrossRef] [Green Version]
  11. Couperus, J.P.; Pausch, R.; Köhler, A.; Zarini, O.; Krämer, J.M.; Garten, M.; Huebl, A.; Gebhardt, R.; Helbig, U.; Bock, S.; et al. Demonstration of a beam loaded nanocoulomb-class laser wakefield accelerator. Nat. Commun. 2017, 8, 1–7. [Google Scholar] [CrossRef] [PubMed] [Green Version]
  12. Leemans, W.; Esarey, E. Laser-driven plasma-wave electron accelerators. Phys. Today 2009, 62, 44–49. [Google Scholar] [CrossRef] [Green Version]
  13. Nakajima, K. Compact X-ray sources: Towards a table-top free-electron laser. Nat. Phys. 2008, 4, 92–93. [Google Scholar] [CrossRef]
  14. Van Tilborg, J.; Schroeder, C.B.; Filip, C.V.; Tóth, C.; Geddes, C.G.R.; Fubiani, G.; Huber, R.; Kaindl, R.A.; Esarey, E.; Leemans, W.P. Temporal characterization of femtosecond laser-plasma-accelerated electron bunches using terahertz radiation. Phys. Rev. Lett. 2006, 96. [Google Scholar] [CrossRef] [PubMed]
  15. Debus, A.D.; Bussmann, M.; Schramm, U.; Sauerbrey, R.; Murphy, C.D.; Major, Z.; Rlein, R.H.; Veisz, L.; Schmid, K.; Schreiber, J. Electron bunch length measurements from laser-accelerated electrons using single-shot THz time-domain interferometry. Phys. Rev. Lett. 2010, 104. [Google Scholar] [CrossRef] [PubMed] [Green Version]
  16. Shan, J.; Weling, A.S.; Knoesel, E.; Bartels, L.; Bonn, M.; Nahata, A.; Reider, G.A.; Heinz, T.F. Single-shot measurement of terahertz electromagnetic pulses by use of electro-optic sampling. Opt. Lett. 2000, 25, 426–428. [Google Scholar] [CrossRef]
  17. Yan, X.; MacLeod, A.M.; Gillespie, W.A.; Knippels, G.M.H.; Oepts, D.; Meer, A.F.G.; Seidel, W. Subpicosecond electro-optic measurement of relativistic electron pulses. Phys. Rev. Lett. 2000, 85, 3404–3406. [Google Scholar] [CrossRef]
  18. Wilke, I.; MacLeod, A.M.; Gillespie, W.A.; Berden, G.; Knippels, G.M.H.; Meer, A.F.G. Single-shot electron-beam bunch length measurements. Phys. Rev. Lett. 2002, 88. [Google Scholar] [CrossRef] [Green Version]
  19. Berden, G.; Jamison, S.P.; MacLeod, A.M.; Gillespie, W.A.; Redlich, B.; Meer, A.F.G. Electro-optic technique with improved time resolution for real-time, nondestructive, single-shot measurements of femtosecond electron bunch profiles. Phys. Rev. Lett. 2004, 93, 114802. [Google Scholar] [CrossRef] [Green Version]
  20. Steffen, B.; Arsov, V.; Berden, G.; Gillespie, W.A.; Jamison, S.P.; MacLeod, A.M.; Meer, A.F.G.; Phillips, P.J.; Schlarb, H.; Schmidt, B.; et al. Electro-optic time profile monitors for femtosecond electron bunches at the soft X-ray free-electron laser FLASH. Phys. Rev. ST Accel. Beams 2009, 12. [Google Scholar] [CrossRef] [Green Version]
  21. Steffen, B.R. Electro-Optic Methods for Longitudinal Bunch Diagnostics at FLASH (No. DESY-THESIS-2007-020). Available online: https://bib-pubdb1.desy.de/record/84041/files/desy-thesis-07-020.pdf (accessed on 6 July 2020).
  22. Wang, W.; Du, Y.C.; Yan, L.X.; Chi, Z.J.; Zhang, Z.; Hua, J.F.; Huang, W.H.; Tang, C.X.; Li, M. Temporal profle monitor based on electro-optic spatial decoding for low-energy bunches. Phys. Rev. Accel. Beams 2017, 20. [Google Scholar] [CrossRef] [Green Version]
  23. Huang, K.; Esirkepov, T.; Koga, J.K.; Kotaki, H.; Mori, M.; Hayashi, Y.; Nakanii, N.; Bulanov, S.V.; Kando, M. Electro-optic spatial decoding on the spherical-wavefront Coulomb fields of plasma electron sources. Sci. Rep. 2018, 8, 1–10. [Google Scholar] [CrossRef] [PubMed] [Green Version]
  24. Esarey, E.; Schroeder, C.B.; Leemans, W.P. Physics of laser-driven plasma-based electron accelerators. Rev. Mod. Phys. 2009, 81. [Google Scholar] [CrossRef]
  25. Chen, M.; Schroeder, C.B.; Geddes, C.G.R.; Leemans, W.P. Theory of ionization-induced trapping in laser-plasma accelerators. Phys. Plasmas 2012, 19. [Google Scholar] [CrossRef]
  26. Huang, K.; Kotaki, H.; Mori, M.; Esirkepov, T.; Koga, J.K.; Hayashi, Y.; Nakanii, N.; Bulanov, S.V.; Kando, M. Variation in electron emission time in weakly nonlinear laser wakefield acceleration. Phys. Rev. Accel. Beams 2019, 22. [Google Scholar] [CrossRef] [Green Version]
  27. Wang, X.K.; Cui, Y.; Sun, W.F.; Ye, J.S.; Zhang, Y. Terahertz real-time imaging with balanced electro-optic detection. Opt. Commun. 2010, 283, 4626–4632. [Google Scholar] [CrossRef]
  28. Bulanov, S.; Naumova, N.; Pegoraro, F.; Sakai, J. Particle injection into the wave acceleration phase due to nonlinear wake wave breaking. Phys. Rev. E 1998, 58. [Google Scholar] [CrossRef] [Green Version]
Figure 1. The principle of electro-optic (EO) sampling. (a) A probe laser passes through an EO crystal. Due to the external Coulomb field of an electron bunch, the polarization changes from linear to elliptical. (b) For a free electron moving at a relativistic speed, the Coulomb field is compressed perpendicular to the electron propagation direction. The arrow in (b) indicates the electron propagation direction.
Crystals 10 00640 g001
Figure 2. EO spatial decoding set-up in LWFA. (a) A geometric schematic showing the relative position of the gas target, driver laser, electron bunch, EO crystal, and the Coulomb field with a spherical front. The inset in (a) is a numerical calculation of the Coulomb field lines when an electron passes through a plasma–vacuum boundary. (b) A simple sketch showing the oblique incidence of the Coulomb field on the crystal. The signal field front is denoted with a green line and the probe laser front is denoted as red line.
Crystals 10 00640 g002
Figure 3. Longitudinal multibunch structure observation by EO spatial decoding in the experiment. (a) Electron energy spectrum showing two peaks at 43 and 32 MeV. (b) The EO signal in the same shot. There are two timing peaks at +130 and +400 fs.
Crystals 10 00640 g003
Figure 4. Numerical calculation of the EO signals with balanced detection from a 50 μm GaP crystal. In the picture, the signal peaks shift from zero timing. It results from the difference of THz phase velocity and probe laser group velocity (phase mismatch). Distance between detection point to electron path is r 0 = 1.5   mm .
Crystals 10 00640 g004
Figure 5. Discussion of the relative timing fluctuation due to electron parameter fluctuation in LWFA. (a) Relative EO signal timing to the probe laser. Electron bunch with energy of 1 GeV, 100 MeV, 10 MeV, and bunch duration from 1 fs to 500 fs are calculated. (b) The differentiation of the peak timing trend in (a) for original bunch duration in the range of 1 to 100 fs. Distance between the detection point to the electron path is r 0 = 1.5   mm .
Crystals 10 00640 g005
Figure 6. Examples of Coulomb field strength of an electron bunch with different divergences and bunch durations. (a) Coulomb field of 30 fs electron bunches with different transverse sizes. (b) Coulomb field of 100 μm electron bunches with different bunch durations. The distance between the detection point to the center axis of the electron beam is r 0 = 3 mm in all cases.
Crystals 10 00640 g006

