Simulation of Porous Magnetite Deposits on Steam Generator Tubes in Circulating Water at 270 °C


Abstract
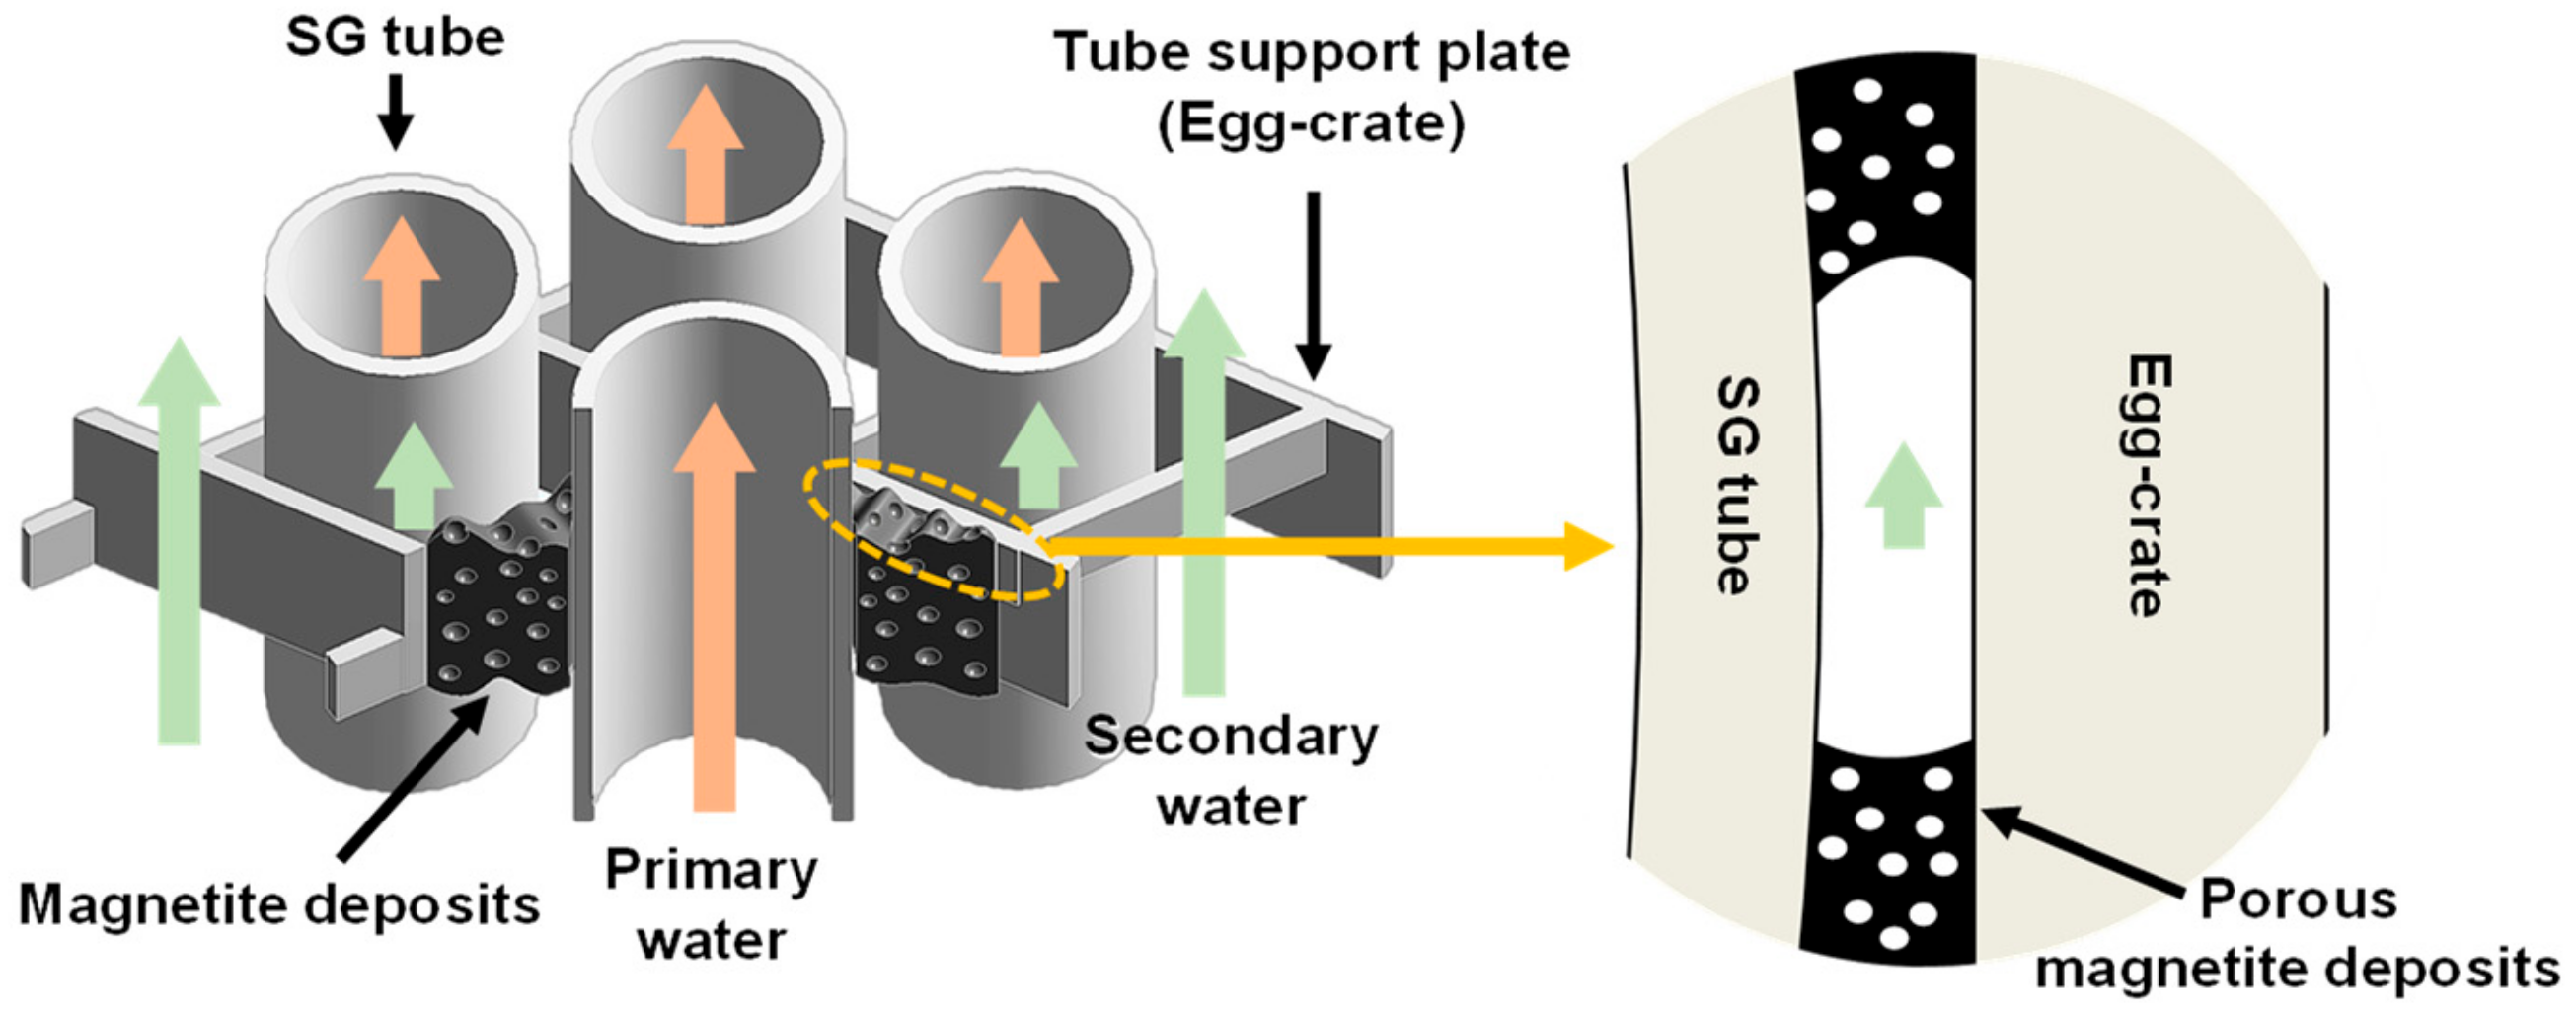
:1. Introduction
2. Materials and Methods
2.1. Specimen Preparation and Test Solution
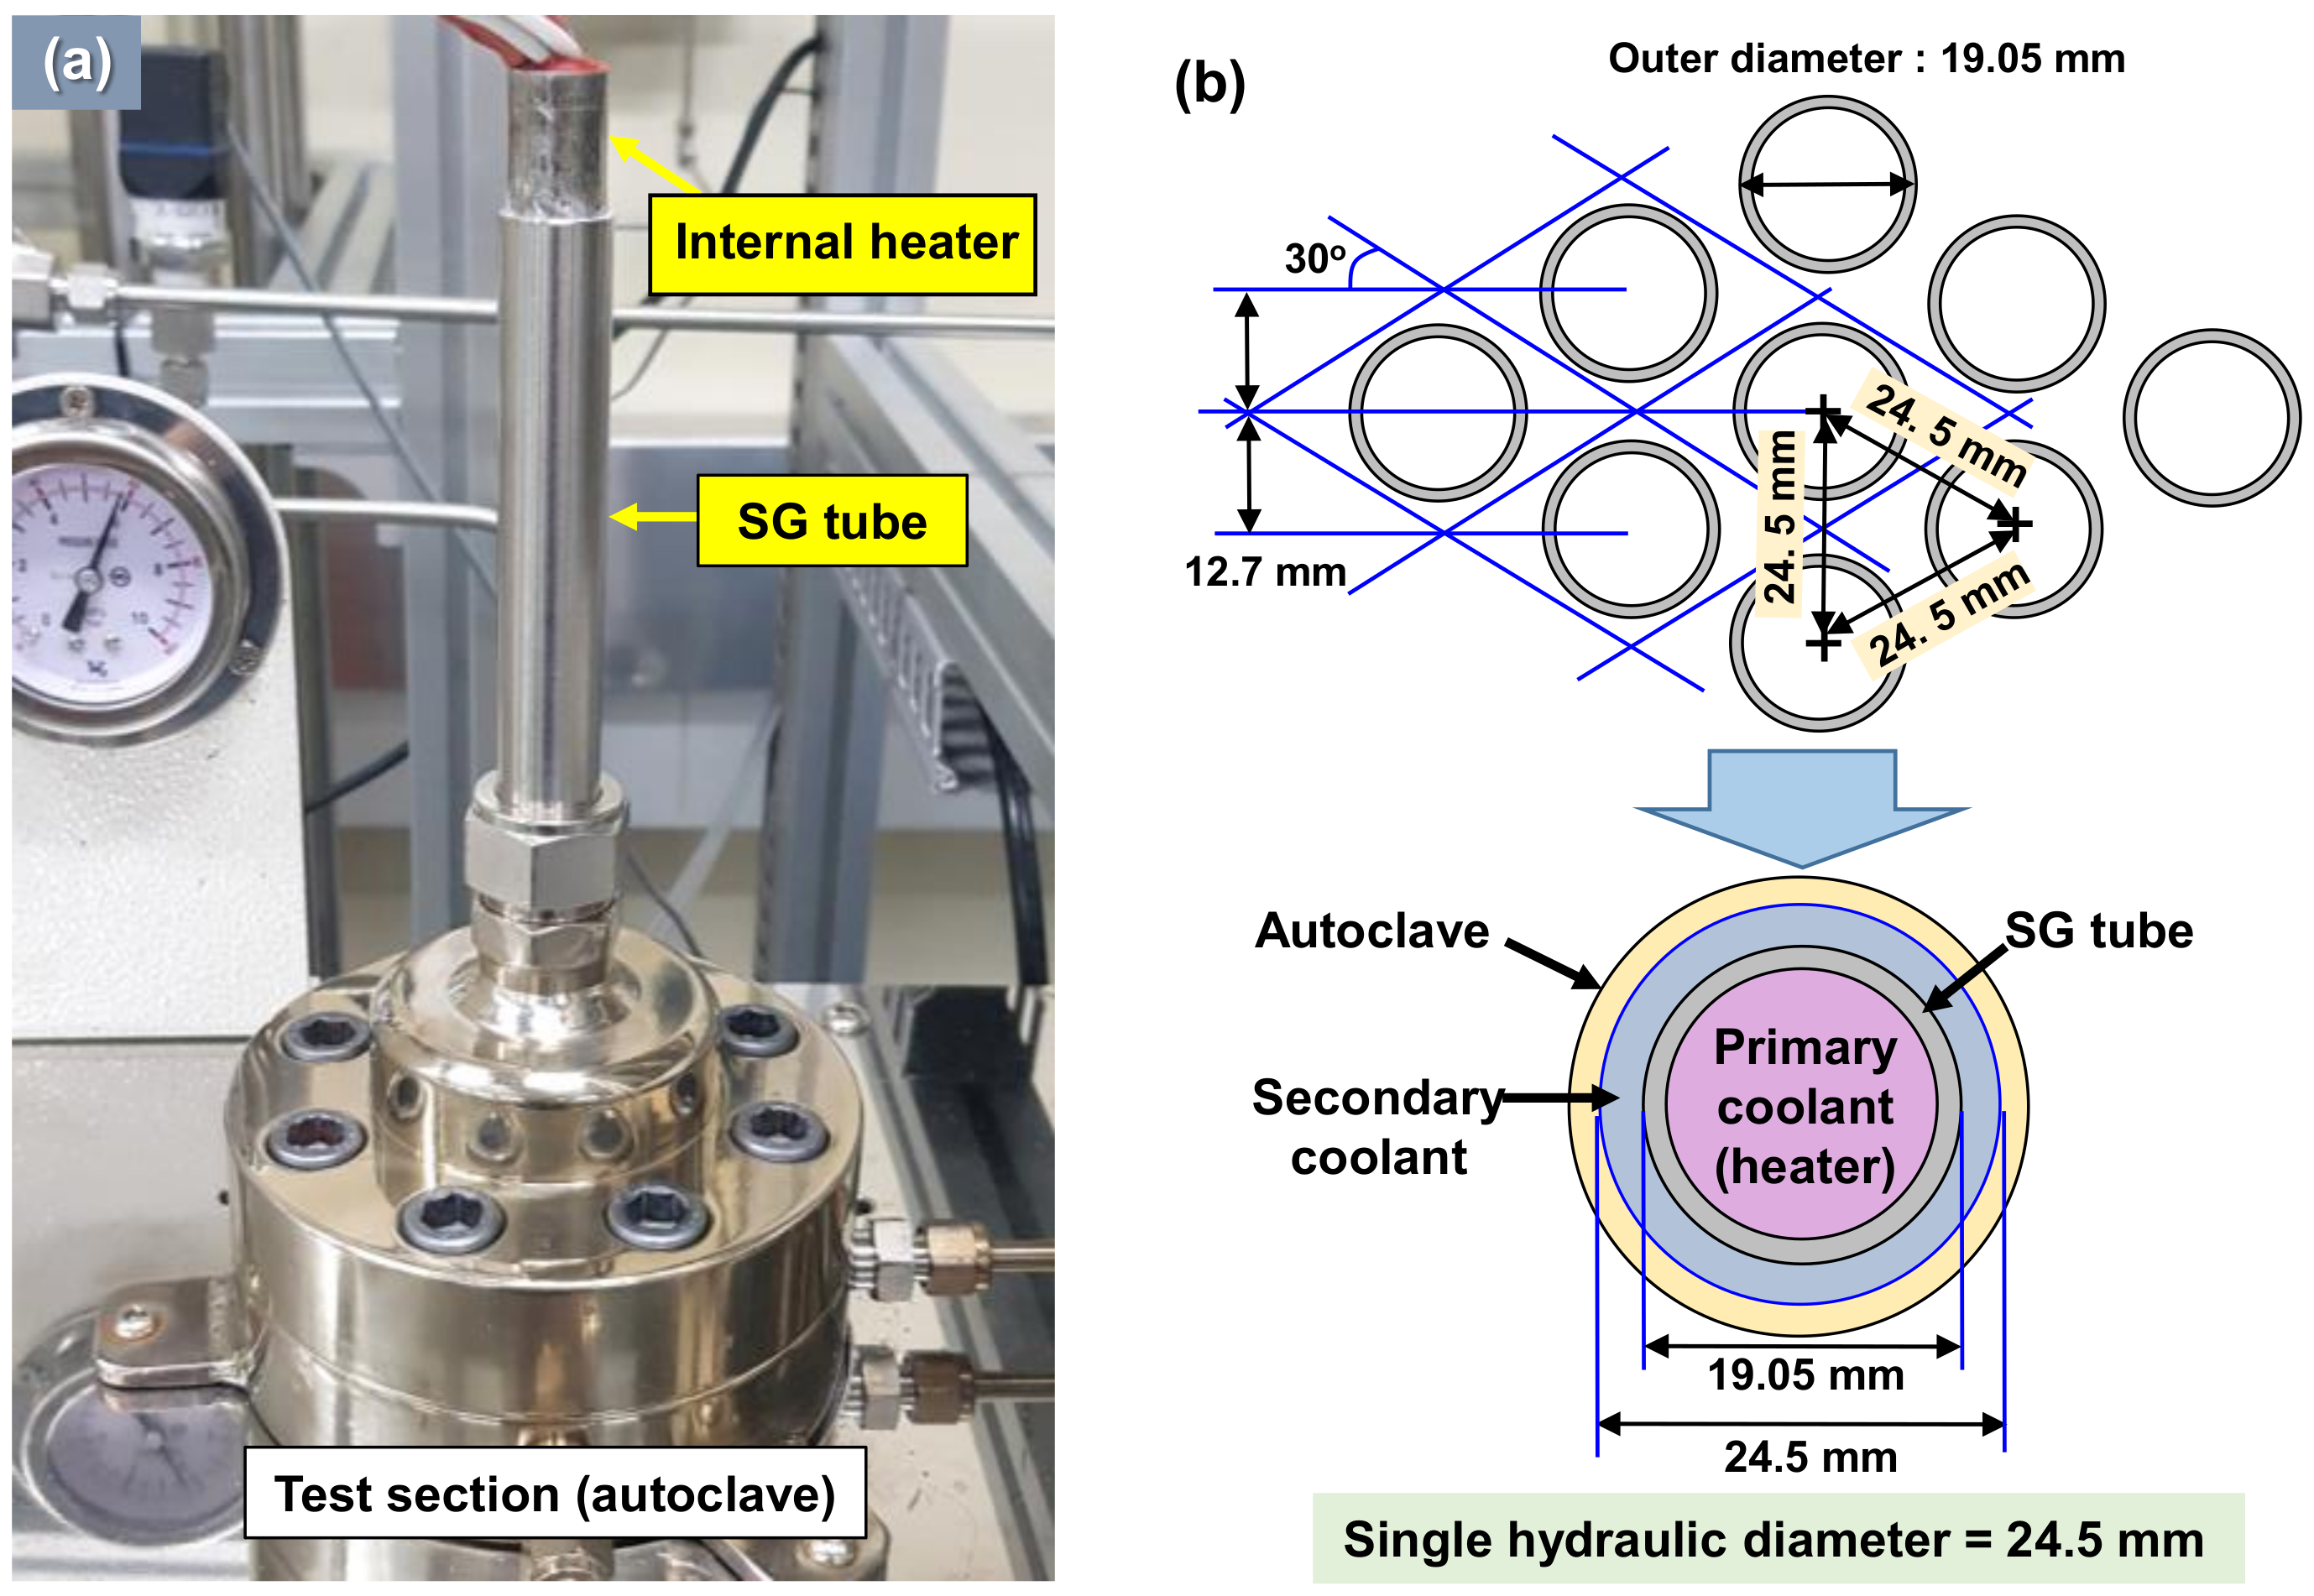
2.2. Deposition Loop System
3. Results and Discussion
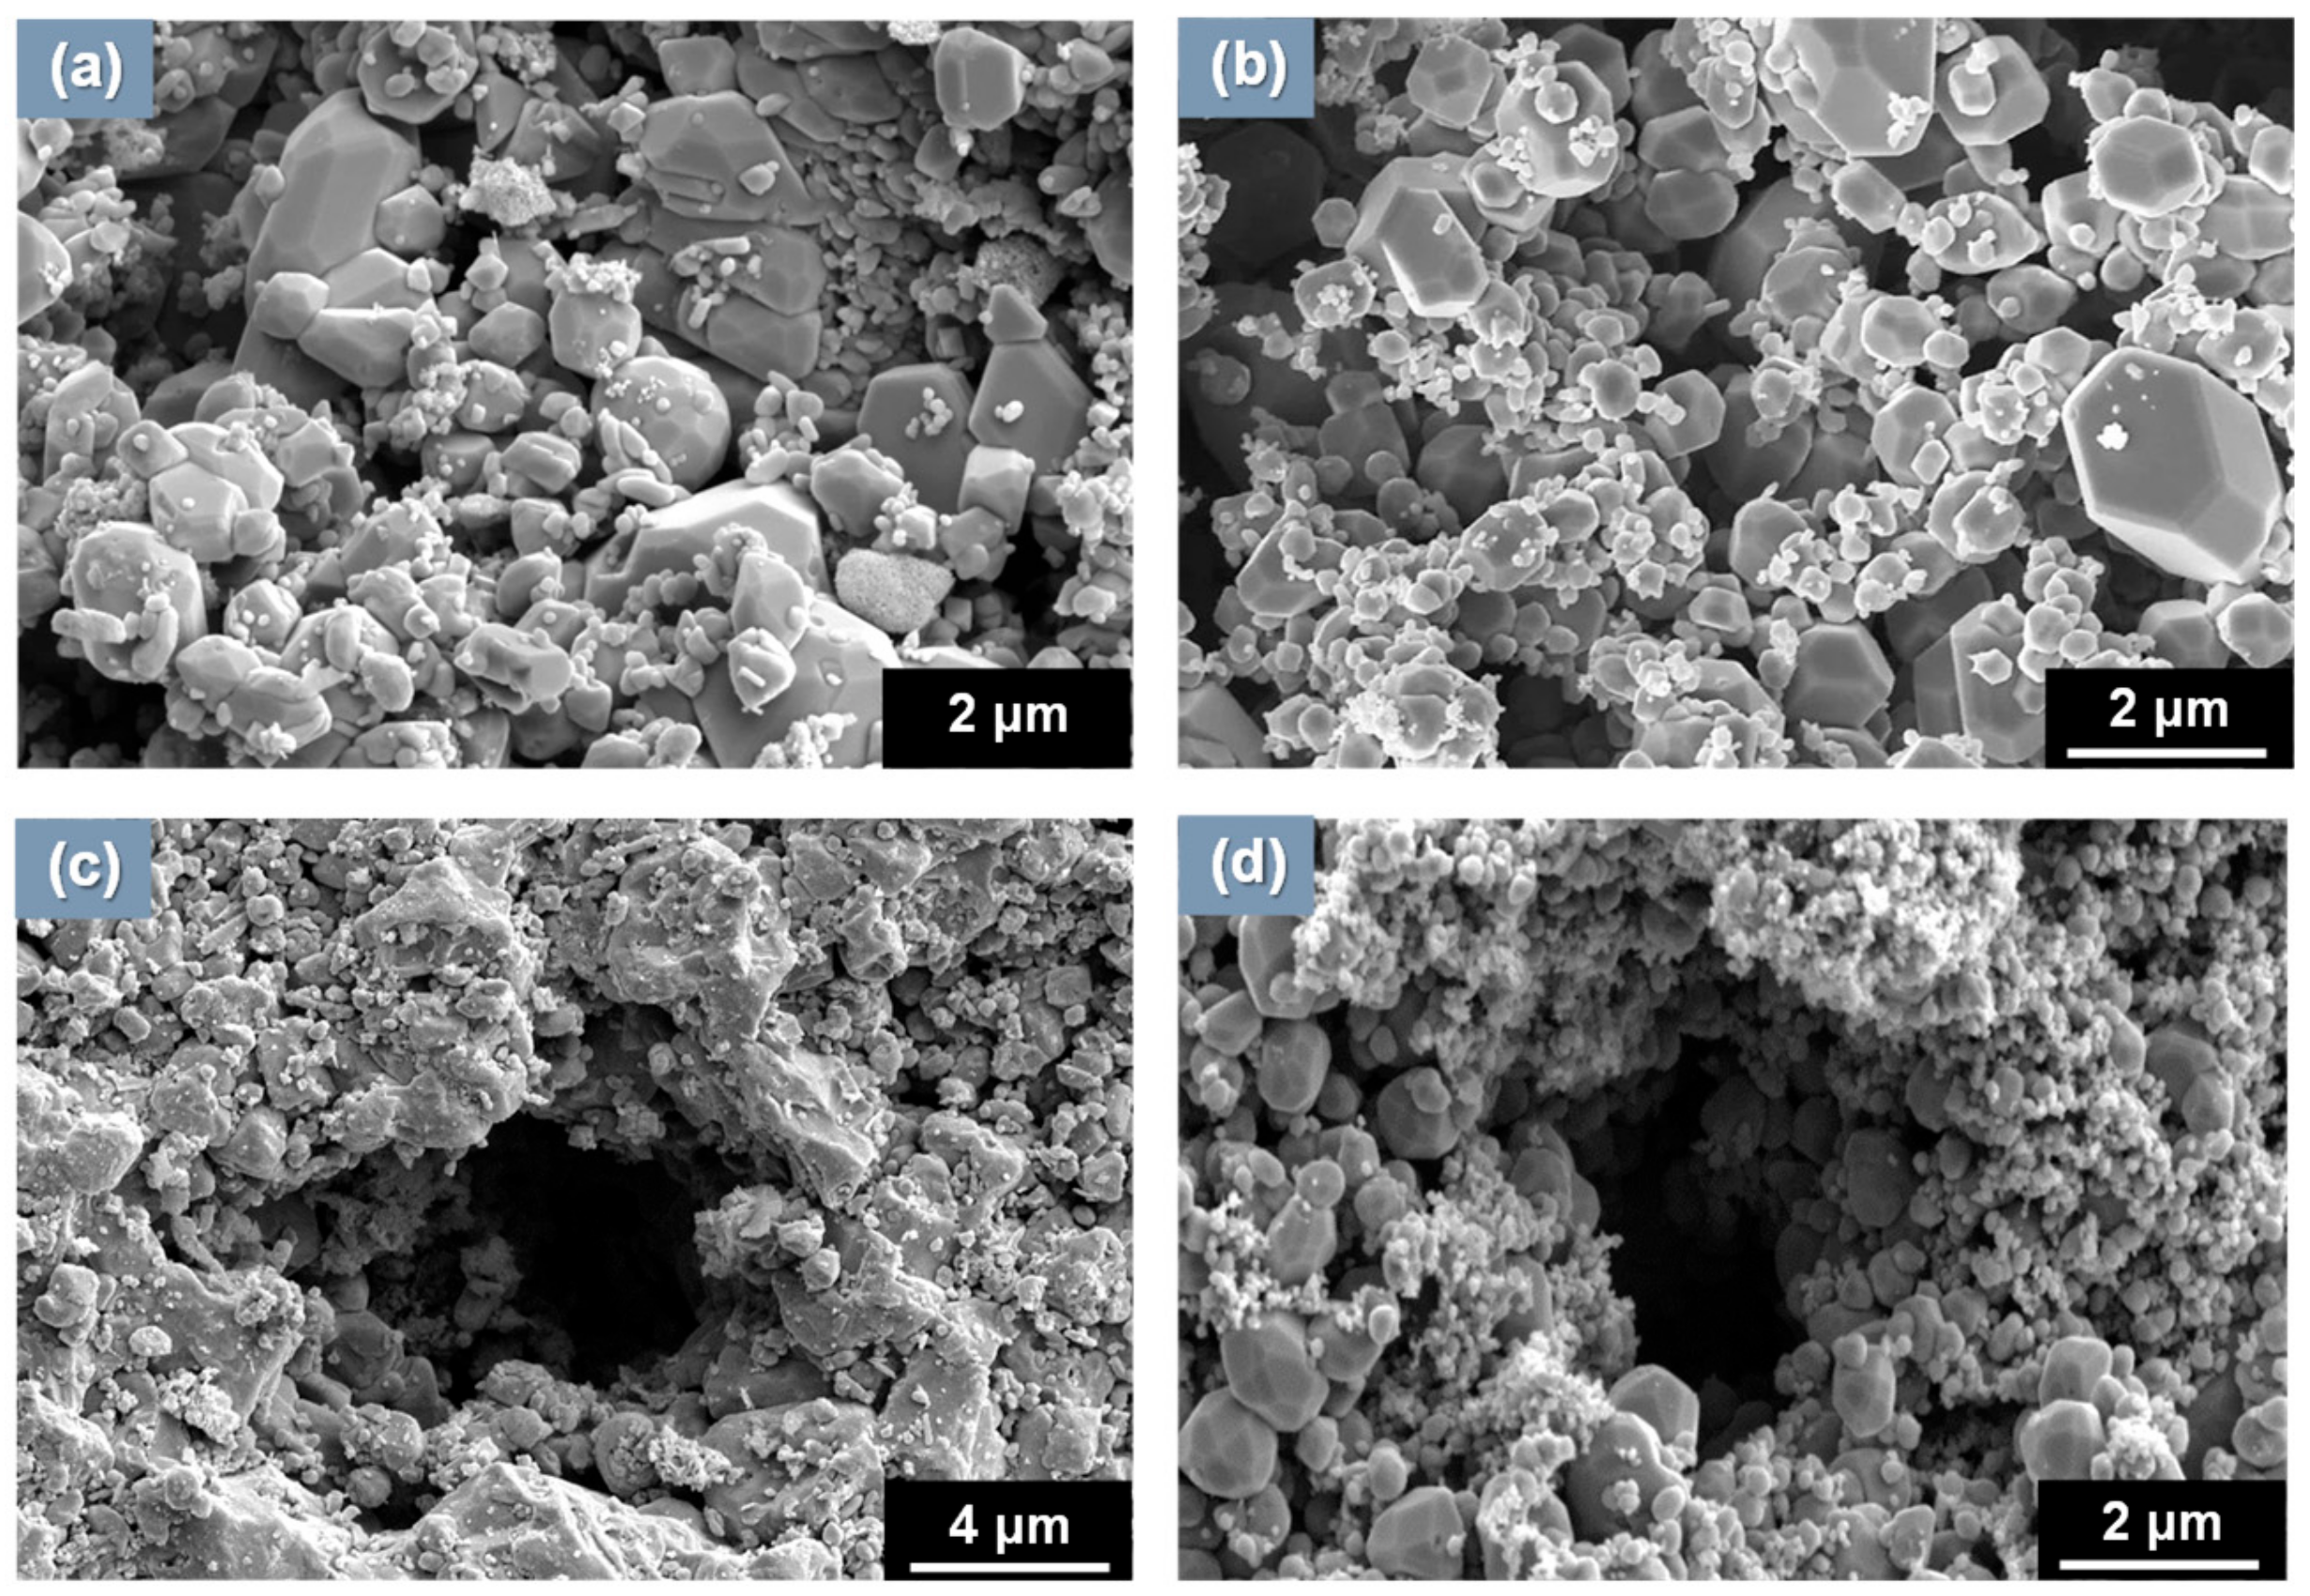
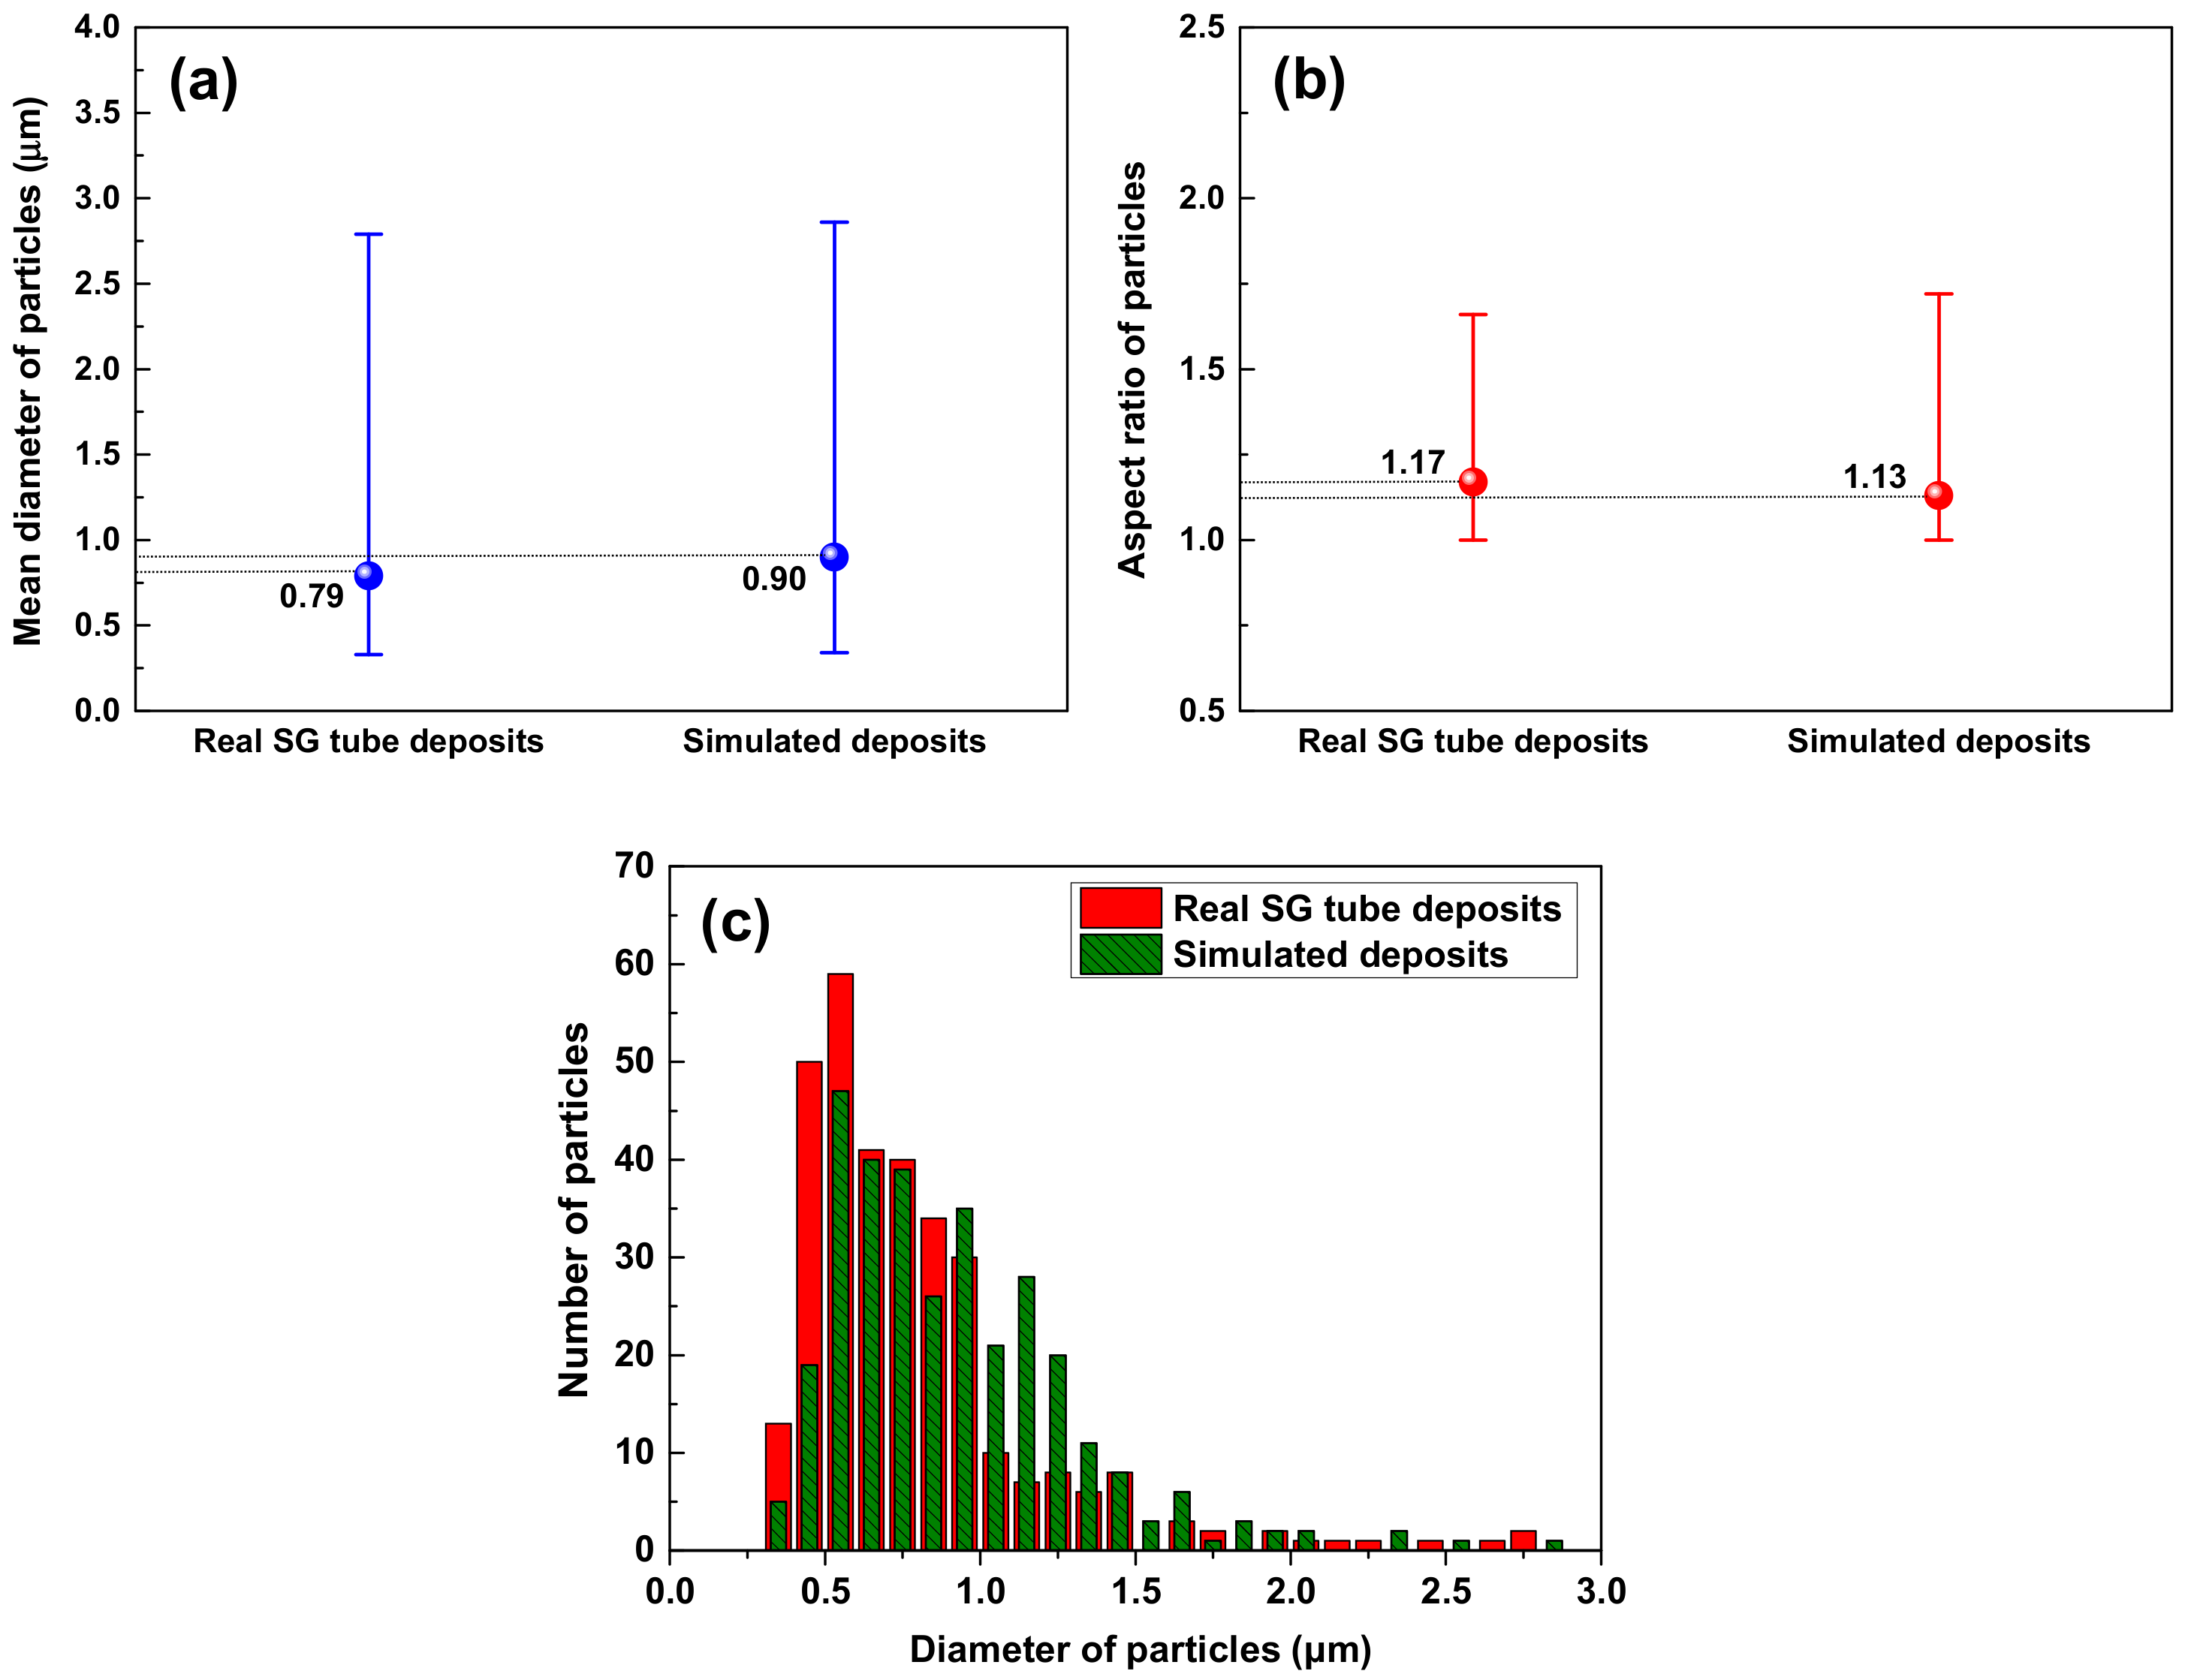
3.1. Morphology and Porosity of Simulated Magnetite Deposits and Samples of Real SG Flakes
3.2. Phases of Simulated Magnetite Deposits and Real Flake Samples
3.3. Amount of Magnetite Deposits and Mechanism of Magnetite Deposition Behavior
3.4. Simulation of Chemical Impurity Concentration within the Micro-Pores of Magnetite Deposits
4. Conclusions
- (1)
- The simulated magnetite deposits and real SG tube flakes have the round and polyhedral particles with numerous small pores. On the basis of the particle characteristics and porosity results, the magnetite deposits produced using the loop system properly simulated the real SG tube deposits because the particle size, aspect ratio, and porous structure were closely similar to those of real deposits.
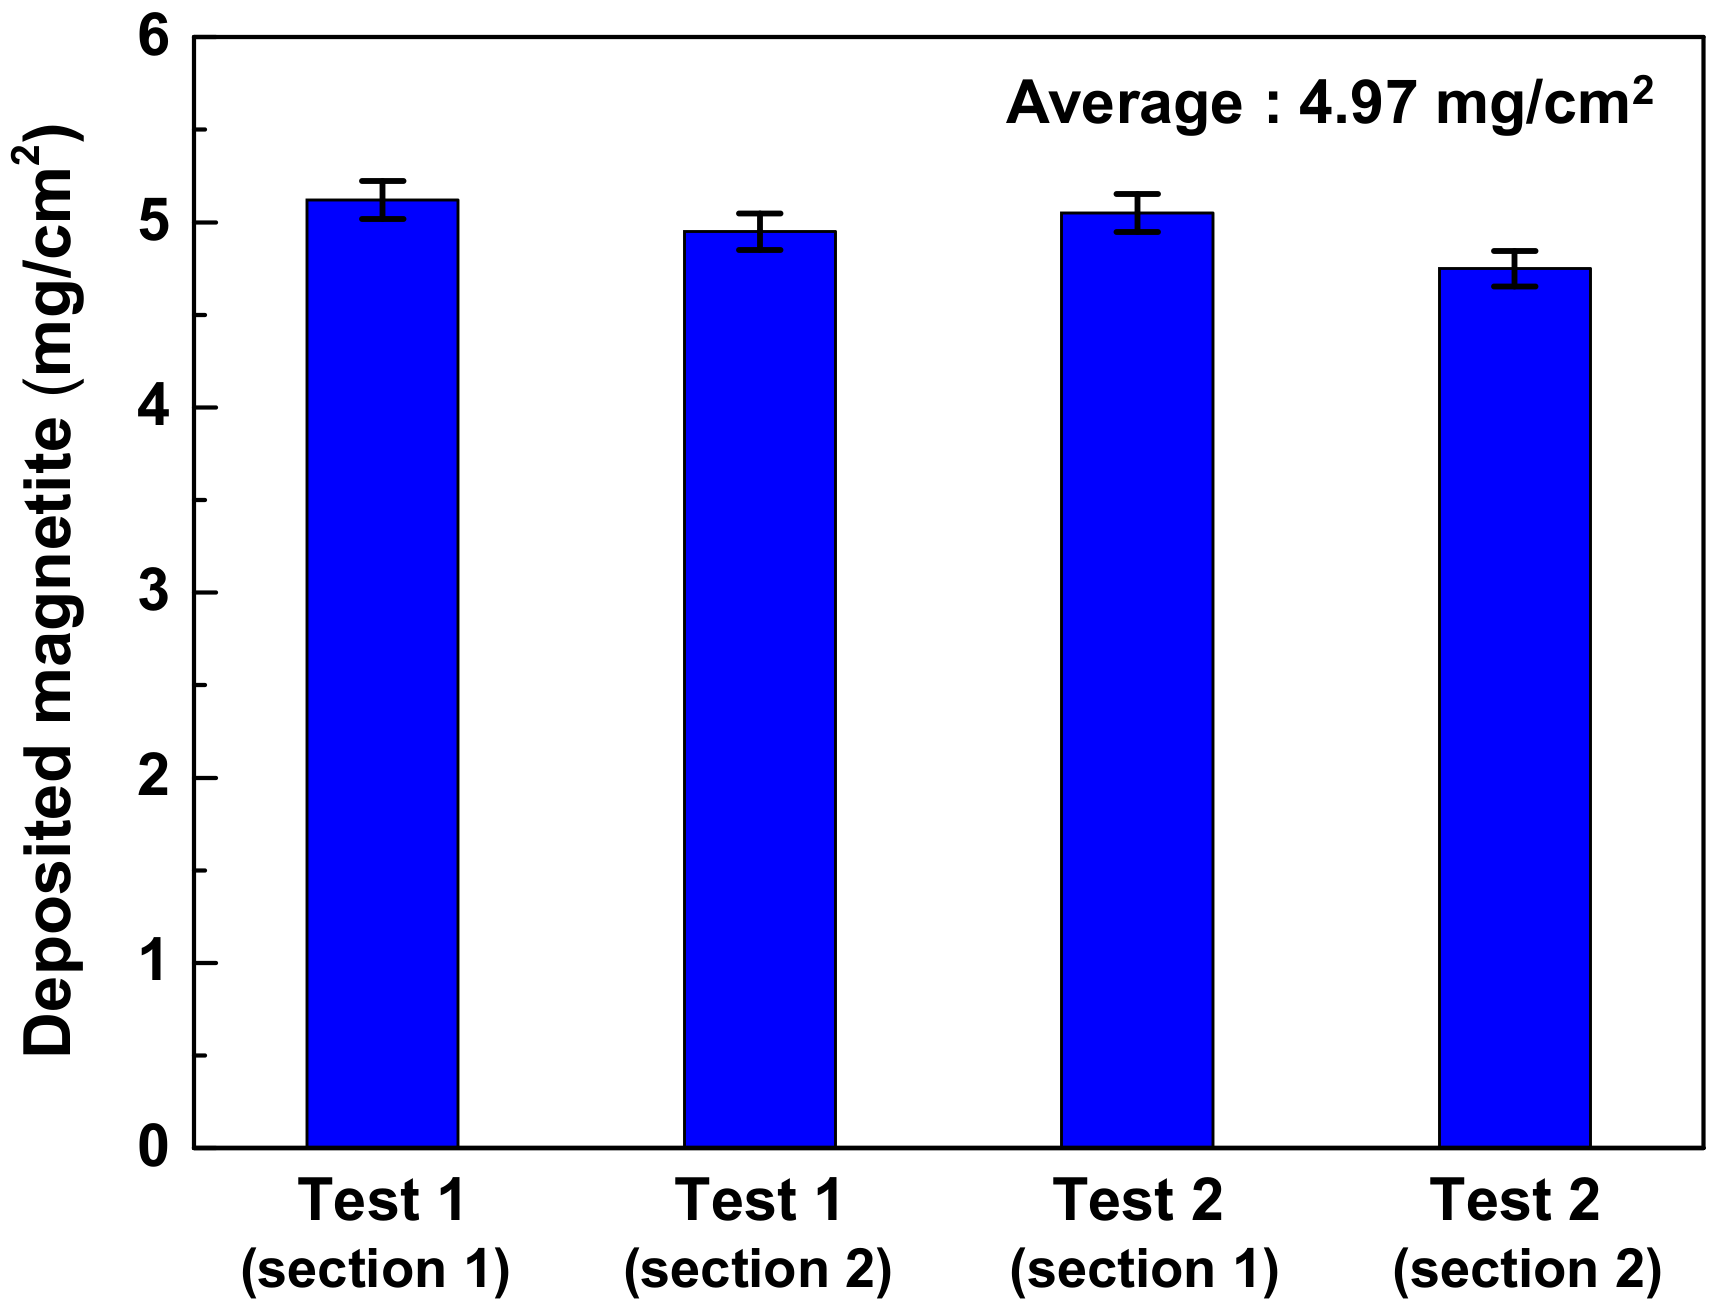
- (2)
- The simulated deposit was pure magnetite, which means the deposition test well simulated the actual SG tube deposits because the actual SG tube deposits mainly consisted of magnetite (about 90~95%). The average amount and deposition rate of simulated deposits were 4.97 mg/cm2 and 0.36 mg/cm2·day, respectively.
- (3)
- Chemical impurities such as Na and Cl could be concentrated within the micro-pores of the magnetite deposits owing to the bubble formation and collapse. The concentration factors of Na and Cl within the deposits were evaluated to be approximately 4.7 × 10⁵ and 2.7 × 10³, respectively.
- (4)
- These simulated magnetite samples would be used to investigate the heat transfer degradation of SG tubes and corrosion behavior such as the magnetite accelerated corrosion, impurities induced stress corrosion cracking, and pitting corrosion.
Author Contributions
Funding
Conflicts of Interest
References
- Vepsäläinen, M.; Saario, T. Magnetite Dissolution and Deposition in NPP Secondary Circuit; VTT-R-09735-10; VTT Technical Research Centre of Finland: Espoo, Finland, 2010. [Google Scholar]
- Ramesh, C.; Murugesan, N.; Prince, A.A.M.; Velmurugan, S.; Narasimhan, S.V.; Ganesan, V. Applied of polymer electrolyte based hydrogen sensor to study corrosion of carbon steel in acid medium. Corros. Sci. 2001, 43, 1865–1875. [Google Scholar] [CrossRef]
- Prince, A.A.M.; Velmurugan, S.; Narasimhan, S.V.; Ramesh, C.; Murugesan, N.; Raghavan, P.S.; Gopalan, R.J. Dissolution behaviour of magnetite film formed over carbon steel in dilute organic acid media. J. Nucl. Mater. 2001, 289, 281–290. [Google Scholar] [CrossRef]
- Yang, G.; Pointeau, E.; Tevissen, E.; Chagnes, A. A review on clogging of recirculating steam generators in pressurized-water reactors. Prog. Nucl. Energy 2017, 97, 182–196. [Google Scholar] [CrossRef] [Green Version]
- Paine, J.P.N.; Hobart, S.A.; Sawochka, S.G. Predicting steam generator crevice chemistry. In Proceedings of the 5th International Symposium on Environmental Degradation of Materials in Nuclear Power Systems-Water Reactors, Monterey, CA, USA, 25–29 August 1991; pp. 739–744. [Google Scholar]
- Millet, P.J.; Fenton, J.M. A detailed model of localized concentration processes in porous deposits of SGs. In Proceedings of the 5th International Symposium on Environmental Degradation of Materials in Nuclear Power Systems-Water Reactors, Monterey, CA, USA, 25–29 August 1991; pp. 745–751. [Google Scholar]
- Plonski, I.J. Efect of bare metal surface on the dissolution in aqueous citrate solutions of magnetite films on carbon steel. J. Appl. Electrochem. 1997, 27, 1184–1192. [Google Scholar] [CrossRef]
- Gonzalez, F.; Spekkens, P. Corrosion of Inconel 600 under steam generator sludge piles. In Proceedings of the 4th International Symposium on Environmental Degradation of Materials in Nuclear Power Systems-Water Reactors, Jekyll Island, GA, USA, 6–10 August 1989; p. 7-108–7-120. [Google Scholar]
- Saint Paul, P.; Slama, G. Steam generator materials degradation. In Proceedings of the 5th International Symposium on Environmental Degradation of Materials in Nuclear Power Systems-Water Reactors, Monterey, CA, USA, 25–29 August 1991; pp. 39–49. [Google Scholar]
- Kawamura, H.; Hirano, H. Intergranular attack and stress corrosion cracking propagation behavior of Inconel 600 in high temperature water. In Proceedings of the 6th International Symposium on Environmental Degradation of Materials in Nuclear Power Systems-Water Reactors, San Diego, CA, USA, 1–5 August 1993; pp. 71–78. [Google Scholar]
- Förch, H.; Oliver, T.; Hertle, W. Chemical cleaning of PWR steam generator with a low temperature process. Nucl. Eng. Design 1993, 147, 115–118. [Google Scholar] [CrossRef]
- Jeong, W.-T.; Hong, S.-Y. Development of the tube sheet cleaning system of the nuclear steam generator. In Proceedings of the Transactions of the Korean Nuclear Society Autumn Meeting, Busan, Korea, 27–28 October 2005. [Google Scholar]
- Marks, C. Steam Generator Management Program: Effects of Different pH Control Agents on Pressurized Water Reactor Plant Systems and Components; EPRI Report 1019042; EPRI: Palo Alto, CA, USA, 2009. [Google Scholar]
- Byers, W.A.; Deshon, J. Structure and chemistry of PWR crud. In Proceedings of the International Conference on Water Chemistry of Nuclear Reactor Systems, San Francisco, CA, USA, 11–14 October 2004; pp. 1722–1731. [Google Scholar]
- Deshon, J. PWR Axial Offset Anomaly (AOA) Guidelines Rev. 1; EPRI Report 1008102; EPRI: Palo Alto, CA, USA, 2004. [Google Scholar]
- Sawicki, J.A. Characterization of Corrosion Products on the Callaway Cycle 9 PWR Core; EPRI Report 1003129; EPRI: Palo Alto, CA, USA, 2001. [Google Scholar]
- Sawicki, J.A. Evidence of Ni2FeBO5 and m-ZrO2 precipitates in fuel rod deposits in a AOA-affected high boiling duty PWR core. J. Nucl. Mater. 2008, 374, 248–269. [Google Scholar] [CrossRef]
- Nishimura, T.; Umehara, R.; Shimizu, Y.; Kogawa, N.; Ojima, Z.; Nagamine, K.; Suzuki, M. Study for nickel deposition on the fuel cladding by DH transition under simulated PWR conditions. In Proceedings of the Nuclear Plant Chemistry Conference 2014, Sapporo, Japan, 26–31 October 2014; p. 10152. [Google Scholar]
- Baek, S.H.; Shim, H.-S.; Kim, J.G.; Hur, D.H. Effect of chemical etching of fuel cladding surface on crud deposition behavior in simulated primary water of PWRs at 328 °C. Ann. Nucl. Energy 2018, 116, 69–77. [Google Scholar] [CrossRef]
- Baek, S.H.; Shim, H.-S.; Kim, J.G.; Hur, D.H. Effects of heat flux on fuel crud deposition and sub-cooled nucleate boiling in simulated PWR primary water at 13 MPa. Ann. Nucl. Energy 2019, 133, 178–185. [Google Scholar] [CrossRef]
- Baek, S.H.; Shim, H.-S.; Kim, J.G.; Hur, D.H. Effect of dissolved hydrogen on fuel crud deposition and subcooled nucleate boiling in PWR primary water at 328 °C. Nucl. Eng. Des. 2019, 345, 85–93. [Google Scholar] [CrossRef]
- Jeon, S.-H.; Song, G.D.; Hur, D.H. Micro-Galvanic Corrosion of Steam Generator Materials within Pores of Magnetite Flakes in Alkaline Solutions. Metals 2018, 8, 899. [Google Scholar] [CrossRef] [Green Version]
- Jeon, S.-H.; Hong, S.; Kwon, H.C.; Hur, D.H. Characteristics of steam generator tube deposits in an operating pressurized water reactor. J. Nucl. Mater. 2018, 507, 371–380. [Google Scholar] [CrossRef]
- Goujon, C.; Bescond, A.; Mansour, C.; Delaunay, S.; Pauporté, T.; Bretelle, J.-L. Fouling Of Steam Generator Tubes In Nuclear Power Plants: Laboratory Tests To Reproduce Oxides Deposition And Chemical Cleanings. Nuclear Plant. In Proceedings of the Chemistry Conference 2014, Sapporo, Japan, 26–31 October 2014; p. 10098. [Google Scholar]
- Fruzzetti, K. Pressurized Water Reactor Secondary Water Chemistry Guidelines-Revision 8; EPRI Report 3002010645; EPRI: Palo Alto, CA, USA, 2017. [Google Scholar]
- Vijayakumar, R.; Koltypin, Y.; Felner, I.; Gedanken, A. Sonochemical synthesis and characterization of pure nanometer-sized Fe3O4 particles. Mater. Sci. Eng. A. 2000, 286, 101–105. [Google Scholar] [CrossRef]
- Gotić, M.; Musić, S. Synthesis of nanocrystalline iron oxide particles in the iron(III) acetate/alcohol/acetic acid system. Eur. J. Inorg. Chem. 2008, 966–973. [Google Scholar] [CrossRef]
- Chirita, M.; Banica, R.; Sfirloaga, P.; Ieta, A.; Grozescu, I. A short route of micrometric magnetite synthesis via Fe-EDTA thermal decomposition. In Proceedings of the International Semiconductor Conference, Sinaia, Romania, 11–13 October 2010. [Google Scholar]
- Chen, L.; Zhao, C.; Zhou, Y.; Peng, H.; Zheng, Y. Controlled synthesis of Fe3O4 nanosheets via one-step pyrolysis of EDTA ferric sodium salt. J. Alloys Compd. 2010, 504, L46–L50. [Google Scholar] [CrossRef]
- Kim, K.-S.; Baek, S.H.; Shim, H.-S.; Lee, J.H.; Hur, D.H. Effect of zinc addition on fuel crud deposition on simulated PWR primary coolant conditions. Ann. Nucl. Energy 2020, 146, 107643. [Google Scholar] [CrossRef]
- Mclean, V. Characterization of PWR Steam Generator Deposits; EPRI TR-106048; EPRI: Palo Alto, CA, USA, 1996. [Google Scholar]
- Wright, S.I.; Nowell, M.M.; Lindeman, S.P.; Camus, P.P.; Graef, M.D.; Jackson, M.A. Introduction and comparison of new EBSD post-processing methodologies. Ultramicroscopy 2015, 159, 81–94. [Google Scholar] [CrossRef] [PubMed] [Green Version]
- Fruzzetti, K. Multivariable Assessment of Flow Accelerated Corrosion and Steam Generator Fouling, Literature Review; EPRI Report 1003619; EPRI: Palo Alto, CA, USA, 2003. [Google Scholar]
- Dooley, R.B. Flow-accelerated corrosion in fossil and combined cycle/HRSG plants. Powerpl. Chem. 2008, 10, 68–89. [Google Scholar]
- Guzzetta, A. Modelling the effects of fuel rod crud formation on boiling heat transfer in a pressurized water reactor using eulerian two-fluid CFD. Master’s Thesis, Pennsylvania State University, University Park, PA, USA, 2010. [Google Scholar]
- Iwahori, T.; Mizuni, T.; Koyama, H. Role of surface chemistry in crud deposition on heat transfer surface. Corrosion 1979, 35, 345–350. [Google Scholar] [CrossRef]
- Essi, J.; Konsta, S.; Timo, S. Determining zeta potential of magnetite particles in PWR secondary side water treated with ammonia or ethanolamine by using streaming potential technique. In Proceedings of the 20th NPC International Conference, Brighton, UK, 2–7 October 2016. Paper Number 151. [Google Scholar]
- Vidojkovic, S.M.; Rakin, M.P. Surface properties of magnetite in high temperature aqueous electrolyte solutions: A. review. Adv. Colloid Interface Sci. 2017, 245, 108–129. [Google Scholar] [CrossRef] [PubMed]
- Vereda, F.; Molina, A.M.; Alvarez, R.H.; Pérez, M.Q. Specific ion effects on the electrokinetic properties of iron oxide nanoparticles: Experiments and simulations. Phys. Chem. Chem. Phys. 2015, 17, 17069–17078. [Google Scholar] [CrossRef] [PubMed] [Green Version]


| Ni | Cr | Fe | C | Si | Mn | Ti | Al | Cu | Co |
|---|---|---|---|---|---|---|---|---|---|
| Bal. | 29.3 | 10.4 | 0.02 | 0.3 | 0.3 | 0.3 | 0.2 | 0.01 | 0.01 |
| Internal Heater Heat Flux | Fe Concentration at Test Section | Temperature | System Pressure | Dissolved Oxygen | pH at 25 °C | Flow Rate | Test Time |
|---|---|---|---|---|---|---|---|
| 30 W/cm2 | 1.0 ppm | 270 °C | 60 bar | <5 ppb | 9.0 | 260 mL/min | 14 days |
| Materials | Particle Characteristics | Phases (%) | Porosity (%) | Thickness of Deposits (μm) | ||
|---|---|---|---|---|---|---|
| Mean Size (μm) | Aspect Ratio | Morphology | ||||
| Simulated magnetite | 0.90 | 1.13 | Polyhedral & round | Pure magnetite | 26.6 | 15 |
| SG tube flake | 0.79 | 1.17 | Polyhedral & round | Magnetite (89.2) Jacobsite (5.4) Trevorite (4.4) Copper (1.0) | 18.7 | 110~120 |
| Materials | Impurities (wt.%) | Bulk Water (ppb) | Concentration Factors | |||
|---|---|---|---|---|---|---|
| Na | Cl | Na | Cl | Na | Cl | |
| Simulated magnetite | 0.47 | 0.04 | 100 | 150 | 4.7 × 10⁵ | 2.7 × 10³ |
| SG tube flake [23] | 0.02 | 0.04 | <5 | <10 | 4.0 × 10⁴ | 4.0 × 10⁴ |
© 2020 by the authors. Licensee MDPI, Basel, Switzerland. This article is an open access article distributed under the terms and conditions of the Creative Commons Attribution (CC BY) license (http://creativecommons.org/licenses/by/4.0/).
Share and Cite
Jeon, S.-H.; Shim, H.-S.; Lee, J.-M.; Han, J.; Hur, D.H. Simulation of Porous Magnetite Deposits on Steam Generator Tubes in Circulating Water at 270 °C. Crystals 2020, 10, 729. https://doi.org/10.3390/cryst10090729
Jeon S-H, Shim H-S, Lee J-M, Han J, Hur DH. Simulation of Porous Magnetite Deposits on Steam Generator Tubes in Circulating Water at 270 °C. Crystals. 2020; 10(9):729. https://doi.org/10.3390/cryst10090729
Chicago/Turabian StyleJeon, Soon-Hyeok, Hee-Sang Shim, Ji-Min Lee, Jeoh Han, and Do Haeng Hur. 2020. "Simulation of Porous Magnetite Deposits on Steam Generator Tubes in Circulating Water at 270 °C" Crystals 10, no. 9: 729. https://doi.org/10.3390/cryst10090729