Dual-Energy X-ray Medical Imaging with Inverse Compton Sources: A Simulation Study


Abstract
1. Introduction
2. K-Edge Subtraction Imaging
3. X-ray Imaging with Inverse Compton Scattering Sources
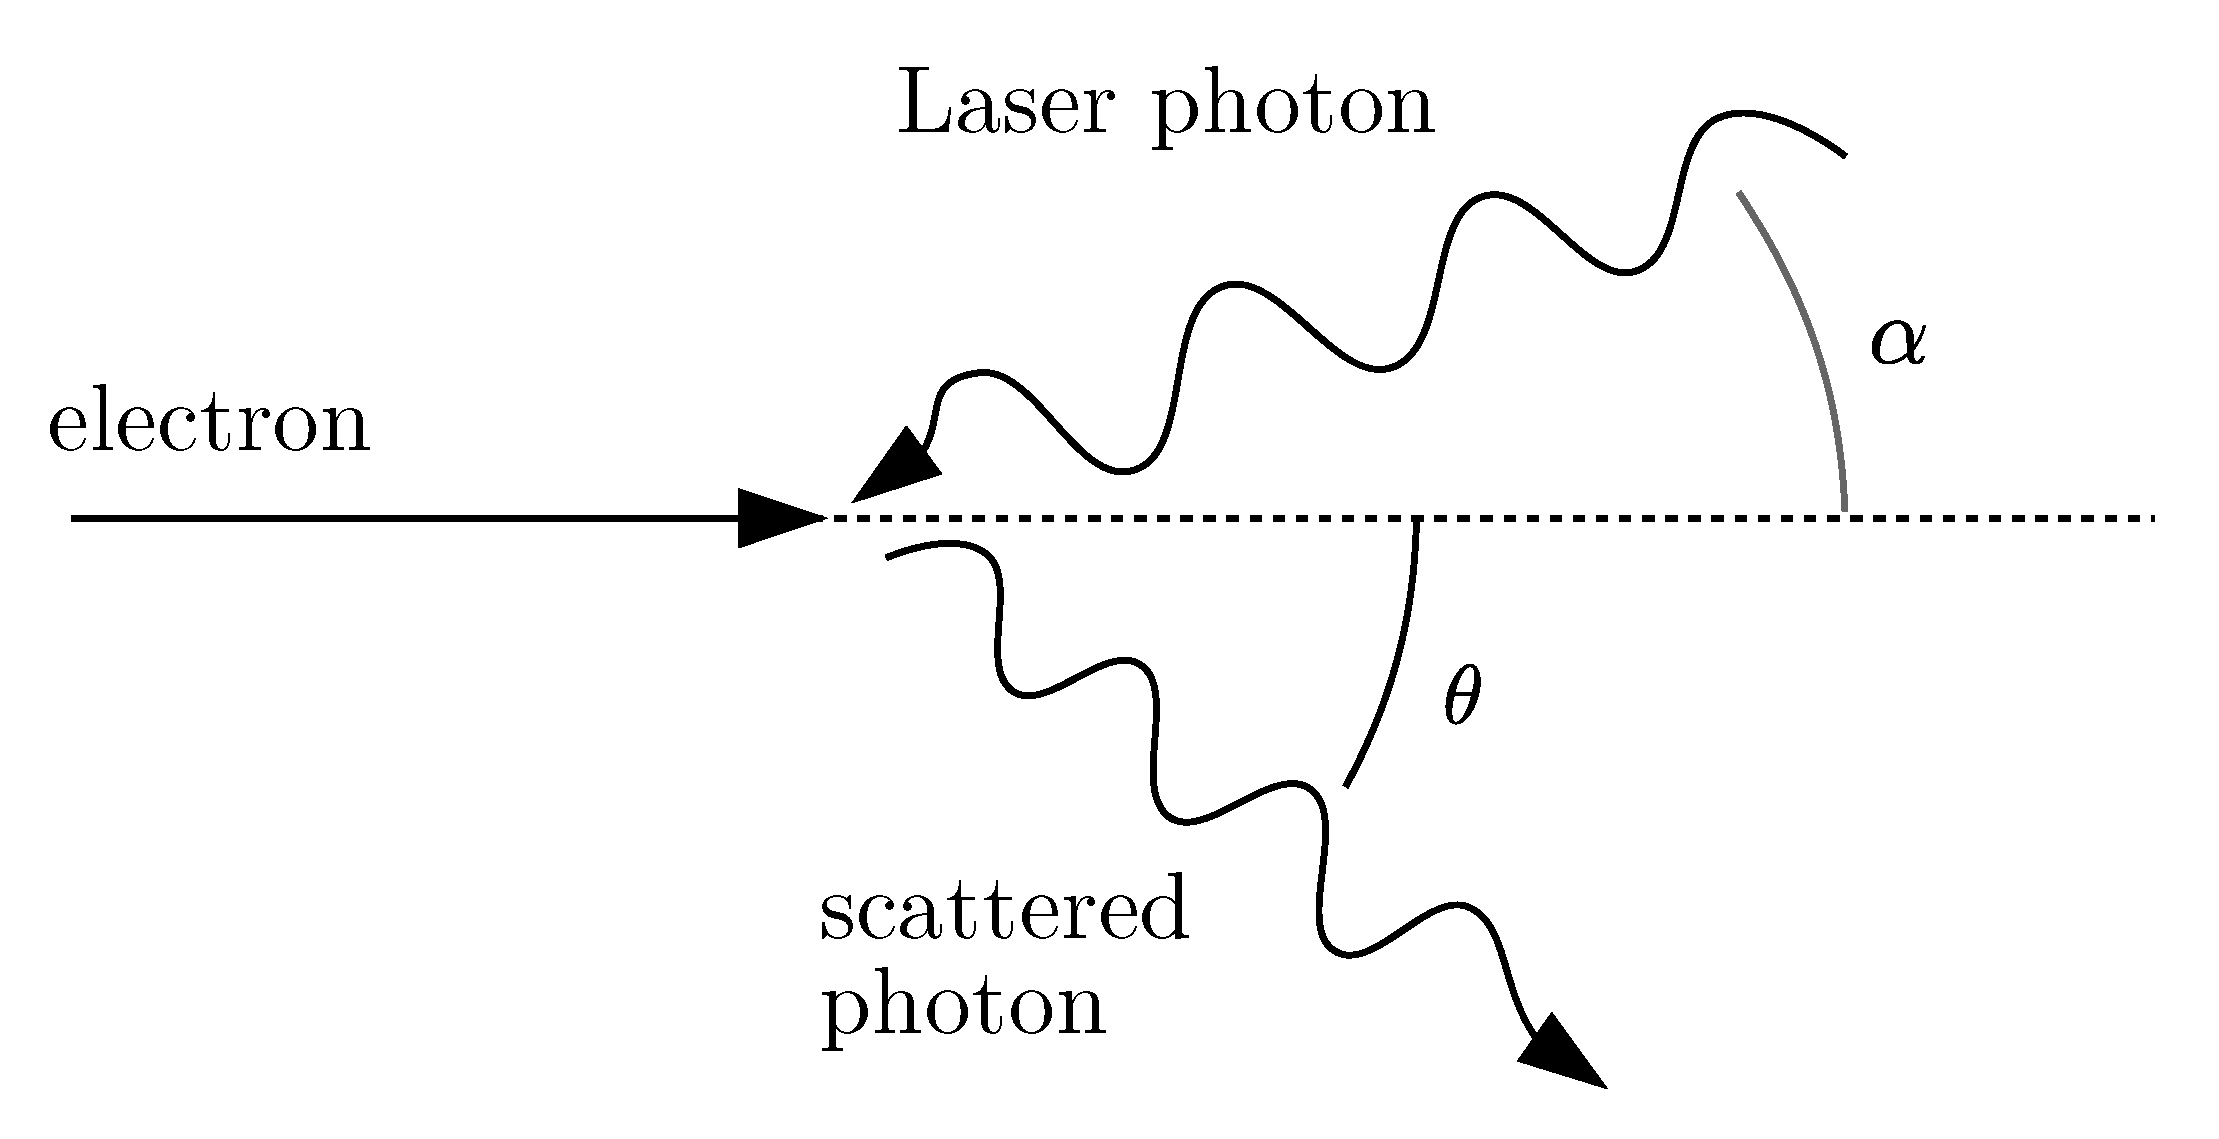
3.1. Inverse Compton Scattering
3.2. Inverse Compton Scattering Sources
Dual-Energy Imaging Implementation with Inverse Compton Scattering Sources
3.3. K-Edge Subtraction Imaging with Inverse Compton Sources
4. Materials and Methods
4.1. Phantoms
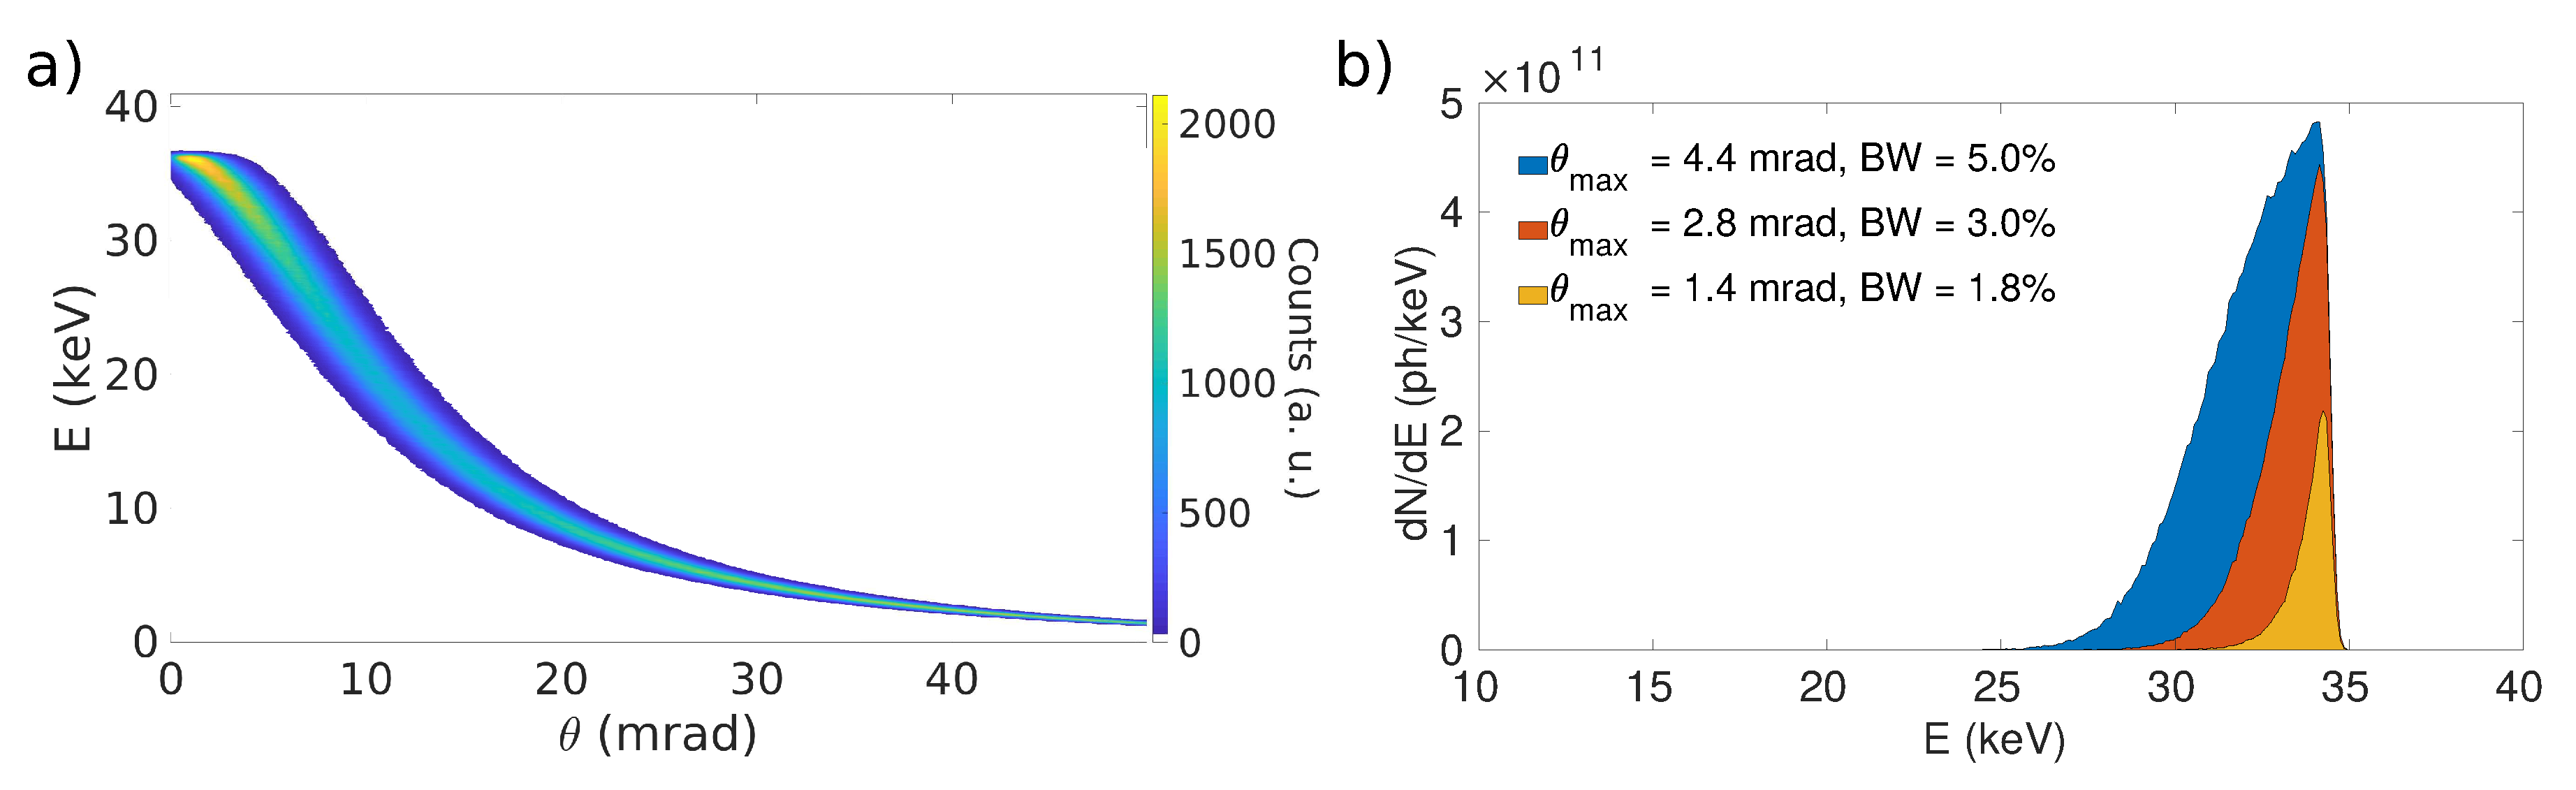
4.2. X-Ray Beams
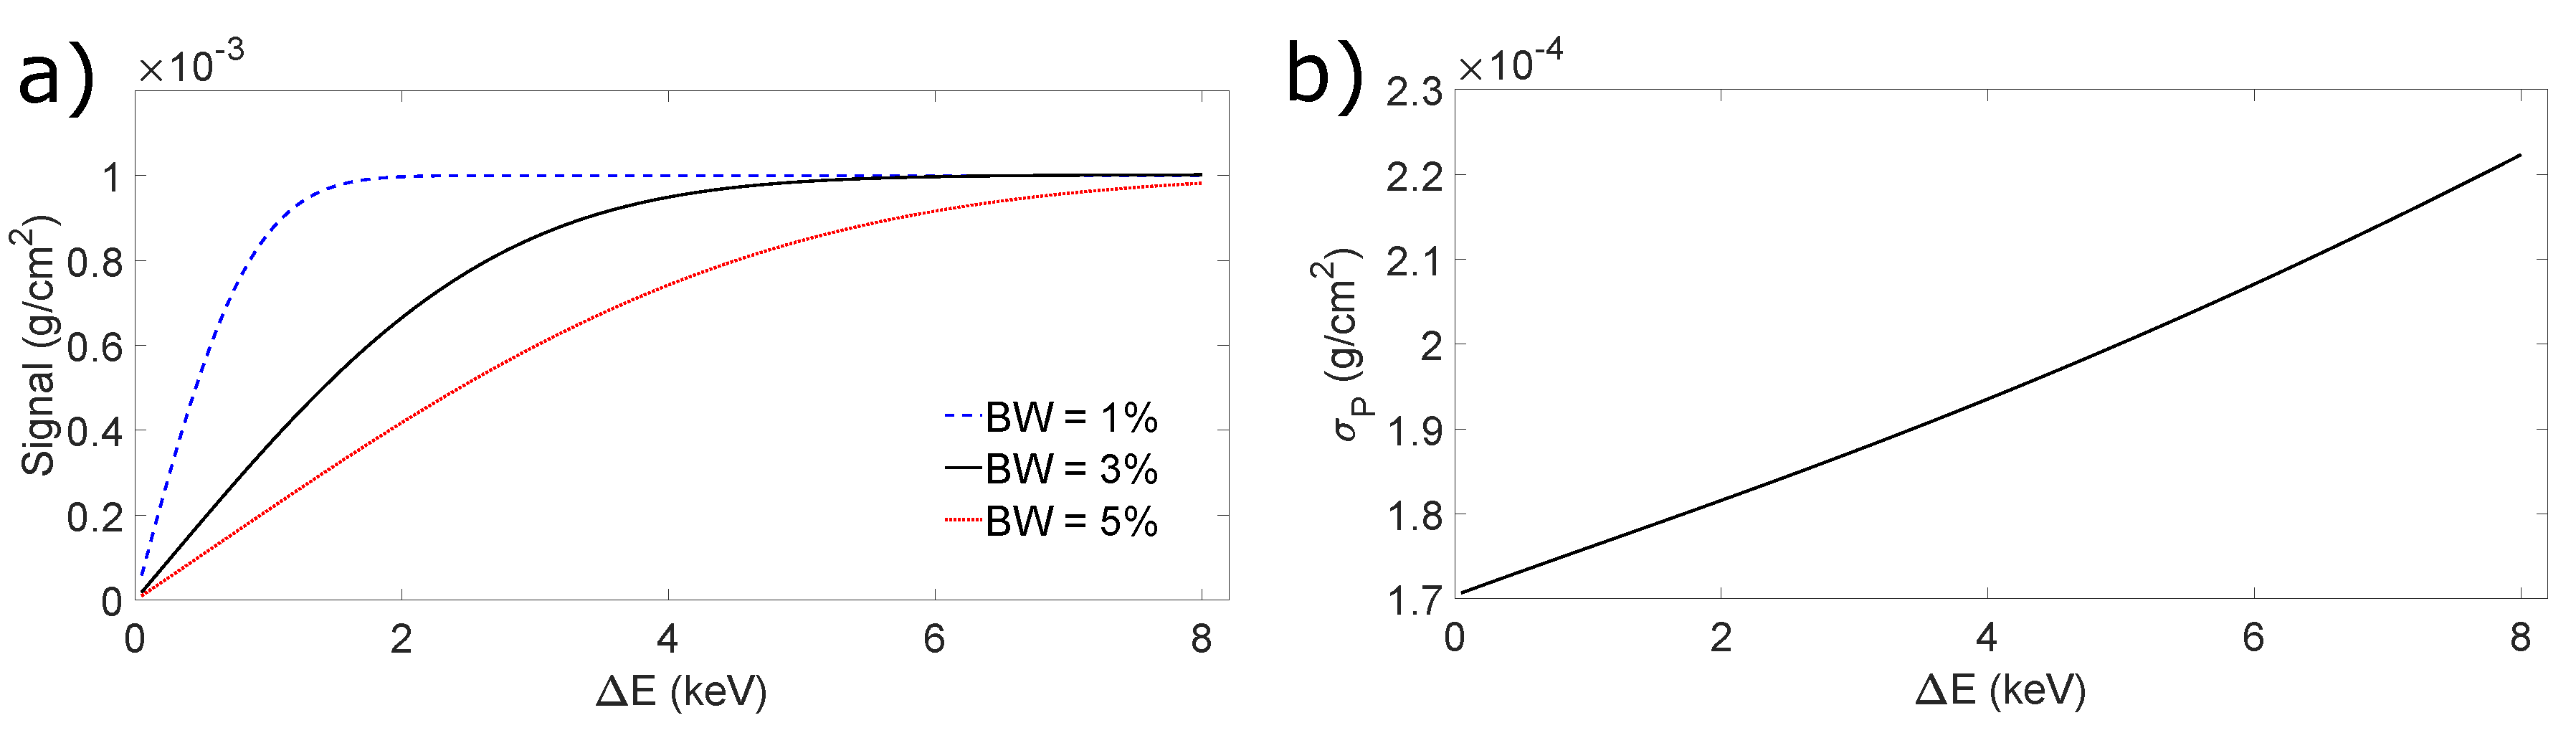
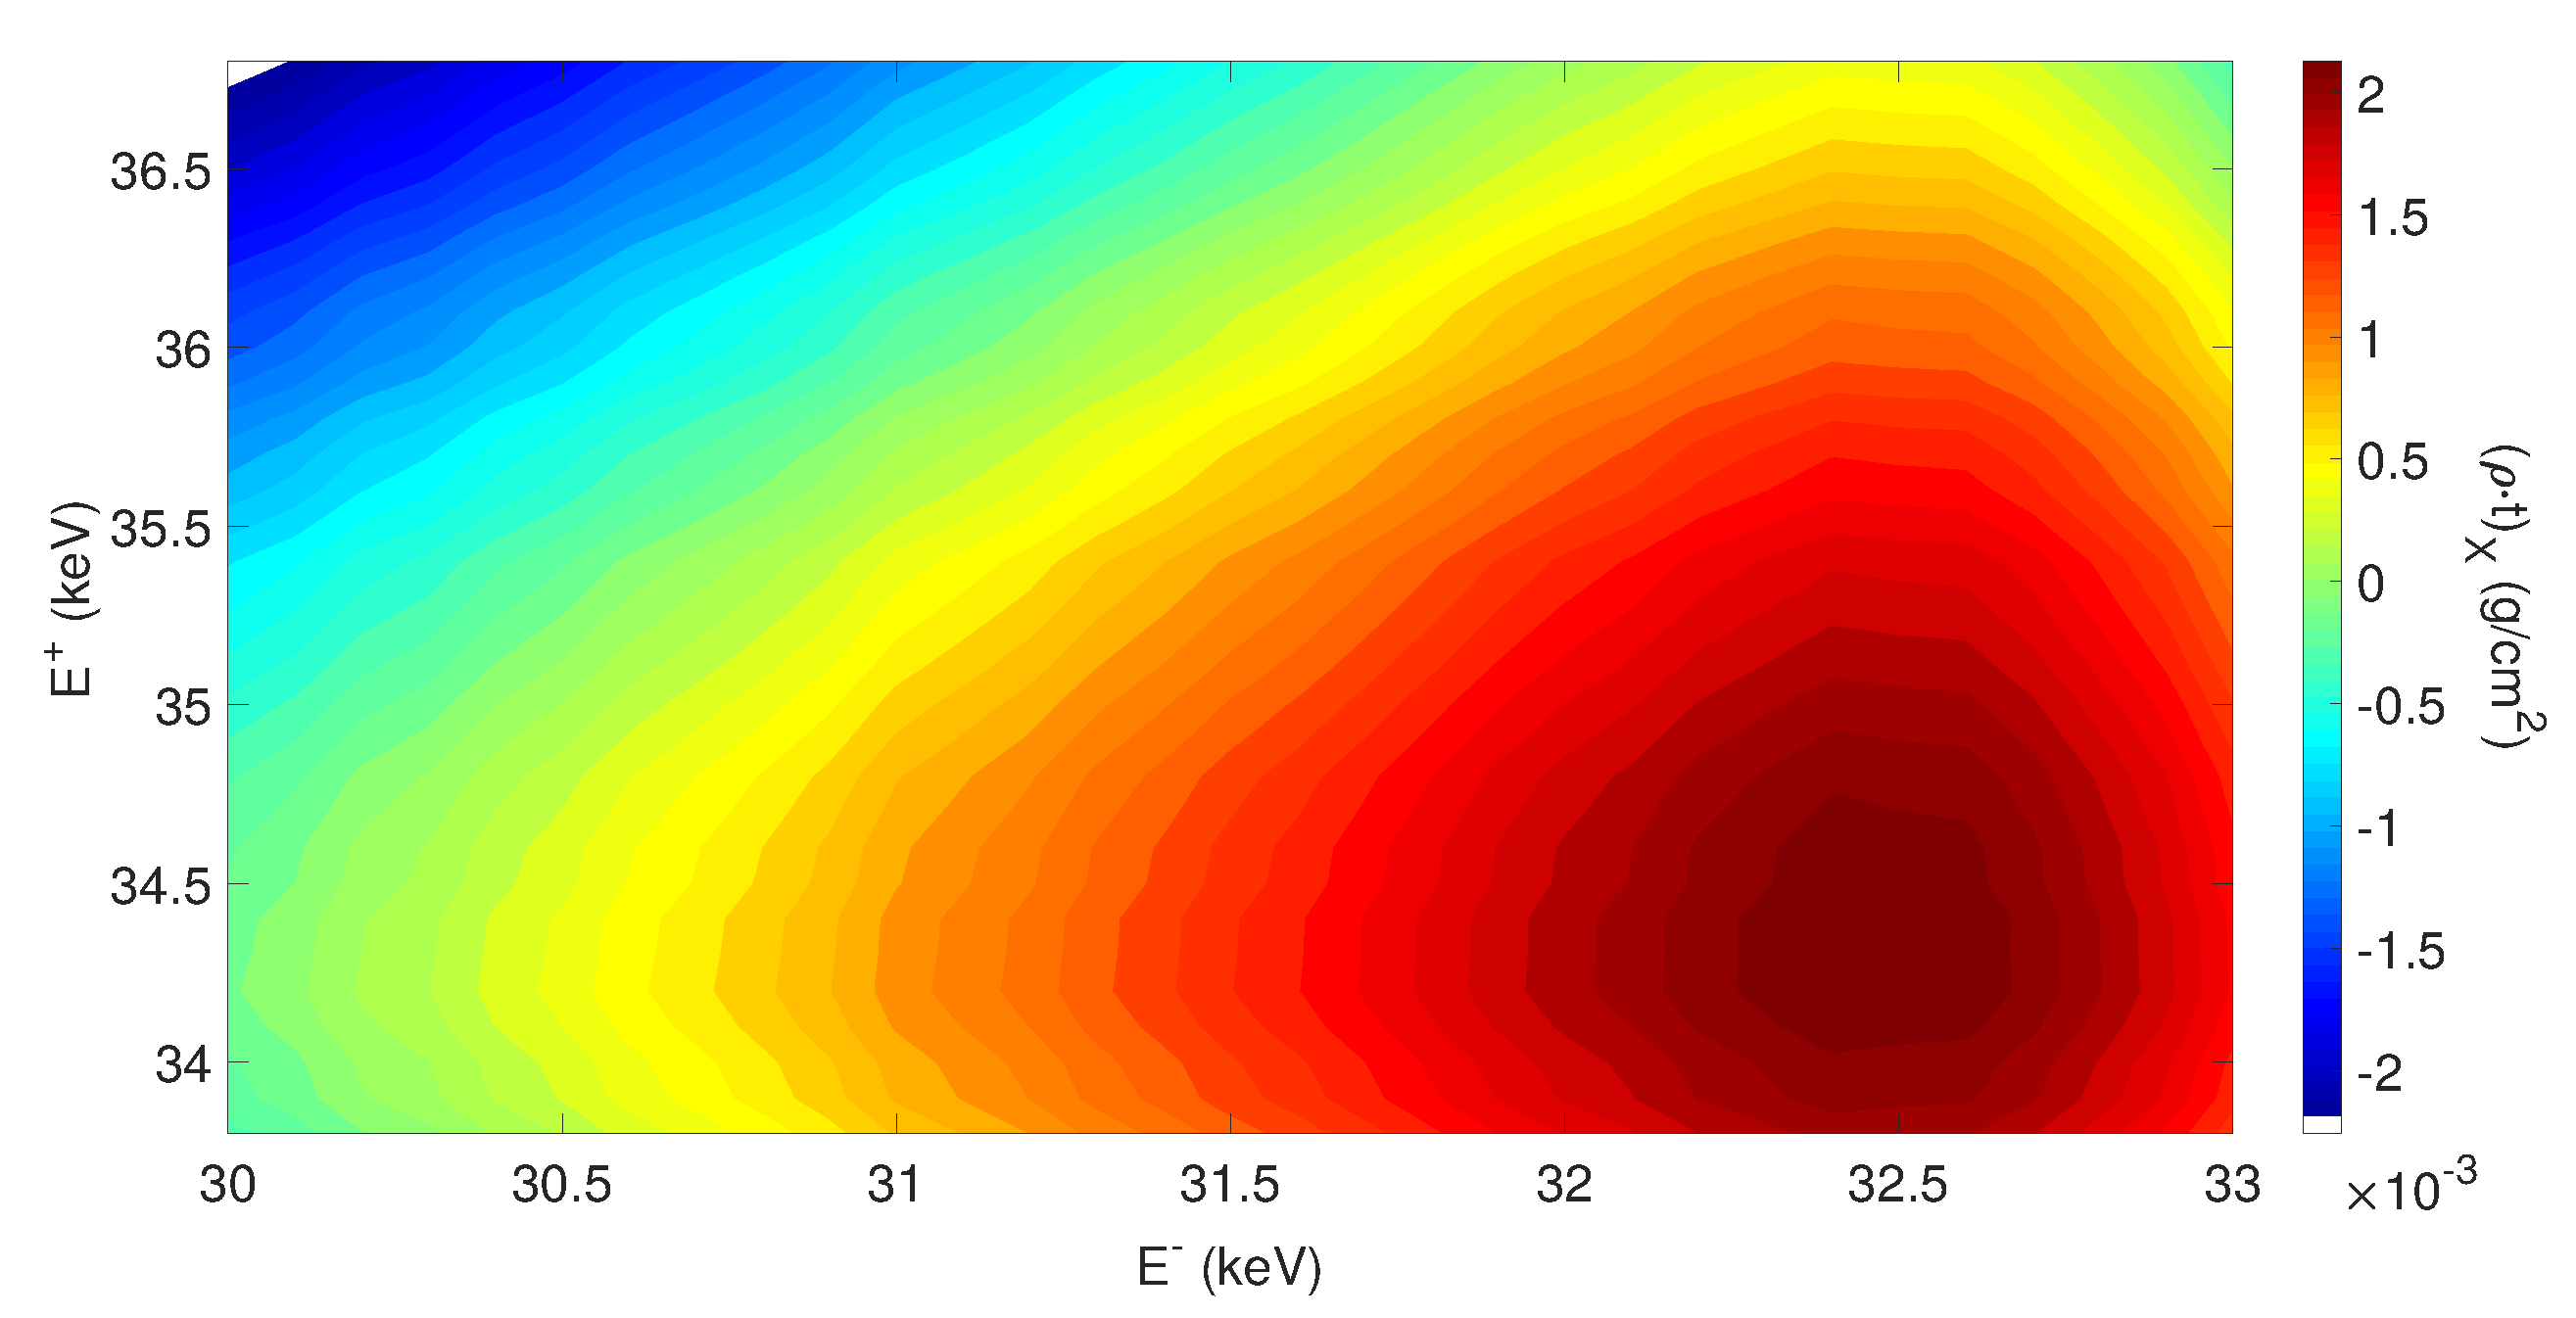
4.3. Figures of Merit
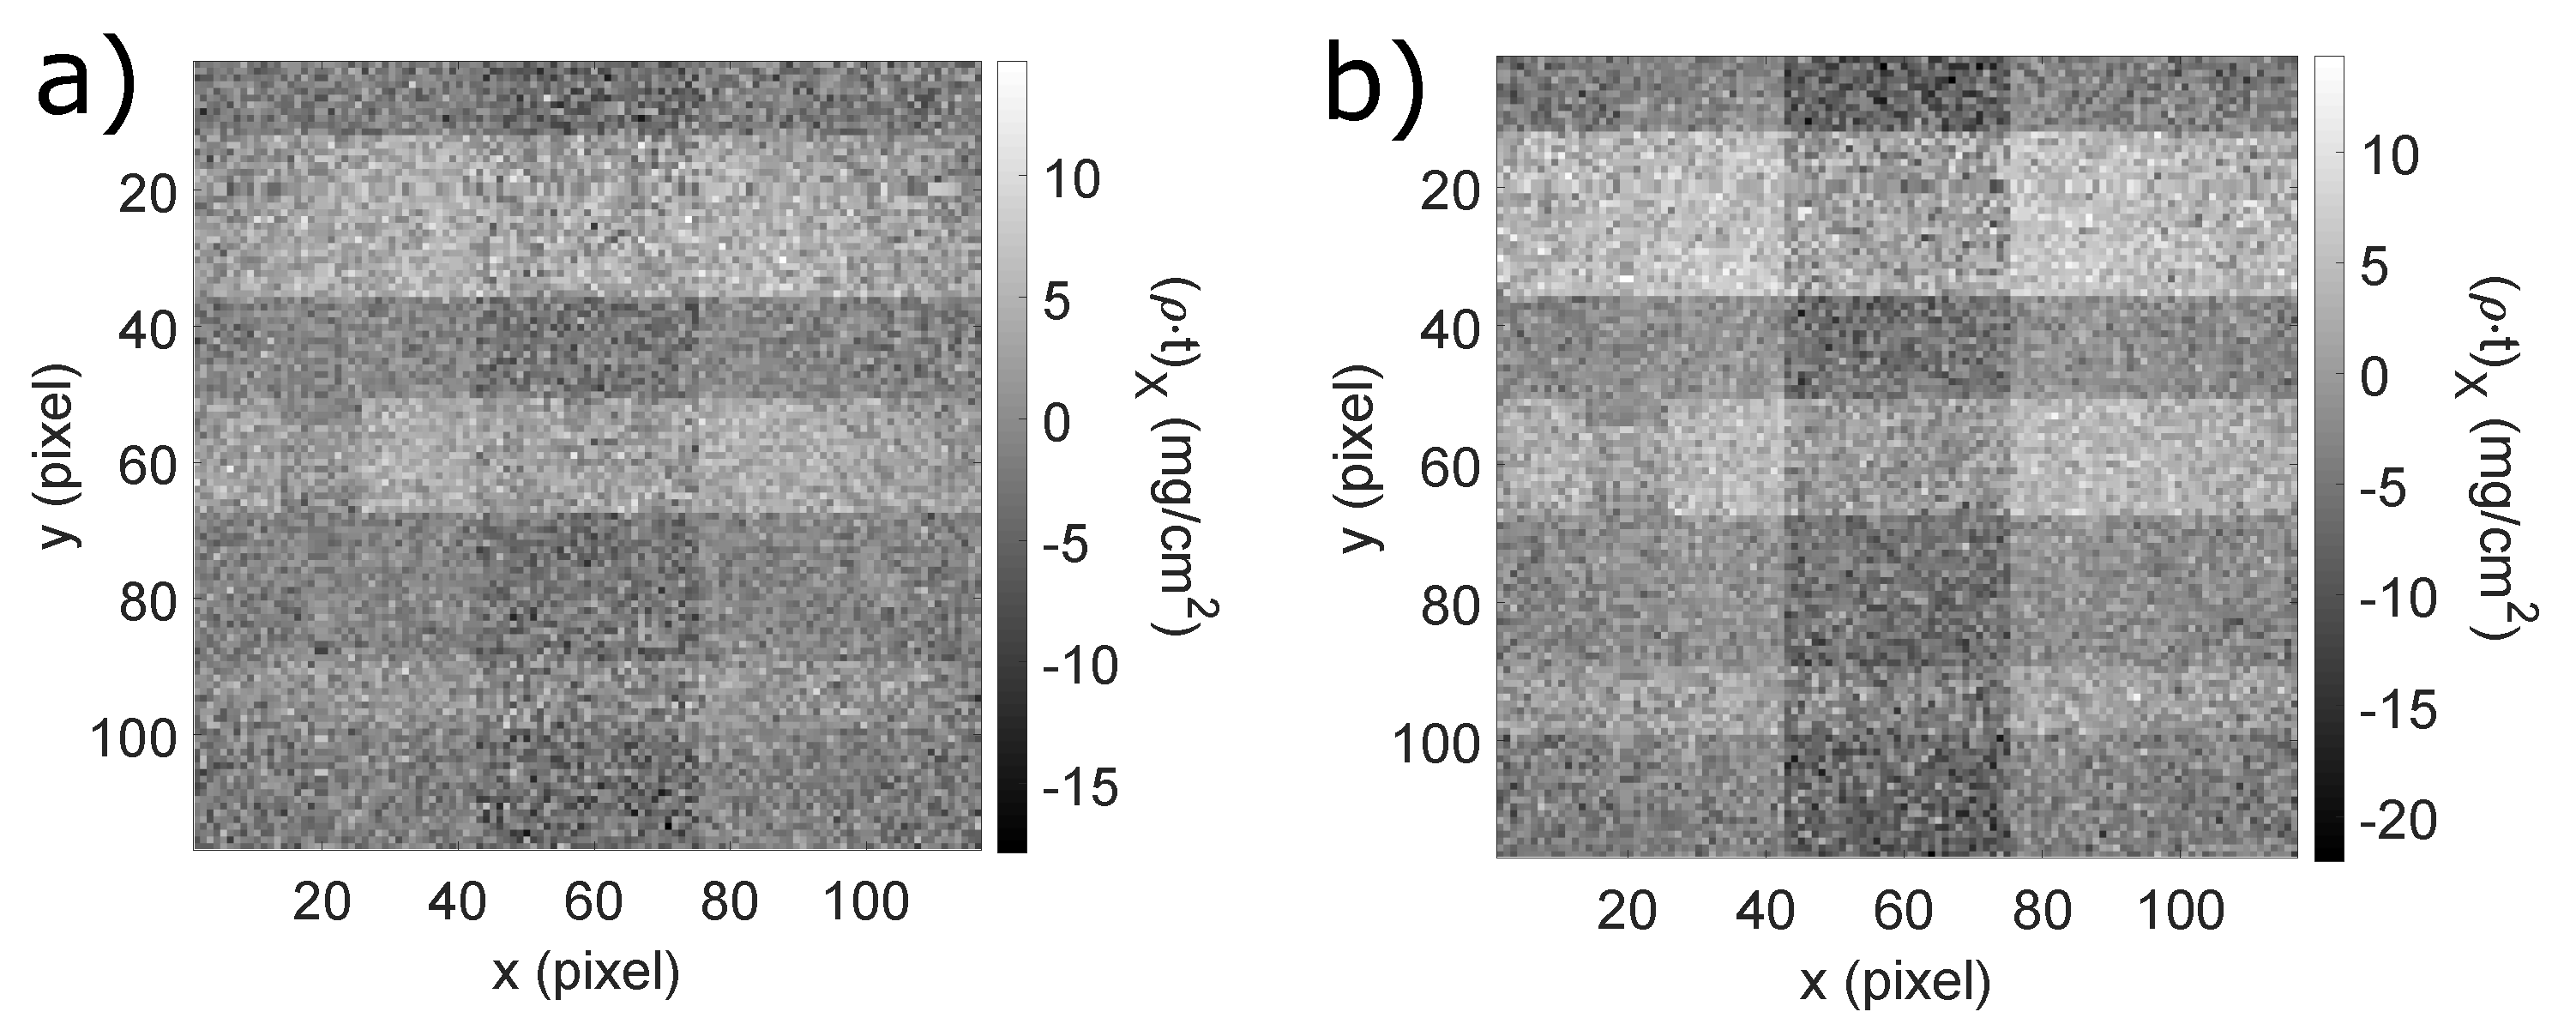
5. Results
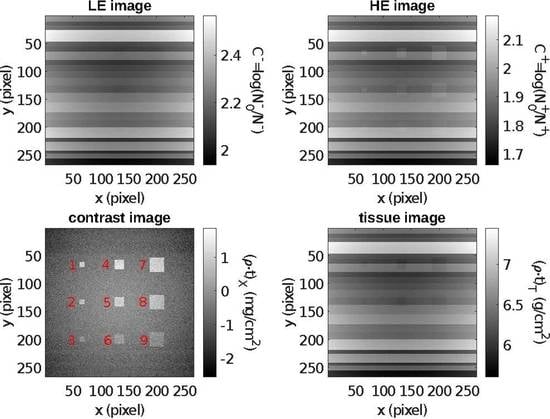
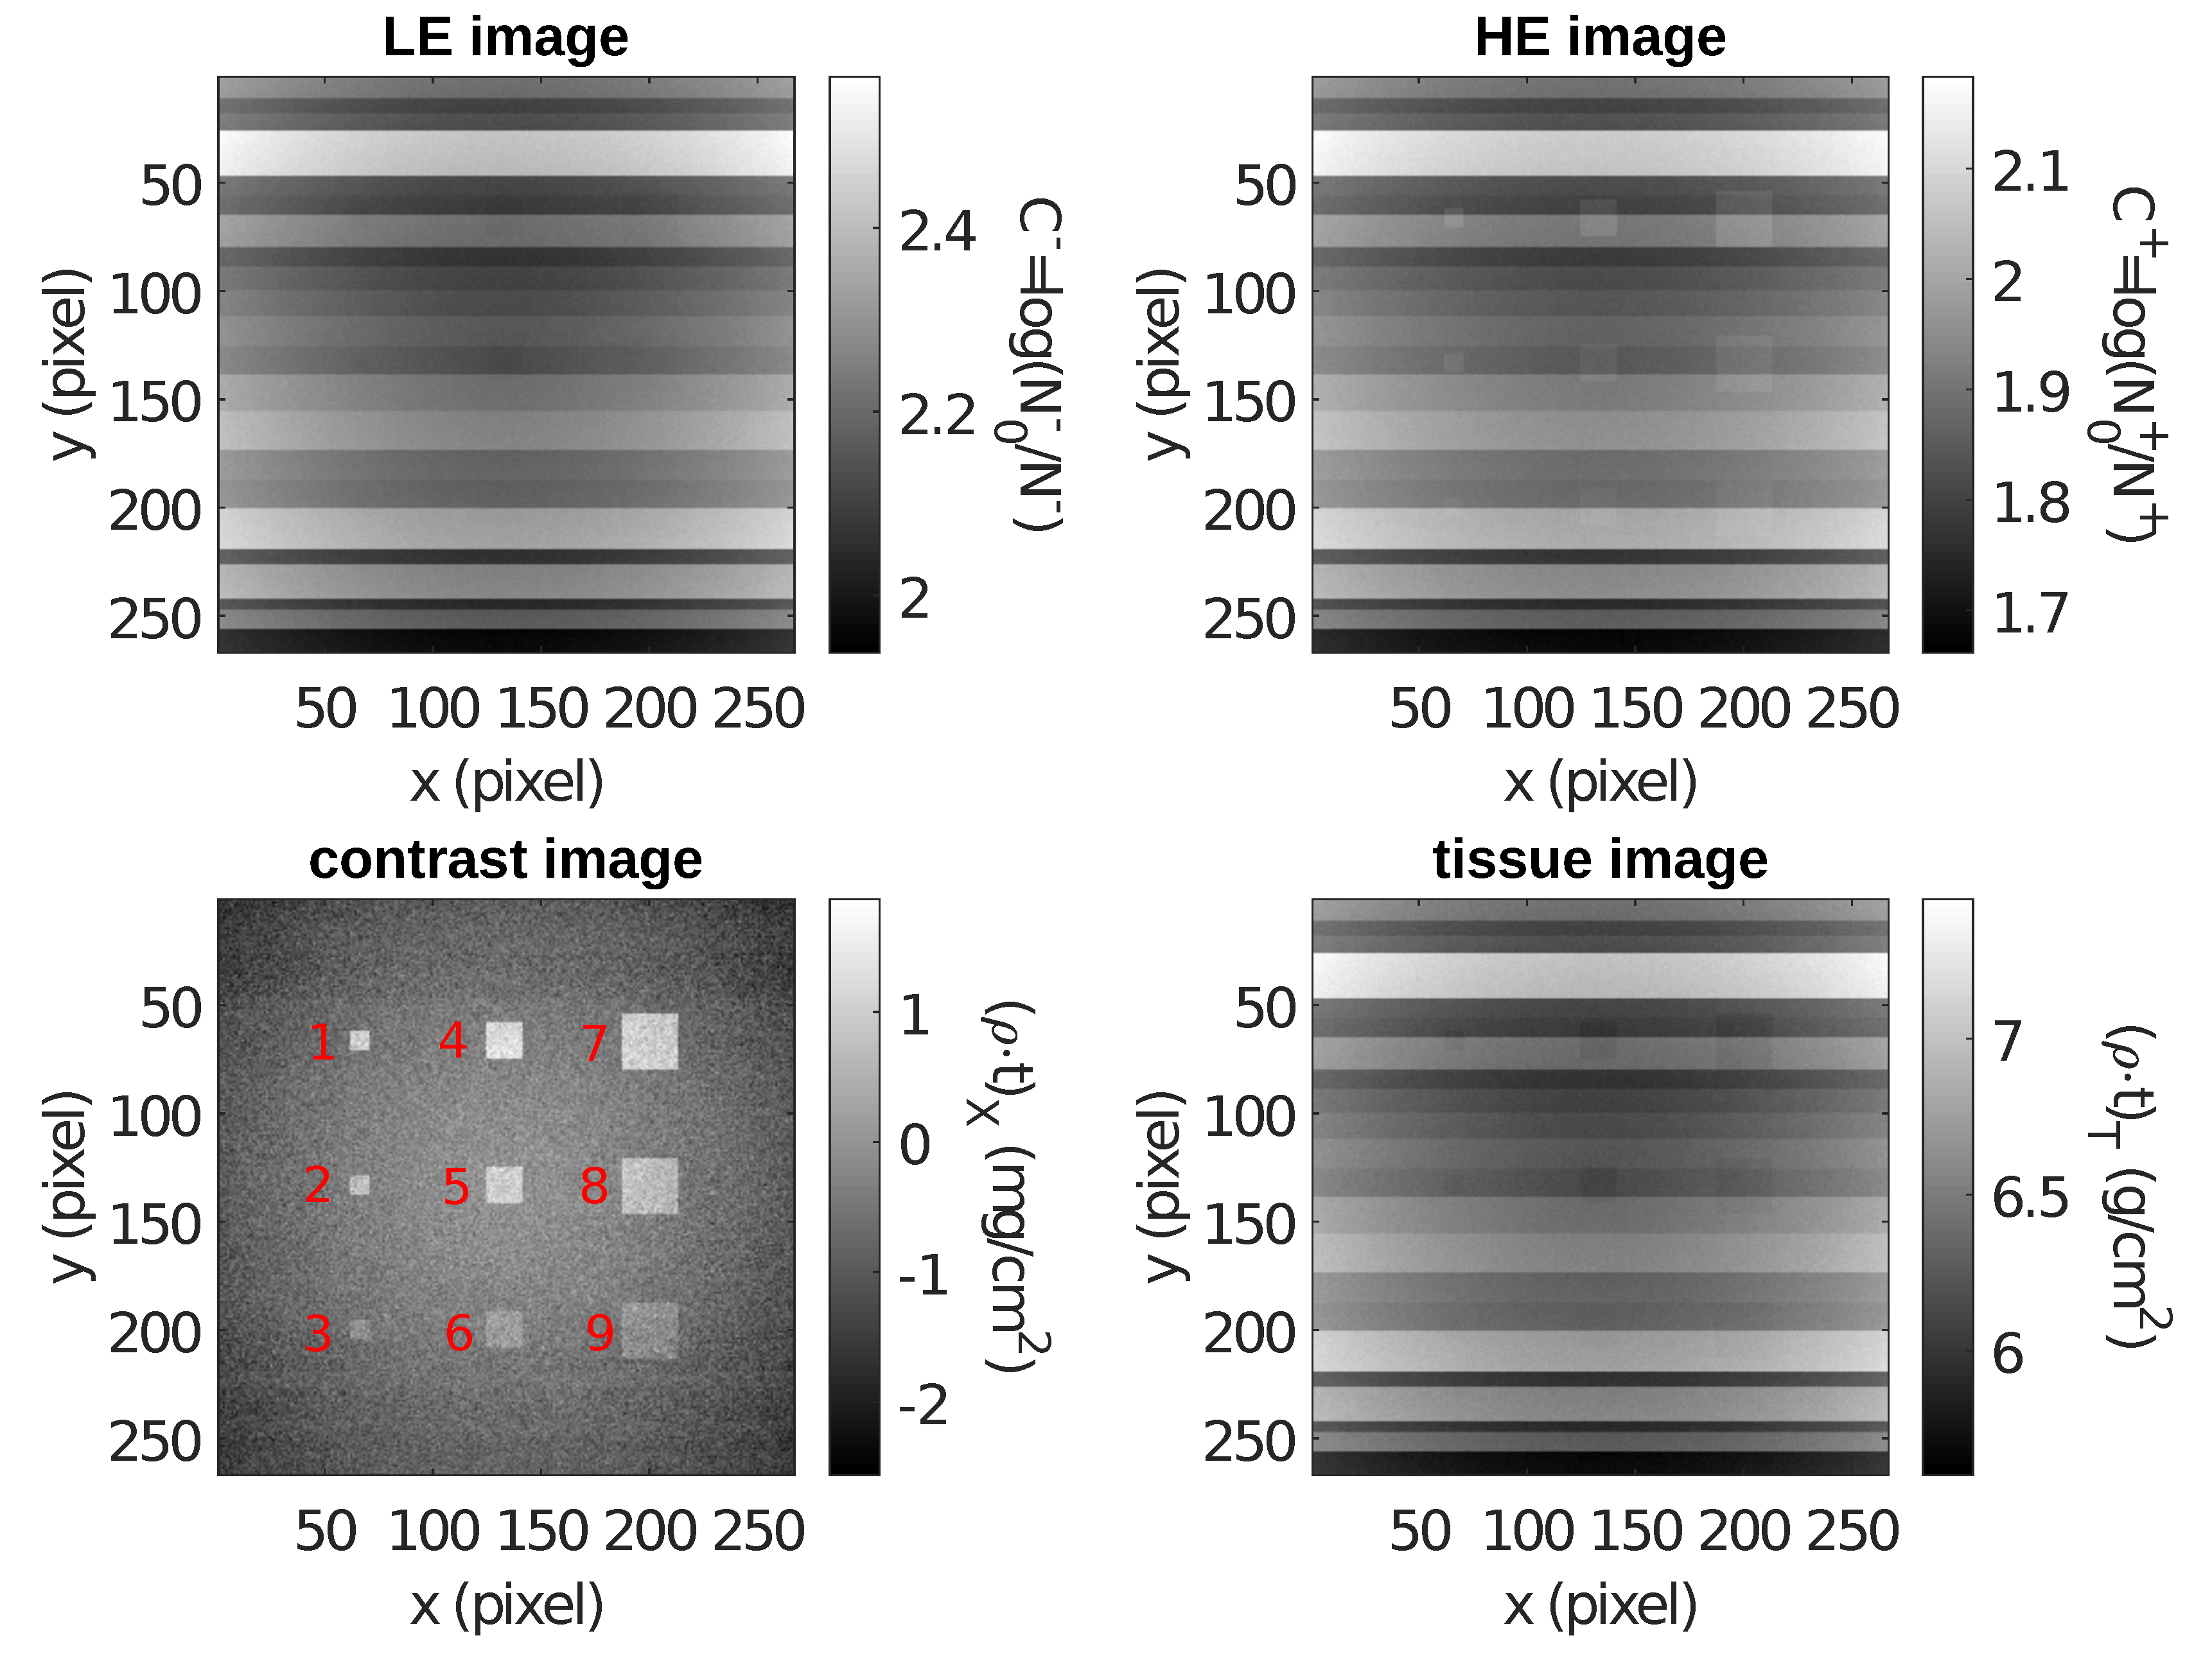
5.1. Contrast-Enhanced Dual-Energy Mammography (CEDEM)
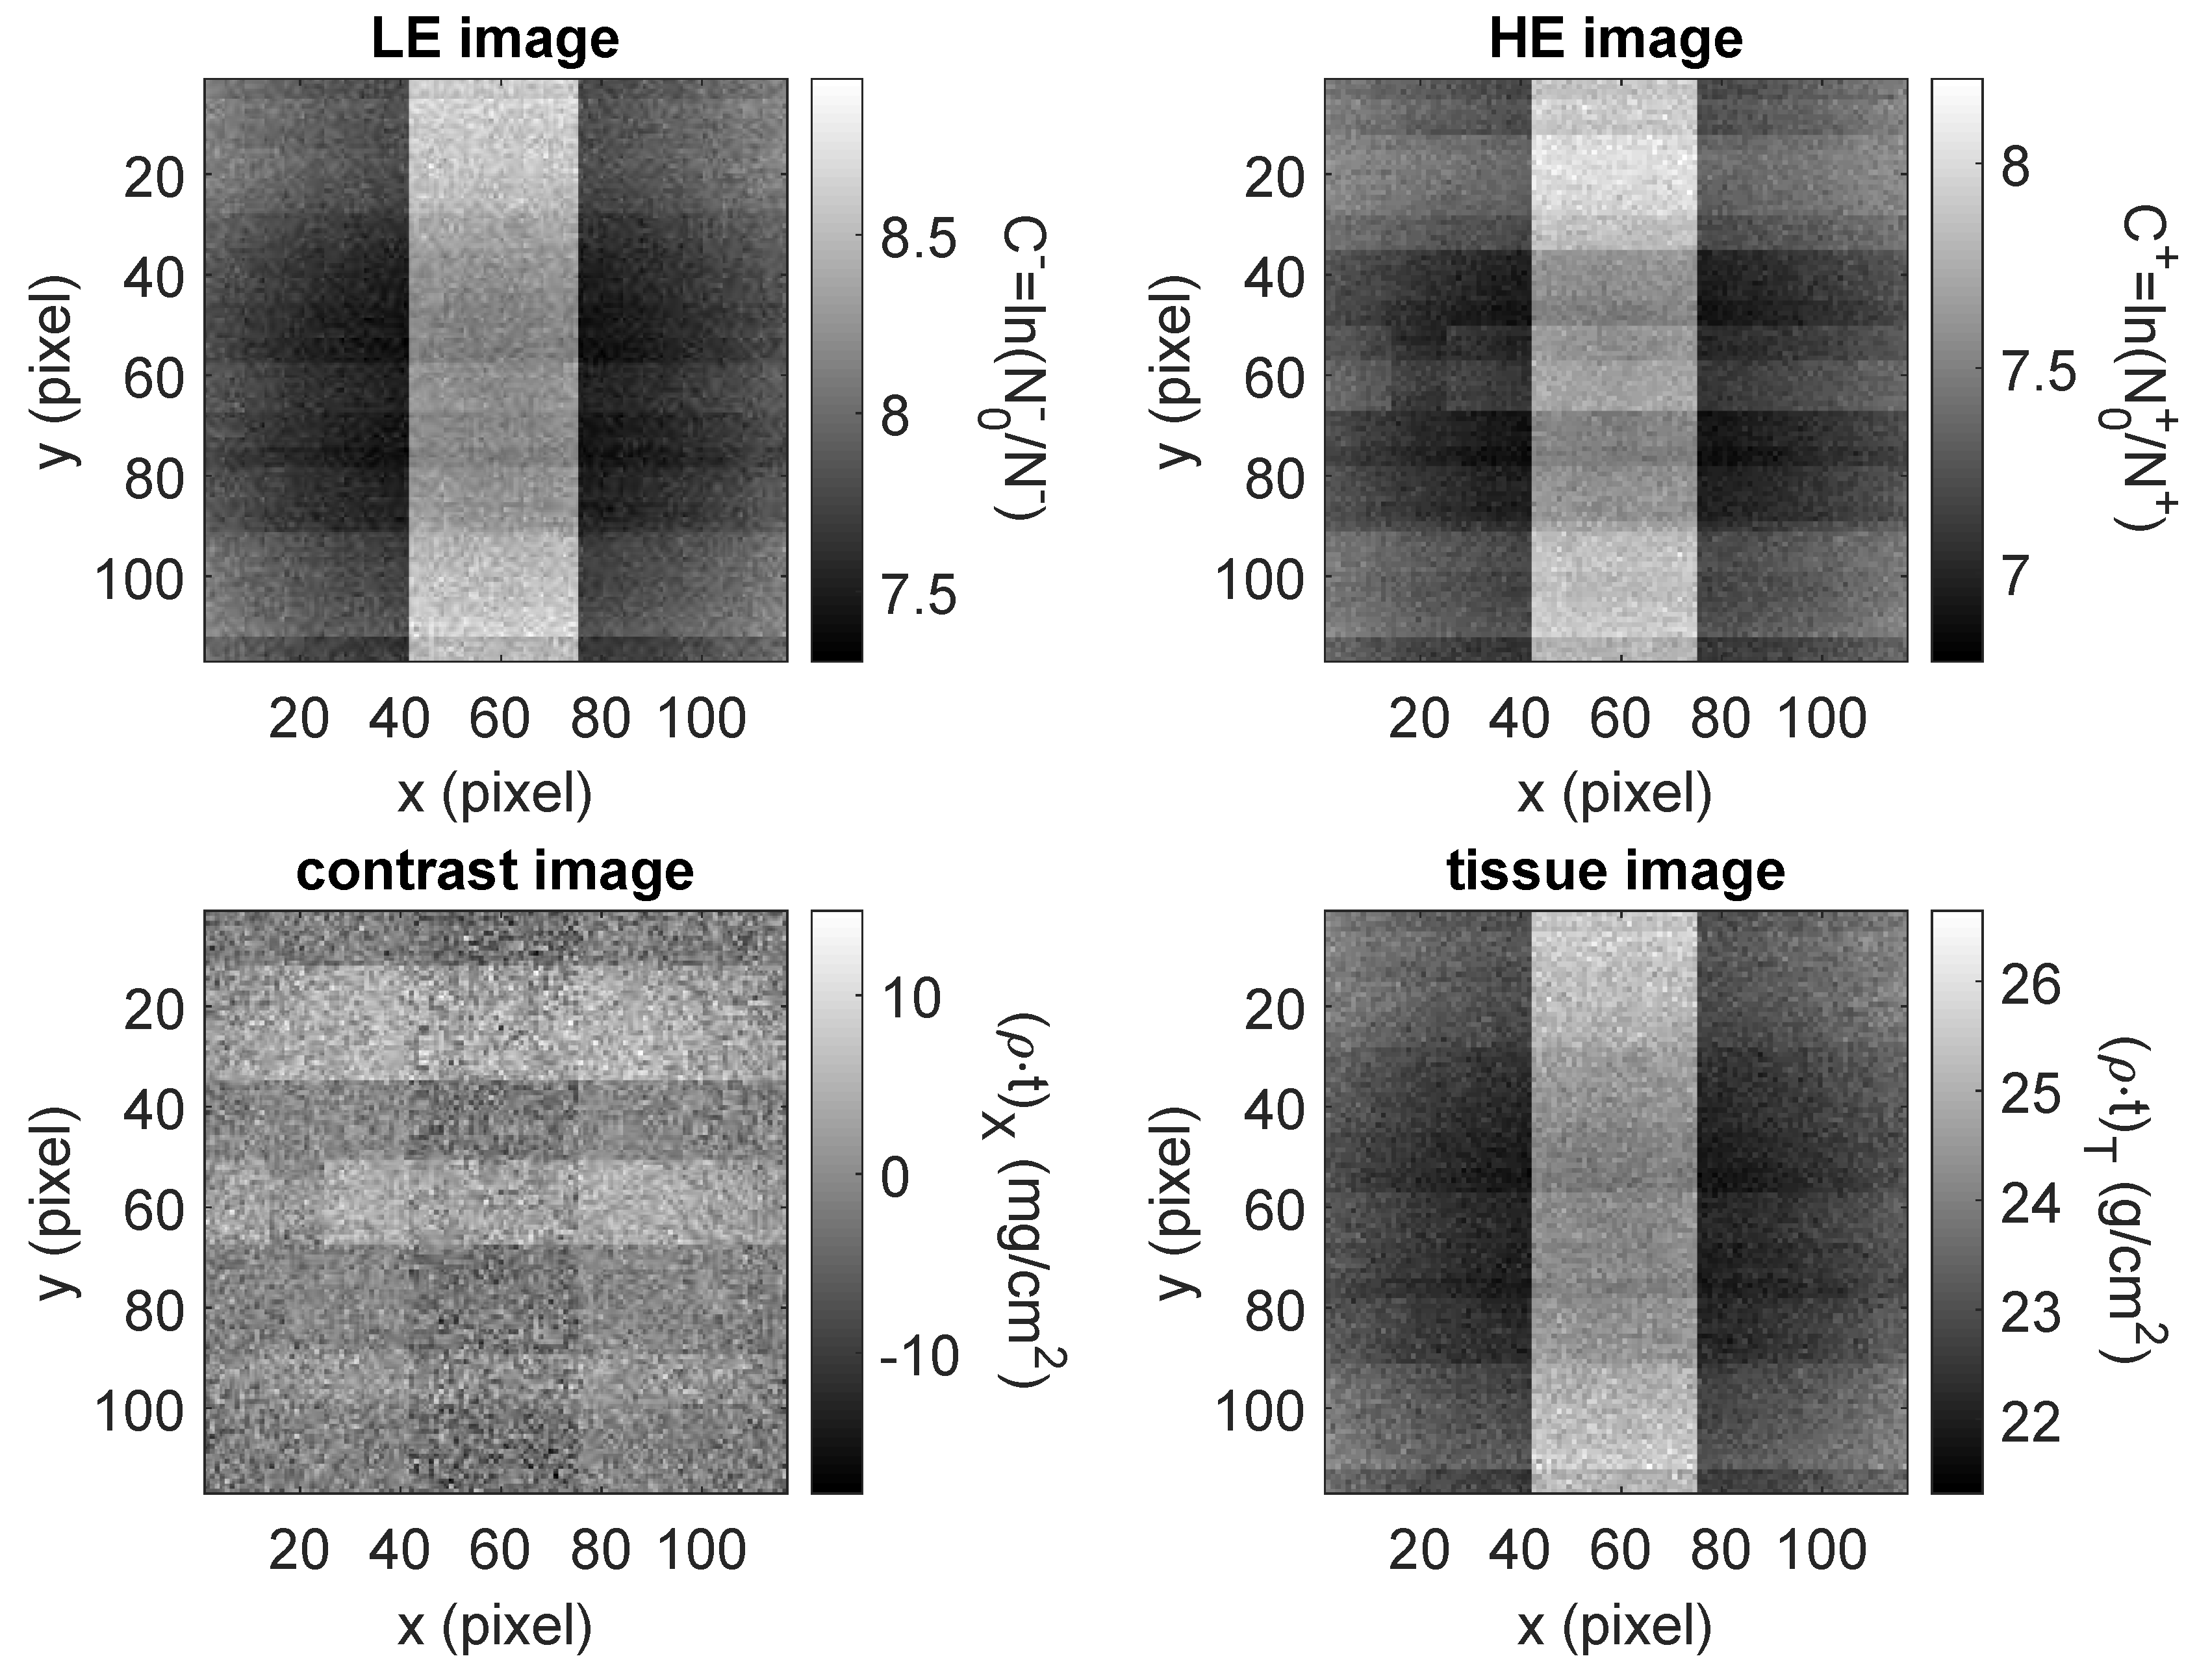
5.2. Coronary Angiography
6. Discussion and Conclusions
Author Contributions
Funding
Acknowledgments
Conflicts of Interest
Abbreviations
| ICS | Inverse Compton Scattering |
| KES | K-Edge Subtraction |
| IP | Interaction Point |
| BW | Bandwidth |
| RMS | Root Mean Square |
| CEDEM | Contrast Enhanced Dual Energy Mammography |
| SNR | Signal to Noise Ratio |
| ROI | Region Of Interest |
References
- Alvarez, R.E.; Macovski, A. Energy-selective reconstructions in X-ray computerised tomography. Phys. Med. Biol. 1976, 21, 733. [Google Scholar] [CrossRef] [PubMed]
- McCollough, C.H.; Leng, S.; Yu, L.; Fletcher, J.G. Dual- and Multi-Energy CT: Principles, Technical Approaches, and Clinical Applications. Radiology 2015, 276, 637–653. [Google Scholar] [CrossRef] [PubMed]
- Blake, G.M.; Fogelman, I. An update on dual-energy X-ray absorptiometry. In Seminars in Nuclear Medicine; Elsevier: Amsterdam, The Netherlands, 2010; Volume 40, pp. 62–73. [Google Scholar]
- Vock, P.; Szucs-Farkas, Z. Dual energy subtraction: Principles and clinical applications. Eur. J. Radiol. 2009, 72, 231–237. [Google Scholar] [CrossRef]
- Jacobson, B. Dichromatic absorption radiography. Dichromography. Acta Radiol. 1953, 6, 437–452. [Google Scholar]
- Thomlinson, W.; Elleaume, H.; Porra, L.; Suortti, P. K-edge subtraction synchrotron X-ray imaging in bio-medical research. Phys. Med. 2018, 49, 58–76. [Google Scholar] [CrossRef]
- Mistretta, C.; Ort, M.; Kelcz, F.; Cameron, J.; Siedband, M.; Crummy, A. Absorption edge fluoroscopy using quasi-monoenergetic X-ray beams. Investig. Radiol. 1973, 8, 402–412. [Google Scholar]
- Rutt, B.K.; Cunningham, I.A.; Fenster, A. Selective iodine imaging using lanthanum K fluorescence. Med. Phys. 1983, 10, 801–808. [Google Scholar] [CrossRef]
- Sarnelli, A.; Taibi, A.; Tuffanelli, A.; Baldazzi, G.; Bollini, D.; Rodriguez, A.C.; Gombia, M.; Prino, F.; Ramello, L.; Tomassi, E.; et al. K-edge digital subtraction imaging based on a dichromatic and compact X-ray source. Phys. Med. Biol. 2004, 49, 3291. [Google Scholar] [CrossRef]
- Willemink, M.J.; Persson, M.; Pourmorteza, A.; Pelc, N.J.; Fleischmann, D. Photon-counting CT: Technical principles and clinical prospects. Radiology 2018, 289, 293–312. [Google Scholar] [CrossRef]
- Riederer, I.; Si-Mohamed, S.; Ehn, S.; Bar-Ness, D.; Noël, P.B.; Fingerle, A.A.; Pfeiffer, F.; Rummeny, E.J.; Douek, P.; Pfeiffer, D. Differentiation between blood and iodine in a bovine brain—Initial experience with Spectral Photon-Counting Computed Tomography (SPCCT). PLoS ONE 2019, 14, e0212679. [Google Scholar] [CrossRef]
- Skarpathiotakis, M.; Yaffe, M.J.; Bloomquist, A.K.; Rico, D.; Muller, S.; Rick, A.; Jeunehomme, F. Development of contrast digital mammography. Med. Phys. 2002, 29, 2419–2426. [Google Scholar] [CrossRef] [PubMed]
- Contillo, A.; Di Domenico, G.; Cardarelli, P.; Gambaccini, M.; Taibi, A. A novel approach to background subtraction in contrast-enhanced dual-energy digital mammography with commercially available mammography devices: Polychromaticity correction. Med. Phys. 2015, 42, 6641–6650. [Google Scholar] [CrossRef] [PubMed]
- Tavakol, M.; Ashraf, S.; Brener, S.J. Risks and complications of coronary angiography: A comprehensive review. Glob. J. Health Sci. 2012, 4, 65. [Google Scholar] [CrossRef]
- Lehmann, L.; Alvarez, R.; Macovski, A.; Brody, W.; Pelc, N.; Riederer, S.J.; Hall, A. Generalized image combinations in dual KVP digital radiography. Med. Phys. 1981, 8, 659–667. [Google Scholar] [CrossRef] [PubMed]
- Sarnelli, A.; Elleaume, H.; Taibi, A.; Gambaccini, M.; Bravin, A. K-edge digital subtraction imaging with dichromatic X-ray sources: SNR and dose studies. Phys. Med. Biol. 2006, 51, 4311. [Google Scholar] [CrossRef]
- Esarey, E.; Ride, S.K.; Sprangle, P. Nonlinear Thomson scattering of intense laser pulses from beams and plasmas. Phys. Rev. E 1993, 48, 3003. [Google Scholar] [CrossRef]
- Brown, W.J.; Hartemann, F.V. Three-dimensional time and frequency-domain theory of femtosecond X-ray pulse generation through Thomson scattering. Phys. Rev. Accel. Beams 2004, 7, 060703. [Google Scholar] [CrossRef]
- Sun, C.; Wu, Y.K. Theoretical and simulation studies of characteristics of a Compton light source. Phys. Rev. Accel. Beams 2011, 14, 044701. [Google Scholar] [CrossRef]
- Petrillo, V.; Bacci, A.; Zinati, R.B.A.; Chaikovska, I.; Curatolo, C.; Ferrario, M.; Maroli, C.; Ronsivalle, C.; Rossi, A.; Serafini, L.; et al. Photon flux and spectrum of γ-rays Compton sources. Nucl. Instrum. Methods A 2012, 693, 109–116. [Google Scholar] [CrossRef]
- Krafft, G.; Johnson, E.; Deitrick, K.; Terzić, B.; Kelmar, R.; Hodges, T.; Melnitchouk, W.; Delayen, J. Laser pulsing in linear Compton scattering. Phys. Rev. Accel. Beams 2016, 19, 121302. [Google Scholar] [CrossRef]
- Paternò, G.; Cardarelli, P.; Marziani, M.; Bagli, E.; Evangelisti, F.; Andreotti, M.; Gambaccini, M.; Petrillo, V.; Drebot, I.; Bacci, A.; et al. A collimation system for ELI-NP Gamma Beam System–design and simulation of performance. Nucl. Instrum. Methods B 2017, 402, 349–353. [Google Scholar] [CrossRef][Green Version]
- Krafft, G.A.; Priebe, G. Compton sources of electromagnetic radiation. In Reviews of Accelerator Science and Technology: Volume 3: Accelerators as Photon Sources; World Scientific: Singapore, 2010; pp. 147–163. [Google Scholar]
- Yokoya, K. User Manual of CAIN; Version 2.42; 2011. Available online: https://ilc.kek.jp/~yokoya/CAIN/ (accessed on 18 September 2020).
- Chen, P.; Horton-Smith, G.; Ohgaki, T.; Weidemann, A.; Yokoya, K. CAIN: Conglomérat d’ABEL et d’Interactions Non-linéaires. Nucl. Instrum. Methods A 1995, 355, 107–110. [Google Scholar] [CrossRef]
- Drebot, I.; Bacci, A.; Bosotti, A.; Broggi, F.; Canella, F.; Cardarelli, P.; Cialdi, S.; Faillace, L.; Galzerano, G.; Gambaccini, M.; et al. BriXs Ultra High Flux Inverse Compton Source Based on Modified Push-Pull Energy Recovery Linacs. Instruments 2019, 3, 49. [Google Scholar] [CrossRef]
- Jacquet, M. Potential of compact Compton sources in the medical field. Phys. Med. 2016, 32, 1790–1794. [Google Scholar] [CrossRef] [PubMed]
- Labate, L.; Tomassini, P.; Gizzi, L.A. Inverse Compton Scattering X-ray Sources. In Handbook of X-ray Imaging: Physics and Technology; CRC Press: Boca Raton, FL, USA, 2017; pp. 309–323. [Google Scholar]
- Faillace, L.; Agostino, R.; Bacci, A.; Barberi, R.; Bosotti, A.; Broggi, F.; Cardarelli, P.; Cialdi, S.; Drebot, I.; Formoso, V.; et al. Status of compact inverse Compton sources in Italy: BriXS and STAR. In Advances in Laboratory-Based X-ray Sources, Optics, and Applications VII; SPIE International Society for Optics and Photonics: Bellingham, WA, USA, 2019; Volume 11110, p. 1111005. [Google Scholar]
- Bacci, A.; Puppin, E.; Agostino, R.; Alesini, D.; Gatti, G.; Petrillo, V.; Borgese, G.; Anania, M.P.; Palmer, D.; Fabris, A.; et al. The STAR project. In Proceedings of the 5th International Particle Accelerator Conference (IPAC 2014), Dresden, Germany, 15–20 June 2014. [Google Scholar]
- Variola, A. The ThomX Project. In Proceedings of the 2nd International Particle Accelerator Conference (IPAC’11), San Sebastian, Spain, 4–9 September 2011; Joint Accelerator Conferences Website. 2011; Volume WEOAA01, pp. 1903–1905. [Google Scholar]
- Eggl, E.; Dierolf, M.; Achterhold, K.; Jud, C.; Günther, B.; Braig, E.; Gleich, B.; Pfeiffer, F. The Munich compact light source: Initial performance measures. J. Synchrotron Radiat. 2016, 23, 1137–1142. [Google Scholar] [CrossRef] [PubMed]
- Günther, B.; Gradl, R.; Jud, C.; Eggl, E.; Huang, J.; Kulpe, S.; Achterhold, K.; Gleich, B.; Dierolf, M.; Pfeiffer, F. The versatile X-ray beamline of the Munich Compact Light Source: Design, instrumentation and applications. J. Synchrotron Radiat. 2020, 27, 1395–1414. [Google Scholar] [CrossRef]
- Serafini, L.; Bacci, A.; Bellandi, A.; Bertucci, M.; Bolognesi, M.; Bosotti, A.; Broggi, F.; Calandrino, R.; Camera, F.; Canella, F.; et al. MariX, an advanced MHz-class repetition rate X-ray source for linear regime time-resolved spectroscopy and photon scattering. Nucl. Instrum. Methods A 2019, 930, 167–172. [Google Scholar] [CrossRef]
- Cardarelli, P.; Bacci, A.; Calandrino, R.; Canella, F.; Castriconi, R.; Cialdi, S.; Del Vecchio, A.; di Franco, F.; Drebot, I.; Gambaccini, M.; et al. BriXS, a new X-ray inverse Compton source for medical applications. Phys. Med. 2020, 77, 127–137. [Google Scholar] [CrossRef]
- Variola, A.; Haissinski, J.; Loulergue, A.; Zomer, F. THOMX Technical Design Report; 2014. Available online: http://hal.in2p3.fr/in2p3-00971281 (accessed on 18 September 2020).
- Kulpe, S.; Dierolf, M.; Braig, E.; Günther, B.; Achterhold, K.; Gleich, B.; Herzen, J.; Rummeny, E.; Pfeiffer, F.; Pfeiffer, D. K-edge subtraction imaging for coronary angiography with a compact synchrotron X-ray source. PLoS ONE 2018, 13, e0208446. [Google Scholar] [CrossRef]
- Kulpe, S.; Dierolf, M.; Braig, E.M.; Günther, B.; Achterhold, K.; Gleich, B.; Herzen, J.; Rummeny, E.J.; Pfeiffer, F.; Pfeiffer, D. K-edge subtraction imaging for iodine and calcium separation at a compact synchrotron X-ray source. J. Med. Imaging 2020, 7, 023504. [Google Scholar] [CrossRef]
- Drebot, I.; Petrillo, V.; Serafini, L. Two-colour X-gamma ray inverse Compton back-scattering source. EPL 2017, 120, 14002. [Google Scholar] [CrossRef][Green Version]
- Drebot, I.; Calandrino, R.; Cardarelli, P.; Cialdi, S.; Galzerano, G.; Gambaccini, M.; Giannotti, D.; Paternò, G.; Petrillo, V.; Serafini, L.; et al. Multi Colour X-Gamma Ray Inverse Compton Back-Scattering Source. In Proceedings of the 9th International Particle Accelerator Conference (IPAC’18), Vancouver, BC, Canada, 29 April–4 May 2018; JACOW Publishing: Geneva, Switzerland, 2018. [Google Scholar]
- Vaccarezza, C.; Alesini, D.; Anania, M.P.; Bacci, A.; Biagioni, A.; Bisesto, F.; Bellaveglia, M.; Cardarelli, P.; Cardelli, F.; Cianchi, A.; et al. The SPARC_LAB Thomson source. Nucl. Instrum. Methods A 2016, 829, 237–242. [Google Scholar] [CrossRef]
- Priebe, G.; Laundy, D.; Phillips, P.; Graham, D.; Jamison, S.; Vassilev, S.; Seddon, E.; Rosenzweig, J.; Krafft, G.; Heinzl, T.; et al. First results from the Daresbury Compton backscattering X-ray source (COBALD). In Hard X-ray, Gamma-Ray, and Neutron Detector Physics XII; SPIE International Society for Optics and Photonics: Bellingham, WA, USA, 2010; Volume 7805, p. 780513. [Google Scholar]
- Tang, C.; Huang, W.; Li, R.; Du, Y.; Yan, L.; Shi, J.; Du, Q.; Yu, P.; Chen, H.; Du, T.; et al. Tsinghua Thomson scattering X-ray source. Nucl. Instrum. Methods A 2009, 608, S70–S74. [Google Scholar] [CrossRef]
- Yamada, K.; Kuroda, R.; Toyakawa, H.; Ikeura-Sekiguchi, H.; Yasumoto, M.; Koike, M.; Sakai, F.; Mori, K.; Mori, H.; Fukuyama, N.; et al. A trial for fine and low-dose imaging of biological specimens using quasi-monochromatic laser-Compton X-rays. Nucl. Instrum. Methods A 2009, 608, S7–S10. [Google Scholar] [CrossRef]
- Carroll, F. Tunable, monochromatic X-rays: An enabling technology for molecular/cellular imaging and therapy. J. Cell. Biochem. 2003, 90, 502–508. [Google Scholar] [CrossRef]
- Kuroda, R. Inverse Compton Scattering Sources. In Comprehensive BioMedical Physics; Brahme, A., Ed.; Elsevier: Amsterdam, The Netherlands, 2014. [Google Scholar]
- Eggl, E.; Mechlem, K.; Braig, E.; Kulpe, S.; Dierolf, M.; Günther, B.; Achterhold, K.; Herzen, J.; Gleich, B.; Rummeny, E.; et al. Mono-energy coronary angiography with a compact synchrotron source. Sci. Rep. 2017, 7, 42211. [Google Scholar] [CrossRef]
- MATLAB. Version 8.6 (R2015b); The MathWorks Inc.: Natick, MA, USA, 2015. [Google Scholar]
- ICRU. Photon, Electron, Proton and Neutron Interaction Data for Body Tissues; Report 46 of the International Commission on Radiation Units and Measurements; ICRU: Bethesda, MD, USA, 1992. [Google Scholar]
- Nowotny, R. XMuDat: Photon Attenuation Data on PC; 1998. Available online: https://www-nds.iaea.org/publications/iaea-nds/iaea-nds-0195.htm (accessed on 18 September 2020).
- Boone, J.M.; Chavez, A.E. Comparison of X-ray cross sections for diagnostic and therapeutic medical physics. Med. Phys. 1996, 23, 1997–2005. [Google Scholar] [CrossRef]
- Curatolo, C.; Drebot, I.; Petrillo, V.; Serafini, L. Analytical description of photon beam phase spaces in inverse Compton scattering sources. Phys. Rev. Accel. Beams 2017, 20, 080701. [Google Scholar] [CrossRef]
- Prino, F.; Ceballos, C.; Cabal, A.; Sarnelli, A.; Gambaccini, M.; Ramello, L. Effect of X-ray energy dispersion in digital subtraction imaging at the iodine-edge—A Monte Carlo study. Med. Phys. 2008, 35, 13–24. [Google Scholar] [CrossRef]
- Paternò, G.; Cardarelli, P.; Gambaccini, M.; Serafini, L.; Petrillo, V.; Drebot, I.; Taibi, A. Inverse Compton radiation: A novel X-ray source for K-edge subtraction angiography? Phys. Med. Biol. 2019, 64, 185002. [Google Scholar] [CrossRef]
- Boone, J.M. Normalized glandular dose (DgN) coefficients for arbitrary X-ray spectra in mammography: Computer-fit values of Monte Carlo derived data. Med. Phys. 2002, 29, 869–875. [Google Scholar] [CrossRef] [PubMed]
- Sun, C.; Li, J.; Rusev, G.; Tonchev, A.; Wu, Y. Energy and energy spread measurements of an electron beam by Compton scattering method. Phys. Rev. Spec. Top. Accel. Beams 2009, 12, 062801. [Google Scholar] [CrossRef]
- Ranjan, N.; Terzić, B.; Krafft, G.; Petrillo, V.; Drebot, I.; Serafini, L. Simulation of inverse Compton scattering and its implications on the scattered linewidth. Phys. Rev. Accel. Beams 2018, 21, 030701. [Google Scholar] [CrossRef]
- Heck, L.; Dierolf, M.; Jud, C.; Eggl, E.; Sellerer, T.; Mechlem, K.; Günther, B.; Achterhold, K.; Gleich, B.; Metz, S.; et al. Contrast-enhanced spectral mammography with a compact synchrotron source. PLoS ONE 2019, 14, e0222816. [Google Scholar] [CrossRef]
- Sarnelli, A.; Nemoz, C.; Elleaume, H.; Estève, F.; Bertrand, B.; Bravin, A. Quantitative analysis of synchrotron radiation intravenous angiographic images. Phys. Med. Biol. 2005, 50, 725. [Google Scholar] [CrossRef]
- Jong, R.A.; Yaffe, M.J.; Skarpathiotakis, M.; Shumak, R.S.; Danjoux, N.M.; Gunesekara, A.; Plewes, D.B. Contrast-enhanced digital mammography: Initial clinical experience. Radiology 2003, 228, 842–850. [Google Scholar] [CrossRef]
- Sarnelli, A.; Taibi, A.; Baldelli, P.; Gambaccini, M.; Bravin, A. Quantitative analysis of the effect of energy separation in k-edge digital subtraction imaging. Phys. Med. Biol. 2007, 52, 3015. [Google Scholar] [CrossRef]
- Spinosa, D.; Matsumoto, A.; Hagspiel, K.; Angle, J.; Hartwell, G. Gadolinium-based contrast agents in angiography and interventional radiology. AJR Am. J. Roentgenol. 1999, 173, 1403–1409. [Google Scholar] [CrossRef]
- SamI, A.D., II; Morasch, M.D.; Collins, J.; Song, G.; Chen, R.; Pereles, F.S. Safety of gadolinium contrast angiography in patients with chronic renal insufficiency. J. Vasc. Surg. 2003, 38, 313–318. [Google Scholar] [CrossRef]
- Sayin, T.; Turhan, S.; Akyürek, Ö.; Kilickap, M. Gadolinium: Nonionic contrast media (1:1) coronary angiography in patients with impaired renal function. Angiology 2007, 58, 561–564. [Google Scholar] [CrossRef]


| Source | Energy | Bandwidth | Intensity (ph/s) | Brilliance (ph smmmrad (0.1%BW)) |
|---|---|---|---|---|
| MuCLS [33] | 15–35 keV | 3–5% | (1.5–4.5) | 1.2 |
| ThomX [36] | 45–90 keV | 1–10% | (10% BW) | |
| STAR [30] | 20–100 keV | 1–10% | (10% BW) | |
| BriXS [35] | 20–180 keV | 1–10% | – | – |
| Phantom | ||||||
|---|---|---|---|---|---|---|
| (cm × cm) | (cm) | (cm) | (cm × cm) | (cm) | (cm × cm) | |
| mammography (CEDEM) | 8.0 × 8.0 | 5.0 ± 0.1 | 0.25, 0.5, 0.75 | 0.25, 0.5, 0.75 | - | - |
| coronary angiography | 3.5 × 3.5 | 20.0 ± 0.2 | 0.3, 0.5, 0.7 | 1.0 |
| Case | Beam | BW (RMS) | |||||||
|---|---|---|---|---|---|---|---|---|---|
| (keV) | (keV) | (keV) | (%) | (%) | (%) | ||||
| mammography (CEDEM) | LE | 0.8012 | 0.012 | 32.0 | 31.4 | 34.1 | 3.00 | 70.5 | 99.9 |
| mammography (CEDEM) | HE | 0.9212 | 0.012 | 36.0 | 35.3 | 38.1 | 3.05 | 70.3 | 4.6 |
| coronary angiography | LE | 0.8162 | 0.012 | 32.5 | 31.9 | 34.5 | 3.00 | 71.0 | 97.4 |
| coronary angiography | HE | 0.8762 | 0.012 | 34.5 | 33.9 | 36.7 | 3.04 | 71.0 | 20.1 |
| ROI | n | m | S | ||||
|---|---|---|---|---|---|---|---|
| (mg/cm) | (mg/cm) | (mg/cm) | (mg/cm) | (mg/cm) | |||
| 1 | 81 | 1.001 | −0.580 | 0.029 | 1.58 | 1.50 | 55 |
| 2 | 81 | 0.719 | −0.351 | 0.029 | 1.07 | 1.00 | 37 |
| 3 | 81 | −0.052 | −0.594 | 0.029 | 0.54 | 0.50 | 19 |
| 4 | 289 | 1.235 | −0.374 | 0.016 | 1.61 | 1.50 | 103 |
| 5 | 289 | 1.000 | −0.079 | 0.016 | 1.08 | 1.00 | 69 |
| 6 | 289 | 0.157 | −0.375 | 0.016 | 0.53 | 0.50 | 34 |
| 7 | 676 | 0.985 | −0.631 | 0.010 | 1.62 | 1.50 | 158 |
| 8 | 676 | 0.682 | −0.397 | 0.010 | 1.08 | 1.00 | 106 |
| 9 | 676 | −0.094 | −0.631 | 0.010 | 0.54 | 0.50 | 53 |
| ROI | n | m | S | ||||
|---|---|---|---|---|---|---|---|
| (mg/cm) | (mg/cm) | (mg/cm) | (mg/cm) | (mg/cm) | |||
| top vessel | 144 | 4.92 | −0.603 | 0.163 | 5.53 | 7.00 | 34 |
| top vessel (bone) | 144 | 3.54 | −2.46 | 0.228 | 6.00 | 7.00 | 26 |
| central vessel | 64 | 4.04 | −0.624 | 0.239 | 4.66 | 5.00 | 20 |
| central vessel (bone) | 64 | 2.21 | −2.47 | 0.324 | 4.68 | 5.00 | 14 |
| bottom vessel | 16 | 1.90 | −0.644 | 0.507 | 2.55 | 3.00 | 5.0 |
| bottom vessel (bone) | 16 | 0.051 | −2.74 | 0.869 | 2.79 | 3.00 | 3.2 |
© 2020 by the authors. Licensee MDPI, Basel, Switzerland. This article is an open access article distributed under the terms and conditions of the Creative Commons Attribution (CC BY) license (http://creativecommons.org/licenses/by/4.0/).
Share and Cite
Paternò, G.; Cardarelli, P.; Gambaccini, M.; Taibi, A. Dual-Energy X-ray Medical Imaging with Inverse Compton Sources: A Simulation Study. Crystals 2020, 10, 834. https://doi.org/10.3390/cryst10090834
Paternò G, Cardarelli P, Gambaccini M, Taibi A. Dual-Energy X-ray Medical Imaging with Inverse Compton Sources: A Simulation Study. Crystals. 2020; 10(9):834. https://doi.org/10.3390/cryst10090834
Chicago/Turabian StylePaternò, Gianfranco, Paolo Cardarelli, Mauro Gambaccini, and Angelo Taibi. 2020. "Dual-Energy X-ray Medical Imaging with Inverse Compton Sources: A Simulation Study" Crystals 10, no. 9: 834. https://doi.org/10.3390/cryst10090834
APA StylePaternò, G., Cardarelli, P., Gambaccini, M., & Taibi, A. (2020). Dual-Energy X-ray Medical Imaging with Inverse Compton Sources: A Simulation Study. Crystals, 10(9), 834. https://doi.org/10.3390/cryst10090834